Zip Codes with the Highest Percentage of Population Employed in Accommodation & Food Services in Warren, OH
RELATED REPORTS & OPTIONS
Accommodation & Food Services
Warren
Compare Zip Codes
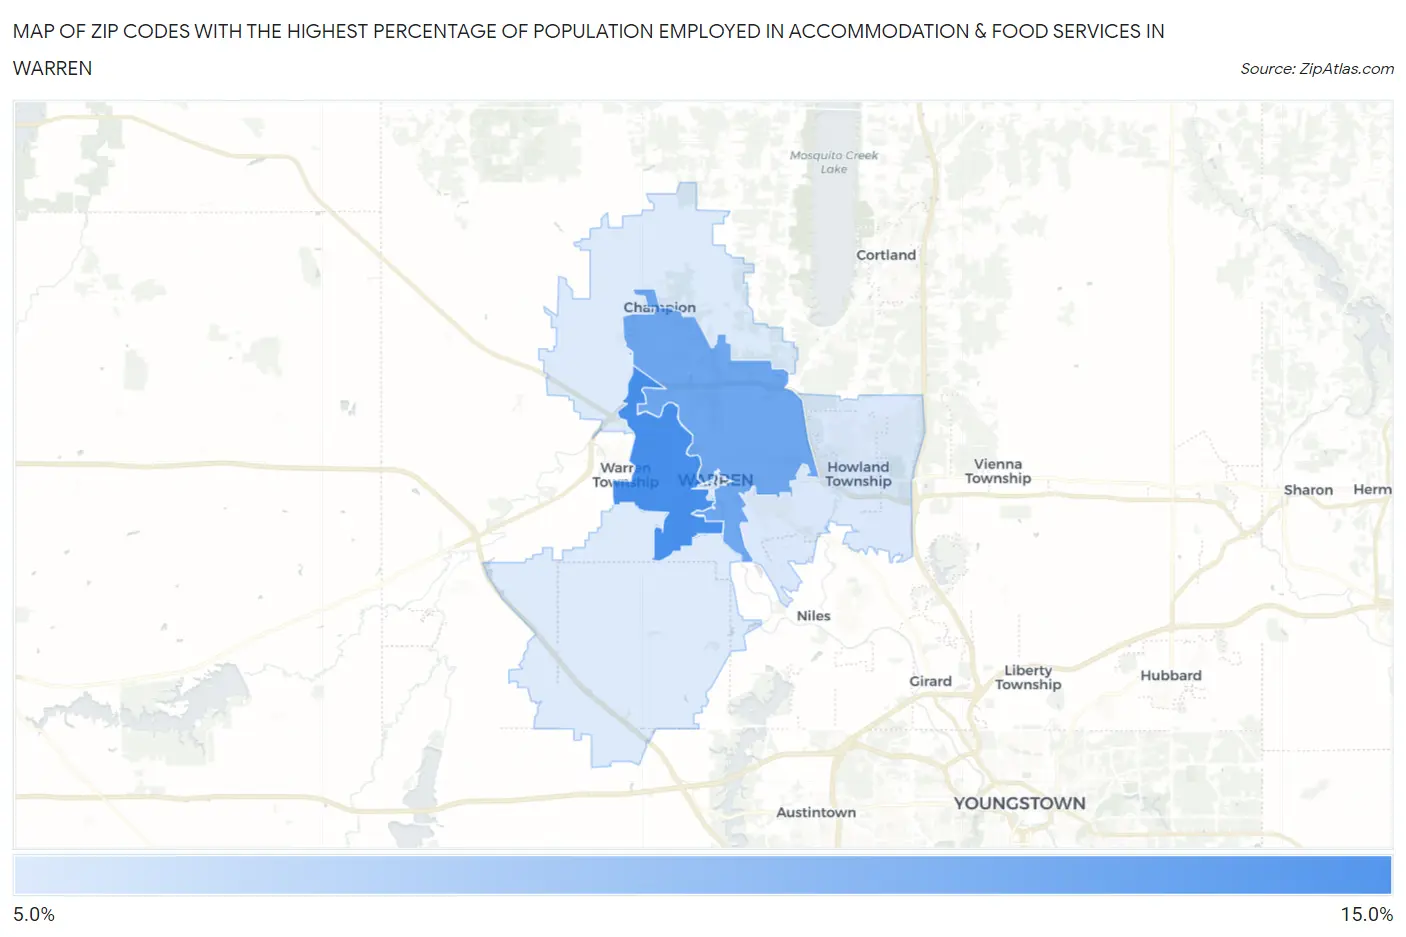
Map of Zip Codes with the Highest Percentage of Population Employed in Accommodation & Food Services in Warren
5.2%
11.7%
Zip Codes with the Highest Percentage of Population Employed in Accommodation & Food Services in Warren, OH
| Zip Code | % Employed | vs State | vs National | |
| 1. | 44485 | 11.7% | 7.0%(+4.70)#115 | 6.9%(+4.83)#3,009 |
| 2. | 44483 | 10.0% | 7.0%(+2.95)#200 | 6.9%(+3.08)#4,592 |
| 3. | 44484 | 5.2% | 7.0%(-1.78)#701 | 6.9%(-1.65)#16,008 |
| 4. | 44481 | 5.2% | 7.0%(-1.84)#711 | 6.9%(-1.71)#16,212 |
1
Common Questions
What are the Top 3 Zip Codes with the Highest Percentage of Population Employed in Accommodation & Food Services in Warren, OH?
Top 3 Zip Codes with the Highest Percentage of Population Employed in Accommodation & Food Services in Warren, OH are:
What zip code has the Highest Percentage of Population Employed in Accommodation & Food Services in Warren, OH?
44485 has the Highest Percentage of Population Employed in Accommodation & Food Services in Warren, OH with 11.7%.
What is the Percentage of Population Employed in Accommodation & Food Services in Warren, OH?
Percentage of Population Employed in Accommodation & Food Services in Warren is 11.5%.
What is the Percentage of Population Employed in Accommodation & Food Services in Ohio?
Percentage of Population Employed in Accommodation & Food Services in Ohio is 7.0%.
What is the Percentage of Population Employed in Accommodation & Food Services in the United States?
Percentage of Population Employed in Accommodation & Food Services in the United States is 6.9%.