Salem, OH Map & Demographics
Salem Map
Salem Overview
$28,769
PER CAPITA INCOME
$66,181
AVG FAMILY INCOME
$45,380
AVG HOUSEHOLD INCOME
45.9%
WAGE / INCOME GAP [ % ]
54.1¢/ $1
WAGE / INCOME GAP [ $ ]
$10,726
FAMILY INCOME DEFICIT
0.44
INEQUALITY / GINI INDEX
11,861
TOTAL POPULATION
5,487
MALE POPULATION
6,374
FEMALE POPULATION
86.08
MALES / 100 FEMALES
116.17
FEMALES / 100 MALES
41.3
MEDIAN AGE
3.0
AVG FAMILY SIZE
2.2
AVG HOUSEHOLD SIZE
6,809
LABOR FORCE [ PEOPLE ]
67.4%
PERCENT IN LABOR FORCE
4.5%
UNEMPLOYMENT RATE
Salem Zip Codes
Income in Salem
Income Overview in Salem
Per Capita Income in Salem is $28,769, while median incomes of families and households are $66,181 and $45,380 respectively.
| Characteristic | Number | Measure |
| Per Capita Income | 11,861 | $28,769 |
| Median Family Income | 2,657 | $66,181 |
| Mean Family Income | 2,657 | $77,399 |
| Median Household Income | 5,185 | $45,380 |
| Mean Household Income | 5,185 | $62,731 |
| Income Deficit | 2,657 | $10,726 |
| Wage / Income Gap (%) | 11,861 | 45.95% |
| Wage / Income Gap ($) | 11,861 | 54.05¢ per $1 |
| Gini / Inequality Index | 11,861 | 0.44 |
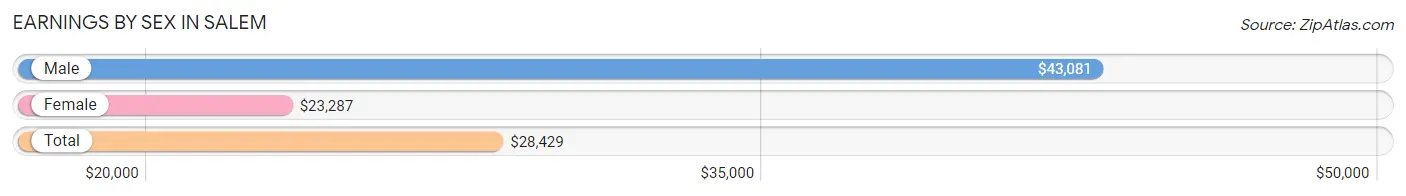
Earnings by Sex in Salem
Average Earnings in Salem are $28,429, $43,081 for men and $23,287 for women, a difference of 46.0%.
| Sex | Number | Average Earnings |
| Male | 3,493 (50.9%) | $43,081 |
| Female | 3,369 (49.1%) | $23,287 |
| Total | 6,862 (100.0%) | $28,429 |
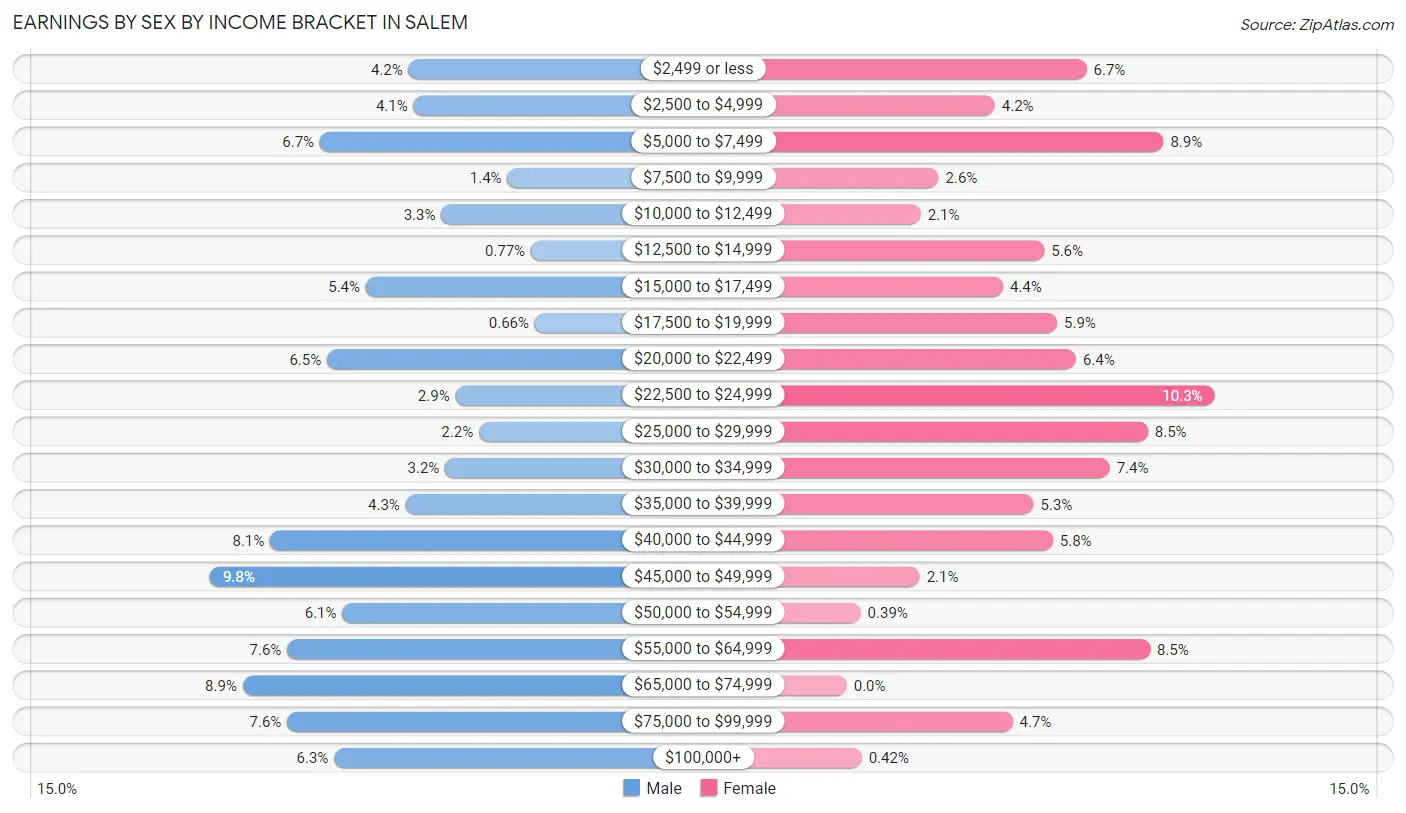
Earnings by Sex by Income Bracket in Salem
The most common earnings brackets in Salem are $45,000 to $49,999 for men (342 | 9.8%) and $22,500 to $24,999 for women (348 | 10.3%).
| Income | Male | Female |
| $2,499 or less | 147 (4.2%) | 227 (6.7%) |
| $2,500 to $4,999 | 142 (4.1%) | 140 (4.2%) |
| $5,000 to $7,499 | 234 (6.7%) | 300 (8.9%) |
| $7,500 to $9,999 | 50 (1.4%) | 87 (2.6%) |
| $10,000 to $12,499 | 115 (3.3%) | 70 (2.1%) |
| $12,500 to $14,999 | 27 (0.8%) | 187 (5.6%) |
| $15,000 to $17,499 | 189 (5.4%) | 148 (4.4%) |
| $17,500 to $19,999 | 23 (0.7%) | 199 (5.9%) |
| $20,000 to $22,499 | 227 (6.5%) | 217 (6.4%) |
| $22,500 to $24,999 | 101 (2.9%) | 348 (10.3%) |
| $25,000 to $29,999 | 78 (2.2%) | 285 (8.5%) |
| $30,000 to $34,999 | 111 (3.2%) | 249 (7.4%) |
| $35,000 to $39,999 | 150 (4.3%) | 177 (5.2%) |
| $40,000 to $44,999 | 283 (8.1%) | 195 (5.8%) |
| $45,000 to $49,999 | 342 (9.8%) | 69 (2.1%) |
| $50,000 to $54,999 | 212 (6.1%) | 13 (0.4%) |
| $55,000 to $64,999 | 266 (7.6%) | 287 (8.5%) |
| $65,000 to $74,999 | 310 (8.9%) | 0 (0.0%) |
| $75,000 to $99,999 | 266 (7.6%) | 157 (4.7%) |
| $100,000+ | 220 (6.3%) | 14 (0.4%) |
| Total | 3,493 (100.0%) | 3,369 (100.0%) |
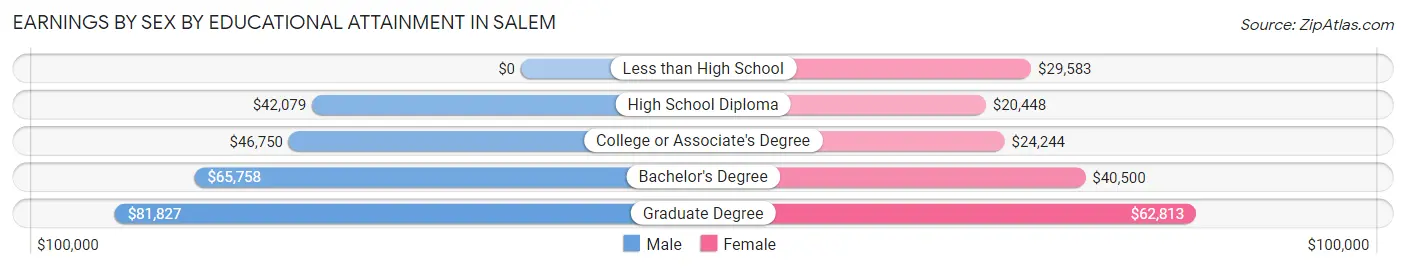
Earnings by Sex by Educational Attainment in Salem
Average earnings in Salem are $45,929 for men and $24,763 for women, a difference of 46.1%. Men with an educational attainment of graduate degree enjoy the highest average annual earnings of $81,827, while those with high school diploma education earn the least with $42,079. Women with an educational attainment of graduate degree earn the most with the average annual earnings of $62,813, while those with high school diploma education have the smallest earnings of $20,448.
| Educational Attainment | Male Income | Female Income |
| Less than High School | - | - |
| High School Diploma | $42,079 | $20,448 |
| College or Associate's Degree | $46,750 | $24,244 |
| Bachelor's Degree | $65,758 | $40,500 |
| Graduate Degree | $81,827 | $62,813 |
| Total | $45,929 | $24,763 |
Family Income in Salem
Family Income Brackets in Salem
According to the Salem family income data, there are 590 families falling into the $75,000 to $99,999 income range, which is the most common income bracket and makes up 22.2% of all families. Conversely, the $200,000+ income bracket is the least frequent group with only 72 families (2.7%) belonging to this category.
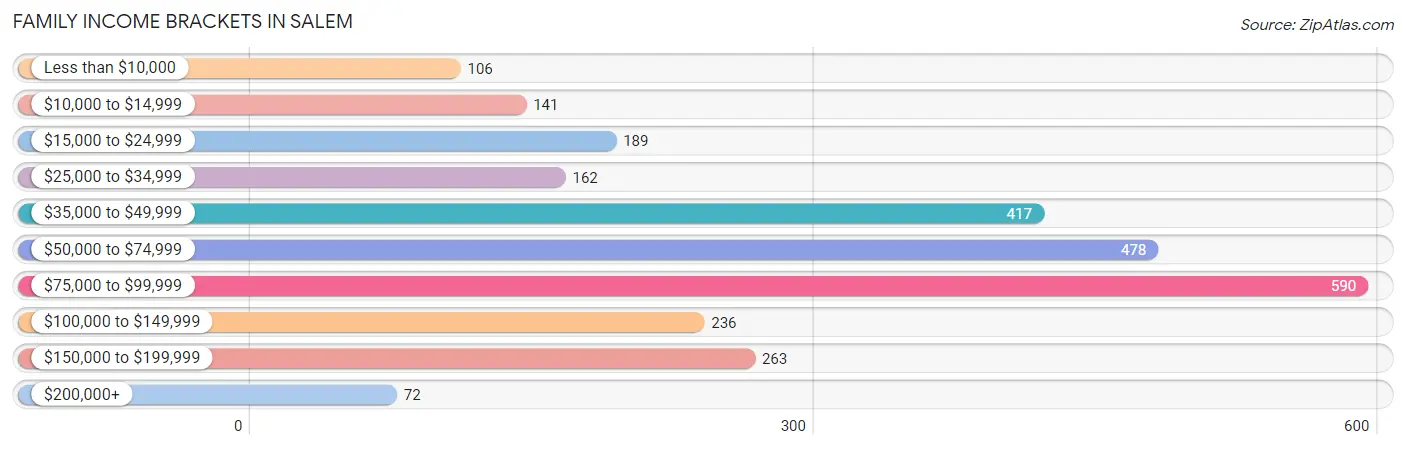
| Income Bracket | # Families | % Families |
| Less than $10,000 | 106 | 4.0% |
| $10,000 to $14,999 | 141 | 5.3% |
| $15,000 to $24,999 | 189 | 7.1% |
| $25,000 to $34,999 | 162 | 6.1% |
| $35,000 to $49,999 | 417 | 15.7% |
| $50,000 to $74,999 | 478 | 18.0% |
| $75,000 to $99,999 | 590 | 22.2% |
| $100,000 to $149,999 | 236 | 8.9% |
| $150,000 to $199,999 | 263 | 9.9% |
| $200,000+ | 72 | 2.7% |
Family Income by Famaliy Size in Salem
4-person families (510 | 19.2%) account for the highest median family income in Salem with $81,591 per family, while 2-person families (1,374 | 51.7%) have the highest median income of $25,784 per family member.
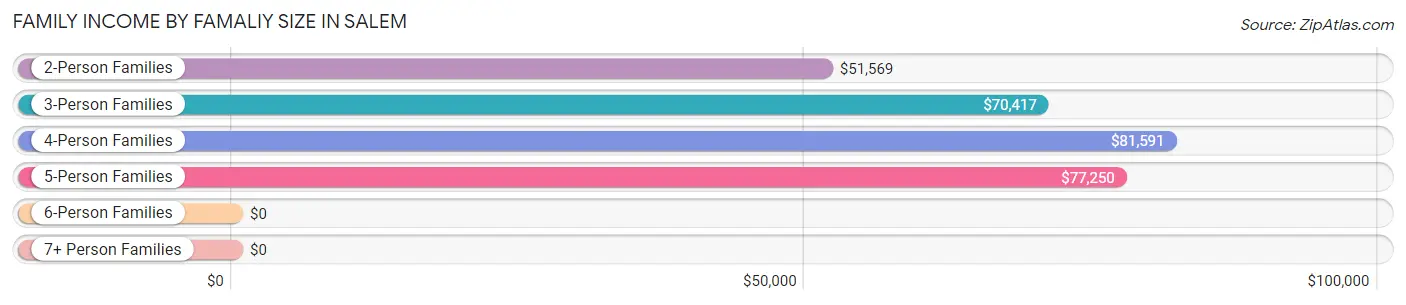
| Income Bracket | # Families | Median Income |
| 2-Person Families | 1,374 (51.7%) | $51,569 |
| 3-Person Families | 526 (19.8%) | $70,417 |
| 4-Person Families | 510 (19.2%) | $81,591 |
| 5-Person Families | 173 (6.5%) | $77,250 |
| 6-Person Families | 60 (2.3%) | $0 |
| 7+ Person Families | 14 (0.5%) | $0 |
| Total | 2,657 (100.0%) | $66,181 |
Family Income by Number of Earners in Salem
The median family income in Salem is $66,181, with families comprising 3+ earners (345) having the highest median family income of $96,224, while families with no earners (384) have the lowest median family income of $27,237, accounting for 13.0% and 14.4% of families, respectively.
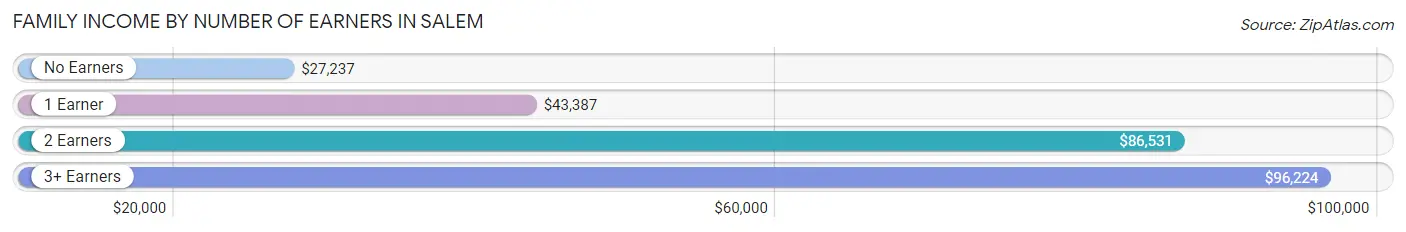
| Number of Earners | # Families | Median Income |
| No Earners | 384 (14.4%) | $27,237 |
| 1 Earner | 764 (28.7%) | $43,387 |
| 2 Earners | 1,164 (43.8%) | $86,531 |
| 3+ Earners | 345 (13.0%) | $96,224 |
| Total | 2,657 (100.0%) | $66,181 |
Household Income in Salem
Household Income Brackets in Salem
With 1,068 households falling in the category, the $50,000 to $74,999 income range is the most frequent in Salem, accounting for 20.6% of all households. In contrast, only 119 households (2.3%) fall into the $200,000+ income bracket, making it the least populous group.
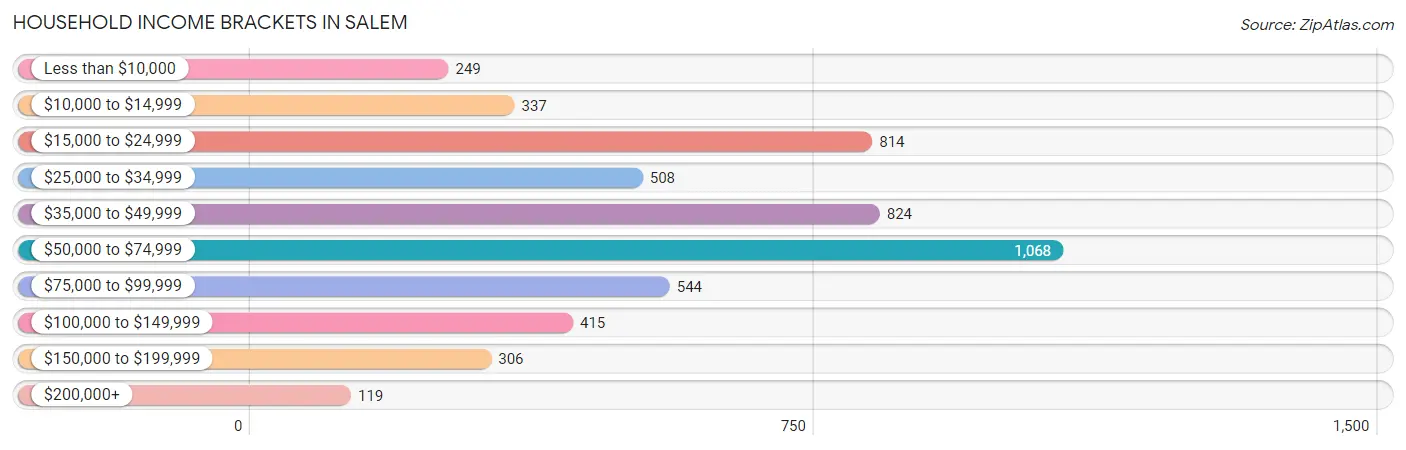
| Income Bracket | # Households | % Households |
| Less than $10,000 | 249 | 4.8% |
| $10,000 to $14,999 | 337 | 6.5% |
| $15,000 to $24,999 | 814 | 15.7% |
| $25,000 to $34,999 | 508 | 9.8% |
| $35,000 to $49,999 | 824 | 15.9% |
| $50,000 to $74,999 | 1,068 | 20.6% |
| $75,000 to $99,999 | 544 | 10.5% |
| $100,000 to $149,999 | 415 | 8.0% |
| $150,000 to $199,999 | 306 | 5.9% |
| $200,000+ | 119 | 2.3% |
Household Income by Householder Age in Salem
The median household income in Salem is $45,380, with the highest median household income of $63,125 found in the 25 to 44 years age bracket for the primary householder. A total of 1,534 households (29.6%) fall into this category. Meanwhile, the 65+ years age bracket for the primary householder has the lowest median household income of $32,904, with 1,471 households (28.4%) in this group.
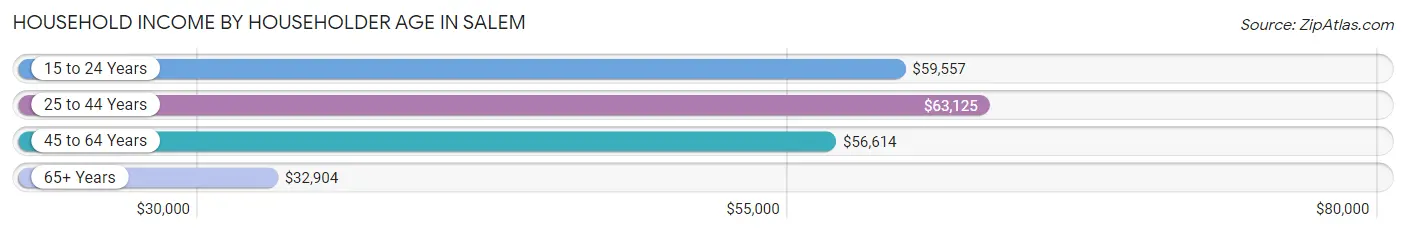
| Income Bracket | # Households | Median Income |
| 15 to 24 Years | 263 (5.1%) | $59,557 |
| 25 to 44 Years | 1,534 (29.6%) | $63,125 |
| 45 to 64 Years | 1,917 (37.0%) | $56,614 |
| 65+ Years | 1,471 (28.4%) | $32,904 |
| Total | 5,185 (100.0%) | $45,380 |
Poverty in Salem
Income Below Poverty by Sex and Age in Salem
With 15.6% poverty level for males and 19.1% for females among the residents of Salem, 16 and 17 year old males and 35 to 44 year old females are the most vulnerable to poverty, with 91 males (48.4%) and 292 females (42.4%) in their respective age groups living below the poverty level.
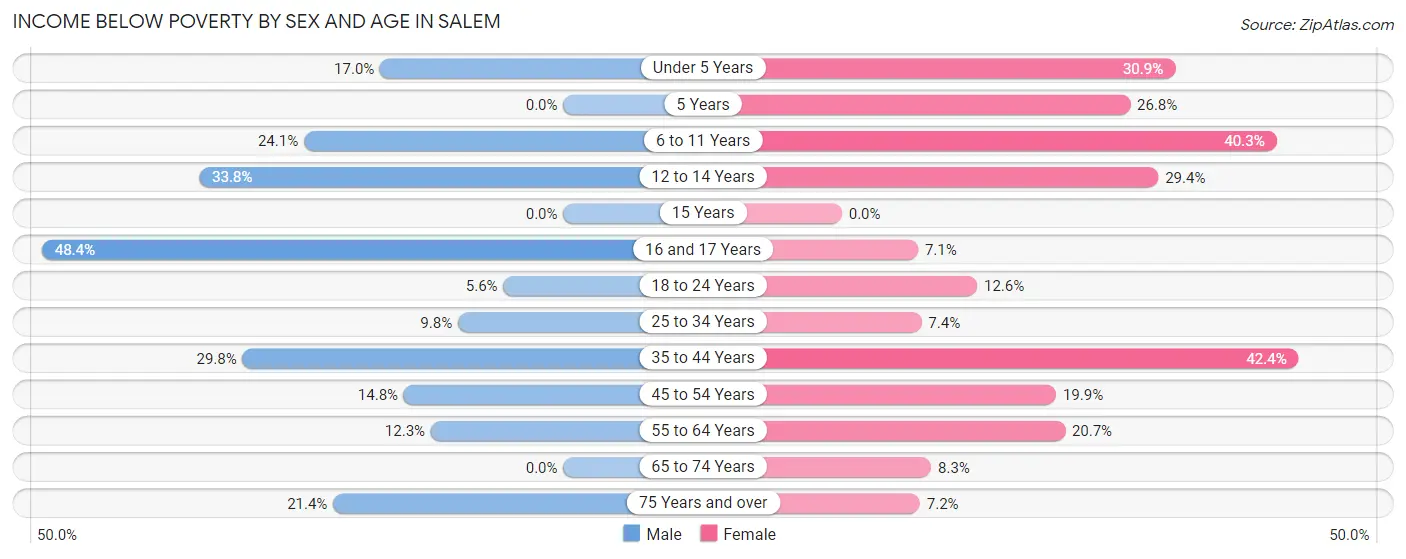
| Age Bracket | Male | Female |
| Under 5 Years | 34 (17.0%) | 64 (30.9%) |
| 5 Years | 0 (0.0%) | 19 (26.8%) |
| 6 to 11 Years | 91 (24.1%) | 117 (40.3%) |
| 12 to 14 Years | 24 (33.8%) | 89 (29.4%) |
| 15 Years | 0 (0.0%) | 0 (0.0%) |
| 16 and 17 Years | 91 (48.4%) | 7 (7.1%) |
| 18 to 24 Years | 35 (5.6%) | 95 (12.6%) |
| 25 to 34 Years | 86 (9.8%) | 50 (7.4%) |
| 35 to 44 Years | 217 (29.8%) | 292 (42.4%) |
| 45 to 54 Years | 98 (14.8%) | 166 (19.9%) |
| 55 to 64 Years | 97 (12.3%) | 158 (20.7%) |
| 65 to 74 Years | 0 (0.0%) | 51 (8.3%) |
| 75 Years and over | 69 (21.4%) | 53 (7.2%) |
| Total | 842 (15.6%) | 1,161 (19.1%) |
Income Above Poverty by Sex and Age in Salem
According to the poverty statistics in Salem, males aged 5 years and females aged 15 years are the age groups that are most secure financially, with 100.0% of males and 100.0% of females in these age groups living above the poverty line.
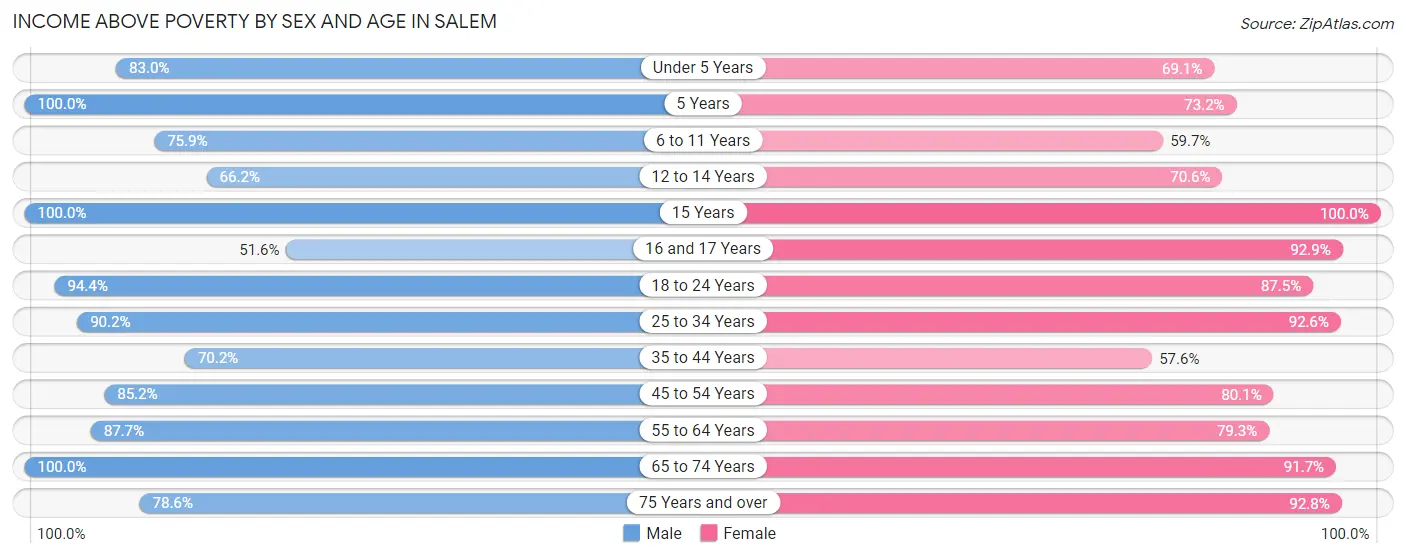
| Age Bracket | Male | Female |
| Under 5 Years | 166 (83.0%) | 143 (69.1%) |
| 5 Years | 30 (100.0%) | 52 (73.2%) |
| 6 to 11 Years | 287 (75.9%) | 173 (59.7%) |
| 12 to 14 Years | 47 (66.2%) | 214 (70.6%) |
| 15 Years | 88 (100.0%) | 28 (100.0%) |
| 16 and 17 Years | 97 (51.6%) | 92 (92.9%) |
| 18 to 24 Years | 594 (94.4%) | 662 (87.5%) |
| 25 to 34 Years | 793 (90.2%) | 627 (92.6%) |
| 35 to 44 Years | 512 (70.2%) | 397 (57.6%) |
| 45 to 54 Years | 564 (85.2%) | 669 (80.1%) |
| 55 to 64 Years | 692 (87.7%) | 605 (79.3%) |
| 65 to 74 Years | 446 (100.0%) | 564 (91.7%) |
| 75 Years and over | 254 (78.6%) | 679 (92.8%) |
| Total | 4,570 (84.4%) | 4,905 (80.9%) |
Income Below Poverty Among Married-Couple Families in Salem
The poverty statistics for married-couple families in Salem show that 10.9% or 194 of the total 1,787 families live below the poverty line. Families with 1 or 2 children have the highest poverty rate of 21.9%, comprising of 161 families. On the other hand, families with 3 or 4 children have the lowest poverty rate of 0.0%, which includes 0 families.
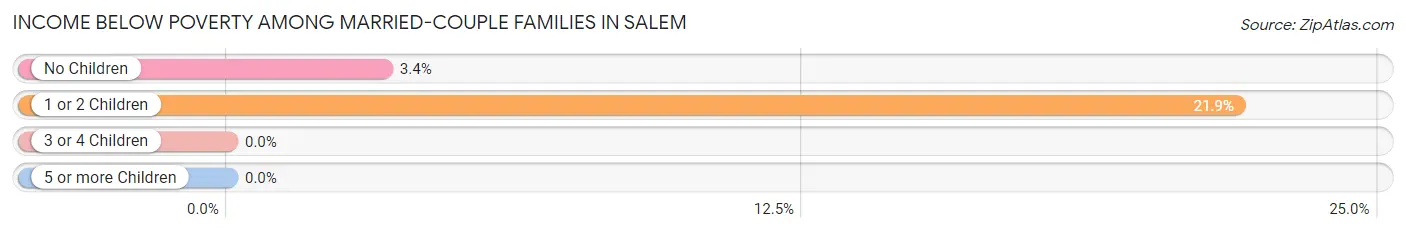
| Children | Above Poverty | Below Poverty |
| No Children | 945 (96.6%) | 33 (3.4%) |
| 1 or 2 Children | 573 (78.1%) | 161 (21.9%) |
| 3 or 4 Children | 61 (100.0%) | 0 (0.0%) |
| 5 or more Children | 14 (100.0%) | 0 (0.0%) |
| Total | 1,593 (89.1%) | 194 (10.9%) |
Income Below Poverty Among Single-Parent Households in Salem
According to the poverty data in Salem, 17.0% or 80 single-father households and 43.9% or 175 single-mother households are living below the poverty line. Among single-father households, those with 1 or 2 children have the highest poverty rate, with 80 households (35.2%) experiencing poverty. Likewise, among single-mother households, those with 3 or 4 children have the highest poverty rate, with 71 households (100.0%) falling below the poverty line.
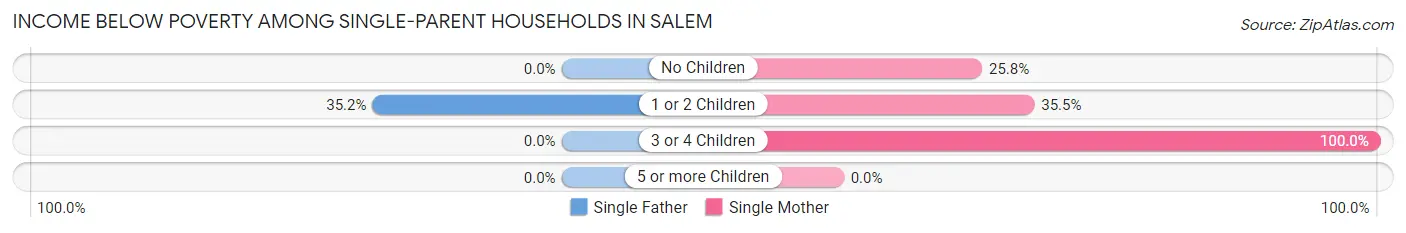
| Children | Single Father | Single Mother |
| No Children | 0 (0.0%) | 33 (25.8%) |
| 1 or 2 Children | 80 (35.2%) | 71 (35.5%) |
| 3 or 4 Children | 0 (0.0%) | 71 (100.0%) |
| 5 or more Children | 0 (0.0%) | 0 (0.0%) |
| Total | 80 (17.0%) | 175 (43.9%) |
Income Below Poverty Among Married-Couple vs Single-Parent Households in Salem
The poverty data for Salem shows that 194 of the married-couple family households (10.9%) and 255 of the single-parent households (29.3%) are living below the poverty level. Within the married-couple family households, those with 1 or 2 children have the highest poverty rate, with 161 households (21.9%) falling below the poverty line. Among the single-parent households, those with 3 or 4 children have the highest poverty rate, with 71 household (100.0%) living below poverty.
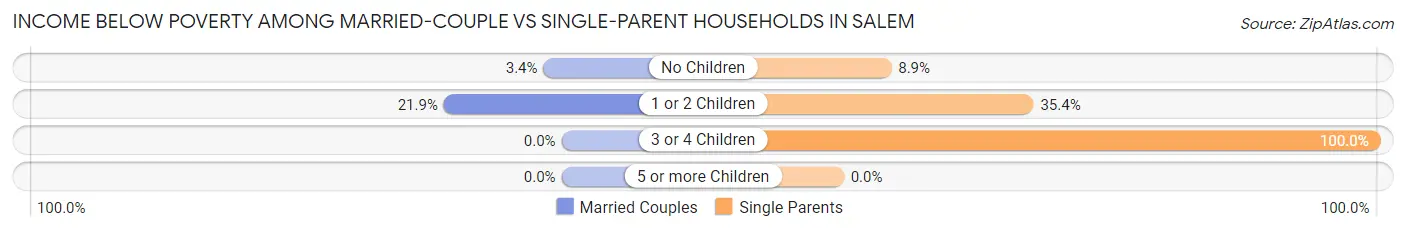
| Children | Married-Couple Families | Single-Parent Households |
| No Children | 33 (3.4%) | 33 (8.9%) |
| 1 or 2 Children | 161 (21.9%) | 151 (35.4%) |
| 3 or 4 Children | 0 (0.0%) | 71 (100.0%) |
| 5 or more Children | 0 (0.0%) | 0 (0.0%) |
| Total | 194 (10.9%) | 255 (29.3%) |
Race in Salem
The most populous races in Salem are White / Caucasian (11,501 | 97.0%), Two or more Races (200 | 1.7%), and Black / African American (93 | 0.8%).
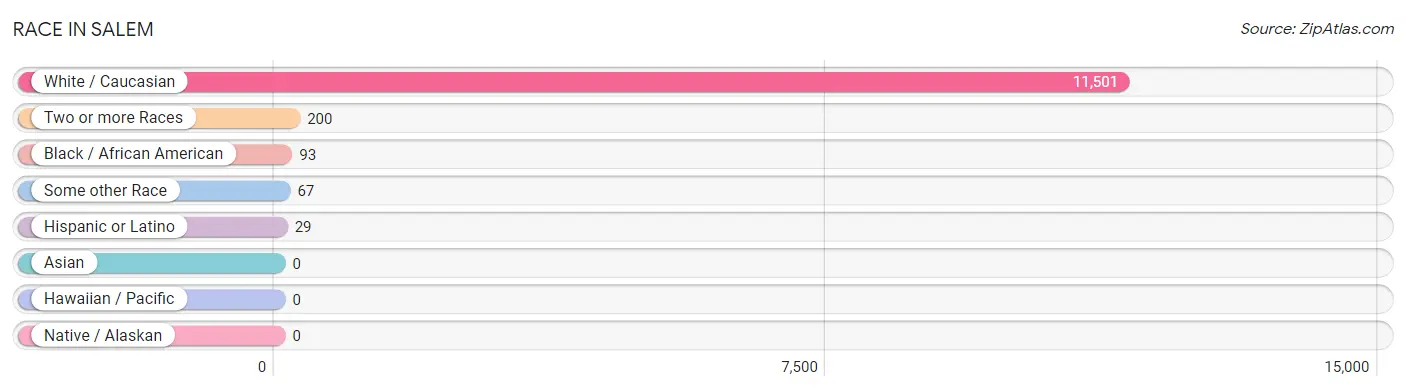
| Race | # Population | % Population |
| Asian | 0 | 0.0% |
| Black / African American | 93 | 0.8% |
| Hawaiian / Pacific | 0 | 0.0% |
| Hispanic or Latino | 29 | 0.2% |
| Native / Alaskan | 0 | 0.0% |
| White / Caucasian | 11,501 | 97.0% |
| Two or more Races | 200 | 1.7% |
| Some other Race | 67 | 0.6% |
| Total | 11,861 | 100.0% |
Ancestry in Salem
The most populous ancestries reported in Salem are German (3,503 | 29.5%), Irish (2,362 | 19.9%), Italian (1,472 | 12.4%), English (1,062 | 8.9%), and American (989 | 8.3%), together accounting for 79.1% of all Salem residents.
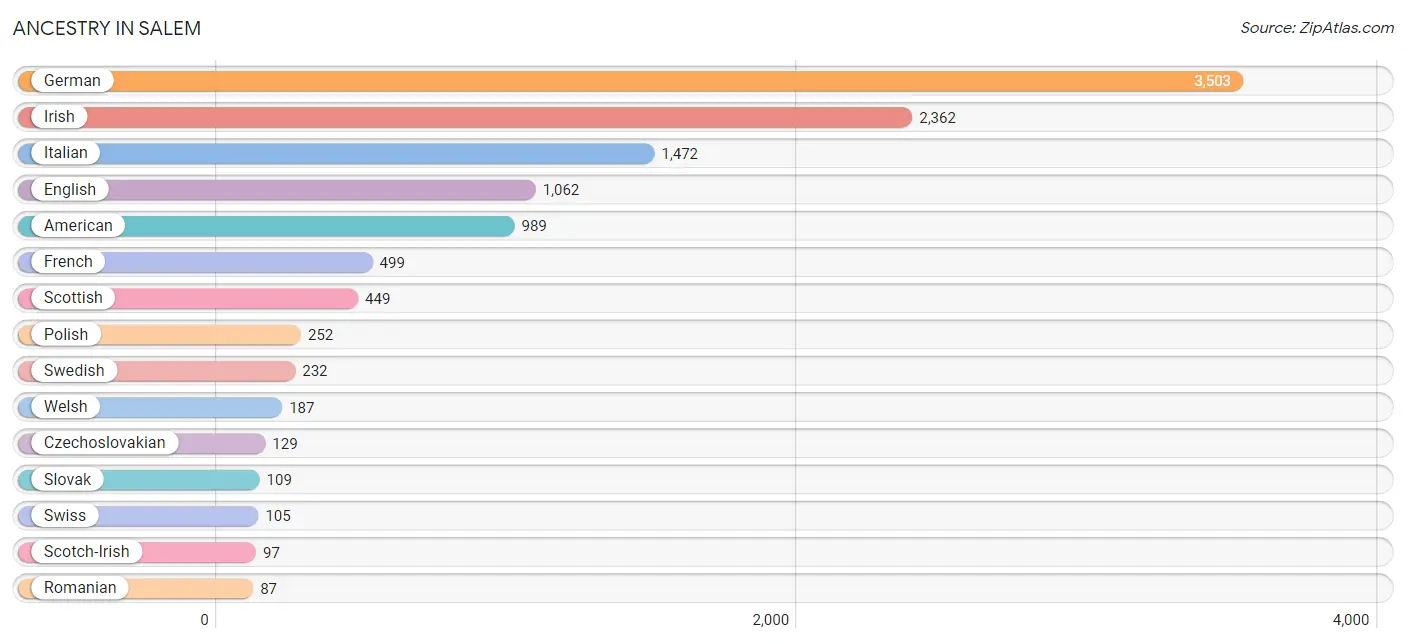
| Ancestry | # Population | % Population |
| American | 989 | 8.3% |
| Arab | 19 | 0.2% |
| Austrian | 21 | 0.2% |
| Belgian | 83 | 0.7% |
| British | 23 | 0.2% |
| Cherokee | 41 | 0.4% |
| Croatian | 72 | 0.6% |
| Czech | 5 | 0.0% |
| Czechoslovakian | 129 | 1.1% |
| Dutch | 84 | 0.7% |
| Eastern European | 12 | 0.1% |
| English | 1,062 | 8.9% |
| European | 50 | 0.4% |
| French | 499 | 4.2% |
| German | 3,503 | 29.5% |
| Greek | 15 | 0.1% |
| Hungarian | 77 | 0.6% |
| Irish | 2,362 | 19.9% |
| Italian | 1,472 | 12.4% |
| Lebanese | 19 | 0.2% |
| Mexican | 29 | 0.2% |
| Norwegian | 39 | 0.3% |
| Pennsylvania German | 41 | 0.4% |
| Polish | 252 | 2.1% |
| Romanian | 87 | 0.7% |
| Russian | 13 | 0.1% |
| Scandinavian | 17 | 0.1% |
| Scotch-Irish | 97 | 0.8% |
| Scottish | 449 | 3.8% |
| Serbian | 26 | 0.2% |
| Sioux | 21 | 0.2% |
| Slovak | 109 | 0.9% |
| Slovene | 21 | 0.2% |
| Swedish | 232 | 2.0% |
| Swiss | 105 | 0.9% |
| Thai | 22 | 0.2% |
| Ukrainian | 11 | 0.1% |
| Welsh | 187 | 1.6% | View All 38 Rows |
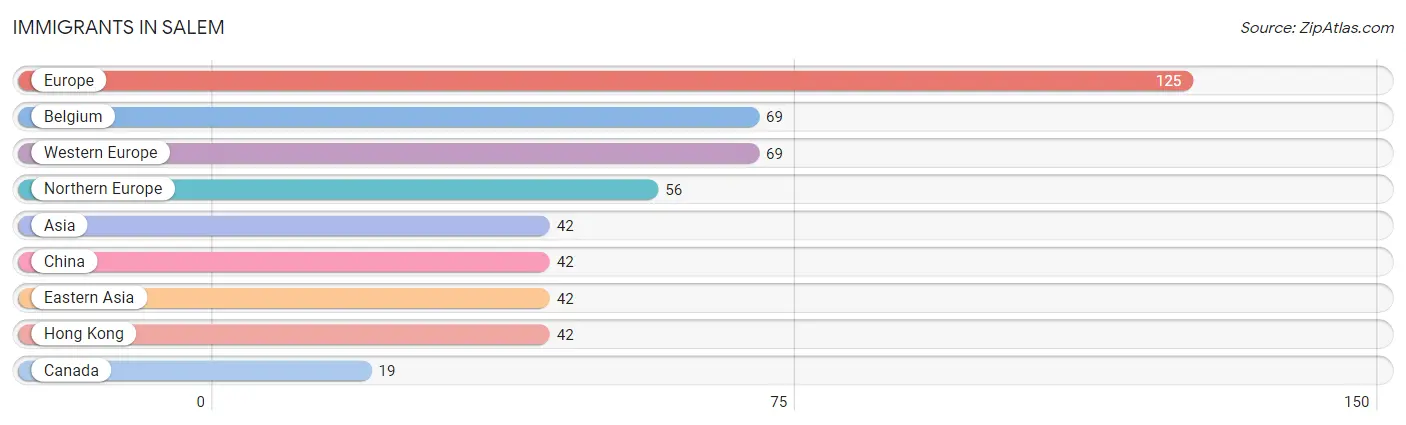
Immigrants in Salem
The most numerous immigrant groups reported in Salem came from Europe (125 | 1.1%), Belgium (69 | 0.6%), Western Europe (69 | 0.6%), Northern Europe (56 | 0.5%), and Asia (42 | 0.4%), together accounting for 3.0% of all Salem residents.
| Immigration Origin | # Population | % Population |
| Asia | 42 | 0.4% |
| Belgium | 69 | 0.6% |
| Canada | 19 | 0.2% |
| China | 42 | 0.4% |
| Eastern Asia | 42 | 0.4% |
| Europe | 125 | 1.1% |
| Hong Kong | 42 | 0.4% |
| Northern Europe | 56 | 0.5% |
| Western Europe | 69 | 0.6% | View All 9 Rows |
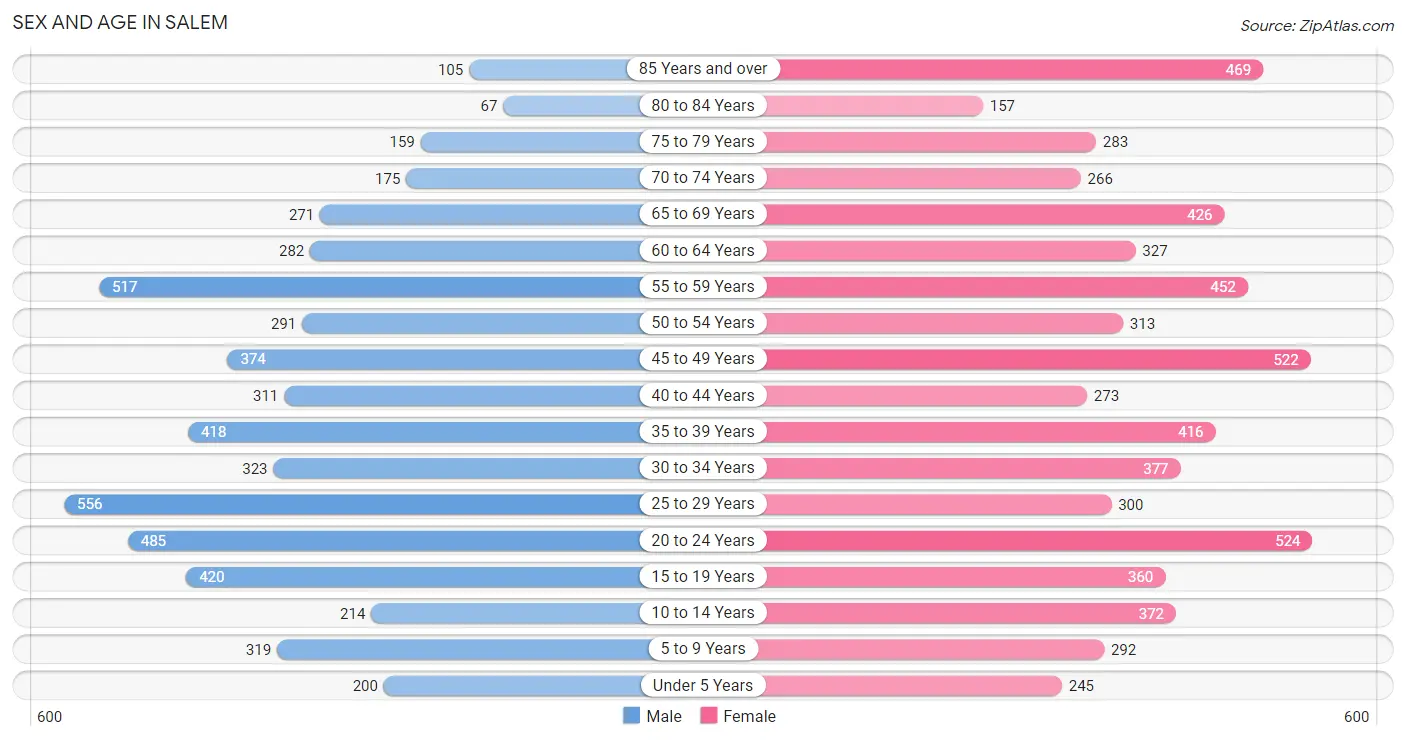
Sex and Age in Salem
Sex and Age in Salem
The most populous age groups in Salem are 25 to 29 Years (556 | 10.1%) for men and 20 to 24 Years (524 | 8.2%) for women.
| Age Bracket | Male | Female |
| Under 5 Years | 200 (3.6%) | 245 (3.8%) |
| 5 to 9 Years | 319 (5.8%) | 292 (4.6%) |
| 10 to 14 Years | 214 (3.9%) | 372 (5.8%) |
| 15 to 19 Years | 420 (7.6%) | 360 (5.7%) |
| 20 to 24 Years | 485 (8.8%) | 524 (8.2%) |
| 25 to 29 Years | 556 (10.1%) | 300 (4.7%) |
| 30 to 34 Years | 323 (5.9%) | 377 (5.9%) |
| 35 to 39 Years | 418 (7.6%) | 416 (6.5%) |
| 40 to 44 Years | 311 (5.7%) | 273 (4.3%) |
| 45 to 49 Years | 374 (6.8%) | 522 (8.2%) |
| 50 to 54 Years | 291 (5.3%) | 313 (4.9%) |
| 55 to 59 Years | 517 (9.4%) | 452 (7.1%) |
| 60 to 64 Years | 282 (5.1%) | 327 (5.1%) |
| 65 to 69 Years | 271 (4.9%) | 426 (6.7%) |
| 70 to 74 Years | 175 (3.2%) | 266 (4.2%) |
| 75 to 79 Years | 159 (2.9%) | 283 (4.4%) |
| 80 to 84 Years | 67 (1.2%) | 157 (2.5%) |
| 85 Years and over | 105 (1.9%) | 469 (7.4%) |
| Total | 5,487 (100.0%) | 6,374 (100.0%) |
Families and Households in Salem
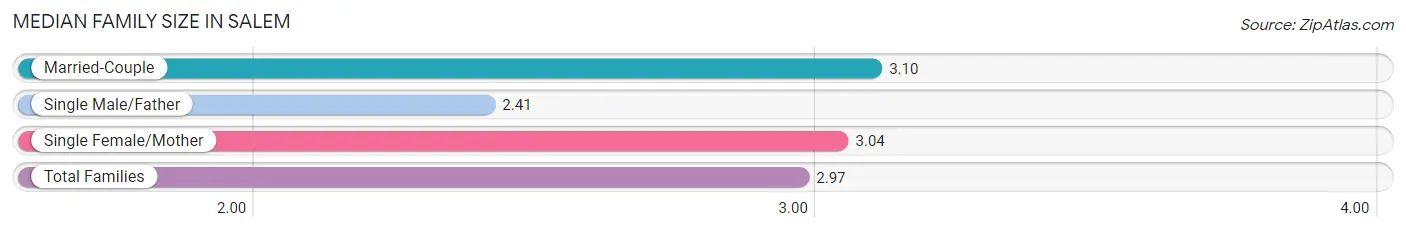
Median Family Size in Salem
The median family size in Salem is 2.97 persons per family, with married-couple families (1,787 | 67.3%) accounting for the largest median family size of 3.1 persons per family. On the other hand, single male/father families (471 | 17.7%) represent the smallest median family size with 2.41 persons per family.
| Family Type | # Families | Family Size |
| Married-Couple | 1,787 (67.3%) | 3.10 |
| Single Male/Father | 471 (17.7%) | 2.41 |
| Single Female/Mother | 399 (15.0%) | 3.04 |
| Total Families | 2,657 (100.0%) | 2.97 |
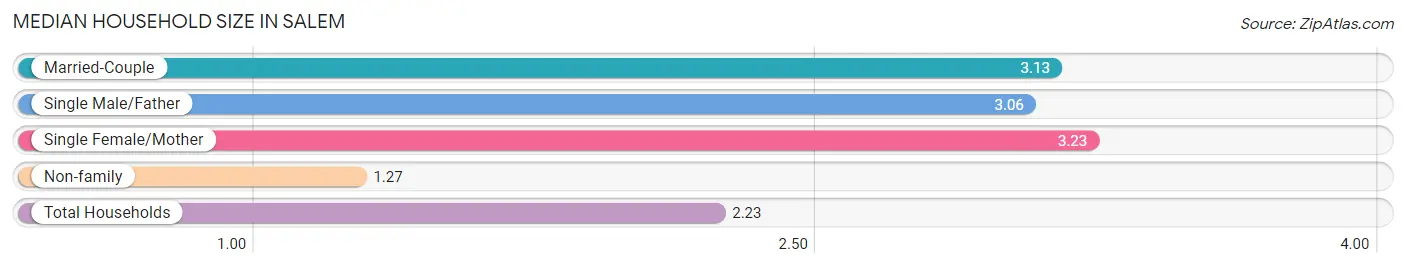
Median Household Size in Salem
The median household size in Salem is 2.23 persons per household, with single female/mother households (399 | 7.7%) accounting for the largest median household size of 3.23 persons per household. non-family households (2,528 | 48.8%) represent the smallest median household size with 1.27 persons per household.
| Household Type | # Households | Household Size |
| Married-Couple | 1,787 (34.5%) | 3.13 |
| Single Male/Father | 471 (9.1%) | 3.06 |
| Single Female/Mother | 399 (7.7%) | 3.23 |
| Non-family | 2,528 (48.8%) | 1.27 |
| Total Households | 5,185 (100.0%) | 2.23 |
Household Size by Marriage Status in Salem
Out of a total of 5,185 households in Salem, 2,657 (51.2%) are family households, while 2,528 (48.8%) are nonfamily households. The most numerous type of family households are 2-person households, comprising 1,067, and the most common type of nonfamily households are 1-person households, comprising 2,045.
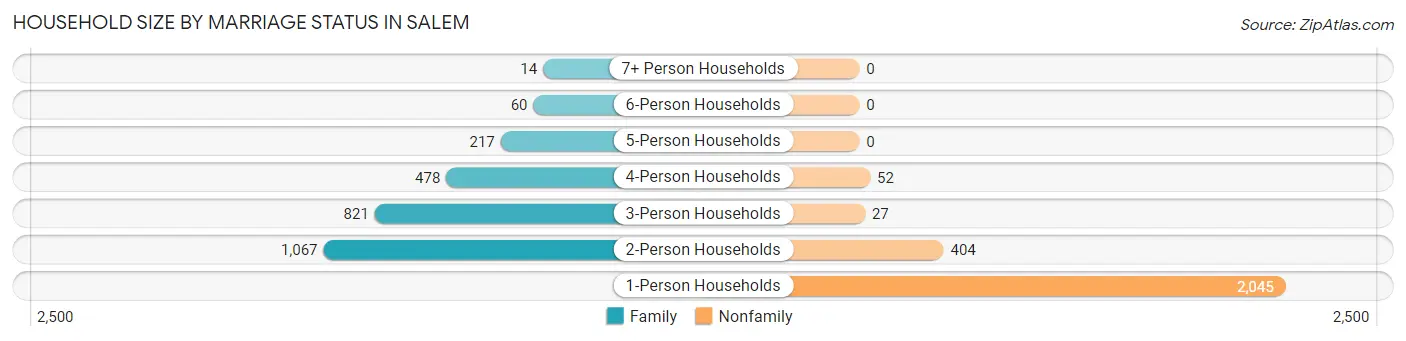
| Household Size | Family Households | Nonfamily Households |
| 1-Person Households | - | 2,045 (39.4%) |
| 2-Person Households | 1,067 (20.6%) | 404 (7.8%) |
| 3-Person Households | 821 (15.8%) | 27 (0.5%) |
| 4-Person Households | 478 (9.2%) | 52 (1.0%) |
| 5-Person Households | 217 (4.2%) | 0 (0.0%) |
| 6-Person Households | 60 (1.2%) | 0 (0.0%) |
| 7+ Person Households | 14 (0.3%) | 0 (0.0%) |
| Total | 2,657 (51.2%) | 2,528 (48.8%) |
Female Fertility in Salem
Fertility by Age in Salem
Average fertility rate in Salem is 20.0 births per 1,000 women. Women in the age bracket of 20 to 34 years have the highest fertility rate with 37.0 births per 1,000 women. Women in the age bracket of 20 to 34 years acount for 77.2% of all women with births.
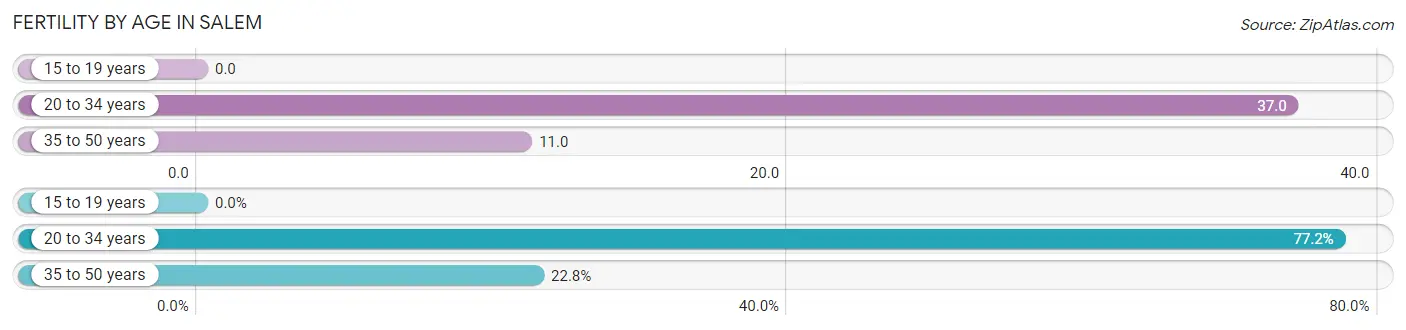
| Age Bracket | Women with Births | Births / 1,000 Women |
| 15 to 19 years | 0 (0.0%) | 0.0 |
| 20 to 34 years | 44 (77.2%) | 37.0 |
| 35 to 50 years | 13 (22.8%) | 11.0 |
| Total | 57 (100.0%) | 20.0 |
Fertility by Age by Marriage Status in Salem
57.9% of women with births (57) in Salem are married. The highest percentage of unmarried women with births falls into 20 to 34 years age bracket with 54.5% of them unmarried at the time of birth, while the lowest percentage of unmarried women with births belong to 35 to 50 years age bracket with 0.0% of them unmarried.
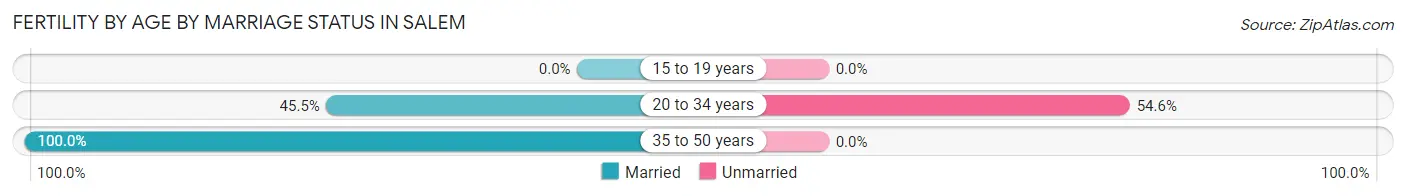
| Age Bracket | Married | Unmarried |
| 15 to 19 years | 0 (0.0%) | 0 (0.0%) |
| 20 to 34 years | 20 (45.5%) | 24 (54.5%) |
| 35 to 50 years | 13 (100.0%) | 0 (0.0%) |
| Total | 33 (57.9%) | 24 (42.1%) |
Fertility by Education in Salem
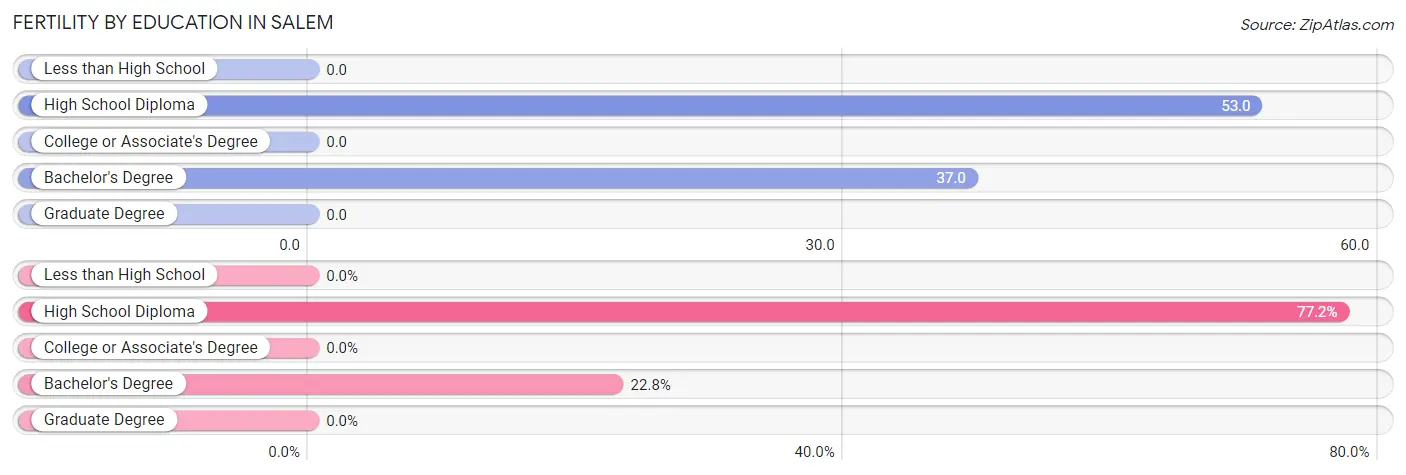
| Educational Attainment | Women with Births | Births / 1,000 Women |
| Less than High School | 0 (0.0%) | 0.0 |
| High School Diploma | 44 (77.2%) | 53.0 |
| College or Associate's Degree | 0 (0.0%) | 0.0 |
| Bachelor's Degree | 13 (22.8%) | 37.0 |
| Graduate Degree | 0 (0.0%) | 0.0 |
| Total | 57 (100.0%) | 20.0 |
Fertility by Education by Marriage Status in Salem
42.1% of women with births in Salem are unmarried. Women with the educational attainment of bachelor's degree are most likely to be married with 100.0% of them married at childbirth, while women with the educational attainment of high school diploma are least likely to be married with 54.5% of them unmarried at childbirth.
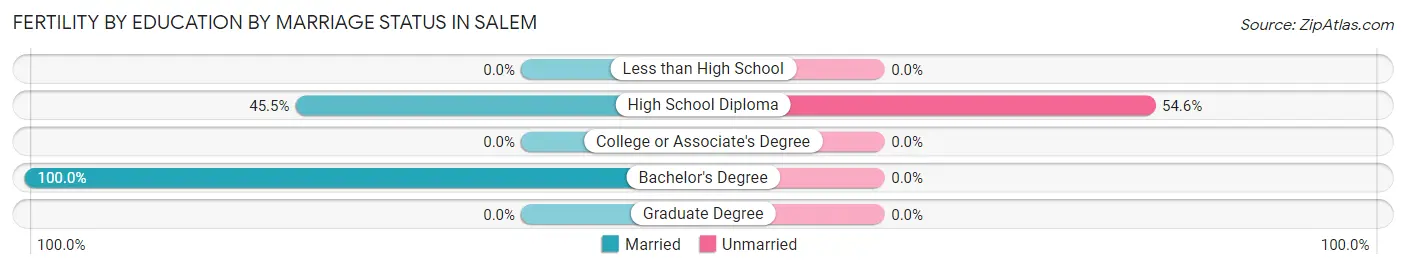
| Educational Attainment | Married | Unmarried |
| Less than High School | 0 (0.0%) | 0 (0.0%) |
| High School Diploma | 20 (45.5%) | 24 (54.5%) |
| College or Associate's Degree | 0 (0.0%) | 0 (0.0%) |
| Bachelor's Degree | 13 (100.0%) | 0 (0.0%) |
| Graduate Degree | 0 (0.0%) | 0 (0.0%) |
| Total | 33 (57.9%) | 24 (42.1%) |
Employment Characteristics in Salem
Employment by Class of Employer in Salem
Among the 6,477 employed individuals in Salem, private company employees (5,098 | 78.7%), not-for-profit organizations (501 | 7.7%), and self-employed (incorporated) (246 | 3.8%) make up the most common classes of employment.
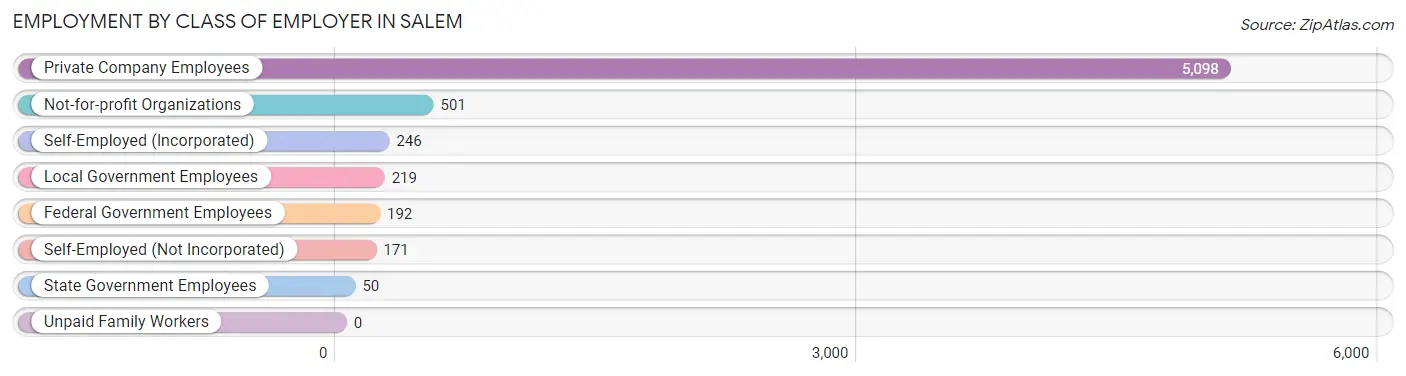
| Employer Class | # Employees | % Employees |
| Private Company Employees | 5,098 | 78.7% |
| Self-Employed (Incorporated) | 246 | 3.8% |
| Self-Employed (Not Incorporated) | 171 | 2.6% |
| Not-for-profit Organizations | 501 | 7.7% |
| Local Government Employees | 219 | 3.4% |
| State Government Employees | 50 | 0.8% |
| Federal Government Employees | 192 | 3.0% |
| Unpaid Family Workers | 0 | 0.0% |
| Total | 6,477 | 100.0% |
Employment Status by Age in Salem
According to the labor force statistics for Salem, out of the total population over 16 years of age (10,103), 67.4% or 6,809 individuals are in the labor force, with 4.5% or 306 of them unemployed. The age group with the highest labor force participation rate is 20 to 24 years, with 97.6% or 985 individuals in the labor force. Within the labor force, the 20 to 24 years age range has the highest percentage of unemployed individuals, with 16.9% or 166 of them being unemployed.
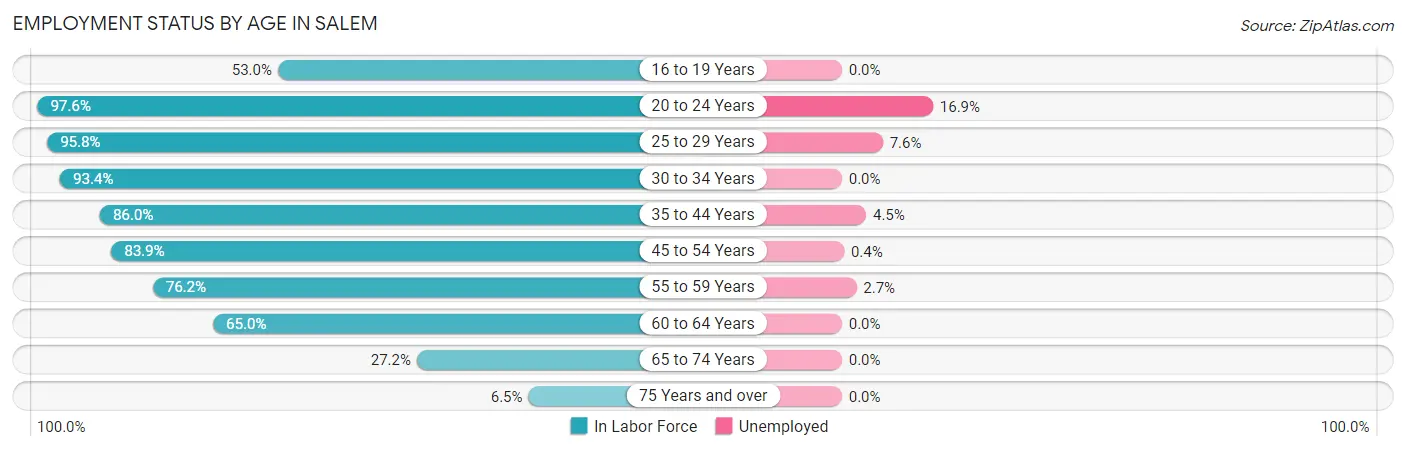
| Age Bracket | In Labor Force | Unemployed |
| 16 to 19 Years | 352 (53.0%) | 0 (0.0%) |
| 20 to 24 Years | 985 (97.6%) | 166 (16.9%) |
| 25 to 29 Years | 820 (95.8%) | 62 (7.6%) |
| 30 to 34 Years | 654 (93.4%) | 0 (0.0%) |
| 35 to 44 Years | 1,219 (86.0%) | 55 (4.5%) |
| 45 to 54 Years | 1,259 (83.9%) | 5 (0.4%) |
| 55 to 59 Years | 738 (76.2%) | 20 (2.7%) |
| 60 to 64 Years | 396 (65.0%) | 0 (0.0%) |
| 65 to 74 Years | 310 (27.2%) | 0 (0.0%) |
| 75 Years and over | 81 (6.5%) | 0 (0.0%) |
| Total | 6,809 (67.4%) | 306 (4.5%) |
Employment Status by Educational Attainment in Salem
According to labor force statistics for Salem, 84.0% of individuals (5,084) out of the total population between 25 and 64 years of age (6,052) are in the labor force, with 2.8% or 142 of them being unemployed. The group with the highest labor force participation rate are those with the educational attainment of bachelor's degree or higher, with 93.4% or 1,173 individuals in the labor force. Within the labor force, individuals with bachelor's degree or higher education have the highest percentage of unemployment, with 3.3% or 39 of them being unemployed.
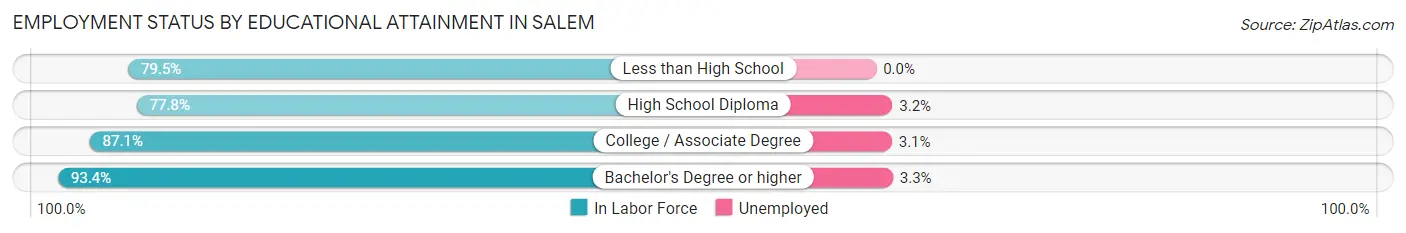
| Educational Attainment | In Labor Force | Unemployed |
| Less than High School | 644 (79.5%) | 0 (0.0%) |
| High School Diploma | 1,697 (77.8%) | 70 (3.2%) |
| College / Associate Degree | 1,572 (87.1%) | 56 (3.1%) |
| Bachelor's Degree or higher | 1,173 (93.4%) | 41 (3.3%) |
| Total | 5,084 (84.0%) | 169 (2.8%) |
Employment Occupations by Sex in Salem
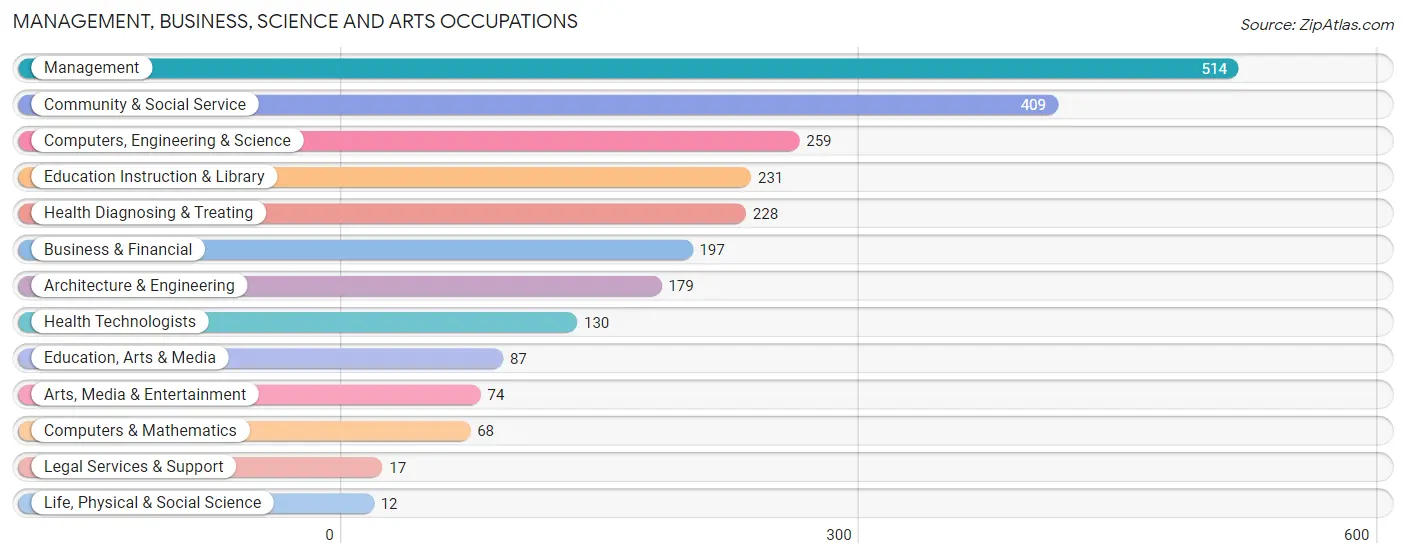
Management, Business, Science and Arts Occupations
The most common Management, Business, Science and Arts occupations in Salem are Management (514 | 7.9%), Community & Social Service (409 | 6.3%), Computers, Engineering & Science (259 | 4.0%), Education Instruction & Library (231 | 3.5%), and Health Diagnosing & Treating (228 | 3.5%).
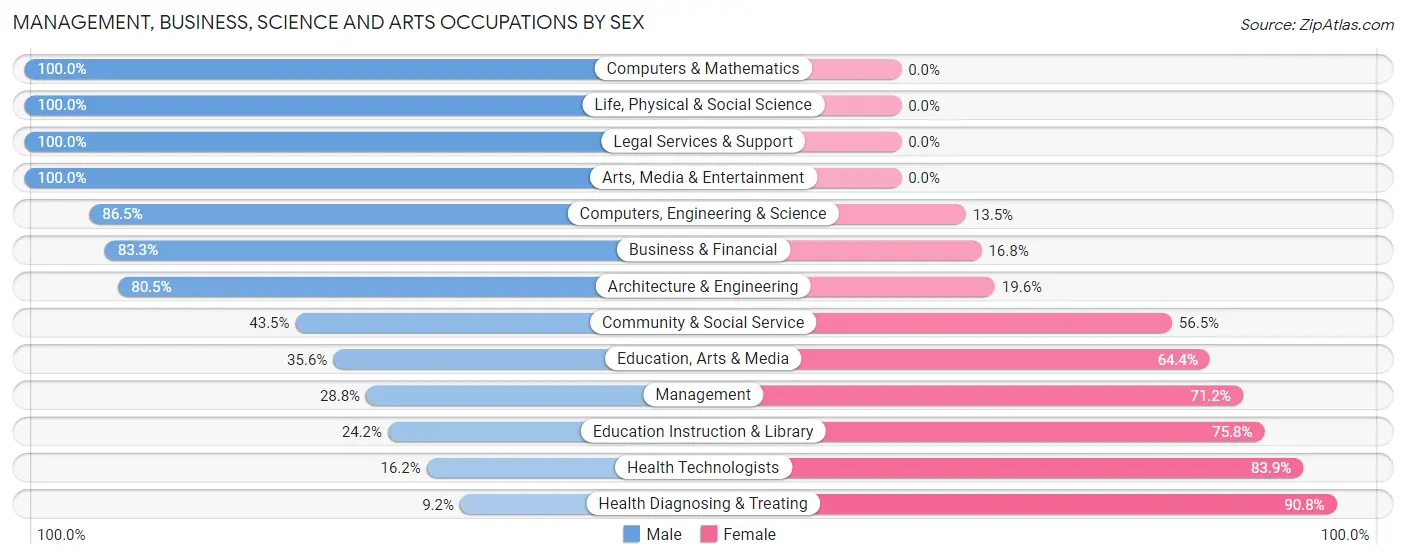
Management, Business, Science and Arts Occupations by Sex
Within the Management, Business, Science and Arts occupations in Salem, the most male-oriented occupations are Computers & Mathematics (100.0%), Life, Physical & Social Science (100.0%), and Legal Services & Support (100.0%), while the most female-oriented occupations are Health Diagnosing & Treating (90.8%), Health Technologists (83.9%), and Education Instruction & Library (75.8%).
| Occupation | Male | Female |
| Management | 148 (28.8%) | 366 (71.2%) |
| Business & Financial | 164 (83.3%) | 33 (16.8%) |
| Computers, Engineering & Science | 224 (86.5%) | 35 (13.5%) |
| Computers & Mathematics | 68 (100.0%) | 0 (0.0%) |
| Architecture & Engineering | 144 (80.4%) | 35 (19.6%) |
| Life, Physical & Social Science | 12 (100.0%) | 0 (0.0%) |
| Community & Social Service | 178 (43.5%) | 231 (56.5%) |
| Education, Arts & Media | 31 (35.6%) | 56 (64.4%) |
| Legal Services & Support | 17 (100.0%) | 0 (0.0%) |
| Education Instruction & Library | 56 (24.2%) | 175 (75.8%) |
| Arts, Media & Entertainment | 74 (100.0%) | 0 (0.0%) |
| Health Diagnosing & Treating | 21 (9.2%) | 207 (90.8%) |
| Health Technologists | 21 (16.2%) | 109 (83.9%) |
| Total (Category) | 735 (45.7%) | 872 (54.3%) |
| Total (Overall) | 3,348 (51.5%) | 3,157 (48.5%) |
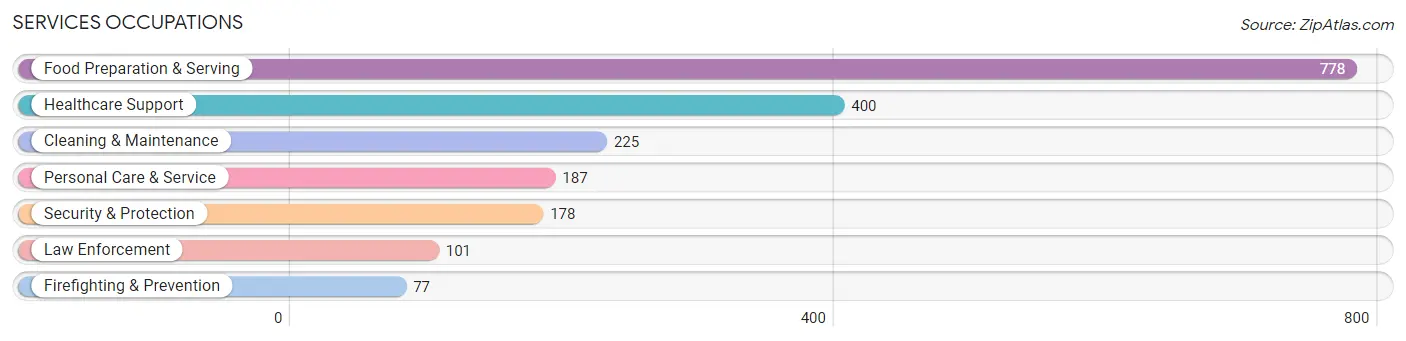
Services Occupations
The most common Services occupations in Salem are Food Preparation & Serving (778 | 12.0%), Healthcare Support (400 | 6.1%), Cleaning & Maintenance (225 | 3.5%), Personal Care & Service (187 | 2.9%), and Security & Protection (178 | 2.7%).
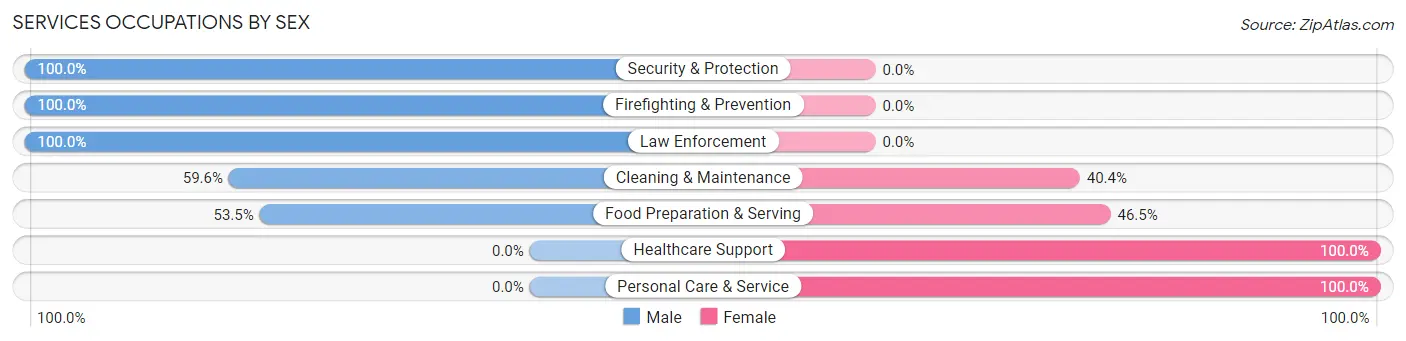
Services Occupations by Sex
Within the Services occupations in Salem, the most male-oriented occupations are Security & Protection (100.0%), Firefighting & Prevention (100.0%), and Law Enforcement (100.0%), while the most female-oriented occupations are Healthcare Support (100.0%), Personal Care & Service (100.0%), and Food Preparation & Serving (46.5%).
| Occupation | Male | Female |
| Healthcare Support | 0 (0.0%) | 400 (100.0%) |
| Security & Protection | 178 (100.0%) | 0 (0.0%) |
| Firefighting & Prevention | 77 (100.0%) | 0 (0.0%) |
| Law Enforcement | 101 (100.0%) | 0 (0.0%) |
| Food Preparation & Serving | 416 (53.5%) | 362 (46.5%) |
| Cleaning & Maintenance | 134 (59.6%) | 91 (40.4%) |
| Personal Care & Service | 0 (0.0%) | 187 (100.0%) |
| Total (Category) | 728 (41.2%) | 1,040 (58.8%) |
| Total (Overall) | 3,348 (51.5%) | 3,157 (48.5%) |
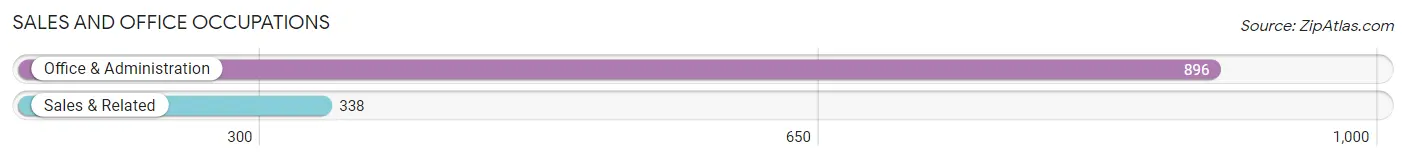
Sales and Office Occupations
The most common Sales and Office occupations in Salem are Office & Administration (896 | 13.8%), and Sales & Related (338 | 5.2%).
Sales and Office Occupations by Sex
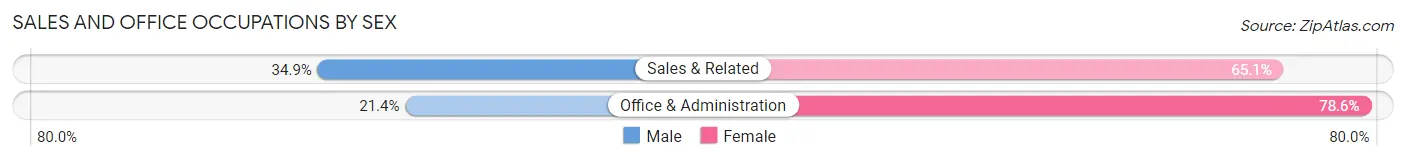
| Occupation | Male | Female |
| Sales & Related | 118 (34.9%) | 220 (65.1%) |
| Office & Administration | 192 (21.4%) | 704 (78.6%) |
| Total (Category) | 310 (25.1%) | 924 (74.9%) |
| Total (Overall) | 3,348 (51.5%) | 3,157 (48.5%) |
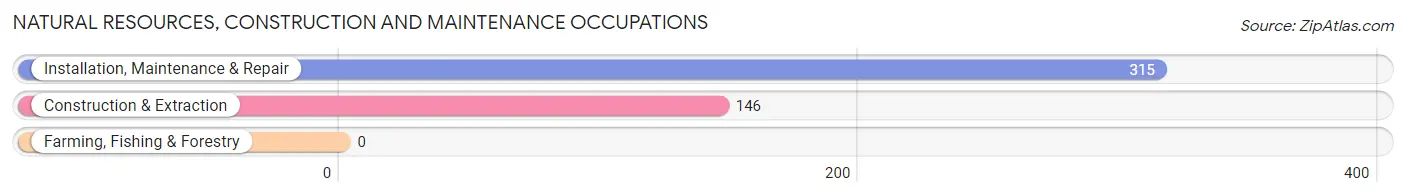
Natural Resources, Construction and Maintenance Occupations
The most common Natural Resources, Construction and Maintenance occupations in Salem are Installation, Maintenance & Repair (315 | 4.8%), and Construction & Extraction (146 | 2.2%).
Natural Resources, Construction and Maintenance Occupations by Sex
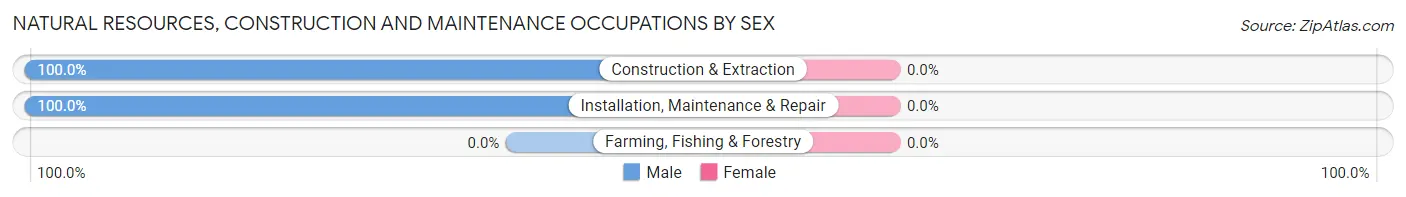
| Occupation | Male | Female |
| Farming, Fishing & Forestry | 0 (0.0%) | 0 (0.0%) |
| Construction & Extraction | 146 (100.0%) | 0 (0.0%) |
| Installation, Maintenance & Repair | 315 (100.0%) | 0 (0.0%) |
| Total (Category) | 461 (100.0%) | 0 (0.0%) |
| Total (Overall) | 3,348 (51.5%) | 3,157 (48.5%) |
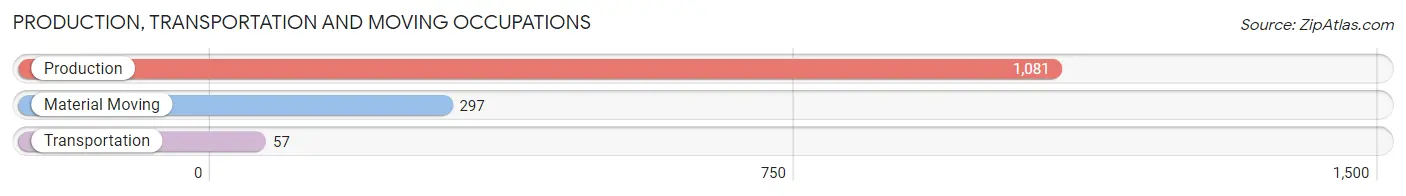
Production, Transportation and Moving Occupations
The most common Production, Transportation and Moving occupations in Salem are Production (1,081 | 16.6%), Material Moving (297 | 4.6%), and Transportation (57 | 0.9%).
Production, Transportation and Moving Occupations by Sex
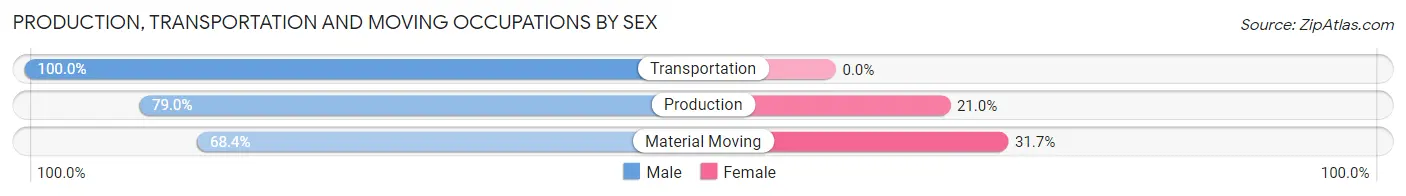
| Occupation | Male | Female |
| Production | 854 (79.0%) | 227 (21.0%) |
| Transportation | 57 (100.0%) | 0 (0.0%) |
| Material Moving | 203 (68.3%) | 94 (31.7%) |
| Total (Category) | 1,114 (77.6%) | 321 (22.4%) |
| Total (Overall) | 3,348 (51.5%) | 3,157 (48.5%) |
Employment Industries by Sex in Salem
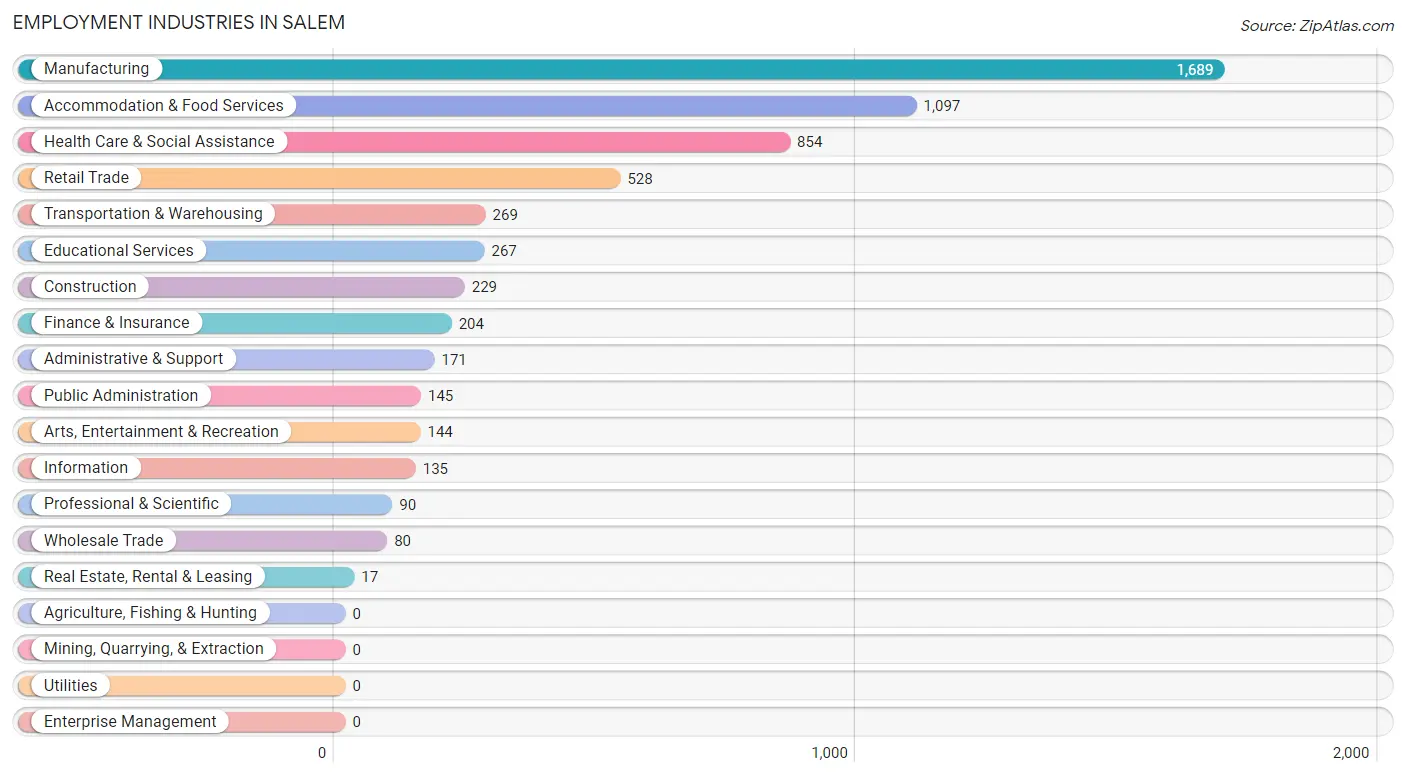
Employment Industries in Salem
The major employment industries in Salem include Manufacturing (1,689 | 26.0%), Accommodation & Food Services (1,097 | 16.9%), Health Care & Social Assistance (854 | 13.1%), Retail Trade (528 | 8.1%), and Transportation & Warehousing (269 | 4.1%).
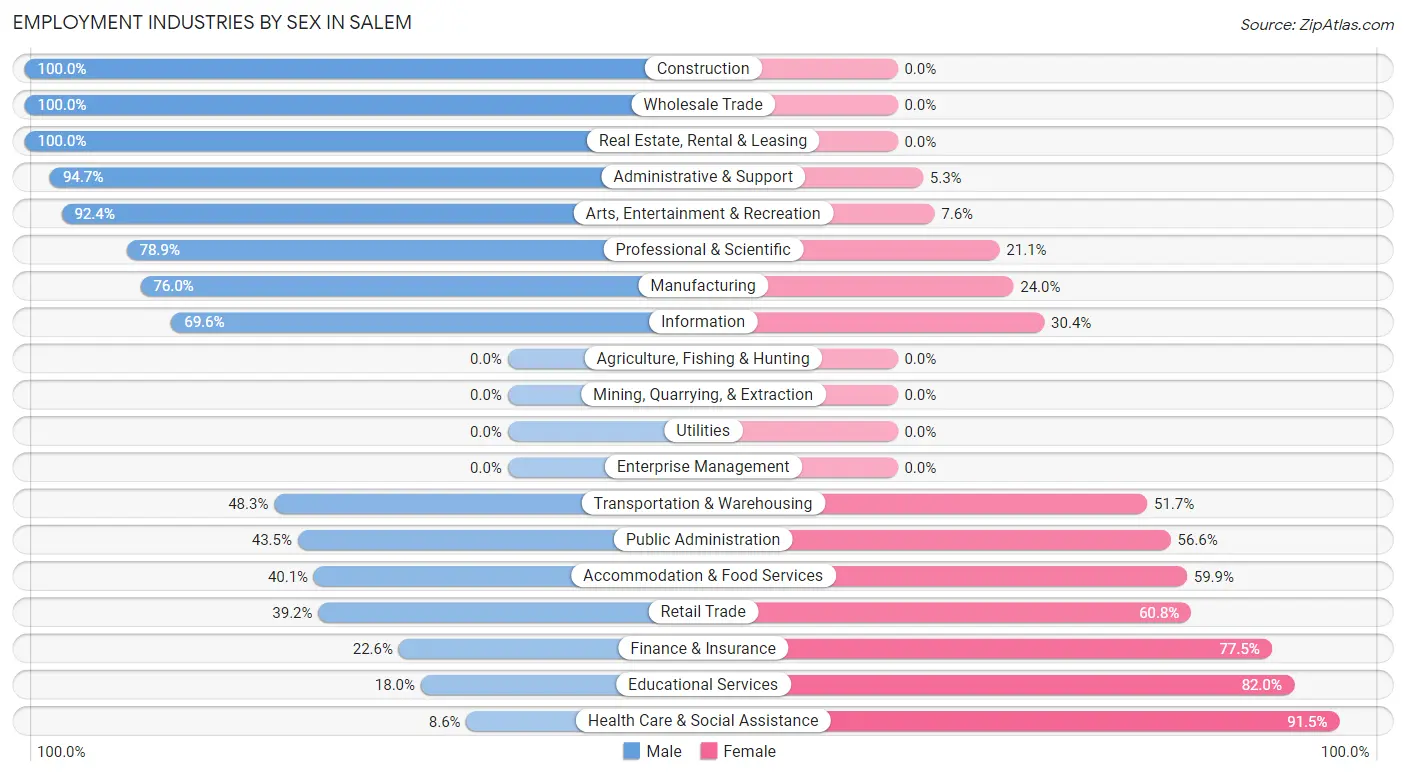
Employment Industries by Sex in Salem
The Salem industries that see more men than women are Construction (100.0%), Wholesale Trade (100.0%), and Real Estate, Rental & Leasing (100.0%), whereas the industries that tend to have a higher number of women are Health Care & Social Assistance (91.4%), Educational Services (82.0%), and Finance & Insurance (77.4%).
| Industry | Male | Female |
| Agriculture, Fishing & Hunting | 0 (0.0%) | 0 (0.0%) |
| Mining, Quarrying, & Extraction | 0 (0.0%) | 0 (0.0%) |
| Construction | 229 (100.0%) | 0 (0.0%) |
| Manufacturing | 1,284 (76.0%) | 405 (24.0%) |
| Wholesale Trade | 80 (100.0%) | 0 (0.0%) |
| Retail Trade | 207 (39.2%) | 321 (60.8%) |
| Transportation & Warehousing | 130 (48.3%) | 139 (51.7%) |
| Utilities | 0 (0.0%) | 0 (0.0%) |
| Information | 94 (69.6%) | 41 (30.4%) |
| Finance & Insurance | 46 (22.6%) | 158 (77.4%) |
| Real Estate, Rental & Leasing | 17 (100.0%) | 0 (0.0%) |
| Professional & Scientific | 71 (78.9%) | 19 (21.1%) |
| Enterprise Management | 0 (0.0%) | 0 (0.0%) |
| Administrative & Support | 162 (94.7%) | 9 (5.3%) |
| Educational Services | 48 (18.0%) | 219 (82.0%) |
| Health Care & Social Assistance | 73 (8.6%) | 781 (91.4%) |
| Arts, Entertainment & Recreation | 133 (92.4%) | 11 (7.6%) |
| Accommodation & Food Services | 440 (40.1%) | 657 (59.9%) |
| Public Administration | 63 (43.4%) | 82 (56.6%) |
| Total | 3,348 (51.5%) | 3,157 (48.5%) |
Education in Salem
School Enrollment in Salem
The most common levels of schooling among the 2,295 students in Salem are middle school (557 | 24.3%), college / undergraduate (462 | 20.1%), and elementary school (456 | 19.9%).
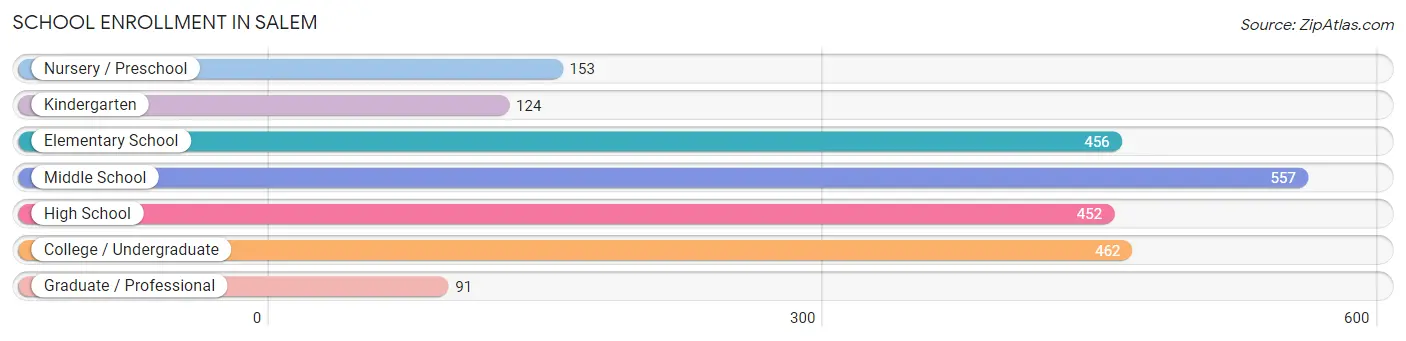
| School Level | # Students | % Students |
| Nursery / Preschool | 153 | 6.7% |
| Kindergarten | 124 | 5.4% |
| Elementary School | 456 | 19.9% |
| Middle School | 557 | 24.3% |
| High School | 452 | 19.7% |
| College / Undergraduate | 462 | 20.1% |
| Graduate / Professional | 91 | 4.0% |
| Total | 2,295 | 100.0% |
School Enrollment by Age by Funding Source in Salem
Out of a total of 2,295 students who are enrolled in schools in Salem, 308 (13.4%) attend a private institution, while the remaining 1,987 (86.6%) are enrolled in public schools. The age group of 35 years and over has the highest likelihood of being enrolled in private schools, with 142 (67.6% in the age bracket) enrolled. Conversely, the age group of 15 to 17 year olds has the lowest likelihood of being enrolled in a private school, with 403 (100.0% in the age bracket) attending a public institution.
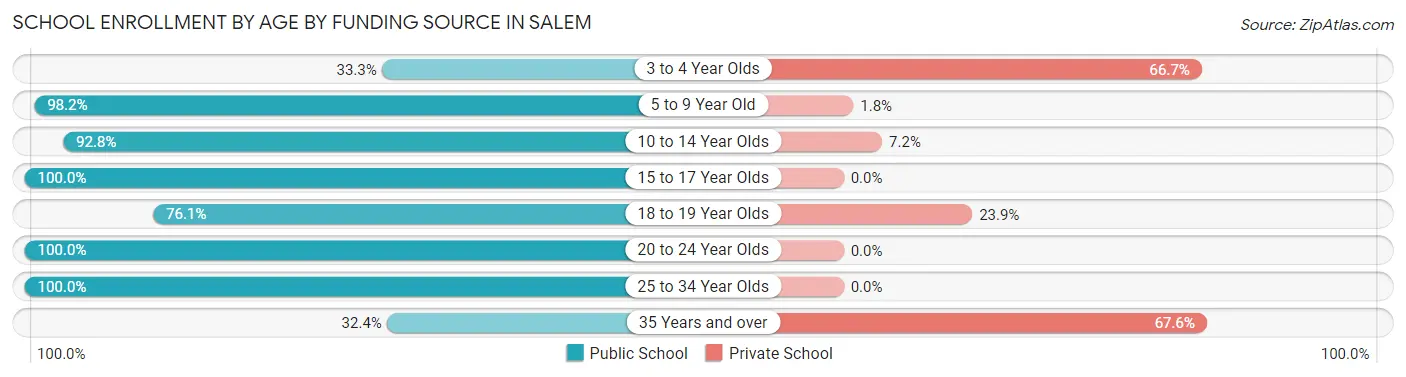
| Age Bracket | Public School | Private School |
| 3 to 4 Year Olds | 31 (33.3%) | 62 (66.7%) |
| 5 to 9 Year Old | 600 (98.2%) | 11 (1.8%) |
| 10 to 14 Year Olds | 544 (92.8%) | 42 (7.2%) |
| 15 to 17 Year Olds | 403 (100.0%) | 0 (0.0%) |
| 18 to 19 Year Olds | 162 (76.1%) | 51 (23.9%) |
| 20 to 24 Year Olds | 112 (100.0%) | 0 (0.0%) |
| 25 to 34 Year Olds | 67 (100.0%) | 0 (0.0%) |
| 35 Years and over | 68 (32.4%) | 142 (67.6%) |
| Total | 1,987 (86.6%) | 308 (13.4%) |
Educational Attainment by Field of Study in Salem
Business (447 | 25.8%), education (364 | 21.0%), science & technology (251 | 14.5%), liberal arts & history (151 | 8.7%), and arts & humanities (128 | 7.4%) are the most common fields of study among 1,732 individuals in Salem who have obtained a bachelor's degree or higher.
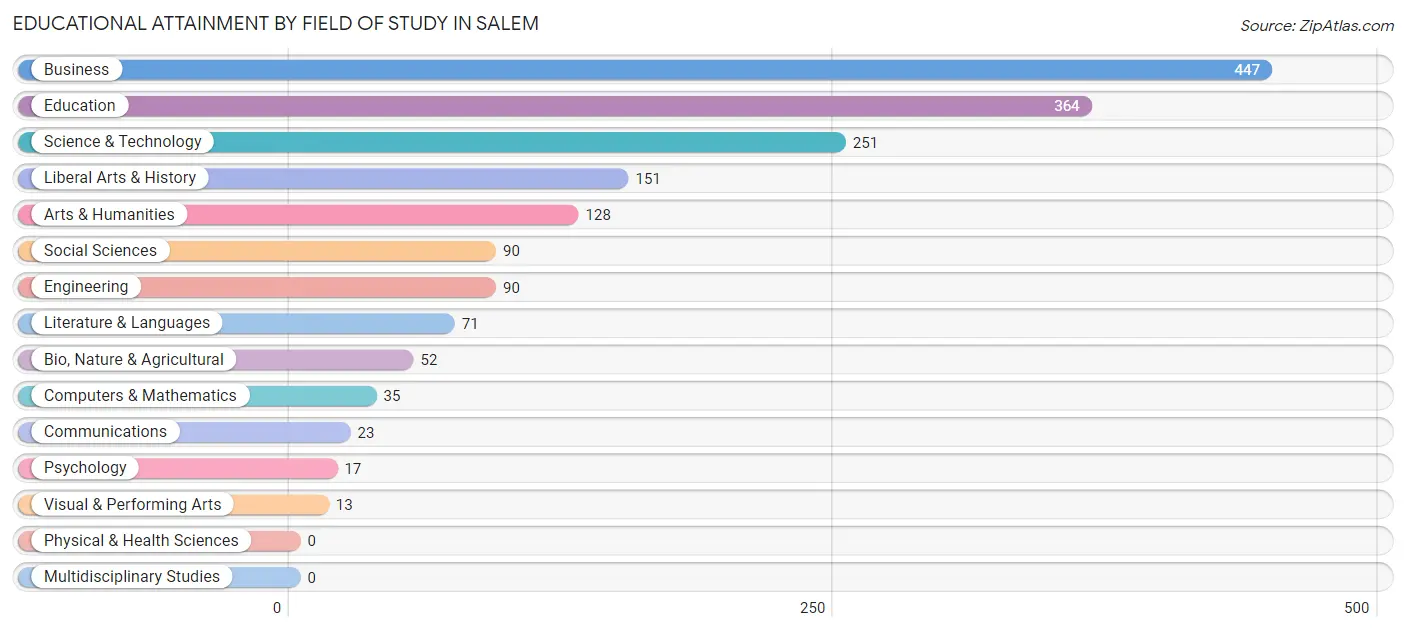
| Field of Study | # Graduates | % Graduates |
| Computers & Mathematics | 35 | 2.0% |
| Bio, Nature & Agricultural | 52 | 3.0% |
| Physical & Health Sciences | 0 | 0.0% |
| Psychology | 17 | 1.0% |
| Social Sciences | 90 | 5.2% |
| Engineering | 90 | 5.2% |
| Multidisciplinary Studies | 0 | 0.0% |
| Science & Technology | 251 | 14.5% |
| Business | 447 | 25.8% |
| Education | 364 | 21.0% |
| Literature & Languages | 71 | 4.1% |
| Liberal Arts & History | 151 | 8.7% |
| Visual & Performing Arts | 13 | 0.7% |
| Communications | 23 | 1.3% |
| Arts & Humanities | 128 | 7.4% |
| Total | 1,732 | 100.0% |
Transportation & Commute in Salem
Vehicle Availability by Sex in Salem
The most prevalent vehicle ownership categories in Salem are males with 2 vehicles (1,098, accounting for 33.2%) and females with 2 vehicles (1,064, making up 34.8%).
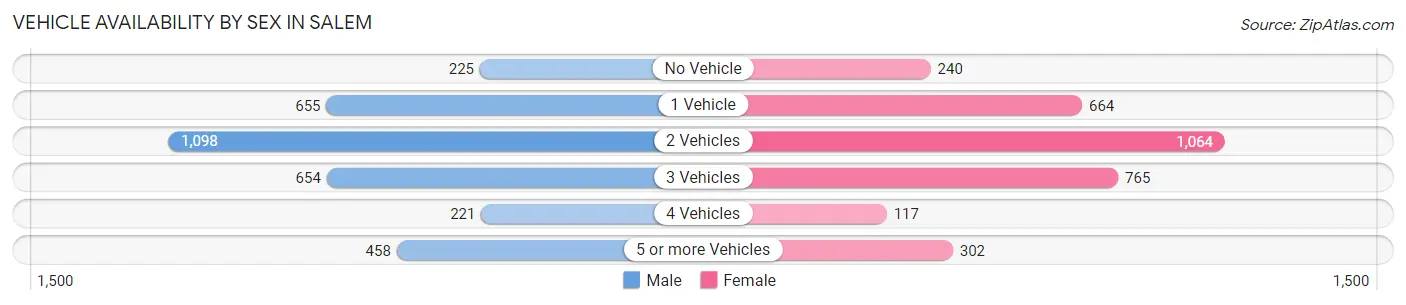
| Vehicles Available | Male | Female |
| No Vehicle | 225 (6.8%) | 240 (7.6%) |
| 1 Vehicle | 655 (19.8%) | 664 (21.1%) |
| 2 Vehicles | 1,098 (33.2%) | 1,064 (33.8%) |
| 3 Vehicles | 654 (19.8%) | 765 (24.3%) |
| 4 Vehicles | 221 (6.7%) | 117 (3.7%) |
| 5 or more Vehicles | 458 (13.8%) | 302 (9.6%) |
| Total | 3,311 (100.0%) | 3,152 (100.0%) |
Commute Time in Salem
The most frequently occuring commute durations in Salem are 5 to 9 minutes (1,864 commuters, 29.8%), 10 to 14 minutes (1,055 commuters, 16.8%), and 20 to 24 minutes (578 commuters, 9.2%).
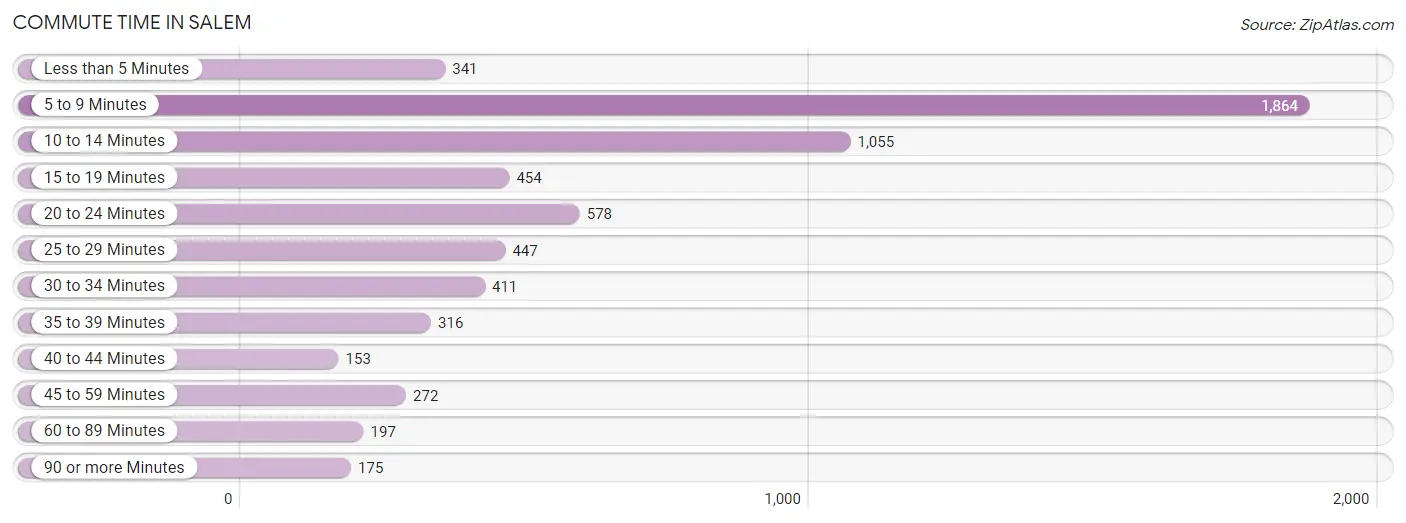
| Commute Time | # Commuters | % Commuters |
| Less than 5 Minutes | 341 | 5.4% |
| 5 to 9 Minutes | 1,864 | 29.8% |
| 10 to 14 Minutes | 1,055 | 16.8% |
| 15 to 19 Minutes | 454 | 7.2% |
| 20 to 24 Minutes | 578 | 9.2% |
| 25 to 29 Minutes | 447 | 7.1% |
| 30 to 34 Minutes | 411 | 6.6% |
| 35 to 39 Minutes | 316 | 5.1% |
| 40 to 44 Minutes | 153 | 2.4% |
| 45 to 59 Minutes | 272 | 4.3% |
| 60 to 89 Minutes | 197 | 3.2% |
| 90 or more Minutes | 175 | 2.8% |
Commute Time by Sex in Salem
The most common commute times in Salem are 5 to 9 minutes (1,001 commuters, 31.2%) for males and 5 to 9 minutes (863 commuters, 28.2%) for females.
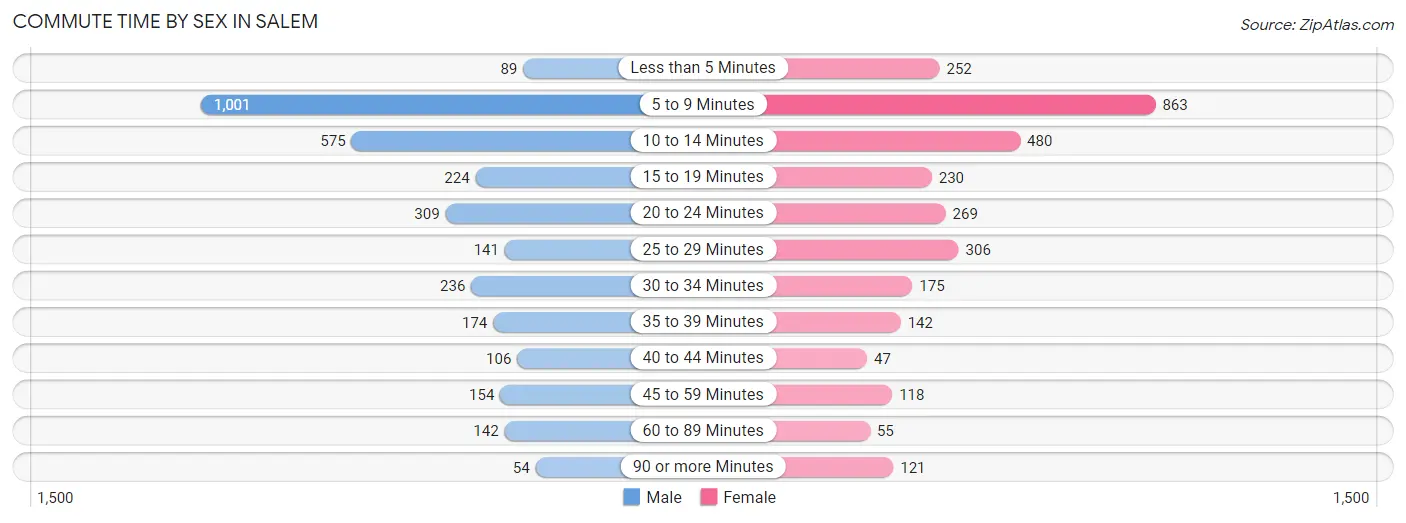
| Commute Time | Male | Female |
| Less than 5 Minutes | 89 (2.8%) | 252 (8.2%) |
| 5 to 9 Minutes | 1,001 (31.2%) | 863 (28.2%) |
| 10 to 14 Minutes | 575 (17.9%) | 480 (15.7%) |
| 15 to 19 Minutes | 224 (7.0%) | 230 (7.5%) |
| 20 to 24 Minutes | 309 (9.6%) | 269 (8.8%) |
| 25 to 29 Minutes | 141 (4.4%) | 306 (10.0%) |
| 30 to 34 Minutes | 236 (7.4%) | 175 (5.7%) |
| 35 to 39 Minutes | 174 (5.4%) | 142 (4.6%) |
| 40 to 44 Minutes | 106 (3.3%) | 47 (1.5%) |
| 45 to 59 Minutes | 154 (4.8%) | 118 (3.9%) |
| 60 to 89 Minutes | 142 (4.4%) | 55 (1.8%) |
| 90 or more Minutes | 54 (1.7%) | 121 (4.0%) |
Time of Departure to Work by Sex in Salem
The most frequent times of departure to work in Salem are 4:00 PM to 11:59 PM (463, 14.4%) for males and 5:30 AM to 5:59 AM (388, 12.7%) for females.
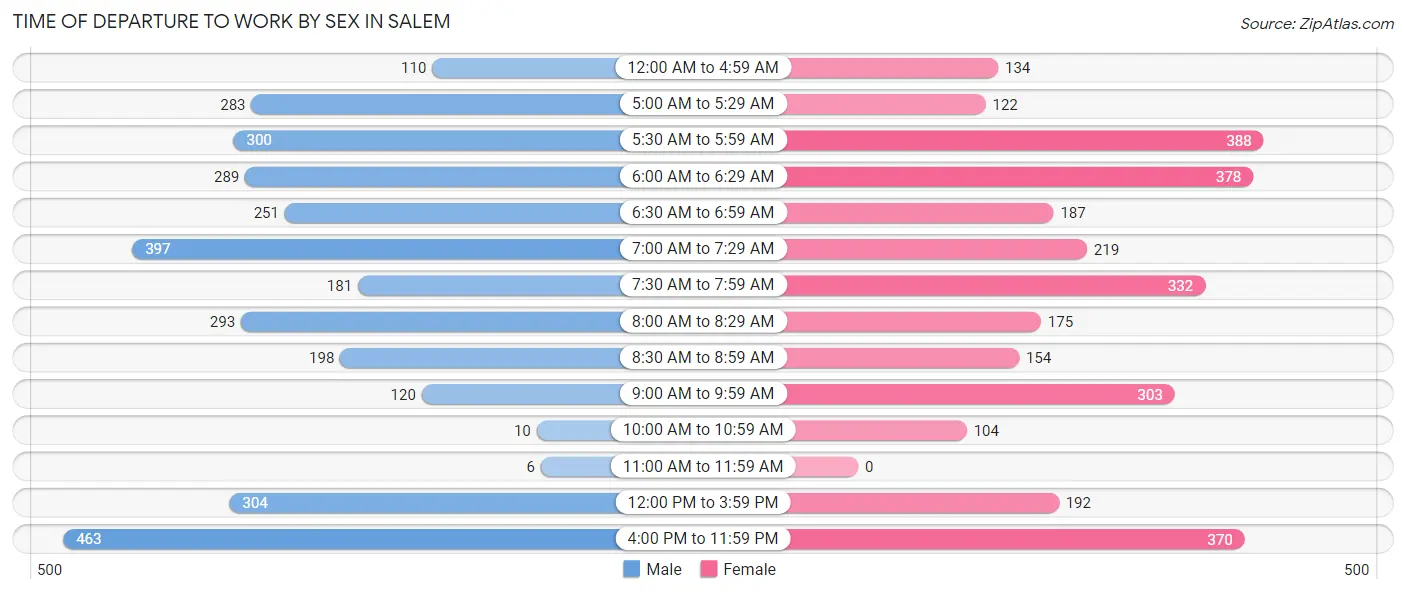
| Time of Departure | Male | Female |
| 12:00 AM to 4:59 AM | 110 (3.4%) | 134 (4.4%) |
| 5:00 AM to 5:29 AM | 283 (8.8%) | 122 (4.0%) |
| 5:30 AM to 5:59 AM | 300 (9.4%) | 388 (12.7%) |
| 6:00 AM to 6:29 AM | 289 (9.0%) | 378 (12.4%) |
| 6:30 AM to 6:59 AM | 251 (7.8%) | 187 (6.1%) |
| 7:00 AM to 7:29 AM | 397 (12.4%) | 219 (7.2%) |
| 7:30 AM to 7:59 AM | 181 (5.7%) | 332 (10.9%) |
| 8:00 AM to 8:29 AM | 293 (9.1%) | 175 (5.7%) |
| 8:30 AM to 8:59 AM | 198 (6.2%) | 154 (5.0%) |
| 9:00 AM to 9:59 AM | 120 (3.7%) | 303 (9.9%) |
| 10:00 AM to 10:59 AM | 10 (0.3%) | 104 (3.4%) |
| 11:00 AM to 11:59 AM | 6 (0.2%) | 0 (0.0%) |
| 12:00 PM to 3:59 PM | 304 (9.5%) | 192 (6.3%) |
| 4:00 PM to 11:59 PM | 463 (14.4%) | 370 (12.1%) |
| Total | 3,205 (100.0%) | 3,058 (100.0%) |
Housing Occupancy in Salem
Occupancy by Ownership in Salem
Of the total 5,185 dwellings in Salem, owner-occupied units account for 3,067 (59.2%), while renter-occupied units make up 2,118 (40.8%).
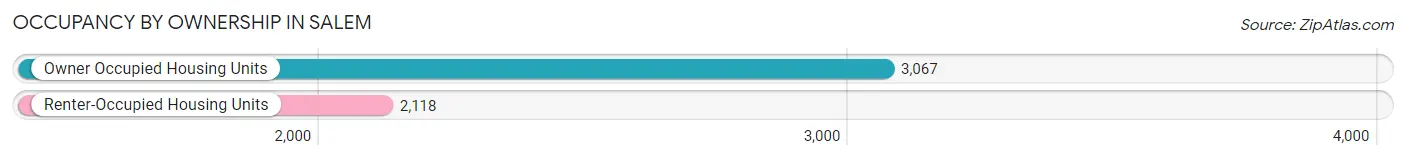
| Occupancy | # Housing Units | % Housing Units |
| Owner Occupied Housing Units | 3,067 | 59.2% |
| Renter-Occupied Housing Units | 2,118 | 40.8% |
| Total Occupied Housing Units | 5,185 | 100.0% |
Occupancy by Household Size in Salem
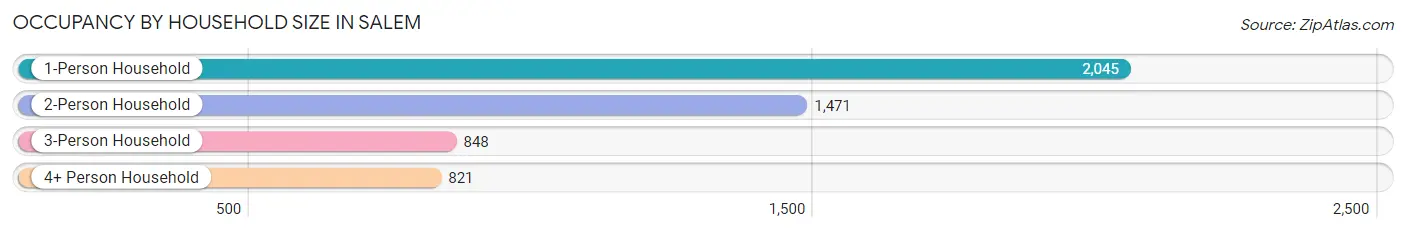
| Household Size | # Housing Units | % Housing Units |
| 1-Person Household | 2,045 | 39.4% |
| 2-Person Household | 1,471 | 28.4% |
| 3-Person Household | 848 | 16.4% |
| 4+ Person Household | 821 | 15.8% |
| Total Housing Units | 5,185 | 100.0% |
Occupancy by Ownership by Household Size in Salem
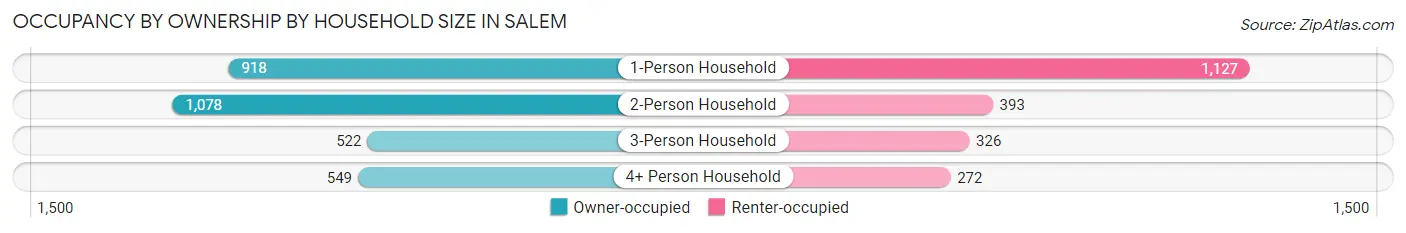
| Household Size | Owner-occupied | Renter-occupied |
| 1-Person Household | 918 (44.9%) | 1,127 (55.1%) |
| 2-Person Household | 1,078 (73.3%) | 393 (26.7%) |
| 3-Person Household | 522 (61.6%) | 326 (38.4%) |
| 4+ Person Household | 549 (66.9%) | 272 (33.1%) |
| Total Housing Units | 3,067 (59.2%) | 2,118 (40.8%) |
Occupancy by Educational Attainment in Salem
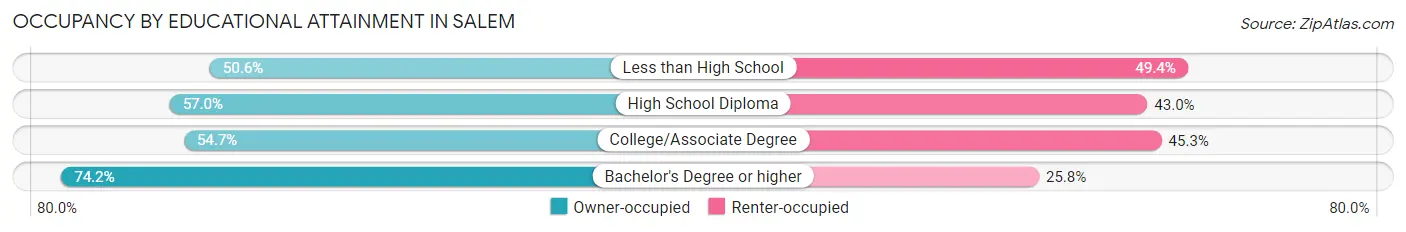
| Household Size | Owner-occupied | Renter-occupied |
| Less than High School | 255 (50.6%) | 249 (49.4%) |
| High School Diploma | 1,326 (57.0%) | 1,001 (43.0%) |
| College/Associate Degree | 731 (54.7%) | 605 (45.3%) |
| Bachelor's Degree or higher | 755 (74.2%) | 263 (25.8%) |
Occupancy by Age of Householder in Salem
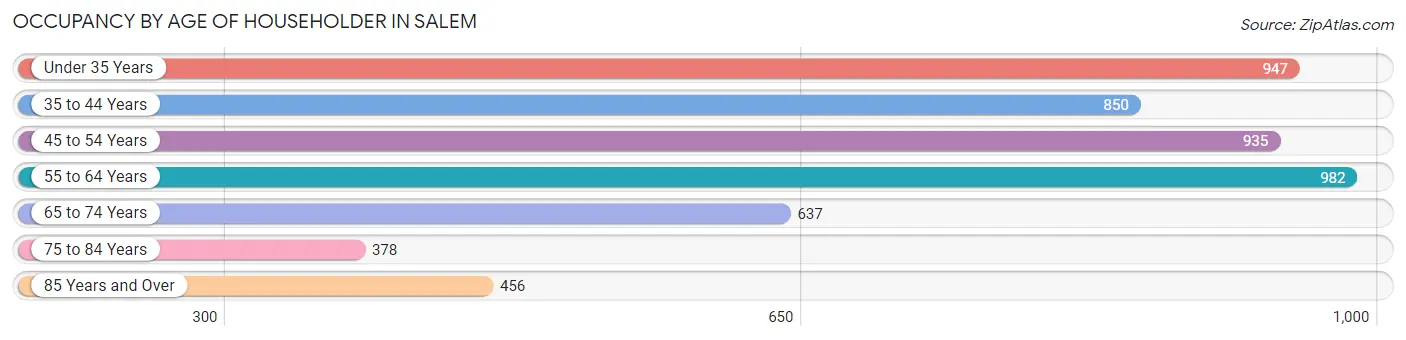
| Age Bracket | # Households | % Households |
| Under 35 Years | 947 | 18.3% |
| 35 to 44 Years | 850 | 16.4% |
| 45 to 54 Years | 935 | 18.0% |
| 55 to 64 Years | 982 | 18.9% |
| 65 to 74 Years | 637 | 12.3% |
| 75 to 84 Years | 378 | 7.3% |
| 85 Years and Over | 456 | 8.8% |
| Total | 5,185 | 100.0% |
Housing Finances in Salem
Median Income by Occupancy in Salem
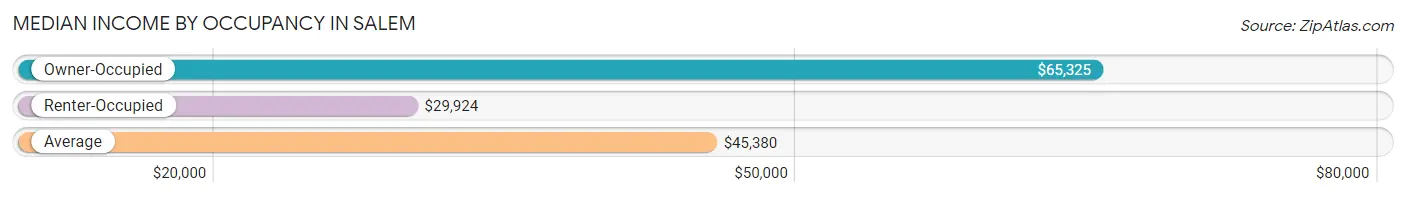
| Occupancy Type | # Households | Median Income |
| Owner-Occupied | 3,067 (59.2%) | $65,325 |
| Renter-Occupied | 2,118 (40.8%) | $29,924 |
| Average | 5,185 (100.0%) | $45,380 |
Occupancy by Householder Income Bracket in Salem
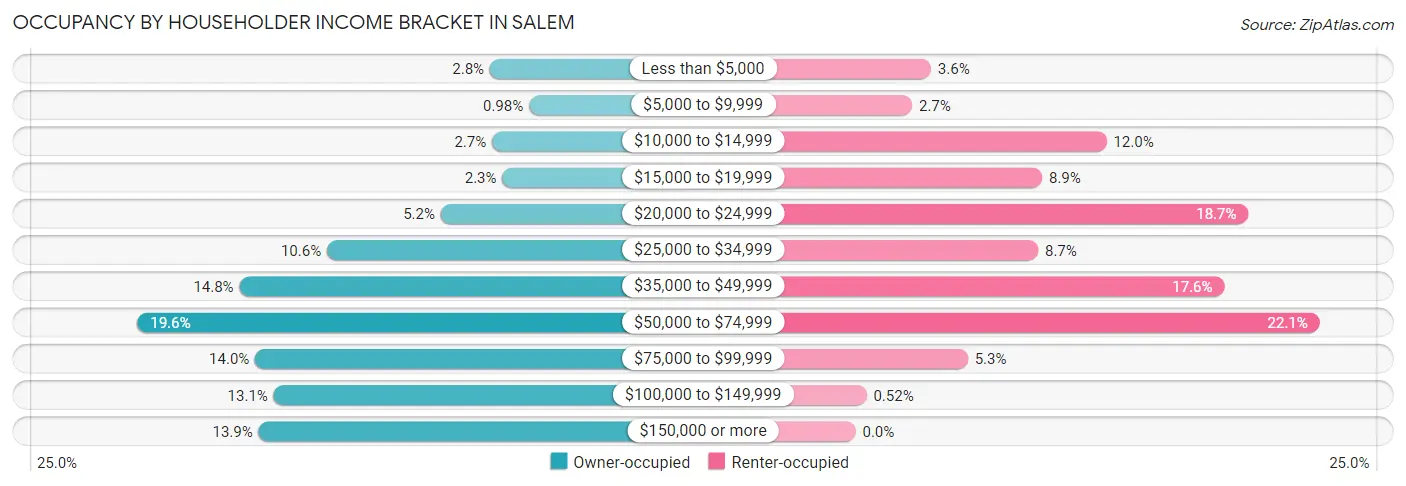
| Income Bracket | Owner-occupied | Renter-occupied |
| Less than $5,000 | 87 (2.8%) | 76 (3.6%) |
| $5,000 to $9,999 | 30 (1.0%) | 57 (2.7%) |
| $10,000 to $14,999 | 84 (2.7%) | 253 (11.9%) |
| $15,000 to $19,999 | 69 (2.2%) | 188 (8.9%) |
| $20,000 to $24,999 | 159 (5.2%) | 396 (18.7%) |
| $25,000 to $34,999 | 325 (10.6%) | 184 (8.7%) |
| $35,000 to $49,999 | 453 (14.8%) | 372 (17.6%) |
| $50,000 to $74,999 | 602 (19.6%) | 468 (22.1%) |
| $75,000 to $99,999 | 430 (14.0%) | 113 (5.3%) |
| $100,000 to $149,999 | 403 (13.1%) | 11 (0.5%) |
| $150,000 or more | 425 (13.9%) | 0 (0.0%) |
| Total | 3,067 (100.0%) | 2,118 (100.0%) |
Monthly Housing Cost Tiers in Salem
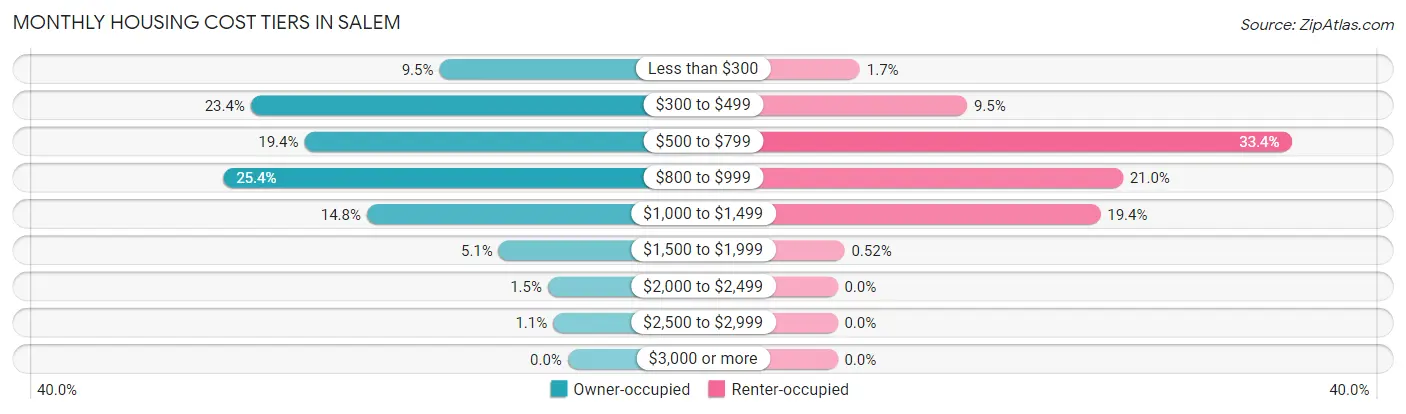
| Monthly Cost | Owner-occupied | Renter-occupied |
| Less than $300 | 290 (9.5%) | 35 (1.7%) |
| $300 to $499 | 716 (23.4%) | 202 (9.5%) |
| $500 to $799 | 595 (19.4%) | 708 (33.4%) |
| $800 to $999 | 778 (25.4%) | 445 (21.0%) |
| $1,000 to $1,499 | 454 (14.8%) | 410 (19.4%) |
| $1,500 to $1,999 | 156 (5.1%) | 11 (0.5%) |
| $2,000 to $2,499 | 45 (1.5%) | 0 (0.0%) |
| $2,500 to $2,999 | 33 (1.1%) | 0 (0.0%) |
| $3,000 or more | 0 (0.0%) | 0 (0.0%) |
| Total | 3,067 (100.0%) | 2,118 (100.0%) |
Physical Housing Characteristics in Salem
Housing Structures in Salem
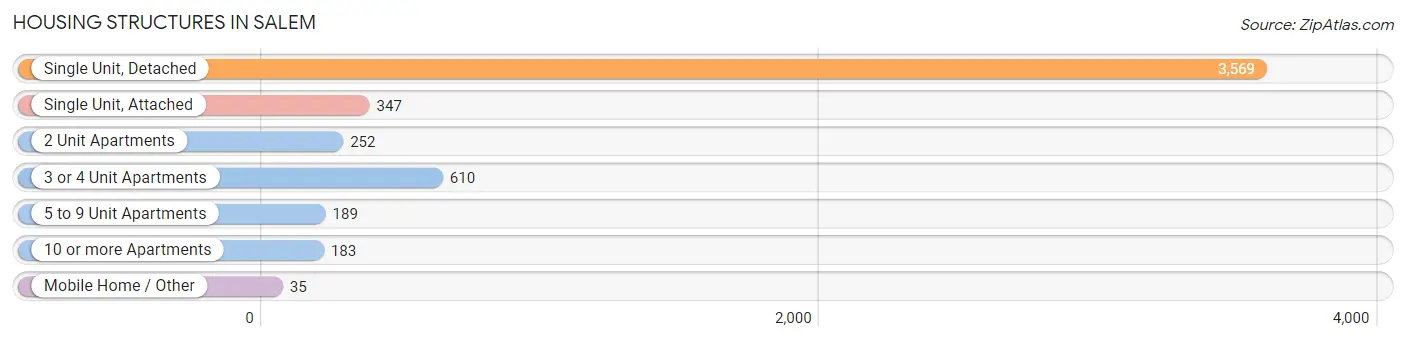
| Structure Type | # Housing Units | % Housing Units |
| Single Unit, Detached | 3,569 | 68.8% |
| Single Unit, Attached | 347 | 6.7% |
| 2 Unit Apartments | 252 | 4.9% |
| 3 or 4 Unit Apartments | 610 | 11.8% |
| 5 to 9 Unit Apartments | 189 | 3.6% |
| 10 or more Apartments | 183 | 3.5% |
| Mobile Home / Other | 35 | 0.7% |
| Total | 5,185 | 100.0% |
Housing Structures by Occupancy in Salem
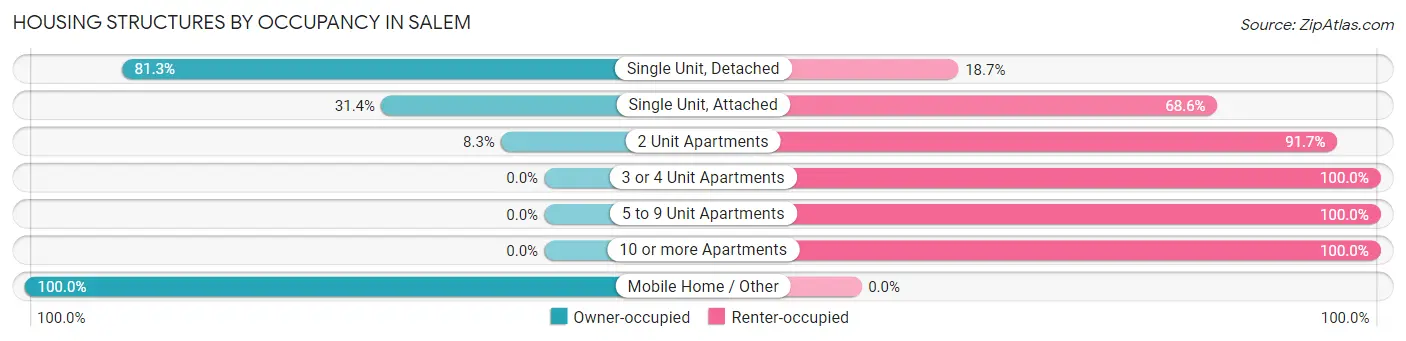
| Structure Type | Owner-occupied | Renter-occupied |
| Single Unit, Detached | 2,902 (81.3%) | 667 (18.7%) |
| Single Unit, Attached | 109 (31.4%) | 238 (68.6%) |
| 2 Unit Apartments | 21 (8.3%) | 231 (91.7%) |
| 3 or 4 Unit Apartments | 0 (0.0%) | 610 (100.0%) |
| 5 to 9 Unit Apartments | 0 (0.0%) | 189 (100.0%) |
| 10 or more Apartments | 0 (0.0%) | 183 (100.0%) |
| Mobile Home / Other | 35 (100.0%) | 0 (0.0%) |
| Total | 3,067 (59.2%) | 2,118 (40.8%) |
Housing Structures by Number of Rooms in Salem
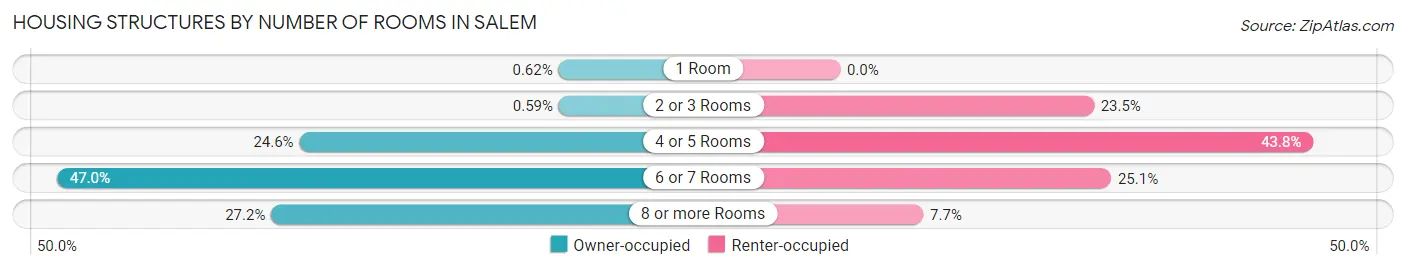
| Number of Rooms | Owner-occupied | Renter-occupied |
| 1 Room | 19 (0.6%) | 0 (0.0%) |
| 2 or 3 Rooms | 18 (0.6%) | 497 (23.5%) |
| 4 or 5 Rooms | 754 (24.6%) | 927 (43.8%) |
| 6 or 7 Rooms | 1,442 (47.0%) | 531 (25.1%) |
| 8 or more Rooms | 834 (27.2%) | 163 (7.7%) |
| Total | 3,067 (100.0%) | 2,118 (100.0%) |
Housing Structure by Heating Type in Salem
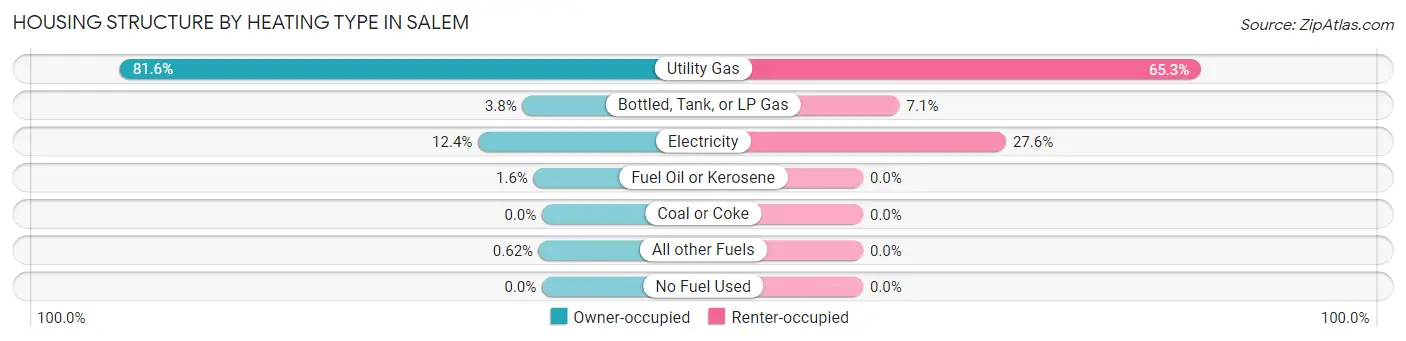
| Heating Type | Owner-occupied | Renter-occupied |
| Utility Gas | 2,503 (81.6%) | 1,383 (65.3%) |
| Bottled, Tank, or LP Gas | 116 (3.8%) | 150 (7.1%) |
| Electricity | 379 (12.4%) | 585 (27.6%) |
| Fuel Oil or Kerosene | 50 (1.6%) | 0 (0.0%) |
| Coal or Coke | 0 (0.0%) | 0 (0.0%) |
| All other Fuels | 19 (0.6%) | 0 (0.0%) |
| No Fuel Used | 0 (0.0%) | 0 (0.0%) |
| Total | 3,067 (100.0%) | 2,118 (100.0%) |
Household Vehicle Usage in Salem
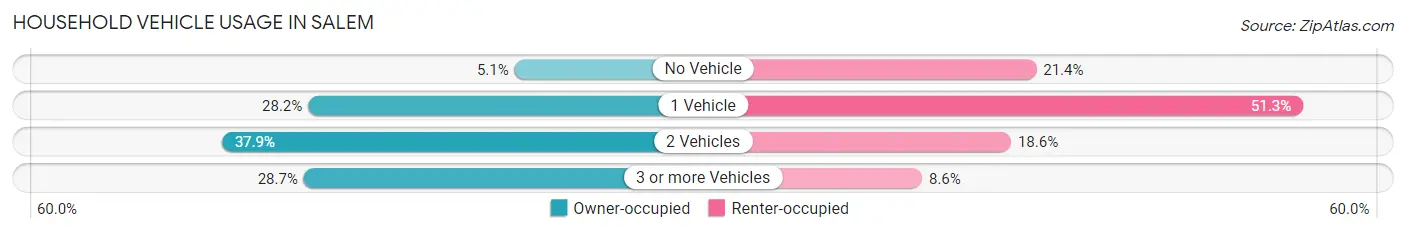
| Vehicles per Household | Owner-occupied | Renter-occupied |
| No Vehicle | 157 (5.1%) | 454 (21.4%) |
| 1 Vehicle | 866 (28.2%) | 1,087 (51.3%) |
| 2 Vehicles | 1,163 (37.9%) | 394 (18.6%) |
| 3 or more Vehicles | 881 (28.7%) | 183 (8.6%) |
| Total | 3,067 (100.0%) | 2,118 (100.0%) |
Real Estate & Mortgages in Salem
Real Estate and Mortgage Overview in Salem
| Characteristic | Without Mortgage | With Mortgage |
| Housing Units | 1,187 | 1,880 |
| Median Property Value | $119,000 | $112,400 |
| Median Household Income | $44,425 | $308 |
| Monthly Housing Costs | $402 | $0 |
| Real Estate Taxes | $1,185 | $78 |
Property Value by Mortgage Status in Salem
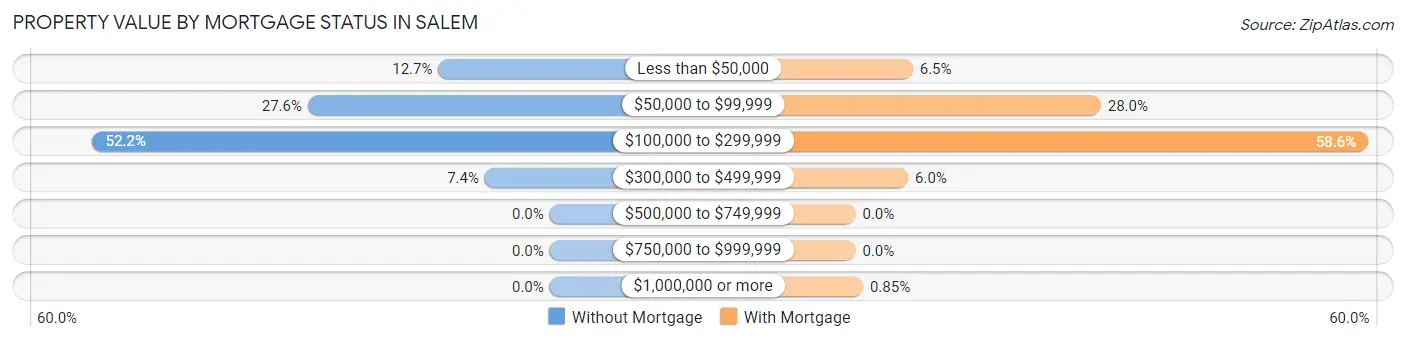
| Property Value | Without Mortgage | With Mortgage |
| Less than $50,000 | 151 (12.7%) | 123 (6.5%) |
| $50,000 to $99,999 | 328 (27.6%) | 527 (28.0%) |
| $100,000 to $299,999 | 620 (52.2%) | 1,101 (58.6%) |
| $300,000 to $499,999 | 88 (7.4%) | 113 (6.0%) |
| $500,000 to $749,999 | 0 (0.0%) | 0 (0.0%) |
| $750,000 to $999,999 | 0 (0.0%) | 0 (0.0%) |
| $1,000,000 or more | 0 (0.0%) | 16 (0.9%) |
| Total | 1,187 (100.0%) | 1,880 (100.0%) |
Household Income by Mortgage Status in Salem
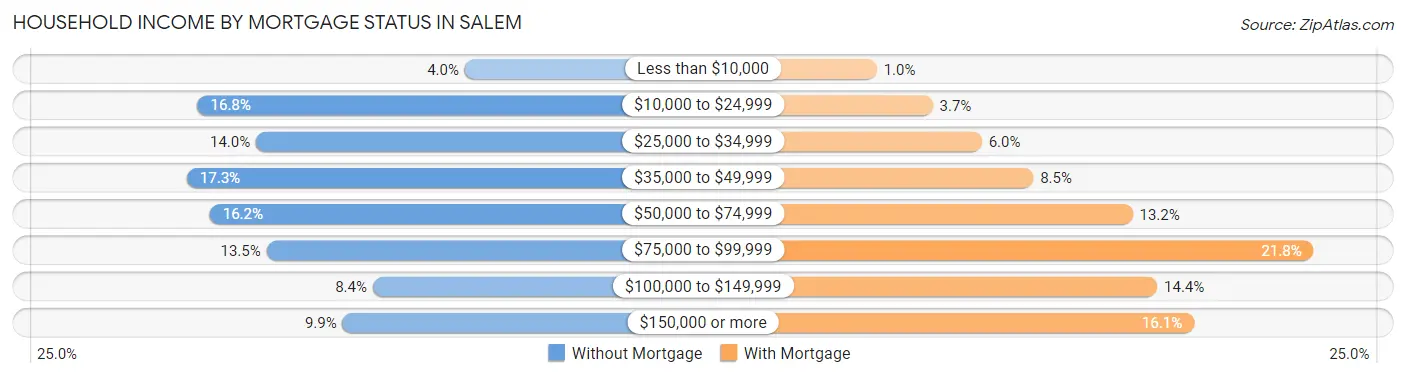
| Household Income | Without Mortgage | With Mortgage |
| Less than $10,000 | 48 (4.0%) | 19 (1.0%) |
| $10,000 to $24,999 | 199 (16.8%) | 69 (3.7%) |
| $25,000 to $34,999 | 166 (14.0%) | 113 (6.0%) |
| $35,000 to $49,999 | 205 (17.3%) | 159 (8.5%) |
| $50,000 to $74,999 | 192 (16.2%) | 248 (13.2%) |
| $75,000 to $99,999 | 160 (13.5%) | 410 (21.8%) |
| $100,000 to $149,999 | 100 (8.4%) | 270 (14.4%) |
| $150,000 or more | 117 (9.9%) | 303 (16.1%) |
| Total | 1,187 (100.0%) | 1,880 (100.0%) |
Property Value to Household Income Ratio in Salem
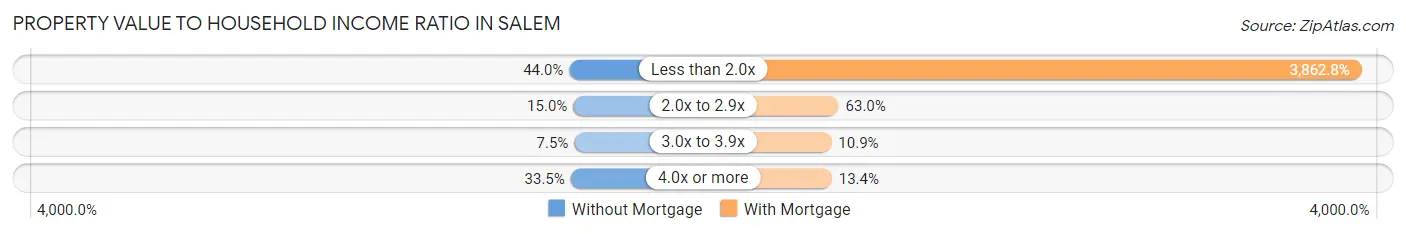
| Value-to-Income Ratio | Without Mortgage | With Mortgage |
| Less than 2.0x | 522 (44.0%) | 72,621 (3,862.8%) |
| 2.0x to 2.9x | 178 (15.0%) | 1,185 (63.0%) |
| 3.0x to 3.9x | 89 (7.5%) | 204 (10.8%) |
| 4.0x or more | 398 (33.5%) | 251 (13.4%) |
| Total | 1,187 (100.0%) | 1,880 (100.0%) |
Real Estate Taxes by Mortgage Status in Salem
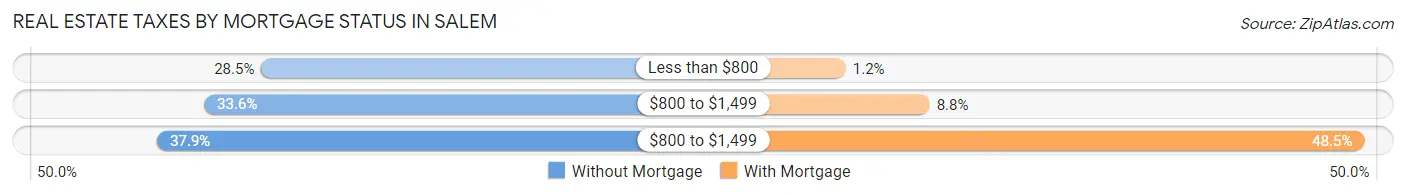
| Property Taxes | Without Mortgage | With Mortgage |
| Less than $800 | 338 (28.5%) | 22 (1.2%) |
| $800 to $1,499 | 399 (33.6%) | 166 (8.8%) |
| $800 to $1,499 | 450 (37.9%) | 912 (48.5%) |
| Total | 1,187 (100.0%) | 1,880 (100.0%) |
Health & Disability in Salem
Health Insurance Coverage by Age in Salem
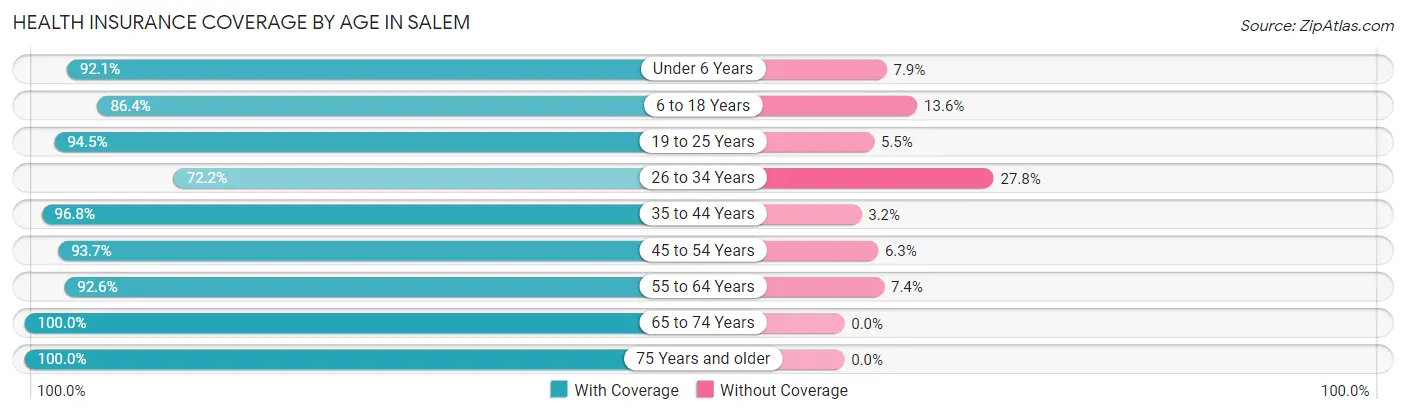
| Age Bracket | With Coverage | Without Coverage |
| Under 6 Years | 503 (92.1%) | 43 (7.9%) |
| 6 to 18 Years | 1,450 (86.4%) | 228 (13.6%) |
| 19 to 25 Years | 1,385 (94.5%) | 81 (5.5%) |
| 26 to 34 Years | 936 (72.2%) | 361 (27.8%) |
| 35 to 44 Years | 1,373 (96.8%) | 45 (3.2%) |
| 45 to 54 Years | 1,403 (93.7%) | 94 (6.3%) |
| 55 to 64 Years | 1,437 (92.6%) | 115 (7.4%) |
| 65 to 74 Years | 1,061 (100.0%) | 0 (0.0%) |
| 75 Years and older | 1,055 (100.0%) | 0 (0.0%) |
| Total | 10,603 (91.6%) | 967 (8.4%) |
Health Insurance Coverage by Citizenship Status in Salem
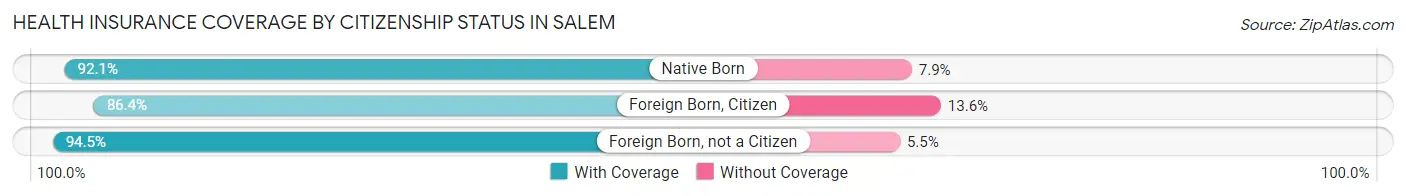
| Citizenship Status | With Coverage | Without Coverage |
| Native Born | 503 (92.1%) | 43 (7.9%) |
| Foreign Born, Citizen | 1,450 (86.4%) | 228 (13.6%) |
| Foreign Born, not a Citizen | 1,385 (94.5%) | 81 (5.5%) |
Health Insurance Coverage by Household Income in Salem
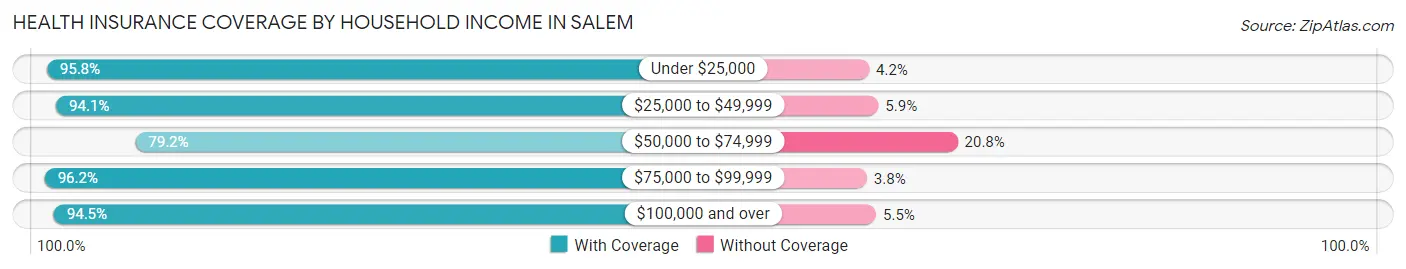
| Household Income | With Coverage | Without Coverage |
| Under $25,000 | 2,131 (95.8%) | 93 (4.2%) |
| $25,000 to $49,999 | 2,130 (94.1%) | 134 (5.9%) |
| $50,000 to $74,999 | 1,962 (79.2%) | 514 (20.8%) |
| $75,000 to $99,999 | 1,685 (96.2%) | 66 (3.8%) |
| $100,000 and over | 2,667 (94.5%) | 155 (5.5%) |
Public vs Private Health Insurance Coverage by Age in Salem
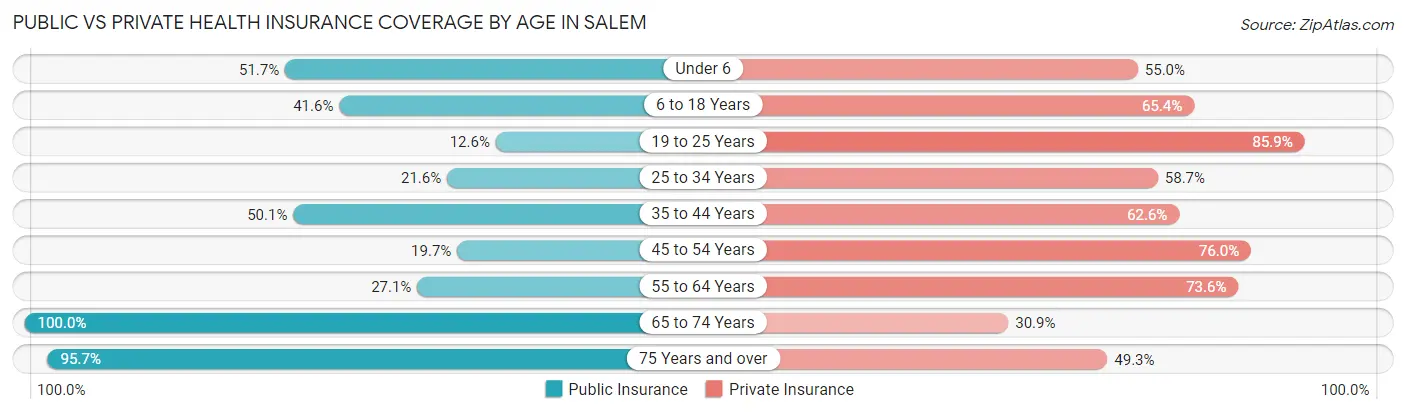
| Age Bracket | Public Insurance | Private Insurance |
| Under 6 | 282 (51.6%) | 300 (54.9%) |
| 6 to 18 Years | 698 (41.6%) | 1,097 (65.4%) |
| 19 to 25 Years | 184 (12.6%) | 1,259 (85.9%) |
| 25 to 34 Years | 280 (21.6%) | 761 (58.7%) |
| 35 to 44 Years | 711 (50.1%) | 888 (62.6%) |
| 45 to 54 Years | 295 (19.7%) | 1,137 (75.9%) |
| 55 to 64 Years | 421 (27.1%) | 1,142 (73.6%) |
| 65 to 74 Years | 1,061 (100.0%) | 328 (30.9%) |
| 75 Years and over | 1,010 (95.7%) | 520 (49.3%) |
| Total | 4,942 (42.7%) | 7,432 (64.2%) |
Disability Status by Sex by Age in Salem
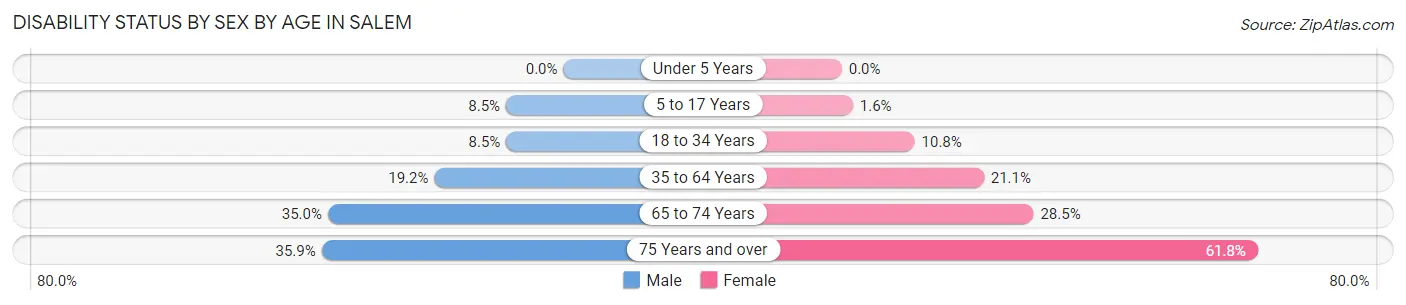
| Age Bracket | Male | Female |
| Under 5 Years | 0 (0.0%) | 0 (0.0%) |
| 5 to 17 Years | 69 (8.5%) | 13 (1.6%) |
| 18 to 34 Years | 128 (8.5%) | 155 (10.8%) |
| 35 to 64 Years | 418 (19.2%) | 482 (21.1%) |
| 65 to 74 Years | 156 (35.0%) | 175 (28.5%) |
| 75 Years and over | 116 (35.9%) | 452 (61.8%) |
Disability Class by Sex by Age in Salem
Disability Class: Hearing Difficulty
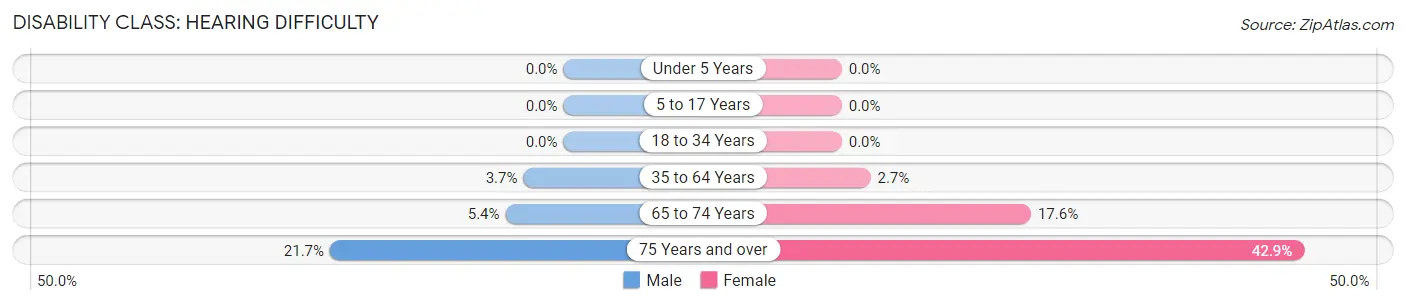
| Age Bracket | Male | Female |
| Under 5 Years | 0 (0.0%) | 0 (0.0%) |
| 5 to 17 Years | 0 (0.0%) | 0 (0.0%) |
| 18 to 34 Years | 0 (0.0%) | 0 (0.0%) |
| 35 to 64 Years | 81 (3.7%) | 61 (2.7%) |
| 65 to 74 Years | 24 (5.4%) | 108 (17.6%) |
| 75 Years and over | 70 (21.7%) | 314 (42.9%) |
Disability Class: Vision Difficulty
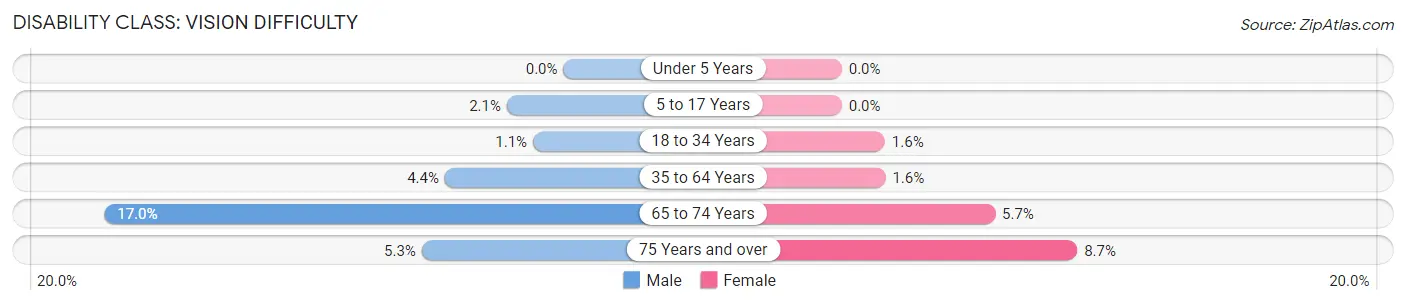
| Age Bracket | Male | Female |
| Under 5 Years | 0 (0.0%) | 0 (0.0%) |
| 5 to 17 Years | 17 (2.1%) | 0 (0.0%) |
| 18 to 34 Years | 17 (1.1%) | 23 (1.6%) |
| 35 to 64 Years | 96 (4.4%) | 37 (1.6%) |
| 65 to 74 Years | 76 (17.0%) | 35 (5.7%) |
| 75 Years and over | 17 (5.3%) | 64 (8.7%) |
Disability Class: Cognitive Difficulty
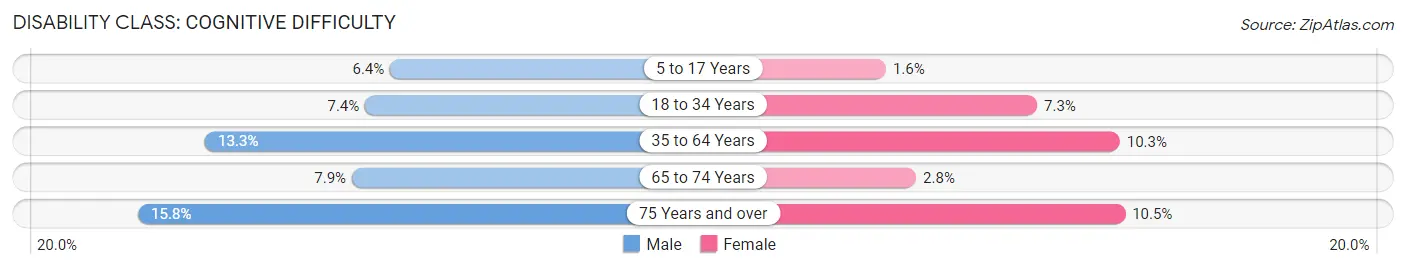
| Age Bracket | Male | Female |
| 5 to 17 Years | 52 (6.4%) | 13 (1.6%) |
| 18 to 34 Years | 111 (7.4%) | 104 (7.2%) |
| 35 to 64 Years | 290 (13.3%) | 236 (10.3%) |
| 65 to 74 Years | 35 (7.9%) | 17 (2.8%) |
| 75 Years and over | 51 (15.8%) | 77 (10.5%) |
Disability Class: Ambulatory Difficulty
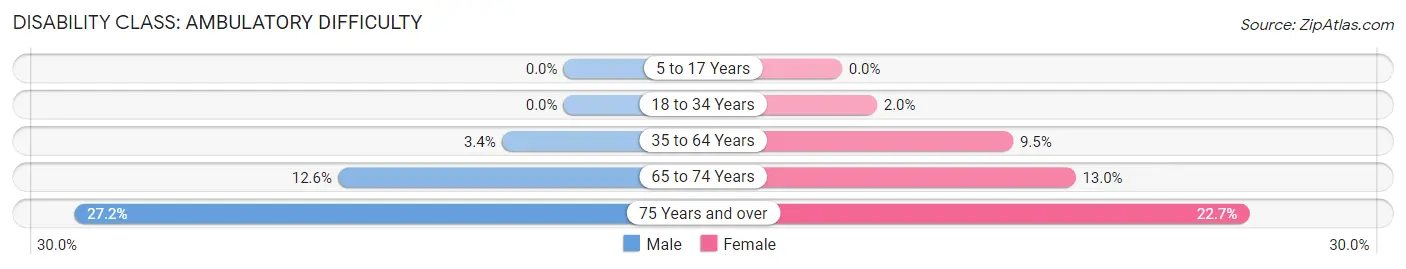
| Age Bracket | Male | Female |
| 5 to 17 Years | 0 (0.0%) | 0 (0.0%) |
| 18 to 34 Years | 0 (0.0%) | 28 (1.9%) |
| 35 to 64 Years | 75 (3.4%) | 218 (9.5%) |
| 65 to 74 Years | 56 (12.6%) | 80 (13.0%) |
| 75 Years and over | 88 (27.2%) | 166 (22.7%) |
Disability Class: Self-Care Difficulty
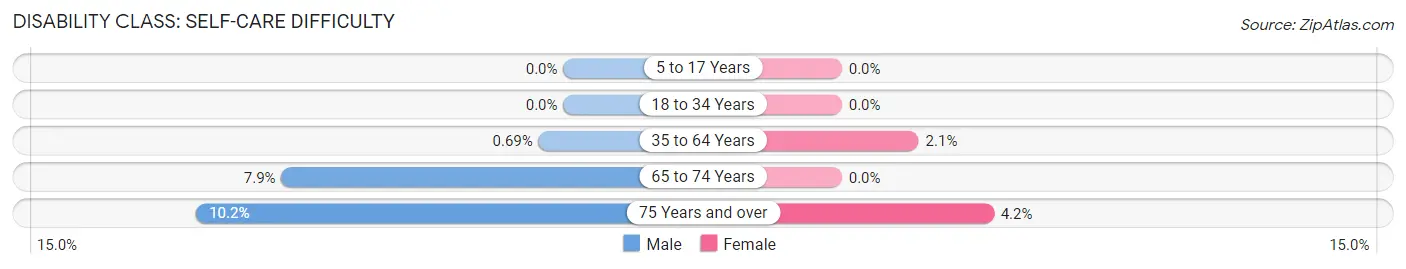
| Age Bracket | Male | Female |
| 5 to 17 Years | 0 (0.0%) | 0 (0.0%) |
| 18 to 34 Years | 0 (0.0%) | 0 (0.0%) |
| 35 to 64 Years | 15 (0.7%) | 49 (2.1%) |
| 65 to 74 Years | 35 (7.9%) | 0 (0.0%) |
| 75 Years and over | 33 (10.2%) | 31 (4.2%) |
Technology Access in Salem
Computing Device Access in Salem
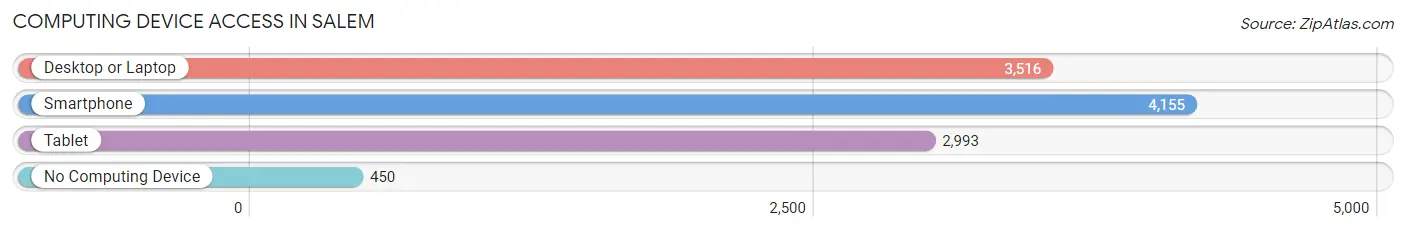
| Device Type | # Households | % Households |
| Desktop or Laptop | 3,516 | 67.8% |
| Smartphone | 4,155 | 80.1% |
| Tablet | 2,993 | 57.7% |
| No Computing Device | 450 | 8.7% |
| Total | 5,185 | 100.0% |
Internet Access in Salem
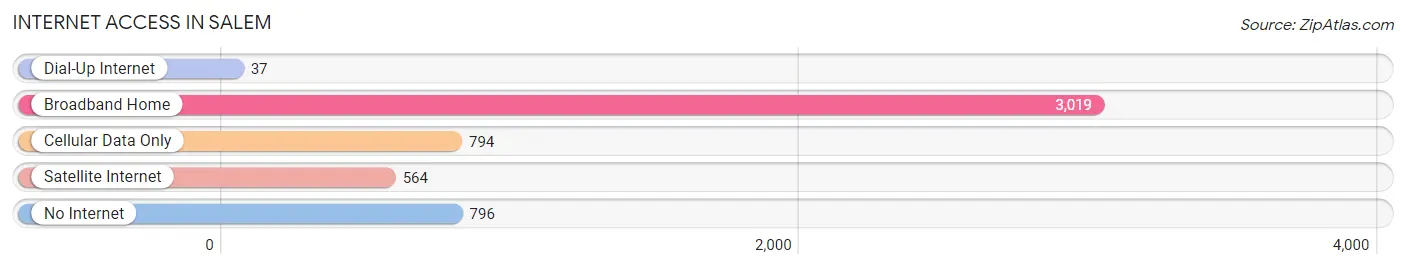
| Internet Type | # Households | % Households |
| Dial-Up Internet | 37 | 0.7% |
| Broadband Home | 3,019 | 58.2% |
| Cellular Data Only | 794 | 15.3% |
| Satellite Internet | 564 | 10.9% |
| No Internet | 796 | 15.3% |
| Total | 5,185 | 100.0% |
Salem Summary
Salem, Ohio is a city located in the northeastern part of the state, in Columbiana County. It is situated along the banks of the Mahoning River, and is part of the greater Youngstown-Warren-Boardman metropolitan area. The city has a population of 12,303, according to the 2010 census, and is the county seat of Columbiana County.
History
The area that is now Salem was first settled in 1806 by a group of Quakers from Salem, New Jersey. The town was originally known as “New Salem”, and was incorporated in 1837. The city was named after the Quakers’ hometown of Salem, New Jersey.
The city was an important stop on the Underground Railroad, and was home to several prominent abolitionists, including John Brown and William Lloyd Garrison. During the Civil War, Salem was a major supplier of food and supplies to the Union Army.
In the late 19th century, Salem became an important industrial center, with several factories producing glass, pottery, and other products. The city was also home to several oil refineries, and was a major producer of coal.
Geography
Salem is located in northeastern Ohio, in Columbiana County. It is situated along the banks of the Mahoning River, and is part of the greater Youngstown-Warren-Boardman metropolitan area. The city has a total area of 5.3 square miles, all of which is land.
The city is located in the Appalachian Plateau region of Ohio, and is characterized by rolling hills and valleys. The climate is humid continental, with hot summers and cold winters.
Economy
Salem’s economy is largely based on manufacturing and services. The city is home to several factories, including a glass plant, a pottery plant, and several oil refineries. The city is also home to several retail stores, restaurants, and other businesses.
The city is also home to several educational institutions, including Kent State University at Salem, and the Salem Campus of the University of Akron.
Demographics
According to the 2010 census, Salem has a population of 12,303. The racial makeup of the city is 87.3% White, 8.2% African American, 0.4% Native American, 0.7% Asian, 0.1% Pacific Islander, and 2.3% from other races. The median household income is $35,945, and the median family income is $45,945.
The city has a large Quaker population, and is home to several Quaker churches. The city is also home to several Catholic churches, as well as several Protestant churches.
Conclusion
Salem, Ohio is a city located in the northeastern part of the state, in Columbiana County. It is situated along the banks of the Mahoning River, and is part of the greater Youngstown-Warren-Boardman metropolitan area. The city has a population of 12,303, according to the 2010 census, and is the county seat of Columbiana County. The city has a long history, and was an important stop on the Underground Railroad. The city’s economy is largely based on manufacturing and services, and the city is home to several educational institutions. The city has a large Quaker population, and is home to several churches.
Common Questions
What is Per Capita Income in Salem?
Per Capita income in Salem is $28,769.
What is the Median Family Income in Salem?
Median Family Income in Salem is $66,181.
What is the Median Household income in Salem?
Median Household Income in Salem is $45,380.
What is Income or Wage Gap in Salem?
Income or Wage Gap in Salem is 45.9%.
Women in Salem earn 54.1 cents for every dollar earned by a man.
What is Family Income Deficit in Salem?
Family Income Deficit in Salem is $10,726.
Families that are below poverty line in Salem earn $10,726 less on average than the poverty threshold level.
What is Inequality or Gini Index in Salem?
Inequality or Gini Index in Salem is 0.44.
What is the Total Population of Salem?
Total Population of Salem is 11,861.
What is the Total Male Population of Salem?
Total Male Population of Salem is 5,487.
What is the Total Female Population of Salem?
Total Female Population of Salem is 6,374.
What is the Ratio of Males per 100 Females in Salem?
There are 86.08 Males per 100 Females in Salem.
What is the Ratio of Females per 100 Males in Salem?
There are 116.17 Females per 100 Males in Salem.
What is the Median Population Age in Salem?
Median Population Age in Salem is 41.3 Years.
What is the Average Family Size in Salem
Average Family Size in Salem is 3.0 People.
What is the Average Household Size in Salem
Average Household Size in Salem is 2.2 People.
How Large is the Labor Force in Salem?
There are 6,809 People in the Labor Forcein in Salem.
What is the Percentage of People in the Labor Force in Salem?
67.4% of People are in the Labor Force in Salem.
What is the Unemployment Rate in Salem?
Unemployment Rate in Salem is 4.5%.