Rocky Fork Point, OH Map & Demographics
Rocky Fork Point Map
Rocky Fork Point Overview
$18,256
PER CAPITA INCOME
$51,349
AVG FAMILY INCOME
$34,386
AVG HOUSEHOLD INCOME
28.2%
WAGE / INCOME GAP [ % ]
71.8¢/ $1
WAGE / INCOME GAP [ $ ]
0.31
INEQUALITY / GINI INDEX
701
TOTAL POPULATION
342
MALE POPULATION
359
FEMALE POPULATION
95.26
MALES / 100 FEMALES
104.97
FEMALES / 100 MALES
50.3
MEDIAN AGE
3.1
AVG FAMILY SIZE
2.2
AVG HOUSEHOLD SIZE
250
LABOR FORCE [ PEOPLE ]
44.9%
PERCENT IN LABOR FORCE
Income in Rocky Fork Point
Income Overview in Rocky Fork Point
Per Capita Income in Rocky Fork Point is $18,256, while median incomes of families and households are $51,349 and $34,386 respectively.
| Characteristic | Number | Measure |
| Per Capita Income | 701 | $18,256 |
| Median Family Income | 185 | $51,349 |
| Mean Family Income | 185 | $49,272 |
| Median Household Income | 319 | $34,386 |
| Mean Household Income | 319 | $38,275 |
| Income Deficit | 185 | $0 |
| Wage / Income Gap (%) | 701 | 28.18% |
| Wage / Income Gap ($) | 701 | 71.82¢ per $1 |
| Gini / Inequality Index | 701 | 0.31 |
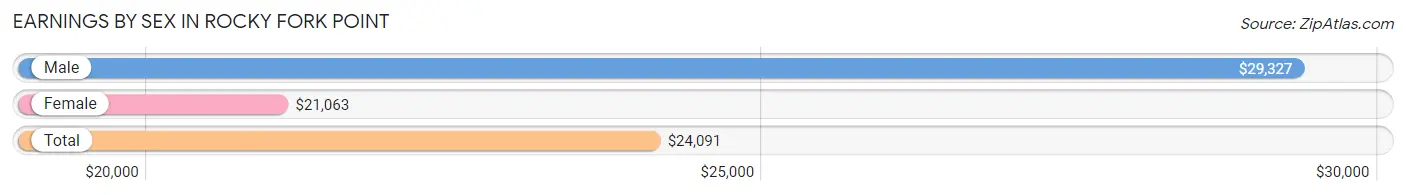
Earnings by Sex in Rocky Fork Point
Average Earnings in Rocky Fork Point are $24,091, $29,327 for men and $21,063 for women, a difference of 28.2%.
| Sex | Number | Average Earnings |
| Male | 133 (53.2%) | $29,327 |
| Female | 117 (46.8%) | $21,063 |
| Total | 250 (100.0%) | $24,091 |
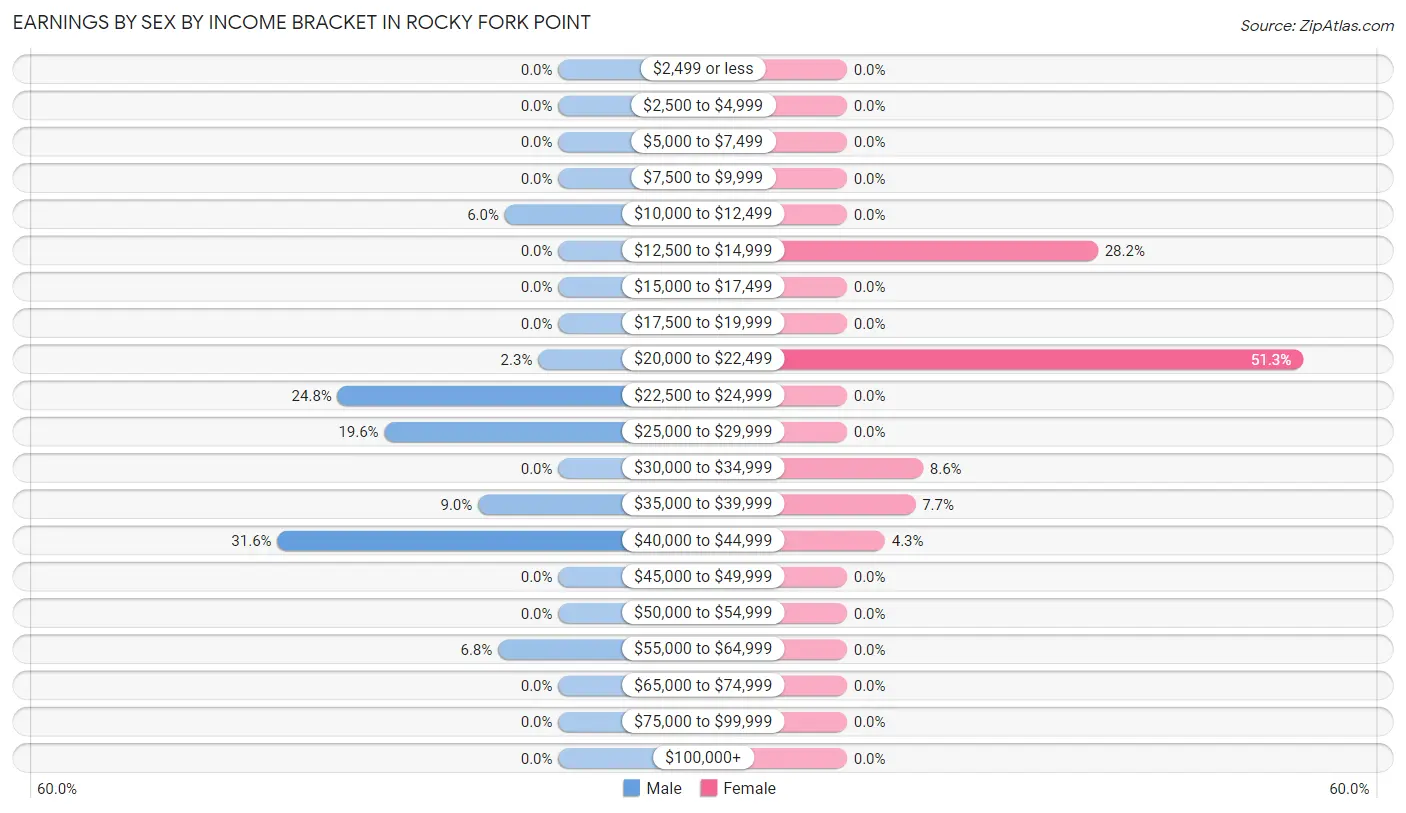
Earnings by Sex by Income Bracket in Rocky Fork Point
The most common earnings brackets in Rocky Fork Point are $40,000 to $44,999 for men (42 | 31.6%) and $20,000 to $22,499 for women (60 | 51.3%).
| Income | Male | Female |
| $2,499 or less | 0 (0.0%) | 0 (0.0%) |
| $2,500 to $4,999 | 0 (0.0%) | 0 (0.0%) |
| $5,000 to $7,499 | 0 (0.0%) | 0 (0.0%) |
| $7,500 to $9,999 | 0 (0.0%) | 0 (0.0%) |
| $10,000 to $12,499 | 8 (6.0%) | 0 (0.0%) |
| $12,500 to $14,999 | 0 (0.0%) | 33 (28.2%) |
| $15,000 to $17,499 | 0 (0.0%) | 0 (0.0%) |
| $17,500 to $19,999 | 0 (0.0%) | 0 (0.0%) |
| $20,000 to $22,499 | 3 (2.3%) | 60 (51.3%) |
| $22,500 to $24,999 | 33 (24.8%) | 0 (0.0%) |
| $25,000 to $29,999 | 26 (19.6%) | 0 (0.0%) |
| $30,000 to $34,999 | 0 (0.0%) | 10 (8.6%) |
| $35,000 to $39,999 | 12 (9.0%) | 9 (7.7%) |
| $40,000 to $44,999 | 42 (31.6%) | 5 (4.3%) |
| $45,000 to $49,999 | 0 (0.0%) | 0 (0.0%) |
| $50,000 to $54,999 | 0 (0.0%) | 0 (0.0%) |
| $55,000 to $64,999 | 9 (6.8%) | 0 (0.0%) |
| $65,000 to $74,999 | 0 (0.0%) | 0 (0.0%) |
| $75,000 to $99,999 | 0 (0.0%) | 0 (0.0%) |
| $100,000+ | 0 (0.0%) | 0 (0.0%) |
| Total | 133 (100.0%) | 117 (100.0%) |
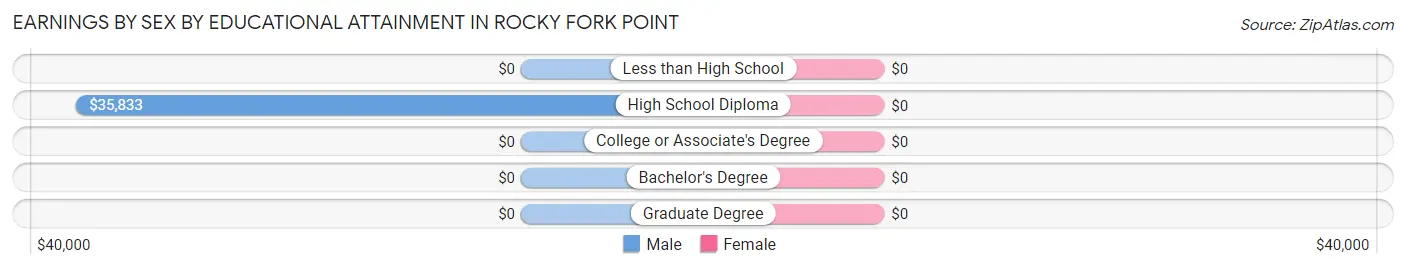
Earnings by Sex by Educational Attainment in Rocky Fork Point
| Educational Attainment | Male Income | Female Income |
| Less than High School | - | - |
| High School Diploma | $35,833 | $0 |
| College or Associate's Degree | - | - |
| Bachelor's Degree | - | - |
| Graduate Degree | - | - |
| Total | $29,327 | $20,817 |
Family Income in Rocky Fork Point
Family Income Brackets in Rocky Fork Point
According to the Rocky Fork Point family income data, there are 104 families falling into the $50,000 to $74,999 income range, which is the most common income bracket and makes up 56.2% of all families.
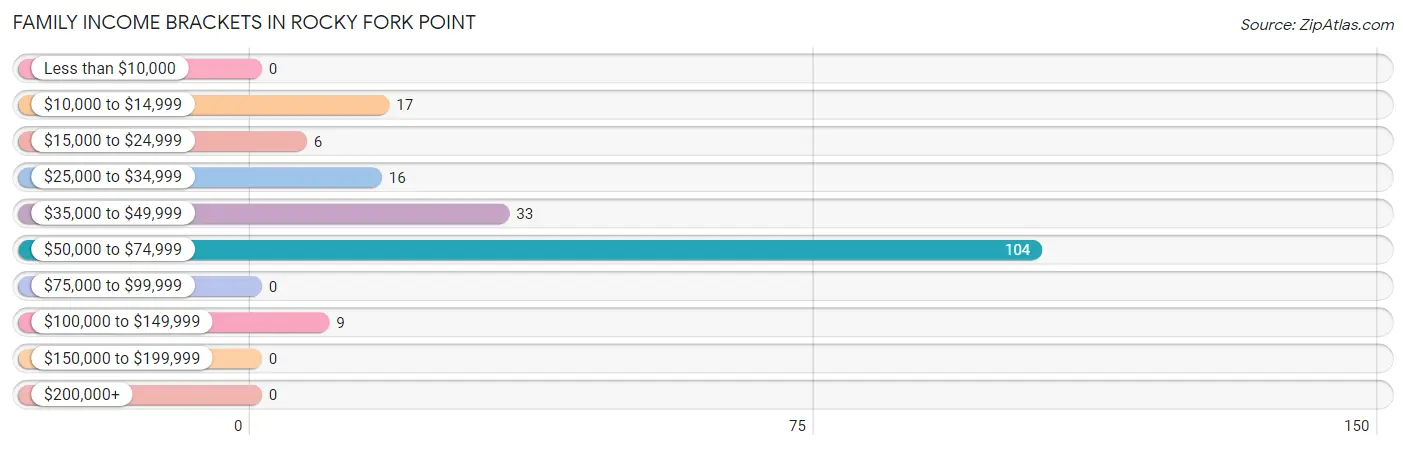
| Income Bracket | # Families | % Families |
| Less than $10,000 | 0 | 0.0% |
| $10,000 to $14,999 | 17 | 9.2% |
| $15,000 to $24,999 | 6 | 3.2% |
| $25,000 to $34,999 | 16 | 8.6% |
| $35,000 to $49,999 | 33 | 17.8% |
| $50,000 to $74,999 | 104 | 56.2% |
| $75,000 to $99,999 | 0 | 0.0% |
| $100,000 to $149,999 | 9 | 4.9% |
| $150,000 to $199,999 | 0 | 0.0% |
| $200,000+ | 0 | 0.0% |
Family Income by Famaliy Size in Rocky Fork Point
2-person families (87 | 47.0%) account for the highest median family income in Rocky Fork Point with $62,946 per family, while 2-person families (87 | 47.0%) have the highest median income of $31,473 per family member.
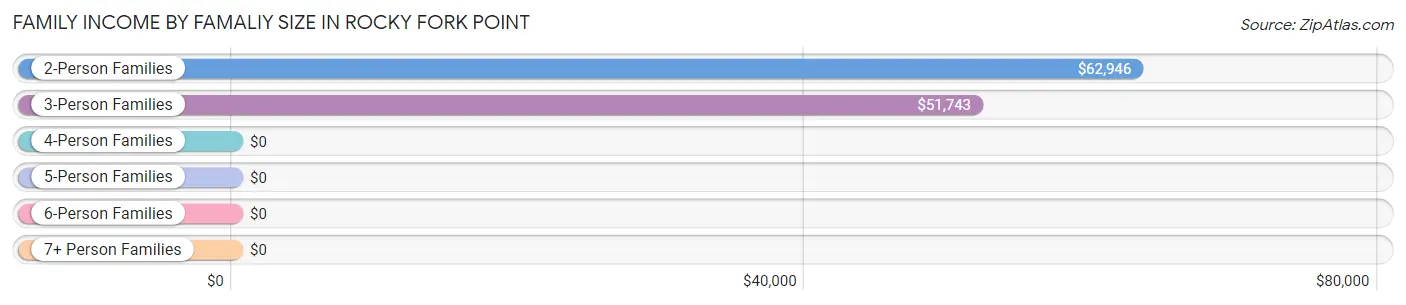
| Income Bracket | # Families | Median Income |
| 2-Person Families | 87 (47.0%) | $62,946 |
| 3-Person Families | 53 (28.6%) | $51,743 |
| 4-Person Families | 33 (17.8%) | $0 |
| 5-Person Families | 0 (0.0%) | $0 |
| 6-Person Families | 12 (6.5%) | $0 |
| 7+ Person Families | 0 (0.0%) | $0 |
| Total | 185 (100.0%) | $51,349 |
Family Income by Number of Earners in Rocky Fork Point
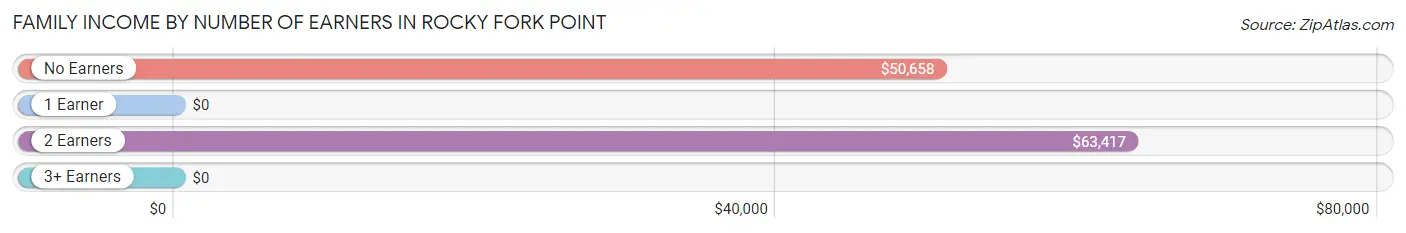
| Number of Earners | # Families | Median Income |
| No Earners | 74 (40.0%) | $50,658 |
| 1 Earner | 12 (6.5%) | $0 |
| 2 Earners | 99 (53.5%) | $63,417 |
| 3+ Earners | 0 (0.0%) | $0 |
| Total | 185 (100.0%) | $51,349 |
Household Income in Rocky Fork Point
Household Income Brackets in Rocky Fork Point
With 104 households falling in the category, the $50,000 to $74,999 income range is the most frequent in Rocky Fork Point, accounting for 32.6% of all households.
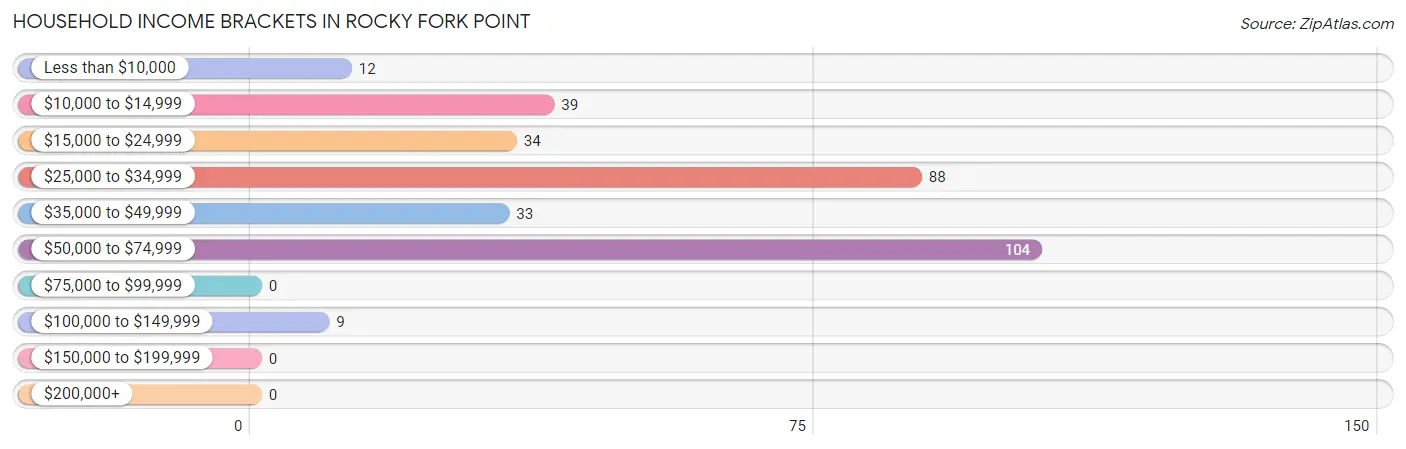
| Income Bracket | # Households | % Households |
| Less than $10,000 | 12 | 3.8% |
| $10,000 to $14,999 | 39 | 12.2% |
| $15,000 to $24,999 | 34 | 10.7% |
| $25,000 to $34,999 | 88 | 27.6% |
| $35,000 to $49,999 | 33 | 10.3% |
| $50,000 to $74,999 | 104 | 32.6% |
| $75,000 to $99,999 | 0 | 0.0% |
| $100,000 to $149,999 | 9 | 2.8% |
| $150,000 to $199,999 | 0 | 0.0% |
| $200,000+ | 0 | 0.0% |
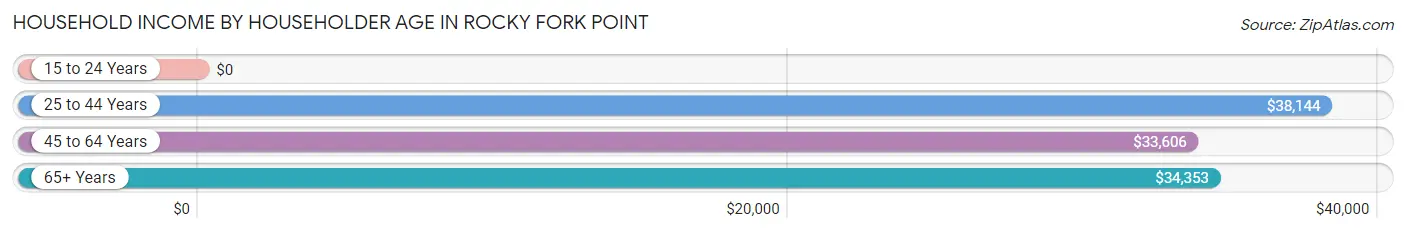
Household Income by Householder Age in Rocky Fork Point
The median household income in Rocky Fork Point is $34,386, with the highest median household income of $38,144 found in the 25 to 44 years age bracket for the primary householder. A total of 91 households (28.5%) fall into this category.
| Income Bracket | # Households | Median Income |
| 15 to 24 Years | 0 (0.0%) | $0 |
| 25 to 44 Years | 91 (28.5%) | $38,144 |
| 45 to 64 Years | 119 (37.3%) | $33,606 |
| 65+ Years | 109 (34.2%) | $34,353 |
| Total | 319 (100.0%) | $34,386 |
Poverty in Rocky Fork Point
Income Below Poverty by Sex and Age in Rocky Fork Point
With 21.3% poverty level for males and 18.7% for females among the residents of Rocky Fork Point, 12 to 14 year old males and 5 year old females are the most vulnerable to poverty, with 12 males (100.0%) and 13 females (100.0%) in their respective age groups living below the poverty level.
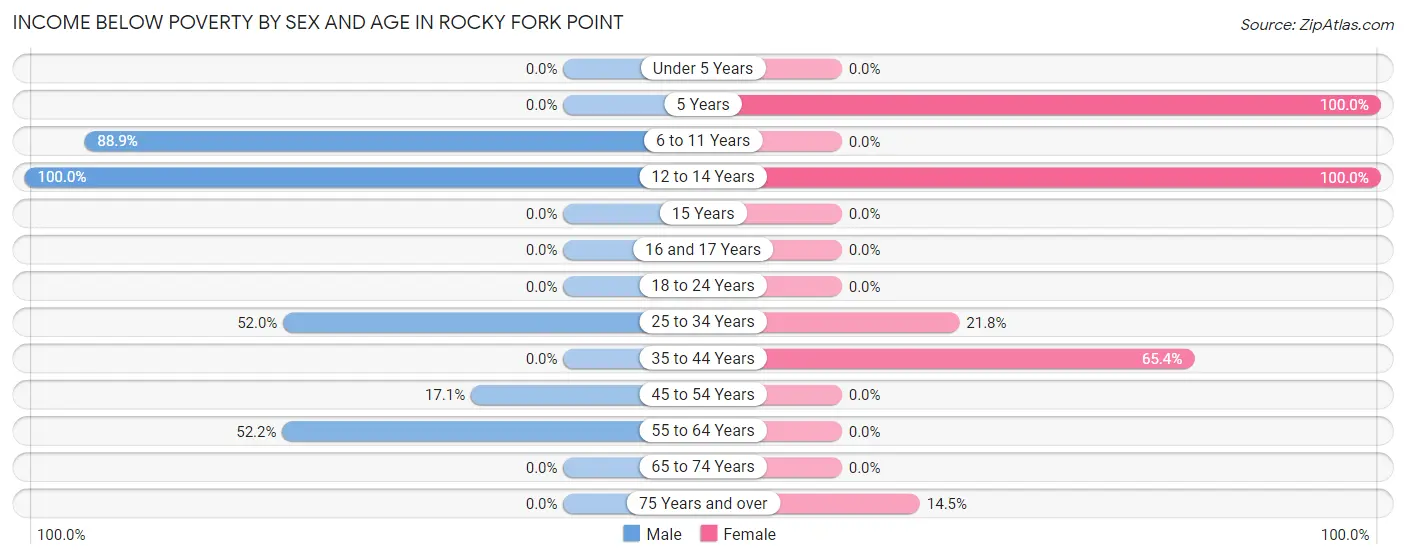
| Age Bracket | Male | Female |
| Under 5 Years | 0 (0.0%) | 0 (0.0%) |
| 5 Years | 0 (0.0%) | 13 (100.0%) |
| 6 to 11 Years | 24 (88.9%) | 0 (0.0%) |
| 12 to 14 Years | 12 (100.0%) | 15 (100.0%) |
| 15 Years | 0 (0.0%) | 0 (0.0%) |
| 16 and 17 Years | 0 (0.0%) | 0 (0.0%) |
| 18 to 24 Years | 0 (0.0%) | 0 (0.0%) |
| 25 to 34 Years | 13 (52.0%) | 12 (21.8%) |
| 35 to 44 Years | 0 (0.0%) | 17 (65.4%) |
| 45 to 54 Years | 12 (17.1%) | 0 (0.0%) |
| 55 to 64 Years | 12 (52.2%) | 0 (0.0%) |
| 65 to 74 Years | 0 (0.0%) | 0 (0.0%) |
| 75 Years and over | 0 (0.0%) | 10 (14.5%) |
| Total | 73 (21.3%) | 67 (18.7%) |
Income Above Poverty by Sex and Age in Rocky Fork Point
According to the poverty statistics in Rocky Fork Point, males aged under 5 years and females aged 6 to 11 years are the age groups that are most secure financially, with 100.0% of males and 100.0% of females in these age groups living above the poverty line.
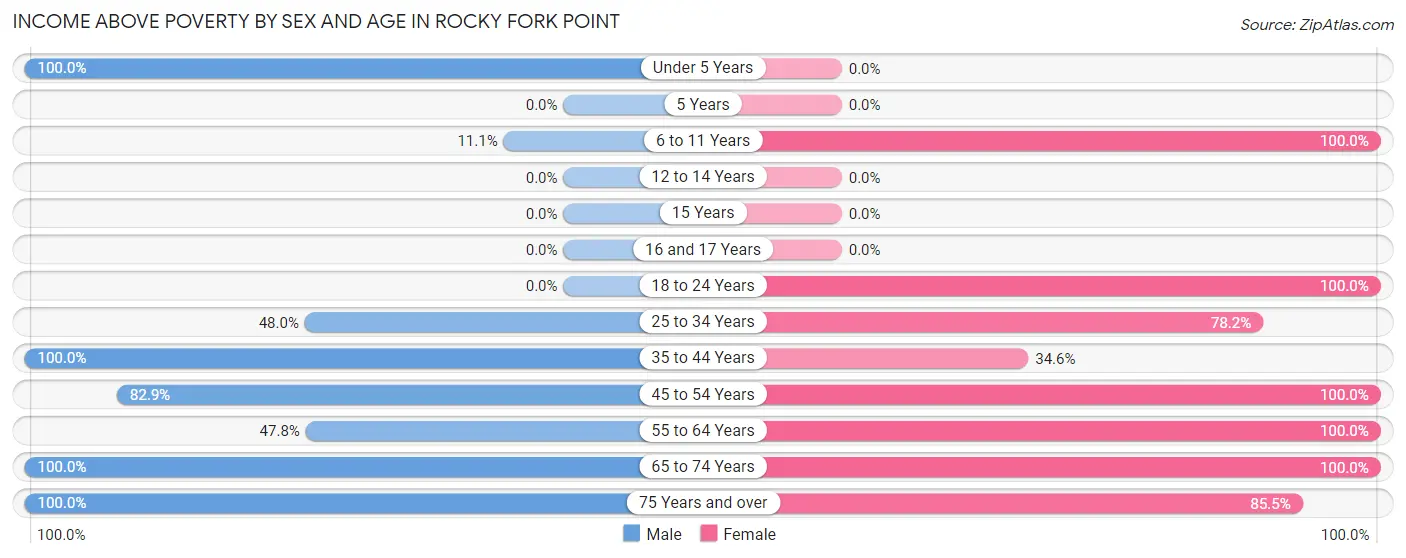
| Age Bracket | Male | Female |
| Under 5 Years | 24 (100.0%) | 0 (0.0%) |
| 5 Years | 0 (0.0%) | 0 (0.0%) |
| 6 to 11 Years | 3 (11.1%) | 53 (100.0%) |
| 12 to 14 Years | 0 (0.0%) | 0 (0.0%) |
| 15 Years | 0 (0.0%) | 0 (0.0%) |
| 16 and 17 Years | 0 (0.0%) | 0 (0.0%) |
| 18 to 24 Years | 0 (0.0%) | 34 (100.0%) |
| 25 to 34 Years | 12 (48.0%) | 43 (78.2%) |
| 35 to 44 Years | 50 (100.0%) | 9 (34.6%) |
| 45 to 54 Years | 58 (82.9%) | 5 (100.0%) |
| 55 to 64 Years | 11 (47.8%) | 80 (100.0%) |
| 65 to 74 Years | 67 (100.0%) | 9 (100.0%) |
| 75 Years and over | 44 (100.0%) | 59 (85.5%) |
| Total | 269 (78.6%) | 292 (81.3%) |
Income Below Poverty Among Married-Couple Families in Rocky Fork Point
The poverty statistics for married-couple families in Rocky Fork Point show that 13.6% or 12 of the total 88 families live below the poverty line. Families with 3 or 4 children have the highest poverty rate of 100.0%, comprising of 12 families. On the other hand, families with no children have the lowest poverty rate of 0.0%, which includes 0 families.
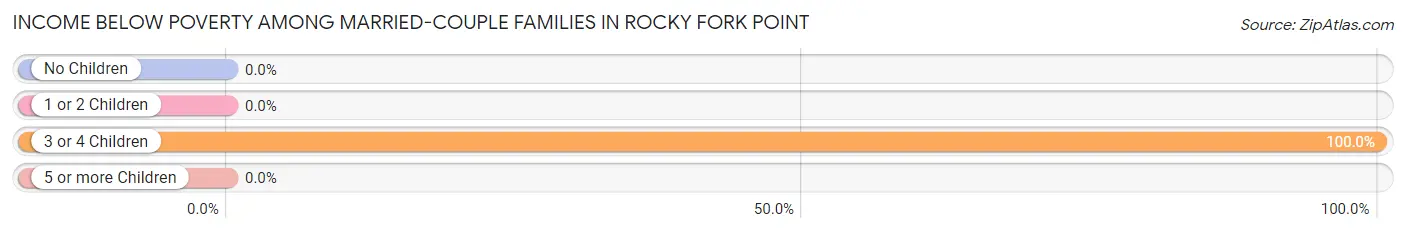
| Children | Above Poverty | Below Poverty |
| No Children | 28 (100.0%) | 0 (0.0%) |
| 1 or 2 Children | 48 (100.0%) | 0 (0.0%) |
| 3 or 4 Children | 0 (0.0%) | 12 (100.0%) |
| 5 or more Children | 0 (0.0%) | 0 (0.0%) |
| Total | 76 (86.4%) | 12 (13.6%) |
Income Below Poverty Among Single-Parent Households in Rocky Fork Point
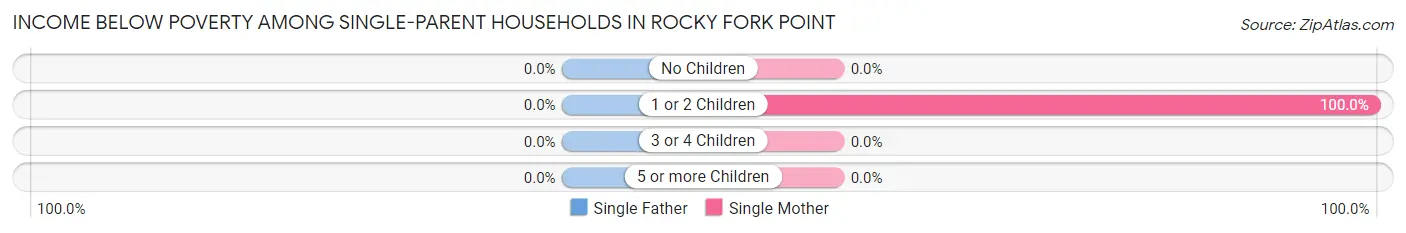
| Children | Single Father | Single Mother |
| No Children | 0 (0.0%) | 0 (0.0%) |
| 1 or 2 Children | 0 (0.0%) | 17 (100.0%) |
| 3 or 4 Children | 0 (0.0%) | 0 (0.0%) |
| 5 or more Children | 0 (0.0%) | 0 (0.0%) |
| Total | 0 (0.0%) | 17 (30.9%) |
Income Below Poverty Among Married-Couple vs Single-Parent Households in Rocky Fork Point
The poverty data for Rocky Fork Point shows that 12 of the married-couple family households (13.6%) and 17 of the single-parent households (17.5%) are living below the poverty level. Within the married-couple family households, those with 3 or 4 children have the highest poverty rate, with 12 households (100.0%) falling below the poverty line. Among the single-parent households, those with 1 or 2 children have the highest poverty rate, with 17 household (100.0%) living below poverty.
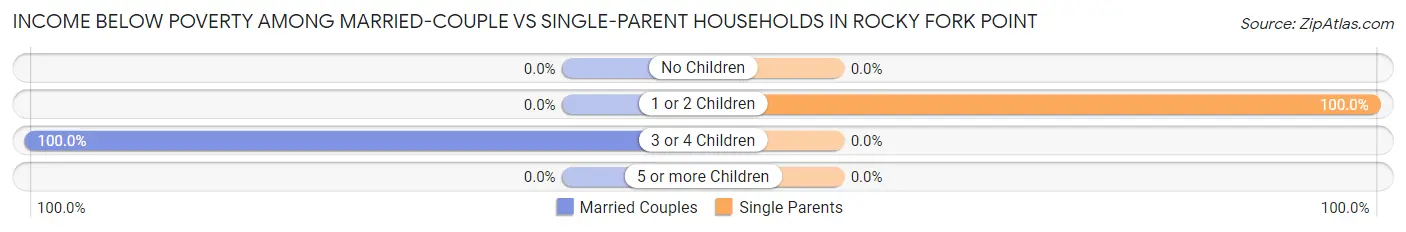
| Children | Married-Couple Families | Single-Parent Households |
| No Children | 0 (0.0%) | 0 (0.0%) |
| 1 or 2 Children | 0 (0.0%) | 17 (100.0%) |
| 3 or 4 Children | 12 (100.0%) | 0 (0.0%) |
| 5 or more Children | 0 (0.0%) | 0 (0.0%) |
| Total | 12 (13.6%) | 17 (17.5%) |
Race in Rocky Fork Point
The most populous races in Rocky Fork Point are White / Caucasian (666 | 95.0%), Two or more Races (35 | 5.0%), and Hispanic or Latino (5 | 0.7%).
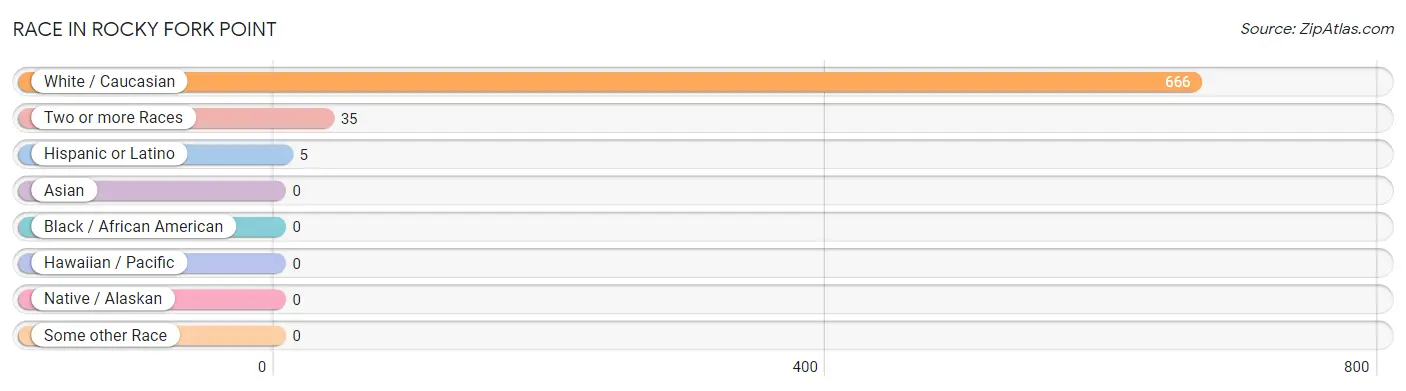
| Race | # Population | % Population |
| Asian | 0 | 0.0% |
| Black / African American | 0 | 0.0% |
| Hawaiian / Pacific | 0 | 0.0% |
| Hispanic or Latino | 5 | 0.7% |
| Native / Alaskan | 0 | 0.0% |
| White / Caucasian | 666 | 95.0% |
| Two or more Races | 35 | 5.0% |
| Some other Race | 0 | 0.0% |
| Total | 701 | 100.0% |
Ancestry in Rocky Fork Point
The most populous ancestries reported in Rocky Fork Point are English (206 | 29.4%), American (189 | 27.0%), Irish (40 | 5.7%), Samoan (30 | 4.3%), and German (21 | 3.0%), together accounting for 69.3% of all Rocky Fork Point residents.
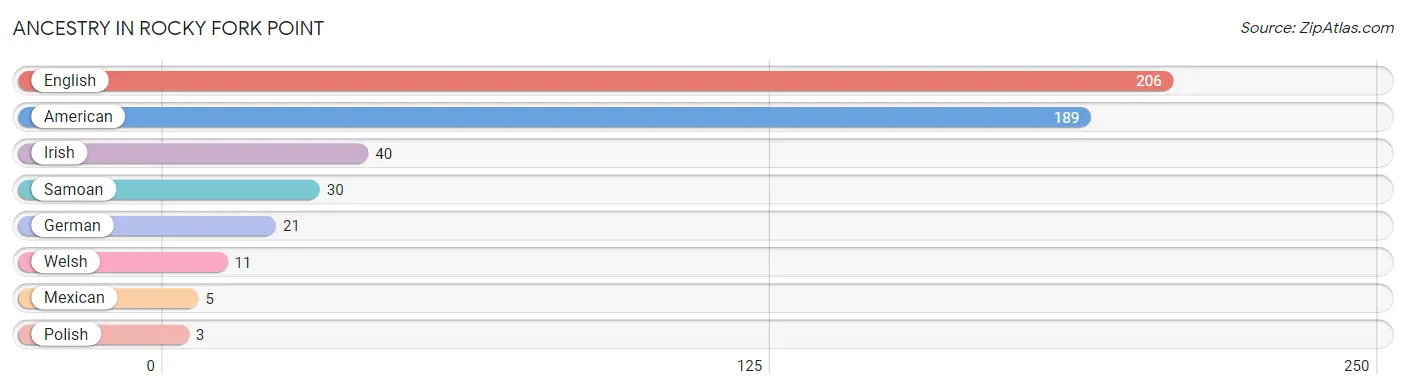
| Ancestry | # Population | % Population |
| American | 189 | 27.0% |
| English | 206 | 29.4% |
| German | 21 | 3.0% |
| Irish | 40 | 5.7% |
| Mexican | 5 | 0.7% |
| Polish | 3 | 0.4% |
| Samoan | 30 | 4.3% |
| Welsh | 11 | 1.6% | View All 8 Rows |
Immigrants in Rocky Fork Point

| Immigration Origin | # Population | % Population | View All 0 Rows |
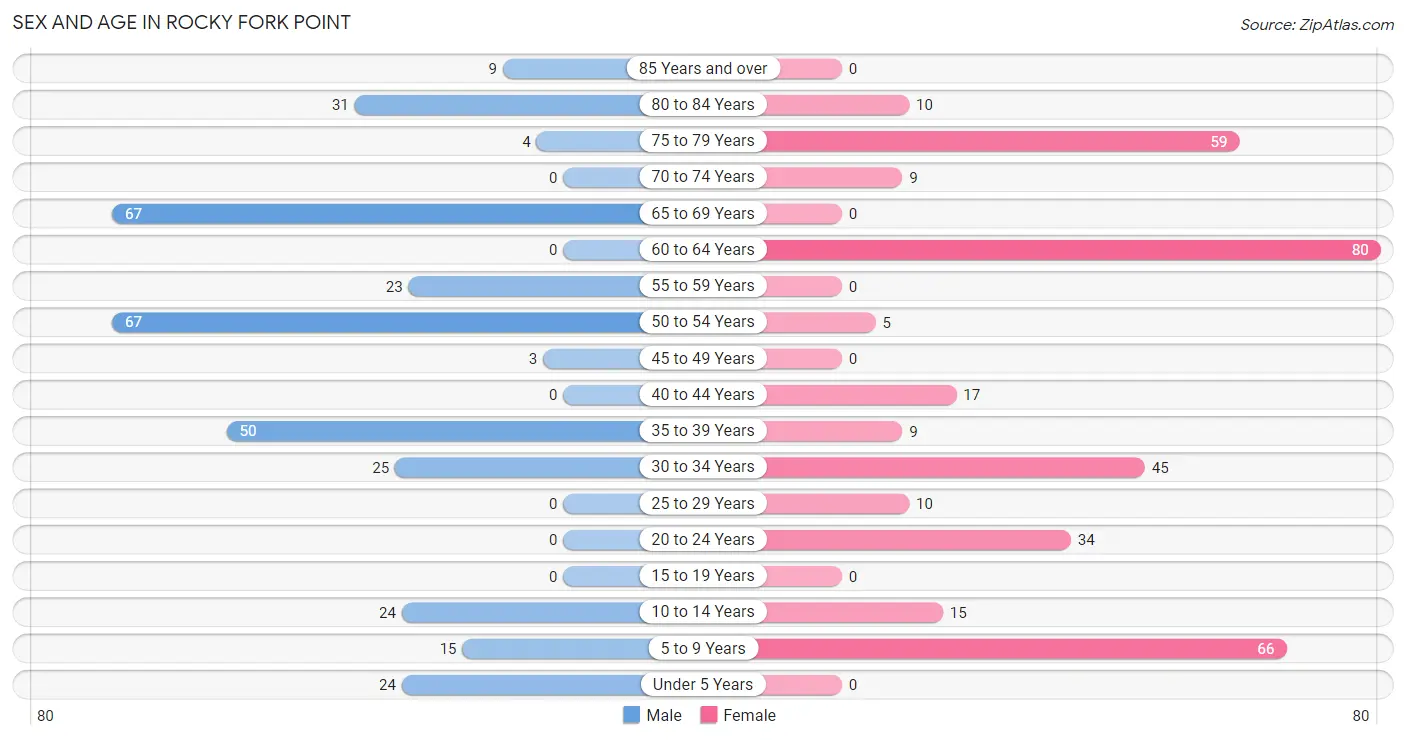
Sex and Age in Rocky Fork Point
Sex and Age in Rocky Fork Point
The most populous age groups in Rocky Fork Point are 50 to 54 Years (67 | 19.6%) for men and 60 to 64 Years (80 | 22.3%) for women.
| Age Bracket | Male | Female |
| Under 5 Years | 24 (7.0%) | 0 (0.0%) |
| 5 to 9 Years | 15 (4.4%) | 66 (18.4%) |
| 10 to 14 Years | 24 (7.0%) | 15 (4.2%) |
| 15 to 19 Years | 0 (0.0%) | 0 (0.0%) |
| 20 to 24 Years | 0 (0.0%) | 34 (9.5%) |
| 25 to 29 Years | 0 (0.0%) | 10 (2.8%) |
| 30 to 34 Years | 25 (7.3%) | 45 (12.5%) |
| 35 to 39 Years | 50 (14.6%) | 9 (2.5%) |
| 40 to 44 Years | 0 (0.0%) | 17 (4.7%) |
| 45 to 49 Years | 3 (0.9%) | 0 (0.0%) |
| 50 to 54 Years | 67 (19.6%) | 5 (1.4%) |
| 55 to 59 Years | 23 (6.7%) | 0 (0.0%) |
| 60 to 64 Years | 0 (0.0%) | 80 (22.3%) |
| 65 to 69 Years | 67 (19.6%) | 0 (0.0%) |
| 70 to 74 Years | 0 (0.0%) | 9 (2.5%) |
| 75 to 79 Years | 4 (1.2%) | 59 (16.4%) |
| 80 to 84 Years | 31 (9.1%) | 10 (2.8%) |
| 85 Years and over | 9 (2.6%) | 0 (0.0%) |
| Total | 342 (100.0%) | 359 (100.0%) |
Families and Households in Rocky Fork Point
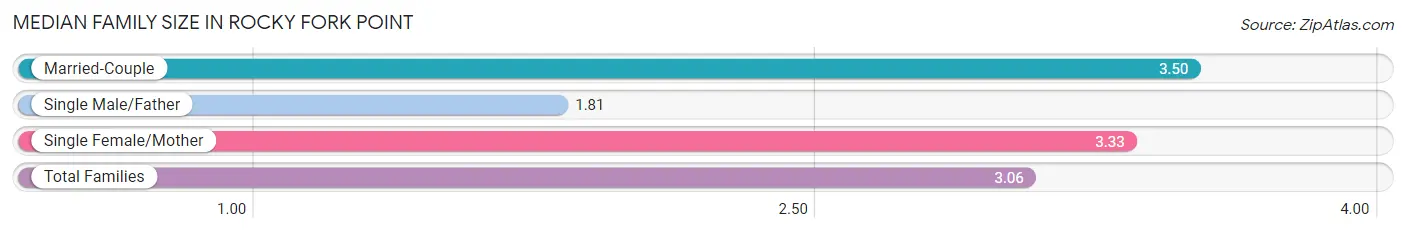
Median Family Size in Rocky Fork Point
The median family size in Rocky Fork Point is 3.06 persons per family, with married-couple families (88 | 47.6%) accounting for the largest median family size of 3.5 persons per family. On the other hand, single male/father families (42 | 22.7%) represent the smallest median family size with 1.81 persons per family.
| Family Type | # Families | Family Size |
| Married-Couple | 88 (47.6%) | 3.50 |
| Single Male/Father | 42 (22.7%) | 1.81 |
| Single Female/Mother | 55 (29.7%) | 3.33 |
| Total Families | 185 (100.0%) | 3.06 |
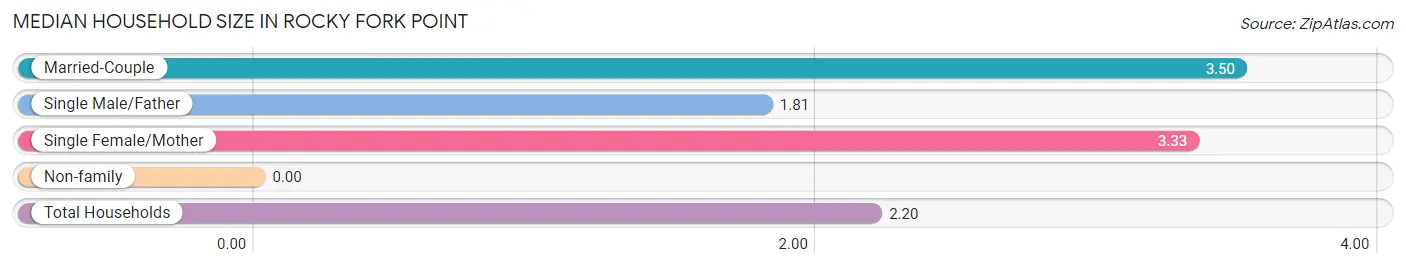
Median Household Size in Rocky Fork Point
| Household Type | # Households | Household Size |
| Married-Couple | 88 (27.6%) | 3.50 |
| Single Male/Father | 42 (13.2%) | 1.81 |
| Single Female/Mother | 55 (17.2%) | 3.33 |
| Non-family | 134 (42.0%) | - |
| Total Households | 319 (100.0%) | 2.20 |
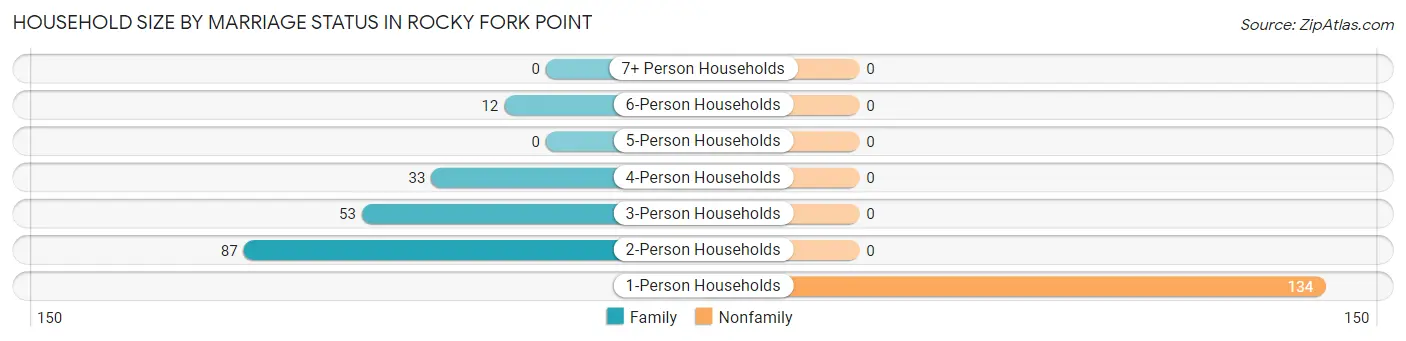
Household Size by Marriage Status in Rocky Fork Point
Out of a total of 319 households in Rocky Fork Point, 185 (58.0%) are family households, while 134 (42.0%) are nonfamily households. The most numerous type of family households are 2-person households, comprising 87, and the most common type of nonfamily households are 1-person households, comprising 134.
| Household Size | Family Households | Nonfamily Households |
| 1-Person Households | - | 134 (42.0%) |
| 2-Person Households | 87 (27.3%) | 0 (0.0%) |
| 3-Person Households | 53 (16.6%) | 0 (0.0%) |
| 4-Person Households | 33 (10.3%) | 0 (0.0%) |
| 5-Person Households | 0 (0.0%) | 0 (0.0%) |
| 6-Person Households | 12 (3.8%) | 0 (0.0%) |
| 7+ Person Households | 0 (0.0%) | 0 (0.0%) |
| Total | 185 (58.0%) | 134 (42.0%) |
Female Fertility in Rocky Fork Point
Fertility by Age in Rocky Fork Point
Average fertility rate in Rocky Fork Point is 287.0 births per 1,000 women. Women in the age bracket of 20 to 34 years have the highest fertility rate with 371.0 births per 1,000 women. Women in the age bracket of 20 to 34 years acount for 100.0% of all women with births.
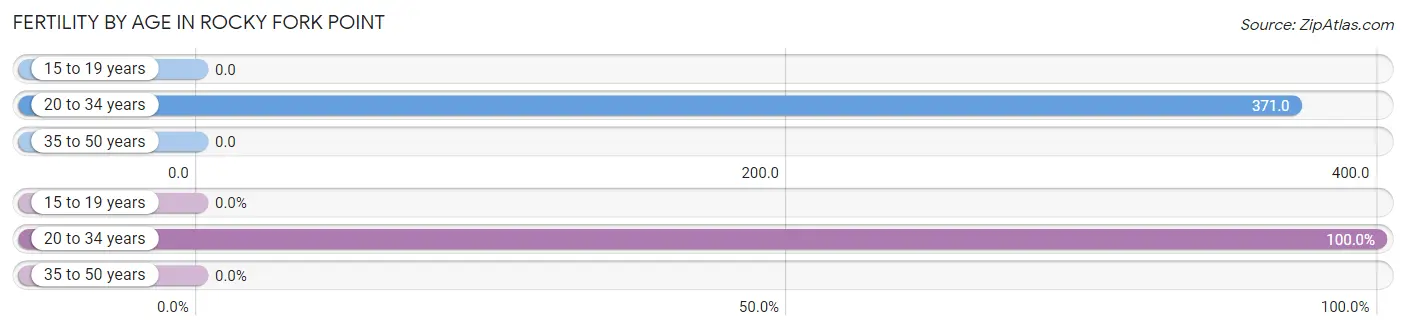
| Age Bracket | Women with Births | Births / 1,000 Women |
| 15 to 19 years | 0 (0.0%) | 0.0 |
| 20 to 34 years | 33 (100.0%) | 371.0 |
| 35 to 50 years | 0 (0.0%) | 0.0 |
| Total | 33 (100.0%) | 287.0 |
Fertility by Age by Marriage Status in Rocky Fork Point
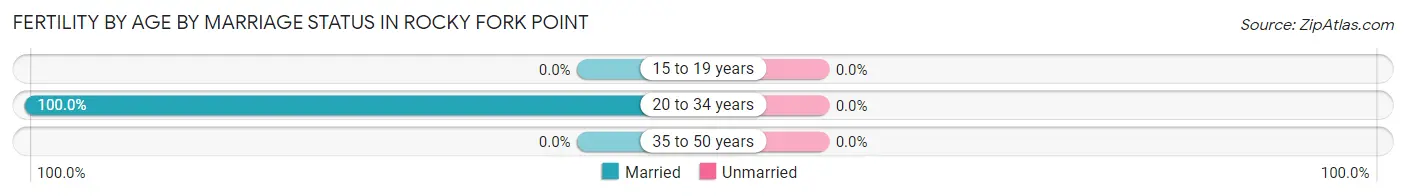
| Age Bracket | Married | Unmarried |
| 15 to 19 years | 0 (0.0%) | 0 (0.0%) |
| 20 to 34 years | 33 (100.0%) | 0 (0.0%) |
| 35 to 50 years | 0 (0.0%) | 0 (0.0%) |
| Total | 33 (100.0%) | 0 (0.0%) |
Fertility by Education in Rocky Fork Point
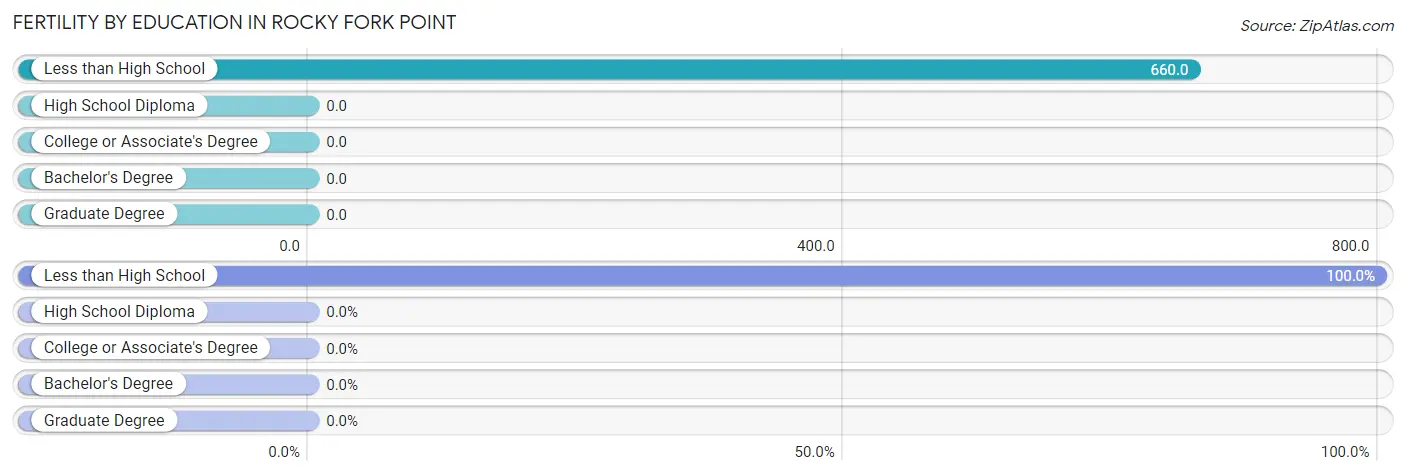
| Educational Attainment | Women with Births | Births / 1,000 Women |
| Less than High School | 33 (100.0%) | 660.0 |
| High School Diploma | 0 (0.0%) | 0.0 |
| College or Associate's Degree | 0 (0.0%) | 0.0 |
| Bachelor's Degree | 0 (0.0%) | 0.0 |
| Graduate Degree | 0 (0.0%) | 0.0 |
| Total | 33 (100.0%) | 287.0 |
Fertility by Education by Marriage Status in Rocky Fork Point
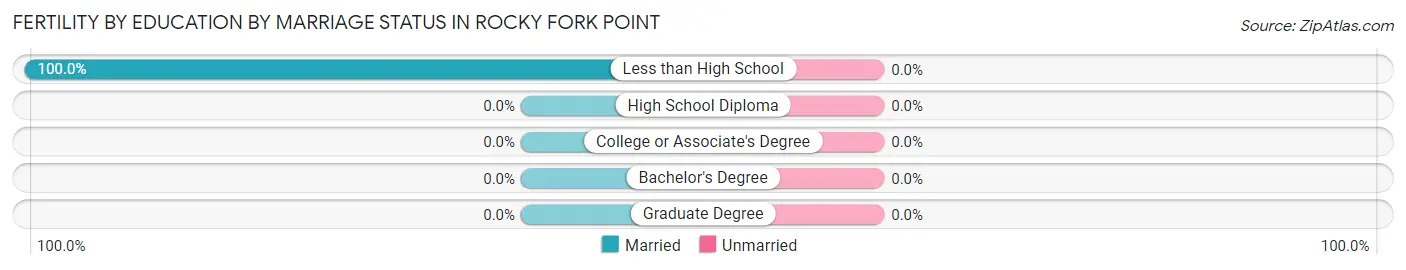
| Educational Attainment | Married | Unmarried |
| Less than High School | 33 (100.0%) | 0 (0.0%) |
| High School Diploma | 0 (0.0%) | 0 (0.0%) |
| College or Associate's Degree | 0 (0.0%) | 0 (0.0%) |
| Bachelor's Degree | 0 (0.0%) | 0 (0.0%) |
| Graduate Degree | 0 (0.0%) | 0 (0.0%) |
| Total | 33 (100.0%) | 0 (0.0%) |
Employment Characteristics in Rocky Fork Point
Employment by Class of Employer in Rocky Fork Point
Among the 217 employed individuals in Rocky Fork Point, private company employees (200 | 92.2%), local government employees (9 | 4.2%), and not-for-profit organizations (8 | 3.7%) make up the most common classes of employment.
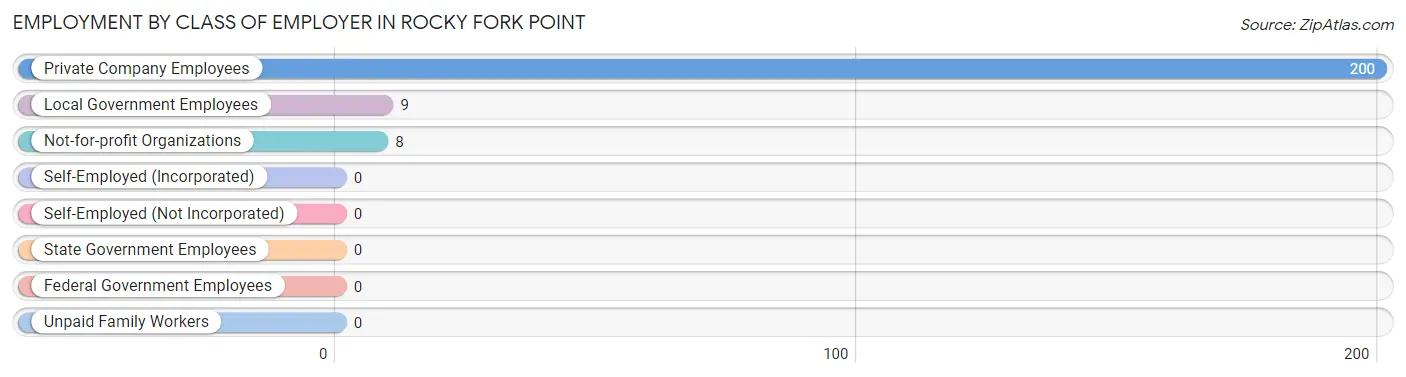
| Employer Class | # Employees | % Employees |
| Private Company Employees | 200 | 92.2% |
| Self-Employed (Incorporated) | 0 | 0.0% |
| Self-Employed (Not Incorporated) | 0 | 0.0% |
| Not-for-profit Organizations | 8 | 3.7% |
| Local Government Employees | 9 | 4.2% |
| State Government Employees | 0 | 0.0% |
| Federal Government Employees | 0 | 0.0% |
| Unpaid Family Workers | 0 | 0.0% |
| Total | 217 | 100.0% |
Employment Status by Age in Rocky Fork Point
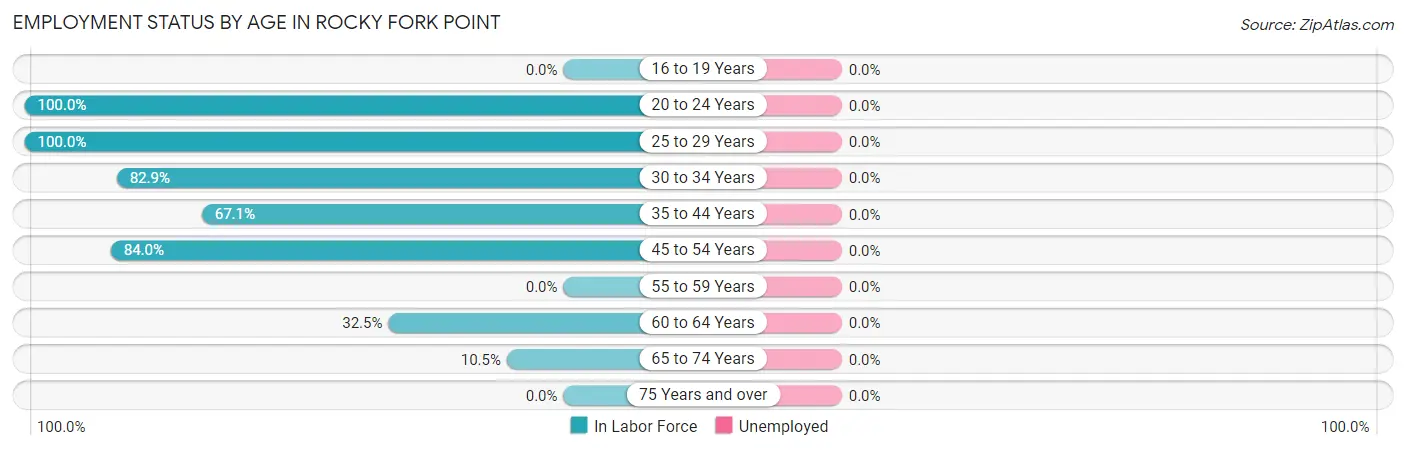
| Age Bracket | In Labor Force | Unemployed |
| 16 to 19 Years | 0 (0.0%) | 0 (0.0%) |
| 20 to 24 Years | 34 (100.0%) | 0 (0.0%) |
| 25 to 29 Years | 10 (100.0%) | 0 (0.0%) |
| 30 to 34 Years | 58 (82.9%) | 0 (0.0%) |
| 35 to 44 Years | 51 (67.1%) | 0 (0.0%) |
| 45 to 54 Years | 63 (84.0%) | 0 (0.0%) |
| 55 to 59 Years | 0 (0.0%) | 0 (0.0%) |
| 60 to 64 Years | 26 (32.5%) | 0 (0.0%) |
| 65 to 74 Years | 8 (10.5%) | 0 (0.0%) |
| 75 Years and over | 0 (0.0%) | 0 (0.0%) |
| Total | 250 (44.9%) | 0 (0.0%) |
Employment Status by Educational Attainment in Rocky Fork Point
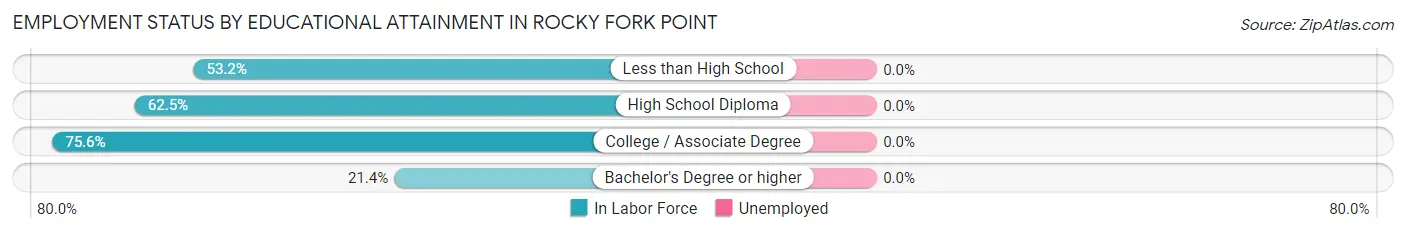
| Educational Attainment | In Labor Force | Unemployed |
| Less than High School | 33 (53.2%) | 0 (0.0%) |
| High School Diploma | 110 (62.5%) | 0 (0.0%) |
| College / Associate Degree | 62 (75.6%) | 0 (0.0%) |
| Bachelor's Degree or higher | 3 (21.4%) | 0 (0.0%) |
| Total | 208 (62.3%) | 0 (0.0%) |
Employment Occupations by Sex in Rocky Fork Point
Management, Business, Science and Arts Occupations
The most common Management, Business, Science and Arts occupations in Rocky Fork Point are Management (9 | 3.6%), Health Diagnosing & Treating (3 | 1.2%), and Health Technologists (3 | 1.2%).
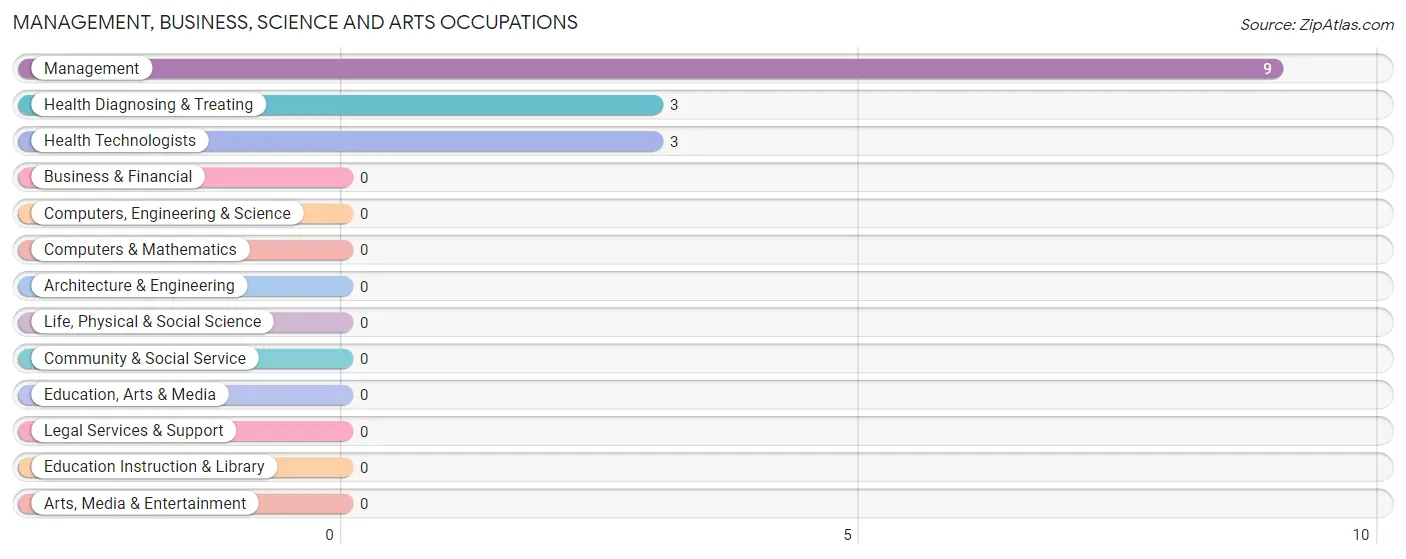
Management, Business, Science and Arts Occupations by Sex
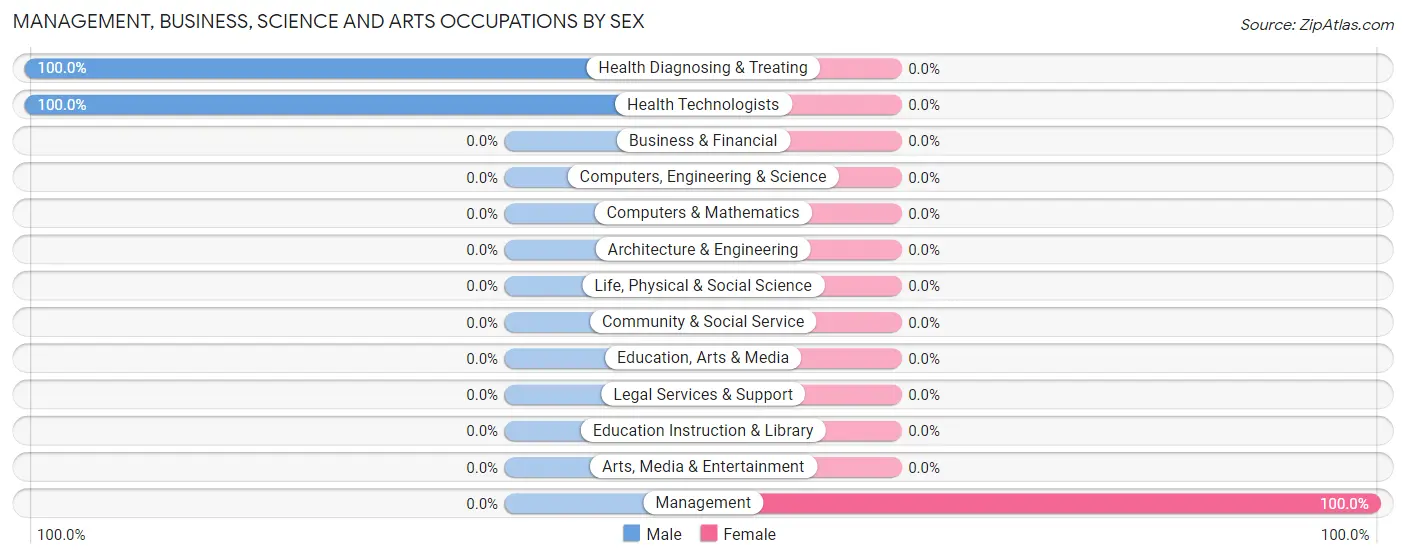
| Occupation | Male | Female |
| Management | 0 (0.0%) | 9 (100.0%) |
| Business & Financial | 0 (0.0%) | 0 (0.0%) |
| Computers, Engineering & Science | 0 (0.0%) | 0 (0.0%) |
| Computers & Mathematics | 0 (0.0%) | 0 (0.0%) |
| Architecture & Engineering | 0 (0.0%) | 0 (0.0%) |
| Life, Physical & Social Science | 0 (0.0%) | 0 (0.0%) |
| Community & Social Service | 0 (0.0%) | 0 (0.0%) |
| Education, Arts & Media | 0 (0.0%) | 0 (0.0%) |
| Legal Services & Support | 0 (0.0%) | 0 (0.0%) |
| Education Instruction & Library | 0 (0.0%) | 0 (0.0%) |
| Arts, Media & Entertainment | 0 (0.0%) | 0 (0.0%) |
| Health Diagnosing & Treating | 3 (100.0%) | 0 (0.0%) |
| Health Technologists | 3 (100.0%) | 0 (0.0%) |
| Total (Category) | 3 (25.0%) | 9 (75.0%) |
| Total (Overall) | 133 (53.2%) | 117 (46.8%) |
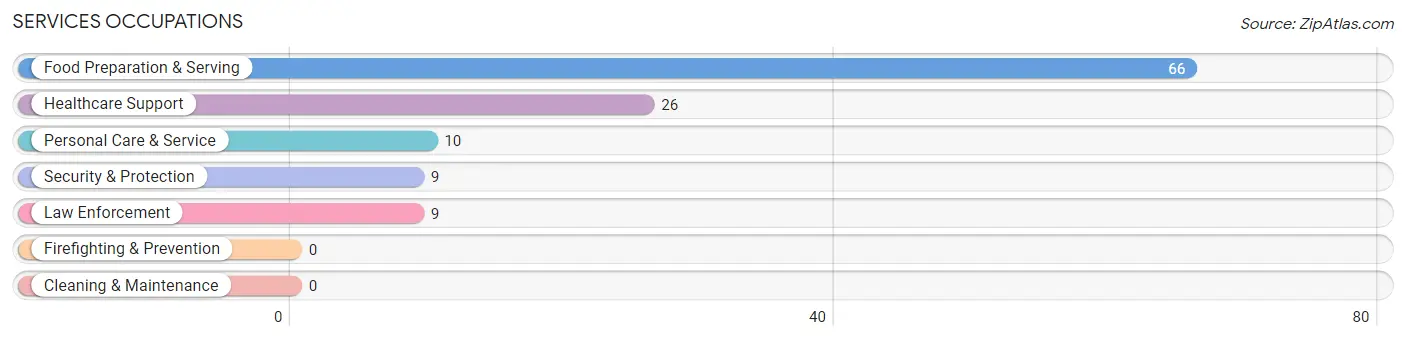
Services Occupations
The most common Services occupations in Rocky Fork Point are Food Preparation & Serving (66 | 26.4%), Healthcare Support (26 | 10.4%), Personal Care & Service (10 | 4.0%), Security & Protection (9 | 3.6%), and Law Enforcement (9 | 3.6%).
Services Occupations by Sex
Within the Services occupations in Rocky Fork Point, the most male-oriented occupations are Security & Protection (100.0%), Law Enforcement (100.0%), and Food Preparation & Serving (50.0%), while the most female-oriented occupations are Healthcare Support (100.0%), Personal Care & Service (100.0%), and Food Preparation & Serving (50.0%).
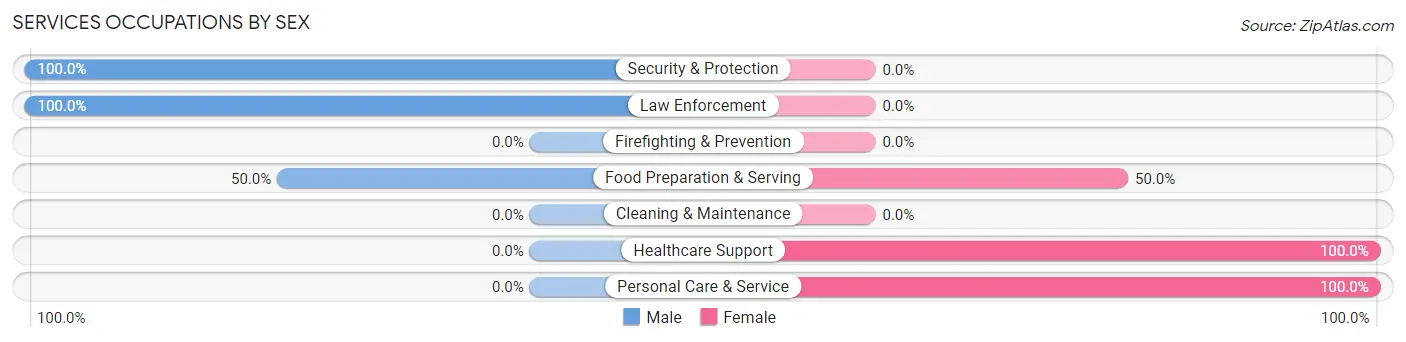
| Occupation | Male | Female |
| Healthcare Support | 0 (0.0%) | 26 (100.0%) |
| Security & Protection | 9 (100.0%) | 0 (0.0%) |
| Firefighting & Prevention | 0 (0.0%) | 0 (0.0%) |
| Law Enforcement | 9 (100.0%) | 0 (0.0%) |
| Food Preparation & Serving | 33 (50.0%) | 33 (50.0%) |
| Cleaning & Maintenance | 0 (0.0%) | 0 (0.0%) |
| Personal Care & Service | 0 (0.0%) | 10 (100.0%) |
| Total (Category) | 42 (37.8%) | 69 (62.2%) |
| Total (Overall) | 133 (53.2%) | 117 (46.8%) |
Sales and Office Occupations
The most common Sales and Office occupations in Rocky Fork Point are , and Office & Administration (39 | 15.6%).
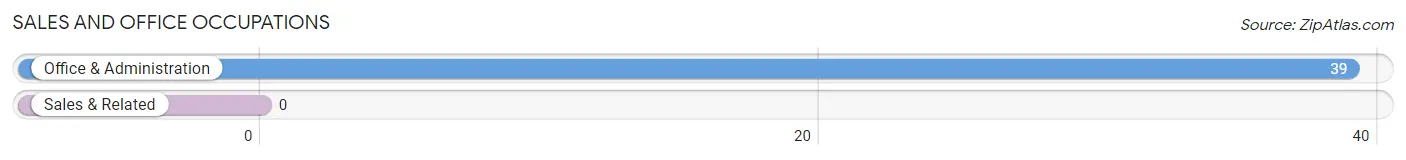
Sales and Office Occupations by Sex
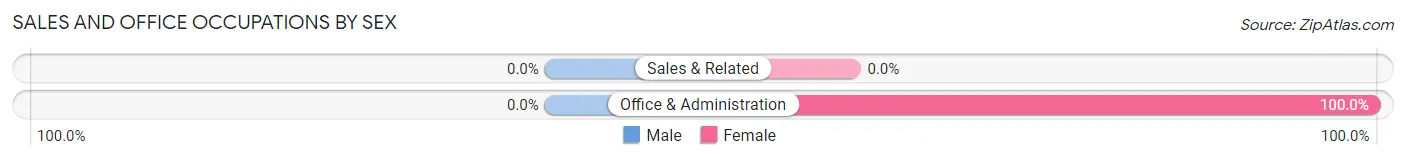
| Occupation | Male | Female |
| Sales & Related | 0 (0.0%) | 0 (0.0%) |
| Office & Administration | 0 (0.0%) | 39 (100.0%) |
| Total (Category) | 0 (0.0%) | 39 (100.0%) |
| Total (Overall) | 133 (53.2%) | 117 (46.8%) |
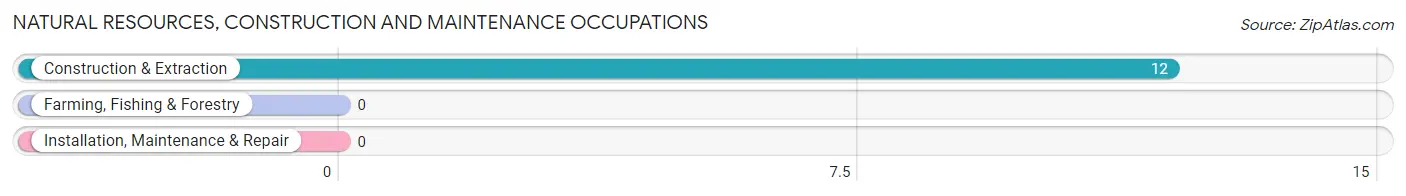
Natural Resources, Construction and Maintenance Occupations
The most common Natural Resources, Construction and Maintenance occupations in Rocky Fork Point are , and Construction & Extraction (12 | 4.8%).
Natural Resources, Construction and Maintenance Occupations by Sex
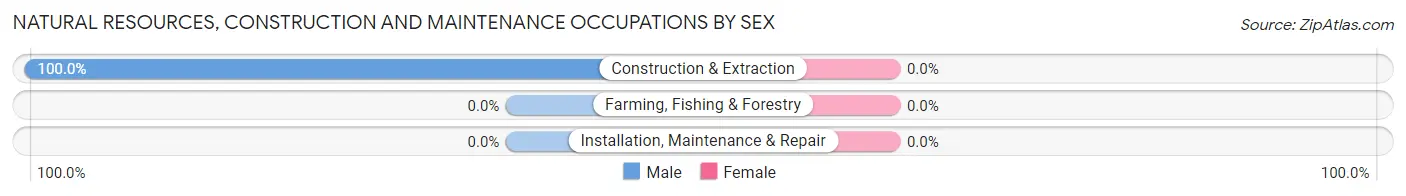
| Occupation | Male | Female |
| Farming, Fishing & Forestry | 0 (0.0%) | 0 (0.0%) |
| Construction & Extraction | 12 (100.0%) | 0 (0.0%) |
| Installation, Maintenance & Repair | 0 (0.0%) | 0 (0.0%) |
| Total (Category) | 12 (100.0%) | 0 (0.0%) |
| Total (Overall) | 133 (53.2%) | 117 (46.8%) |
Production, Transportation and Moving Occupations
The most common Production, Transportation and Moving occupations in Rocky Fork Point are Production (55 | 22.0%), and Transportation (21 | 8.4%).
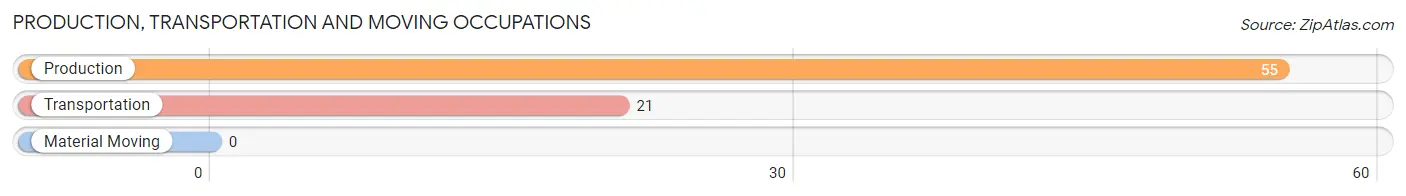
Production, Transportation and Moving Occupations by Sex
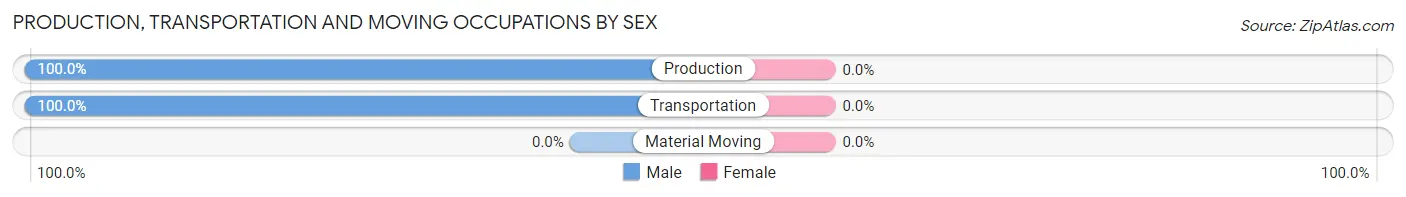
| Occupation | Male | Female |
| Production | 55 (100.0%) | 0 (0.0%) |
| Transportation | 21 (100.0%) | 0 (0.0%) |
| Material Moving | 0 (0.0%) | 0 (0.0%) |
| Total (Category) | 76 (100.0%) | 0 (0.0%) |
| Total (Overall) | 133 (53.2%) | 117 (46.8%) |
Employment Industries by Sex in Rocky Fork Point
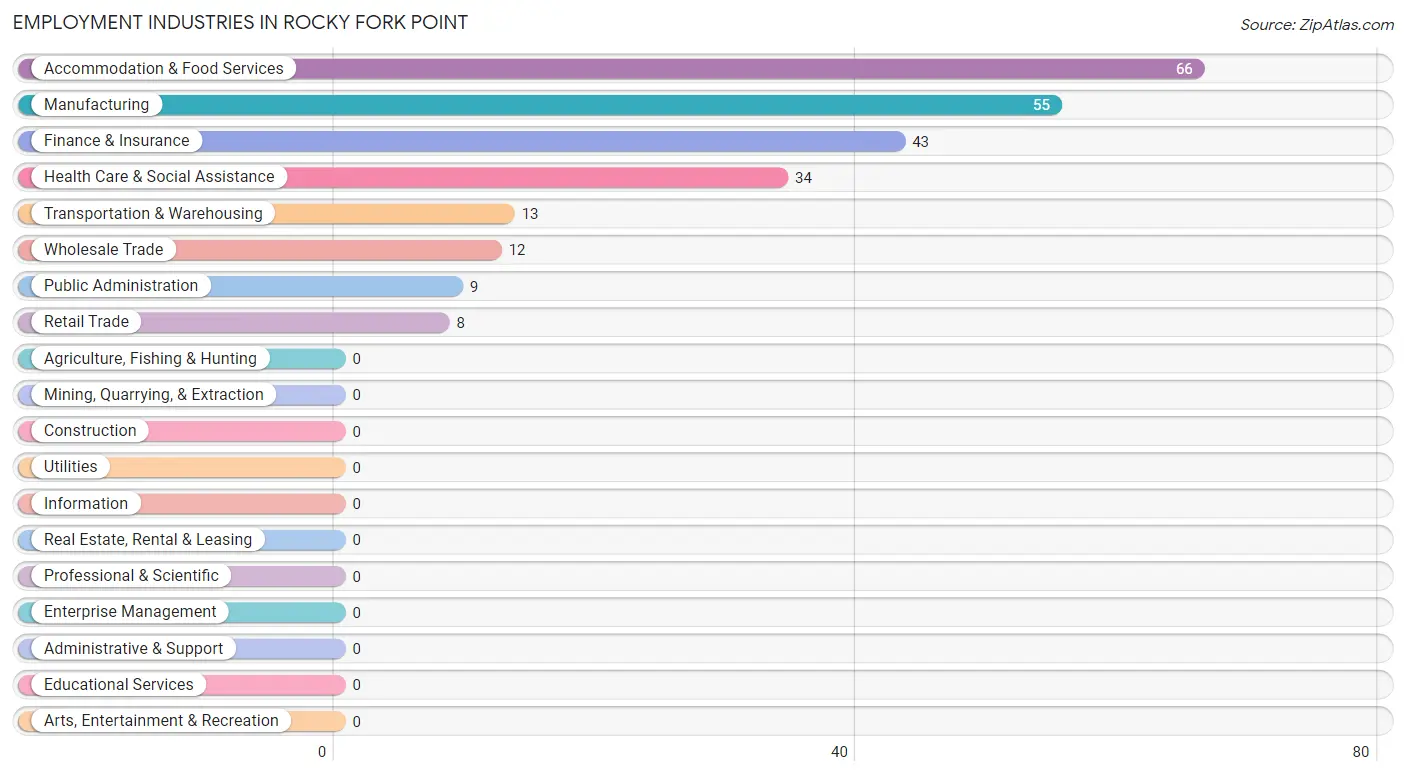
Employment Industries in Rocky Fork Point
The major employment industries in Rocky Fork Point include Accommodation & Food Services (66 | 26.4%), Manufacturing (55 | 22.0%), Finance & Insurance (43 | 17.2%), Health Care & Social Assistance (34 | 13.6%), and Transportation & Warehousing (13 | 5.2%).
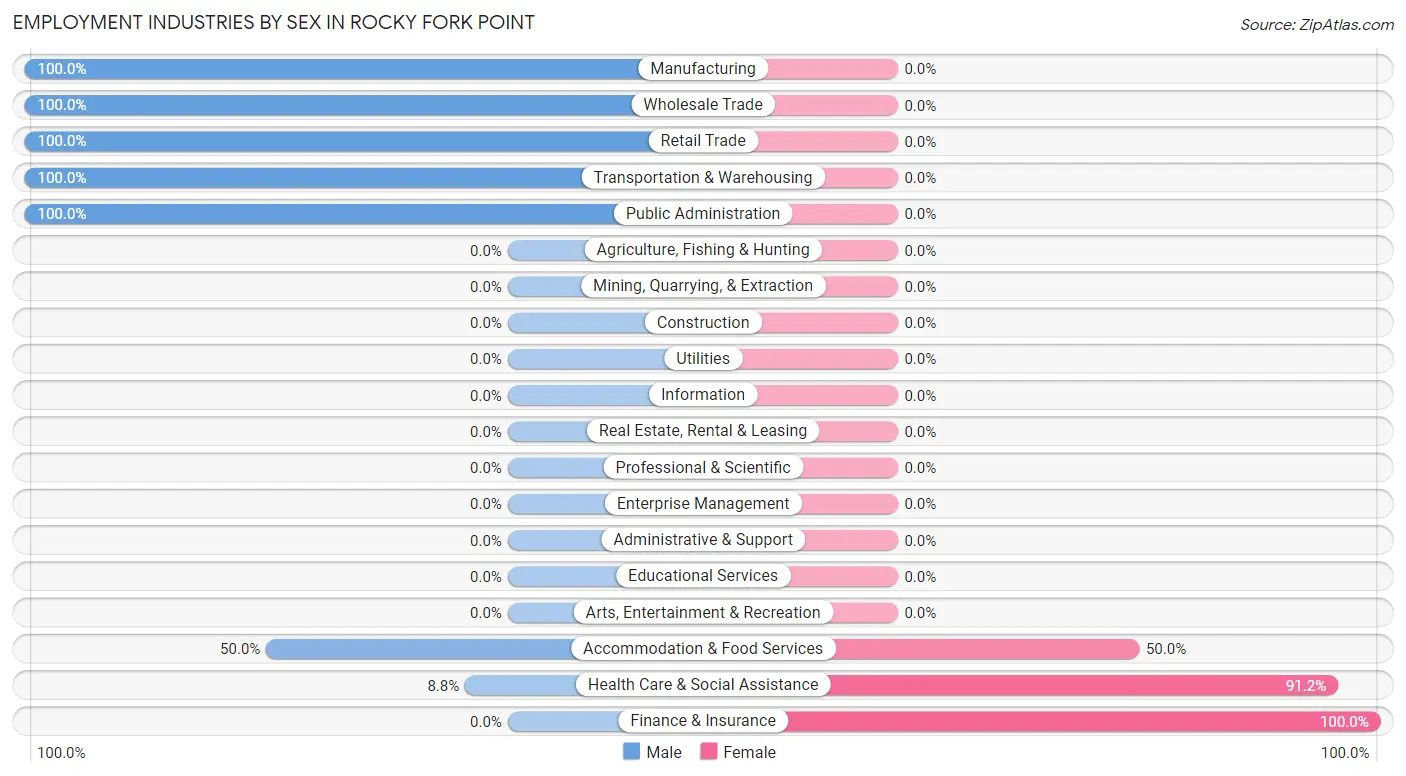
Employment Industries by Sex in Rocky Fork Point
The Rocky Fork Point industries that see more men than women are Manufacturing (100.0%), Wholesale Trade (100.0%), and Retail Trade (100.0%), whereas the industries that tend to have a higher number of women are Finance & Insurance (100.0%), Health Care & Social Assistance (91.2%), and Accommodation & Food Services (50.0%).
| Industry | Male | Female |
| Agriculture, Fishing & Hunting | 0 (0.0%) | 0 (0.0%) |
| Mining, Quarrying, & Extraction | 0 (0.0%) | 0 (0.0%) |
| Construction | 0 (0.0%) | 0 (0.0%) |
| Manufacturing | 55 (100.0%) | 0 (0.0%) |
| Wholesale Trade | 12 (100.0%) | 0 (0.0%) |
| Retail Trade | 8 (100.0%) | 0 (0.0%) |
| Transportation & Warehousing | 13 (100.0%) | 0 (0.0%) |
| Utilities | 0 (0.0%) | 0 (0.0%) |
| Information | 0 (0.0%) | 0 (0.0%) |
| Finance & Insurance | 0 (0.0%) | 43 (100.0%) |
| Real Estate, Rental & Leasing | 0 (0.0%) | 0 (0.0%) |
| Professional & Scientific | 0 (0.0%) | 0 (0.0%) |
| Enterprise Management | 0 (0.0%) | 0 (0.0%) |
| Administrative & Support | 0 (0.0%) | 0 (0.0%) |
| Educational Services | 0 (0.0%) | 0 (0.0%) |
| Health Care & Social Assistance | 3 (8.8%) | 31 (91.2%) |
| Arts, Entertainment & Recreation | 0 (0.0%) | 0 (0.0%) |
| Accommodation & Food Services | 33 (50.0%) | 33 (50.0%) |
| Public Administration | 9 (100.0%) | 0 (0.0%) |
| Total | 133 (53.2%) | 117 (46.8%) |
Education in Rocky Fork Point
School Enrollment in Rocky Fork Point
The most common levels of schooling among the 120 students in Rocky Fork Point are elementary school (80 | 66.7%), high school (15 | 12.5%), and kindergarten (13 | 10.8%).
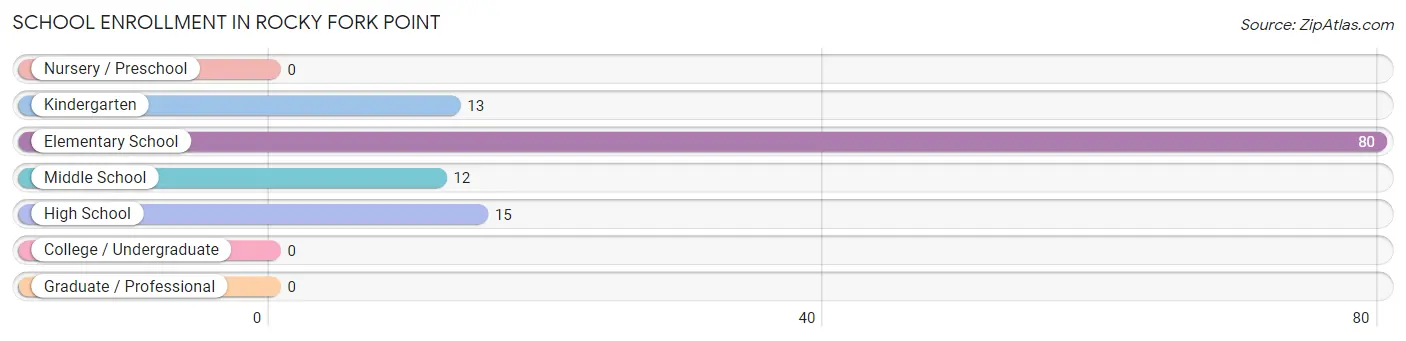
| School Level | # Students | % Students |
| Nursery / Preschool | 0 | 0.0% |
| Kindergarten | 13 | 10.8% |
| Elementary School | 80 | 66.7% |
| Middle School | 12 | 10.0% |
| High School | 15 | 12.5% |
| College / Undergraduate | 0 | 0.0% |
| Graduate / Professional | 0 | 0.0% |
| Total | 120 | 100.0% |
School Enrollment by Age by Funding Source in Rocky Fork Point
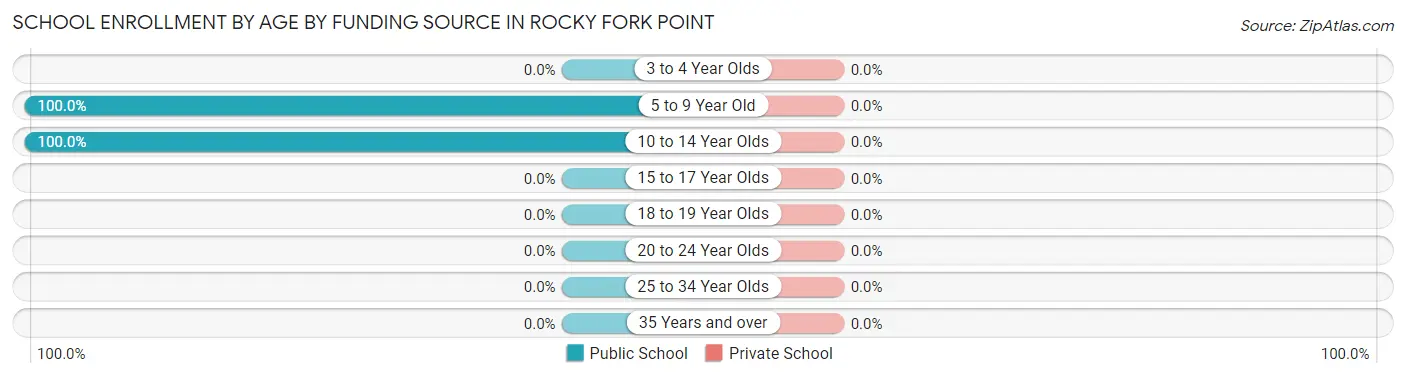
| Age Bracket | Public School | Private School |
| 3 to 4 Year Olds | 0 (0.0%) | 0 (0.0%) |
| 5 to 9 Year Old | 81 (100.0%) | 0 (0.0%) |
| 10 to 14 Year Olds | 39 (100.0%) | 0 (0.0%) |
| 15 to 17 Year Olds | 0 (0.0%) | 0 (0.0%) |
| 18 to 19 Year Olds | 0 (0.0%) | 0 (0.0%) |
| 20 to 24 Year Olds | 0 (0.0%) | 0 (0.0%) |
| 25 to 34 Year Olds | 0 (0.0%) | 0 (0.0%) |
| 35 Years and over | 0 (0.0%) | 0 (0.0%) |
| Total | 120 (100.0%) | 0 (0.0%) |
Educational Attainment by Field of Study in Rocky Fork Point
Education (16 | 53.3%), physical & health sciences (8 | 26.7%), social sciences (3 | 10.0%), and liberal arts & history (3 | 10.0%) are the most common fields of study among 30 individuals in Rocky Fork Point who have obtained a bachelor's degree or higher.
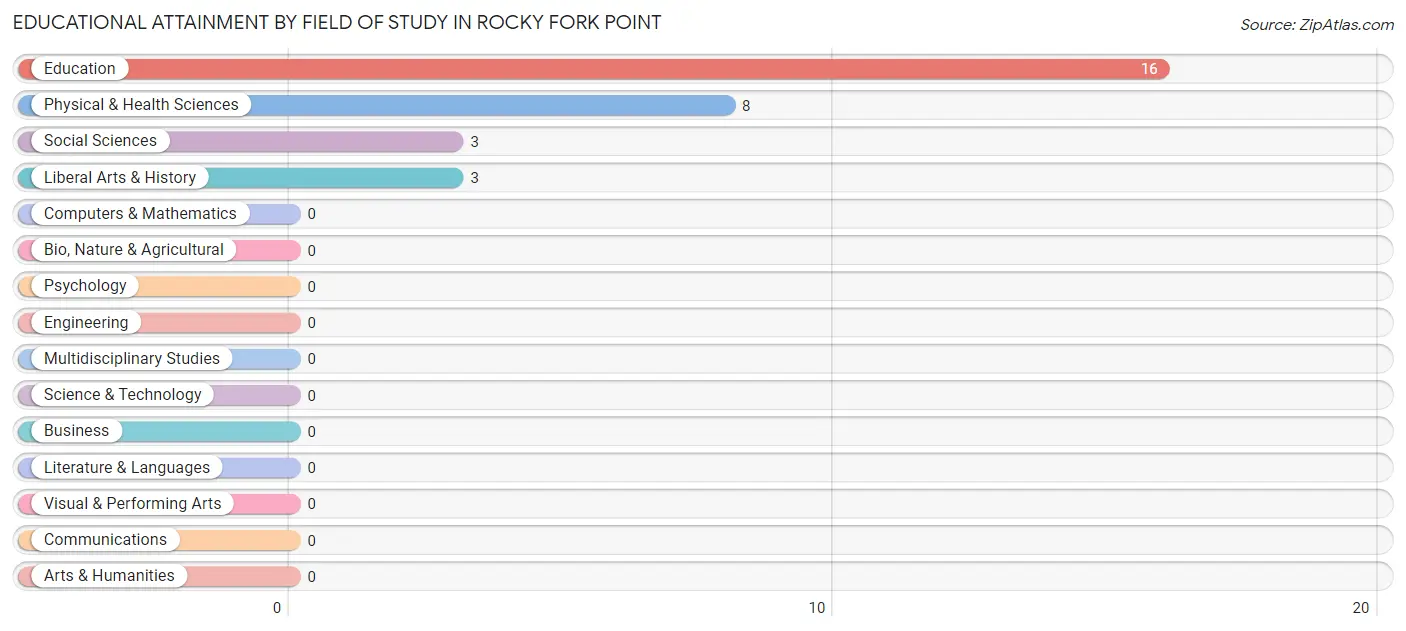
| Field of Study | # Graduates | % Graduates |
| Computers & Mathematics | 0 | 0.0% |
| Bio, Nature & Agricultural | 0 | 0.0% |
| Physical & Health Sciences | 8 | 26.7% |
| Psychology | 0 | 0.0% |
| Social Sciences | 3 | 10.0% |
| Engineering | 0 | 0.0% |
| Multidisciplinary Studies | 0 | 0.0% |
| Science & Technology | 0 | 0.0% |
| Business | 0 | 0.0% |
| Education | 16 | 53.3% |
| Literature & Languages | 0 | 0.0% |
| Liberal Arts & History | 3 | 10.0% |
| Visual & Performing Arts | 0 | 0.0% |
| Communications | 0 | 0.0% |
| Arts & Humanities | 0 | 0.0% |
| Total | 30 | 100.0% |
Transportation & Commute in Rocky Fork Point
Vehicle Availability by Sex in Rocky Fork Point
The most prevalent vehicle ownership categories in Rocky Fork Point are males with 3 vehicles (88, accounting for 66.2%) and females with 3 vehicles (34, making up 104.8%).
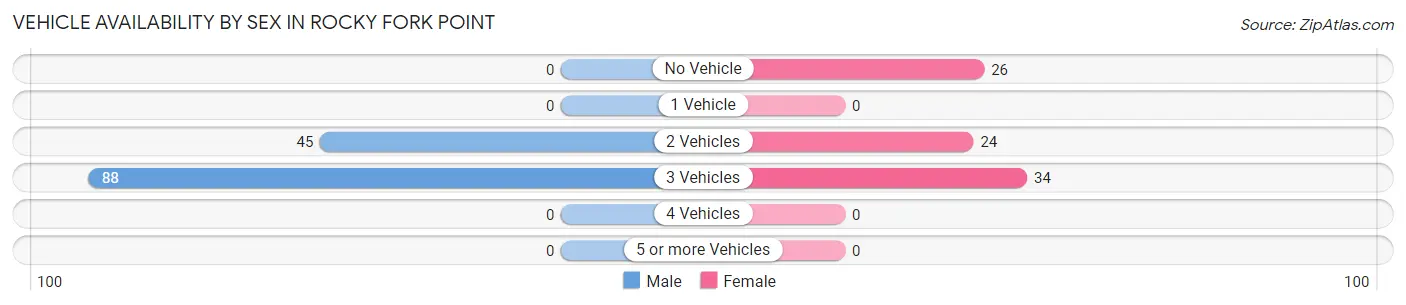
| Vehicles Available | Male | Female |
| No Vehicle | 0 (0.0%) | 26 (30.9%) |
| 1 Vehicle | 0 (0.0%) | 0 (0.0%) |
| 2 Vehicles | 45 (33.8%) | 24 (28.6%) |
| 3 Vehicles | 88 (66.2%) | 34 (40.5%) |
| 4 Vehicles | 0 (0.0%) | 0 (0.0%) |
| 5 or more Vehicles | 0 (0.0%) | 0 (0.0%) |
| Total | 133 (100.0%) | 84 (100.0%) |
Commute Time in Rocky Fork Point
The most frequently occuring commute durations in Rocky Fork Point are 30 to 34 minutes (55 commuters, 26.4%), 60 to 89 minutes (50 commuters, 24.0%), and 10 to 14 minutes (35 commuters, 16.8%).
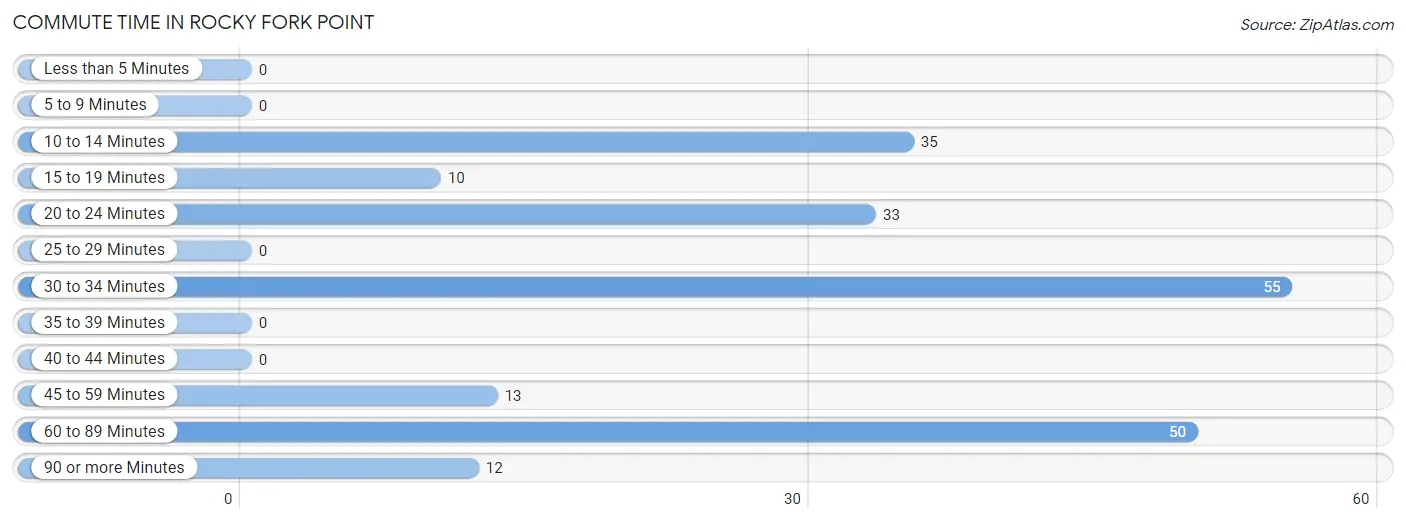
| Commute Time | # Commuters | % Commuters |
| Less than 5 Minutes | 0 | 0.0% |
| 5 to 9 Minutes | 0 | 0.0% |
| 10 to 14 Minutes | 35 | 16.8% |
| 15 to 19 Minutes | 10 | 4.8% |
| 20 to 24 Minutes | 33 | 15.9% |
| 25 to 29 Minutes | 0 | 0.0% |
| 30 to 34 Minutes | 55 | 26.4% |
| 35 to 39 Minutes | 0 | 0.0% |
| 40 to 44 Minutes | 0 | 0.0% |
| 45 to 59 Minutes | 13 | 6.2% |
| 60 to 89 Minutes | 50 | 24.0% |
| 90 or more Minutes | 12 | 5.8% |
Commute Time by Sex in Rocky Fork Point
The most common commute times in Rocky Fork Point are 30 to 34 minutes (50 commuters, 37.6%) for males and 60 to 89 minutes (34 commuters, 45.3%) for females.
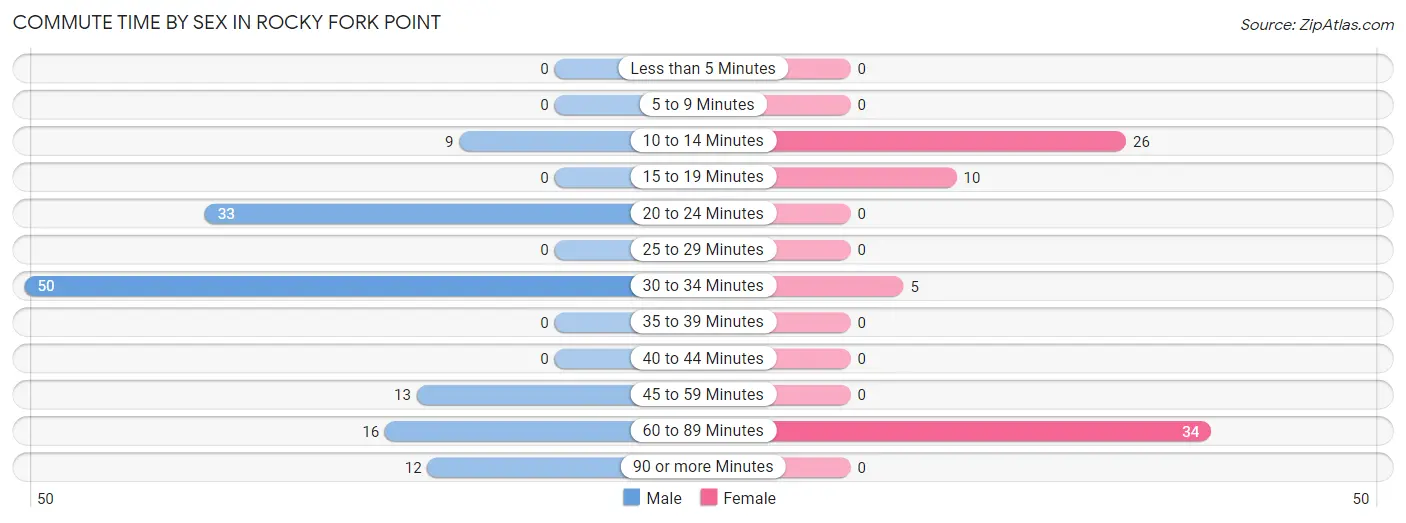
| Commute Time | Male | Female |
| Less than 5 Minutes | 0 (0.0%) | 0 (0.0%) |
| 5 to 9 Minutes | 0 (0.0%) | 0 (0.0%) |
| 10 to 14 Minutes | 9 (6.8%) | 26 (34.7%) |
| 15 to 19 Minutes | 0 (0.0%) | 10 (13.3%) |
| 20 to 24 Minutes | 33 (24.8%) | 0 (0.0%) |
| 25 to 29 Minutes | 0 (0.0%) | 0 (0.0%) |
| 30 to 34 Minutes | 50 (37.6%) | 5 (6.7%) |
| 35 to 39 Minutes | 0 (0.0%) | 0 (0.0%) |
| 40 to 44 Minutes | 0 (0.0%) | 0 (0.0%) |
| 45 to 59 Minutes | 13 (9.8%) | 0 (0.0%) |
| 60 to 89 Minutes | 16 (12.0%) | 34 (45.3%) |
| 90 or more Minutes | 12 (9.0%) | 0 (0.0%) |
Time of Departure to Work by Sex in Rocky Fork Point
The most frequent times of departure to work in Rocky Fork Point are 5:00 AM to 5:29 AM (55, 41.3%) for males and 8:30 AM to 8:59 AM (39, 52.0%) for females.
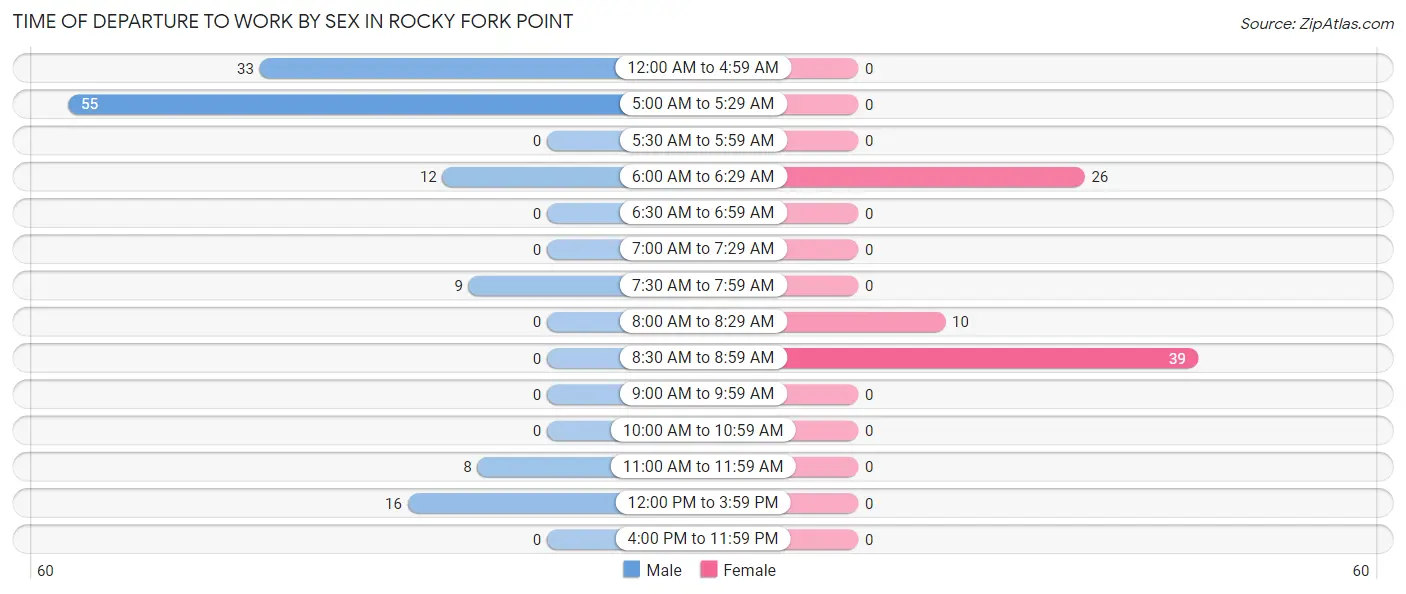
| Time of Departure | Male | Female |
| 12:00 AM to 4:59 AM | 33 (24.8%) | 0 (0.0%) |
| 5:00 AM to 5:29 AM | 55 (41.3%) | 0 (0.0%) |
| 5:30 AM to 5:59 AM | 0 (0.0%) | 0 (0.0%) |
| 6:00 AM to 6:29 AM | 12 (9.0%) | 26 (34.7%) |
| 6:30 AM to 6:59 AM | 0 (0.0%) | 0 (0.0%) |
| 7:00 AM to 7:29 AM | 0 (0.0%) | 0 (0.0%) |
| 7:30 AM to 7:59 AM | 9 (6.8%) | 0 (0.0%) |
| 8:00 AM to 8:29 AM | 0 (0.0%) | 10 (13.3%) |
| 8:30 AM to 8:59 AM | 0 (0.0%) | 39 (52.0%) |
| 9:00 AM to 9:59 AM | 0 (0.0%) | 0 (0.0%) |
| 10:00 AM to 10:59 AM | 0 (0.0%) | 0 (0.0%) |
| 11:00 AM to 11:59 AM | 8 (6.0%) | 0 (0.0%) |
| 12:00 PM to 3:59 PM | 16 (12.0%) | 0 (0.0%) |
| 4:00 PM to 11:59 PM | 0 (0.0%) | 0 (0.0%) |
| Total | 133 (100.0%) | 75 (100.0%) |
Housing Occupancy in Rocky Fork Point
Occupancy by Ownership in Rocky Fork Point
Of the total 319 dwellings in Rocky Fork Point, owner-occupied units account for 203 (63.6%), while renter-occupied units make up 116 (36.4%).
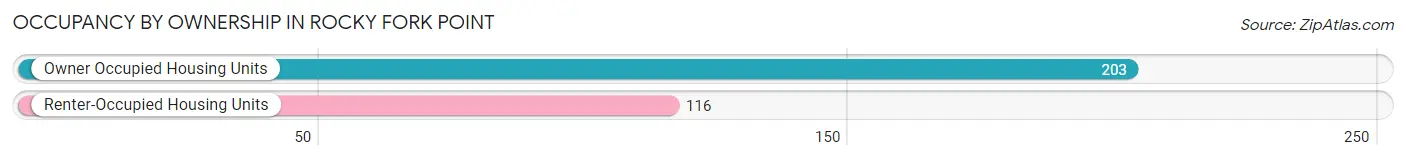
| Occupancy | # Housing Units | % Housing Units |
| Owner Occupied Housing Units | 203 | 63.6% |
| Renter-Occupied Housing Units | 116 | 36.4% |
| Total Occupied Housing Units | 319 | 100.0% |
Occupancy by Household Size in Rocky Fork Point
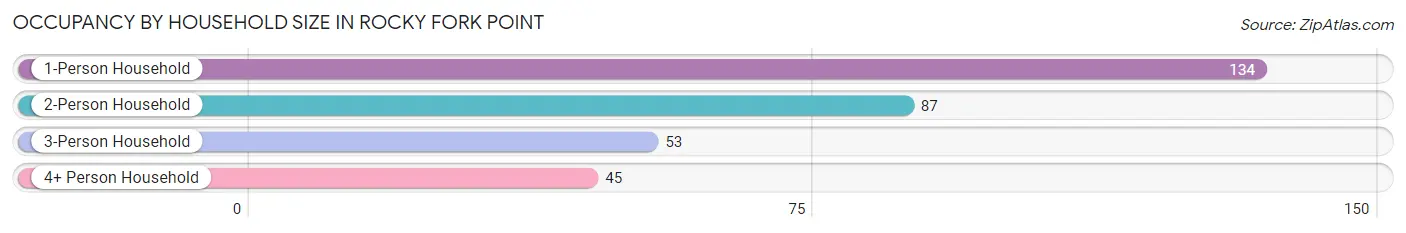
| Household Size | # Housing Units | % Housing Units |
| 1-Person Household | 134 | 42.0% |
| 2-Person Household | 87 | 27.3% |
| 3-Person Household | 53 | 16.6% |
| 4+ Person Household | 45 | 14.1% |
| Total Housing Units | 319 | 100.0% |
Occupancy by Ownership by Household Size in Rocky Fork Point
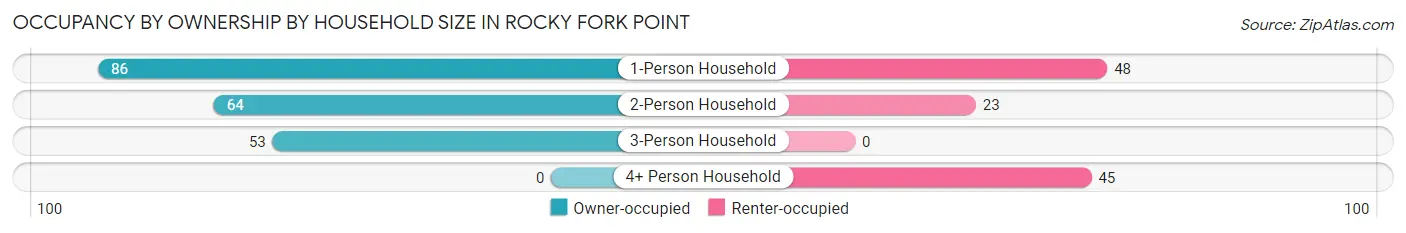
| Household Size | Owner-occupied | Renter-occupied |
| 1-Person Household | 86 (64.2%) | 48 (35.8%) |
| 2-Person Household | 64 (73.6%) | 23 (26.4%) |
| 3-Person Household | 53 (100.0%) | 0 (0.0%) |
| 4+ Person Household | 0 (0.0%) | 45 (100.0%) |
| Total Housing Units | 203 (63.6%) | 116 (36.4%) |
Occupancy by Educational Attainment in Rocky Fork Point
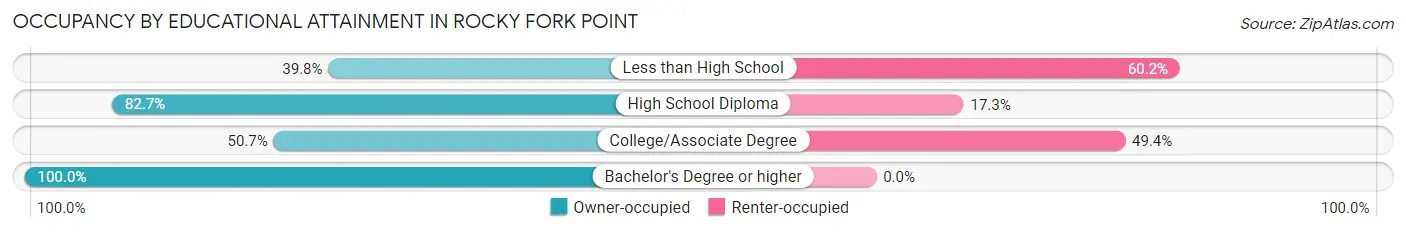
| Household Size | Owner-occupied | Renter-occupied |
| Less than High School | 37 (39.8%) | 56 (60.2%) |
| High School Diploma | 105 (82.7%) | 22 (17.3%) |
| College/Associate Degree | 39 (50.6%) | 38 (49.3%) |
| Bachelor's Degree or higher | 22 (100.0%) | 0 (0.0%) |
Occupancy by Age of Householder in Rocky Fork Point
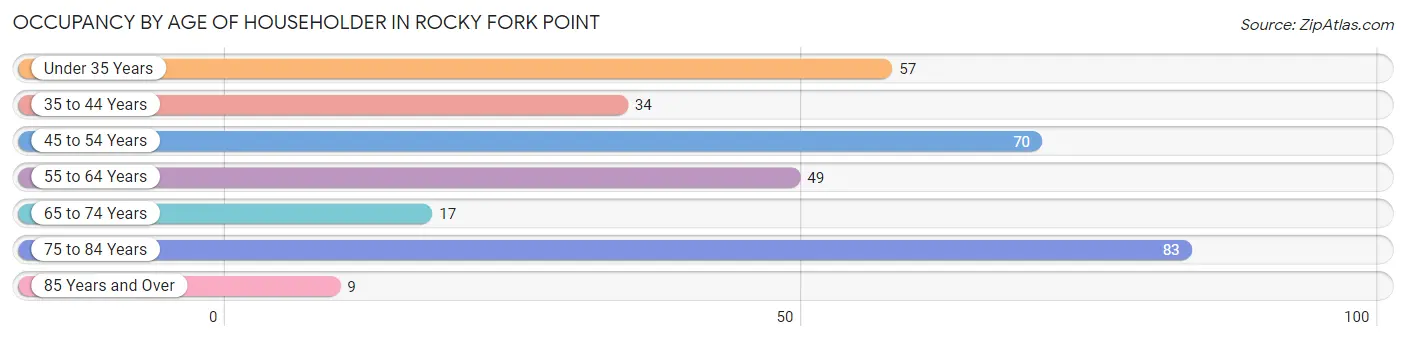
| Age Bracket | # Households | % Households |
| Under 35 Years | 57 | 17.9% |
| 35 to 44 Years | 34 | 10.7% |
| 45 to 54 Years | 70 | 21.9% |
| 55 to 64 Years | 49 | 15.4% |
| 65 to 74 Years | 17 | 5.3% |
| 75 to 84 Years | 83 | 26.0% |
| 85 Years and Over | 9 | 2.8% |
| Total | 319 | 100.0% |
Housing Finances in Rocky Fork Point
Median Income by Occupancy in Rocky Fork Point
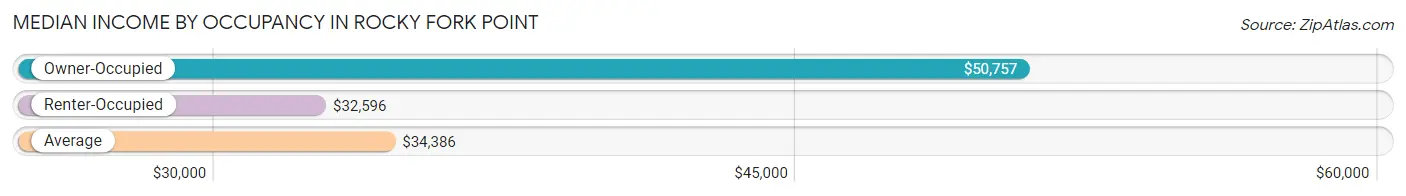
| Occupancy Type | # Households | Median Income |
| Owner-Occupied | 203 (63.6%) | $50,757 |
| Renter-Occupied | 116 (36.4%) | $32,596 |
| Average | 319 (100.0%) | $34,386 |
Occupancy by Householder Income Bracket in Rocky Fork Point
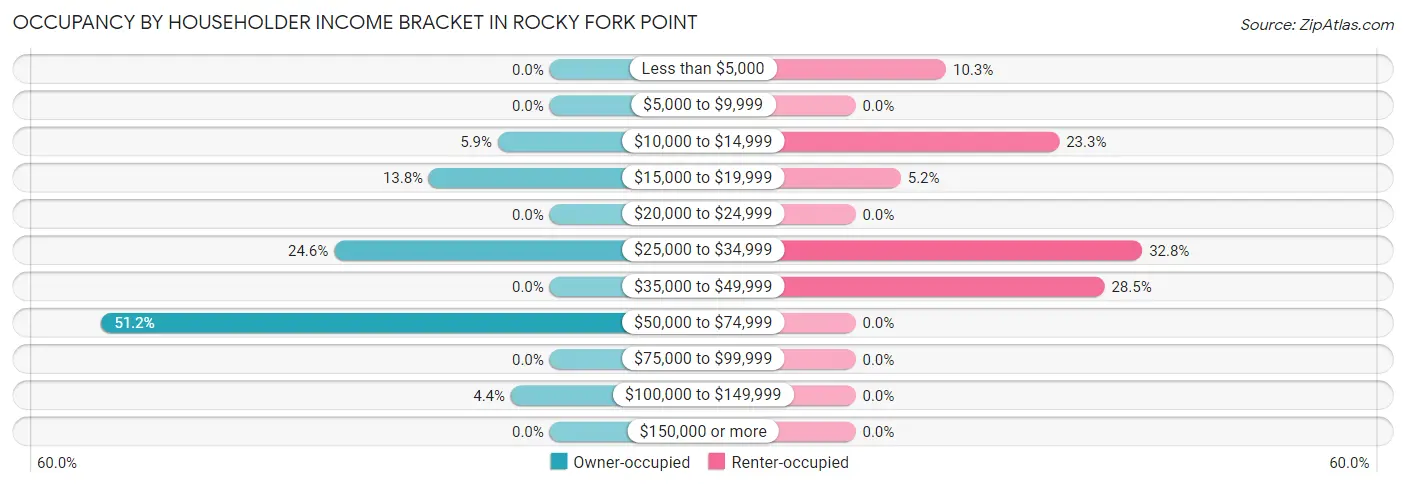
| Income Bracket | Owner-occupied | Renter-occupied |
| Less than $5,000 | 0 (0.0%) | 12 (10.3%) |
| $5,000 to $9,999 | 0 (0.0%) | 0 (0.0%) |
| $10,000 to $14,999 | 12 (5.9%) | 27 (23.3%) |
| $15,000 to $19,999 | 28 (13.8%) | 6 (5.2%) |
| $20,000 to $24,999 | 0 (0.0%) | 0 (0.0%) |
| $25,000 to $34,999 | 50 (24.6%) | 38 (32.8%) |
| $35,000 to $49,999 | 0 (0.0%) | 33 (28.4%) |
| $50,000 to $74,999 | 104 (51.2%) | 0 (0.0%) |
| $75,000 to $99,999 | 0 (0.0%) | 0 (0.0%) |
| $100,000 to $149,999 | 9 (4.4%) | 0 (0.0%) |
| $150,000 or more | 0 (0.0%) | 0 (0.0%) |
| Total | 203 (100.0%) | 116 (100.0%) |
Monthly Housing Cost Tiers in Rocky Fork Point
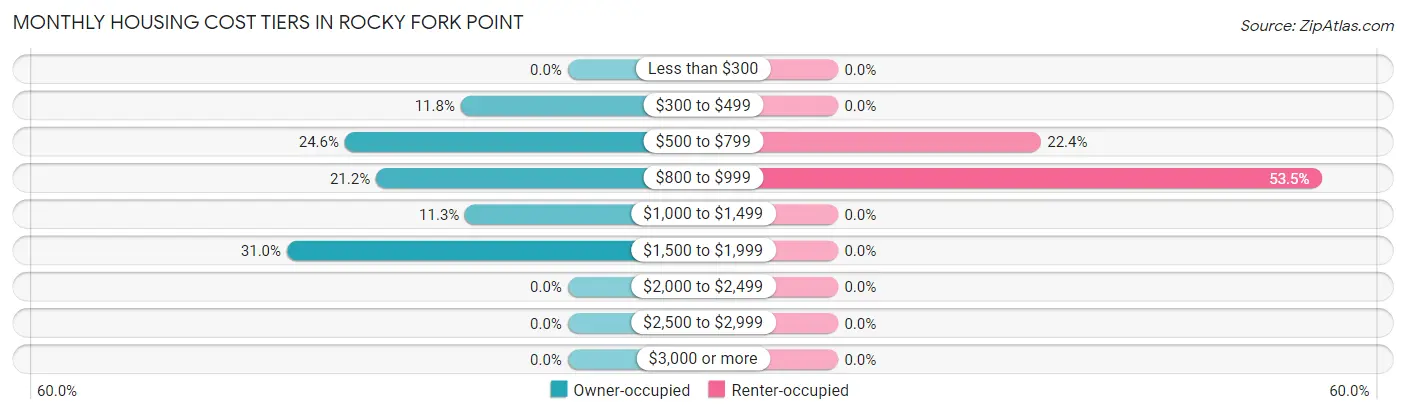
| Monthly Cost | Owner-occupied | Renter-occupied |
| Less than $300 | 0 (0.0%) | 0 (0.0%) |
| $300 to $499 | 24 (11.8%) | 0 (0.0%) |
| $500 to $799 | 50 (24.6%) | 26 (22.4%) |
| $800 to $999 | 43 (21.2%) | 62 (53.4%) |
| $1,000 to $1,499 | 23 (11.3%) | 0 (0.0%) |
| $1,500 to $1,999 | 63 (31.0%) | 0 (0.0%) |
| $2,000 to $2,499 | 0 (0.0%) | 0 (0.0%) |
| $2,500 to $2,999 | 0 (0.0%) | 0 (0.0%) |
| $3,000 or more | 0 (0.0%) | 0 (0.0%) |
| Total | 203 (100.0%) | 116 (100.0%) |
Physical Housing Characteristics in Rocky Fork Point
Housing Structures in Rocky Fork Point
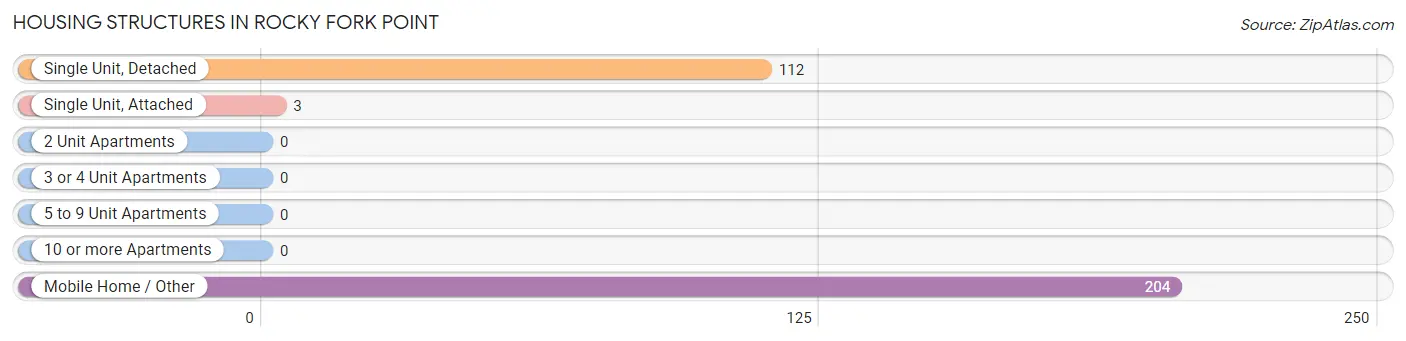
| Structure Type | # Housing Units | % Housing Units |
| Single Unit, Detached | 112 | 35.1% |
| Single Unit, Attached | 3 | 0.9% |
| 2 Unit Apartments | 0 | 0.0% |
| 3 or 4 Unit Apartments | 0 | 0.0% |
| 5 to 9 Unit Apartments | 0 | 0.0% |
| 10 or more Apartments | 0 | 0.0% |
| Mobile Home / Other | 204 | 63.9% |
| Total | 319 | 100.0% |
Housing Structures by Occupancy in Rocky Fork Point
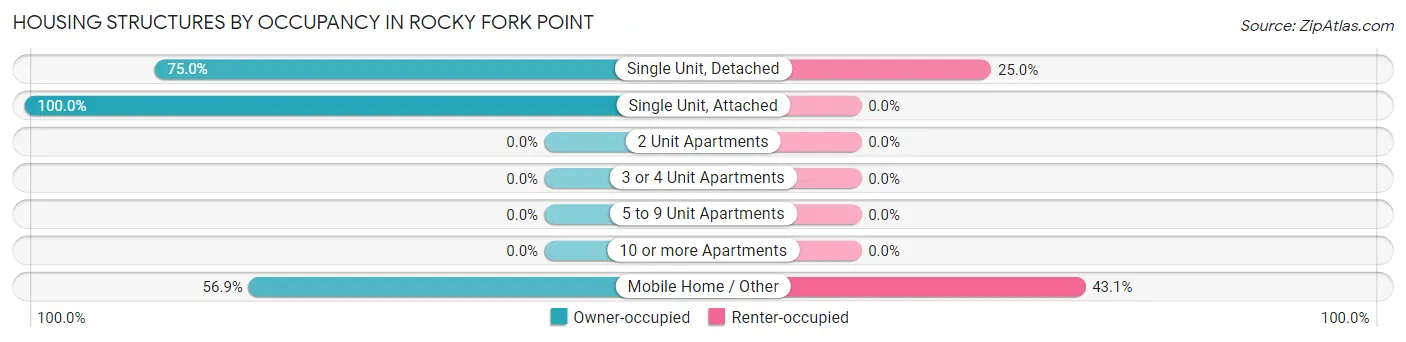
| Structure Type | Owner-occupied | Renter-occupied |
| Single Unit, Detached | 84 (75.0%) | 28 (25.0%) |
| Single Unit, Attached | 3 (100.0%) | 0 (0.0%) |
| 2 Unit Apartments | 0 (0.0%) | 0 (0.0%) |
| 3 or 4 Unit Apartments | 0 (0.0%) | 0 (0.0%) |
| 5 to 9 Unit Apartments | 0 (0.0%) | 0 (0.0%) |
| 10 or more Apartments | 0 (0.0%) | 0 (0.0%) |
| Mobile Home / Other | 116 (56.9%) | 88 (43.1%) |
| Total | 203 (63.6%) | 116 (36.4%) |
Housing Structures by Number of Rooms in Rocky Fork Point
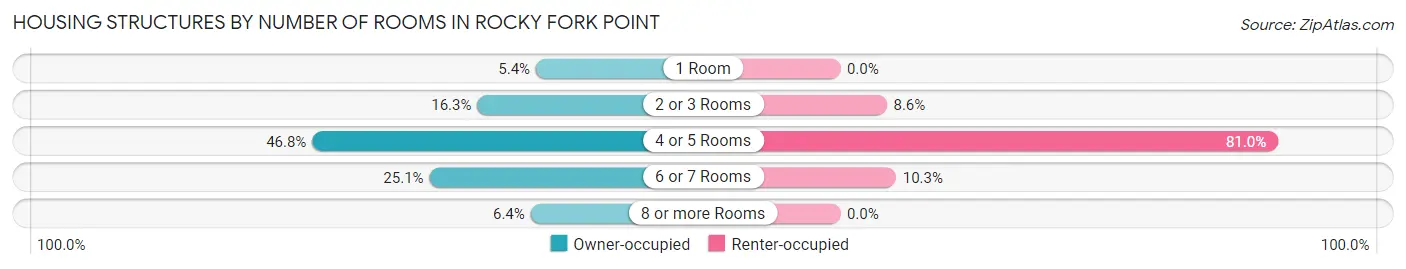
| Number of Rooms | Owner-occupied | Renter-occupied |
| 1 Room | 11 (5.4%) | 0 (0.0%) |
| 2 or 3 Rooms | 33 (16.3%) | 10 (8.6%) |
| 4 or 5 Rooms | 95 (46.8%) | 94 (81.0%) |
| 6 or 7 Rooms | 51 (25.1%) | 12 (10.3%) |
| 8 or more Rooms | 13 (6.4%) | 0 (0.0%) |
| Total | 203 (100.0%) | 116 (100.0%) |
Housing Structure by Heating Type in Rocky Fork Point
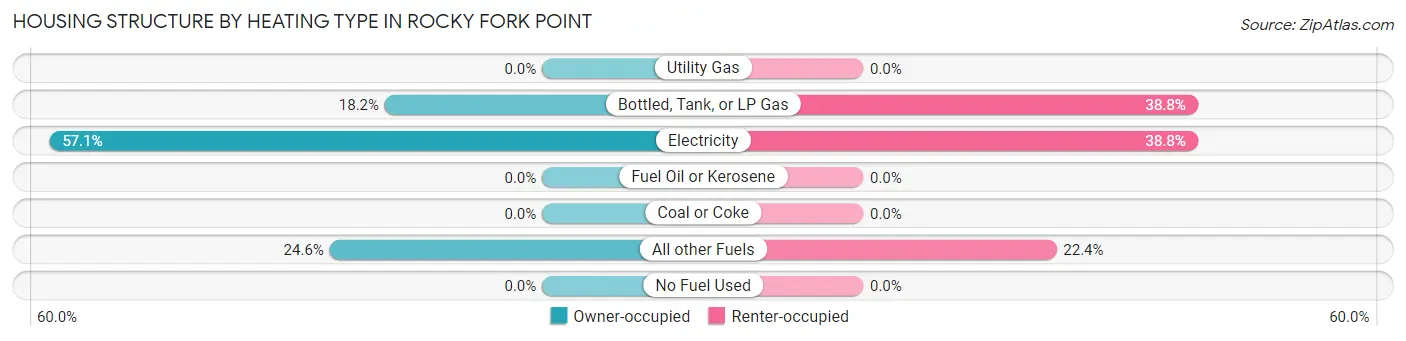
| Heating Type | Owner-occupied | Renter-occupied |
| Utility Gas | 0 (0.0%) | 0 (0.0%) |
| Bottled, Tank, or LP Gas | 37 (18.2%) | 45 (38.8%) |
| Electricity | 116 (57.1%) | 45 (38.8%) |
| Fuel Oil or Kerosene | 0 (0.0%) | 0 (0.0%) |
| Coal or Coke | 0 (0.0%) | 0 (0.0%) |
| All other Fuels | 50 (24.6%) | 26 (22.4%) |
| No Fuel Used | 0 (0.0%) | 0 (0.0%) |
| Total | 203 (100.0%) | 116 (100.0%) |
Household Vehicle Usage in Rocky Fork Point
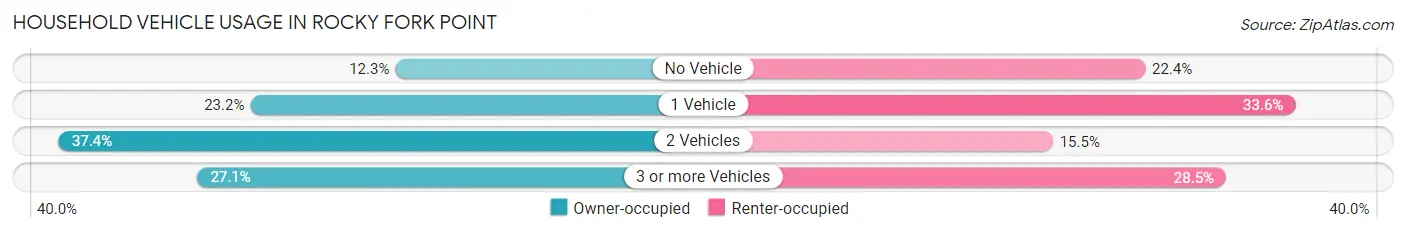
| Vehicles per Household | Owner-occupied | Renter-occupied |
| No Vehicle | 25 (12.3%) | 26 (22.4%) |
| 1 Vehicle | 47 (23.2%) | 39 (33.6%) |
| 2 Vehicles | 76 (37.4%) | 18 (15.5%) |
| 3 or more Vehicles | 55 (27.1%) | 33 (28.4%) |
| Total | 203 (100.0%) | 116 (100.0%) |
Real Estate & Mortgages in Rocky Fork Point
Real Estate and Mortgage Overview in Rocky Fork Point
| Characteristic | Without Mortgage | With Mortgage |
| Housing Units | 42 | 161 |
| Median Property Value | $32,600 | $88,500 |
| Median Household Income | - | - |
| Monthly Housing Costs | - | - |
| Real Estate Taxes | - | - |
Property Value by Mortgage Status in Rocky Fork Point
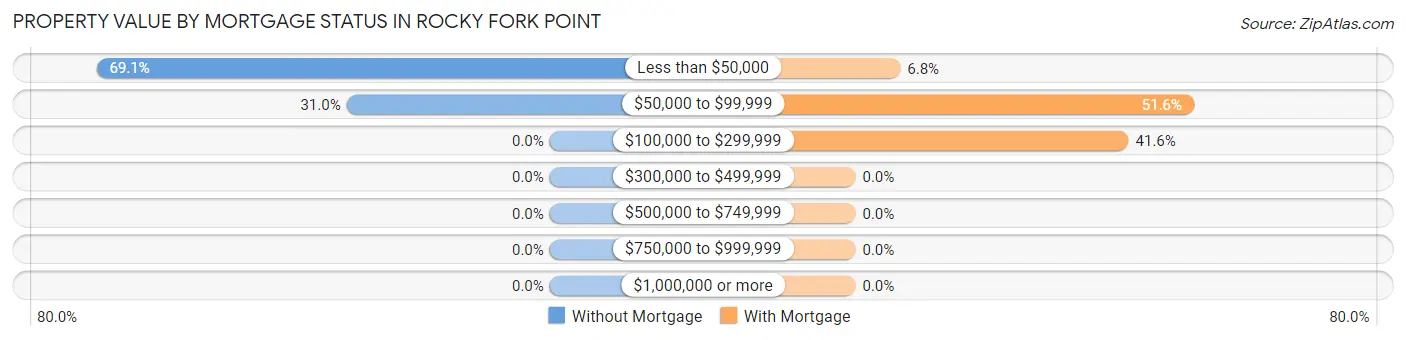
| Property Value | Without Mortgage | With Mortgage |
| Less than $50,000 | 29 (69.1%) | 11 (6.8%) |
| $50,000 to $99,999 | 13 (30.9%) | 83 (51.5%) |
| $100,000 to $299,999 | 0 (0.0%) | 67 (41.6%) |
| $300,000 to $499,999 | 0 (0.0%) | 0 (0.0%) |
| $500,000 to $749,999 | 0 (0.0%) | 0 (0.0%) |
| $750,000 to $999,999 | 0 (0.0%) | 0 (0.0%) |
| $1,000,000 or more | 0 (0.0%) | 0 (0.0%) |
| Total | 42 (100.0%) | 161 (100.0%) |
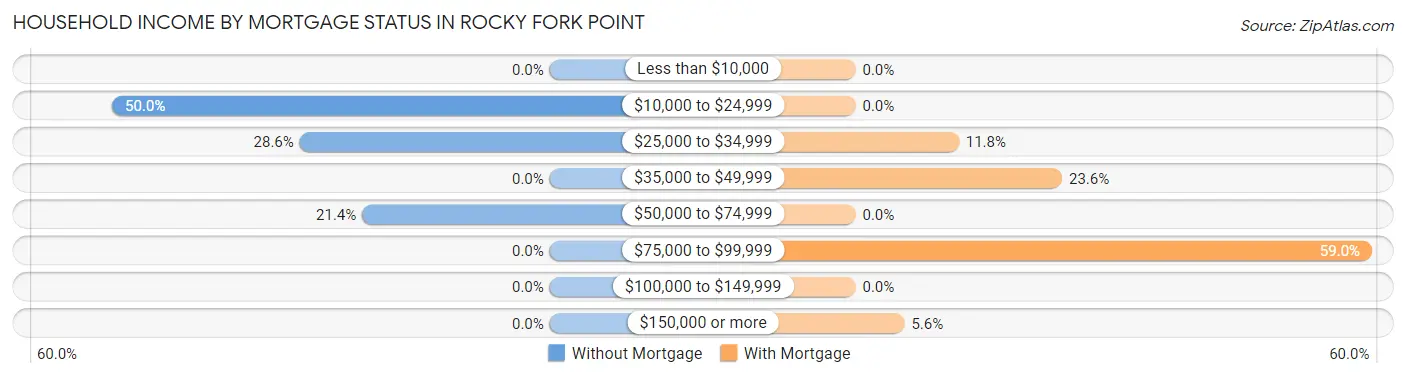
Household Income by Mortgage Status in Rocky Fork Point
| Household Income | Without Mortgage | With Mortgage |
| Less than $10,000 | 0 (0.0%) | 0 (0.0%) |
| $10,000 to $24,999 | 21 (50.0%) | 0 (0.0%) |
| $25,000 to $34,999 | 12 (28.6%) | 19 (11.8%) |
| $35,000 to $49,999 | 0 (0.0%) | 38 (23.6%) |
| $50,000 to $74,999 | 9 (21.4%) | 0 (0.0%) |
| $75,000 to $99,999 | 0 (0.0%) | 95 (59.0%) |
| $100,000 to $149,999 | 0 (0.0%) | 0 (0.0%) |
| $150,000 or more | 0 (0.0%) | 9 (5.6%) |
| Total | 42 (100.0%) | 161 (100.0%) |
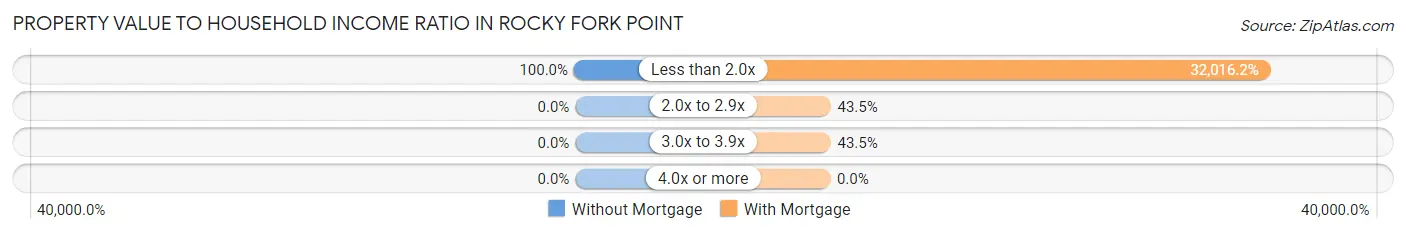
Property Value to Household Income Ratio in Rocky Fork Point
| Value-to-Income Ratio | Without Mortgage | With Mortgage |
| Less than 2.0x | 42 (100.0%) | 51,546 (32,016.1%) |
| 2.0x to 2.9x | 0 (0.0%) | 70 (43.5%) |
| 3.0x to 3.9x | 0 (0.0%) | 70 (43.5%) |
| 4.0x or more | 0 (0.0%) | 0 (0.0%) |
| Total | 42 (100.0%) | 161 (100.0%) |
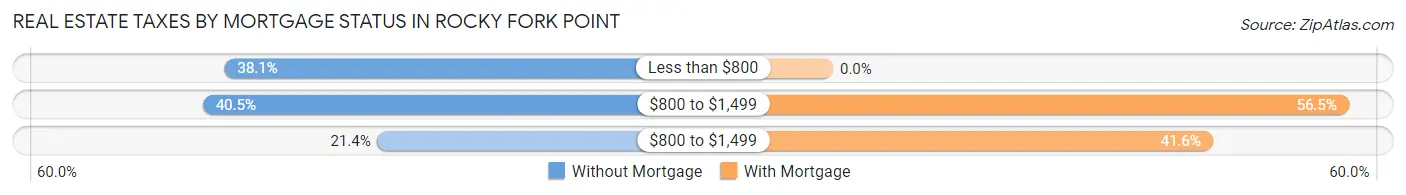
Real Estate Taxes by Mortgage Status in Rocky Fork Point
| Property Taxes | Without Mortgage | With Mortgage |
| Less than $800 | 16 (38.1%) | 0 (0.0%) |
| $800 to $1,499 | 17 (40.5%) | 91 (56.5%) |
| $800 to $1,499 | 9 (21.4%) | 67 (41.6%) |
| Total | 42 (100.0%) | 161 (100.0%) |
Health & Disability in Rocky Fork Point
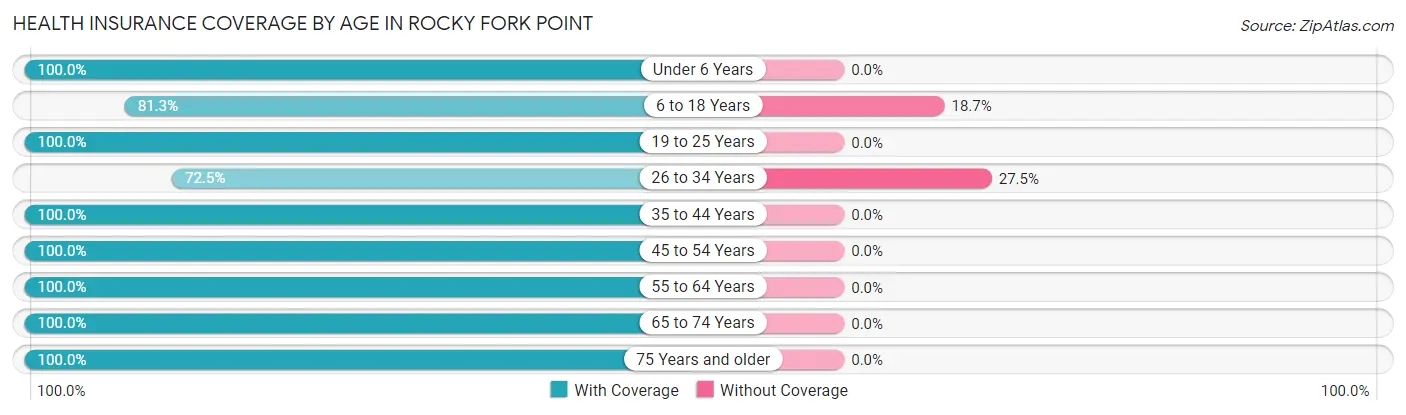
Health Insurance Coverage by Age in Rocky Fork Point
| Age Bracket | With Coverage | Without Coverage |
| Under 6 Years | 37 (100.0%) | 0 (0.0%) |
| 6 to 18 Years | 87 (81.3%) | 20 (18.7%) |
| 19 to 25 Years | 34 (100.0%) | 0 (0.0%) |
| 26 to 34 Years | 58 (72.5%) | 22 (27.5%) |
| 35 to 44 Years | 76 (100.0%) | 0 (0.0%) |
| 45 to 54 Years | 75 (100.0%) | 0 (0.0%) |
| 55 to 64 Years | 103 (100.0%) | 0 (0.0%) |
| 65 to 74 Years | 76 (100.0%) | 0 (0.0%) |
| 75 Years and older | 113 (100.0%) | 0 (0.0%) |
| Total | 659 (94.0%) | 42 (6.0%) |
Health Insurance Coverage by Citizenship Status in Rocky Fork Point
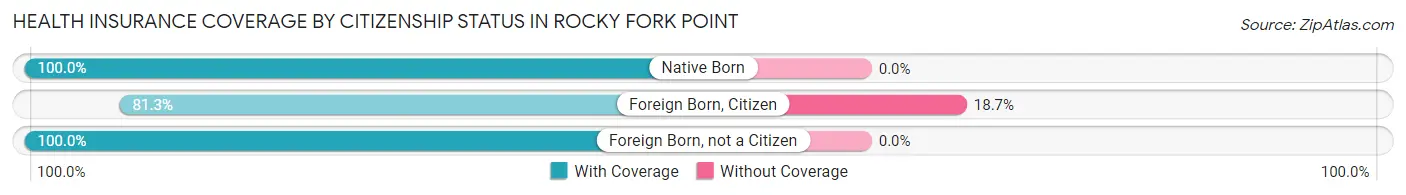
| Citizenship Status | With Coverage | Without Coverage |
| Native Born | 37 (100.0%) | 0 (0.0%) |
| Foreign Born, Citizen | 87 (81.3%) | 20 (18.7%) |
| Foreign Born, not a Citizen | 34 (100.0%) | 0 (0.0%) |
Health Insurance Coverage by Household Income in Rocky Fork Point
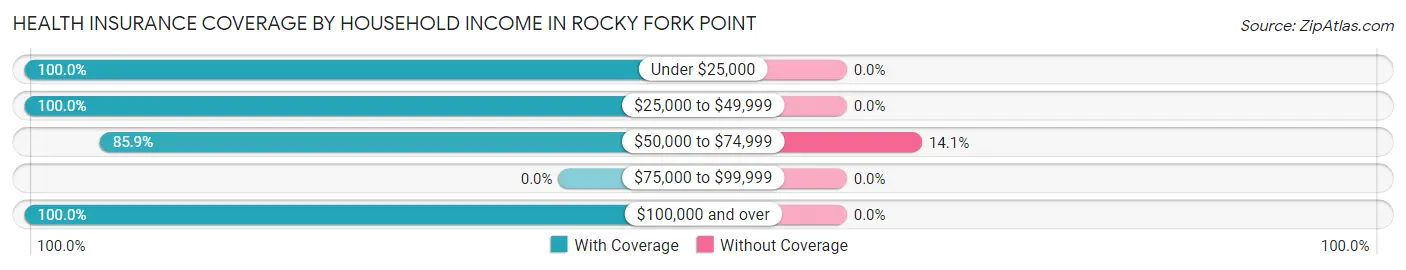
| Household Income | With Coverage | Without Coverage |
| Under $25,000 | 107 (100.0%) | 0 (0.0%) |
| $25,000 to $49,999 | 278 (100.0%) | 0 (0.0%) |
| $50,000 to $74,999 | 256 (85.9%) | 42 (14.1%) |
| $75,000 to $99,999 | 0 (0.0%) | 0 (0.0%) |
| $100,000 and over | 18 (100.0%) | 0 (0.0%) |
Public vs Private Health Insurance Coverage by Age in Rocky Fork Point
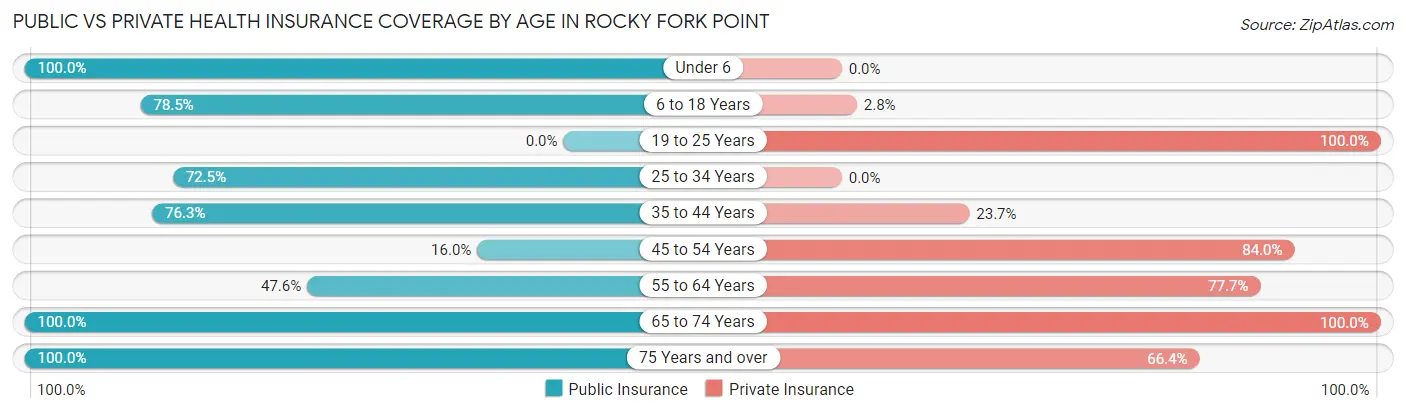
| Age Bracket | Public Insurance | Private Insurance |
| Under 6 | 37 (100.0%) | 0 (0.0%) |
| 6 to 18 Years | 84 (78.5%) | 3 (2.8%) |
| 19 to 25 Years | 0 (0.0%) | 34 (100.0%) |
| 25 to 34 Years | 58 (72.5%) | 0 (0.0%) |
| 35 to 44 Years | 58 (76.3%) | 18 (23.7%) |
| 45 to 54 Years | 12 (16.0%) | 63 (84.0%) |
| 55 to 64 Years | 49 (47.6%) | 80 (77.7%) |
| 65 to 74 Years | 76 (100.0%) | 76 (100.0%) |
| 75 Years and over | 113 (100.0%) | 75 (66.4%) |
| Total | 487 (69.5%) | 349 (49.8%) |
Disability Status by Sex by Age in Rocky Fork Point
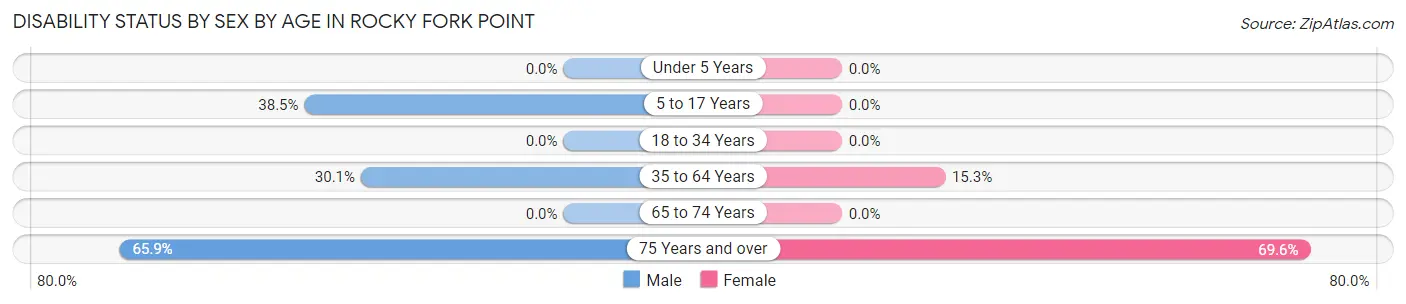
| Age Bracket | Male | Female |
| Under 5 Years | 0 (0.0%) | 0 (0.0%) |
| 5 to 17 Years | 15 (38.5%) | 0 (0.0%) |
| 18 to 34 Years | 0 (0.0%) | 0 (0.0%) |
| 35 to 64 Years | 43 (30.1%) | 17 (15.3%) |
| 65 to 74 Years | 0 (0.0%) | 0 (0.0%) |
| 75 Years and over | 29 (65.9%) | 48 (69.6%) |
Disability Class by Sex by Age in Rocky Fork Point
Disability Class: Hearing Difficulty
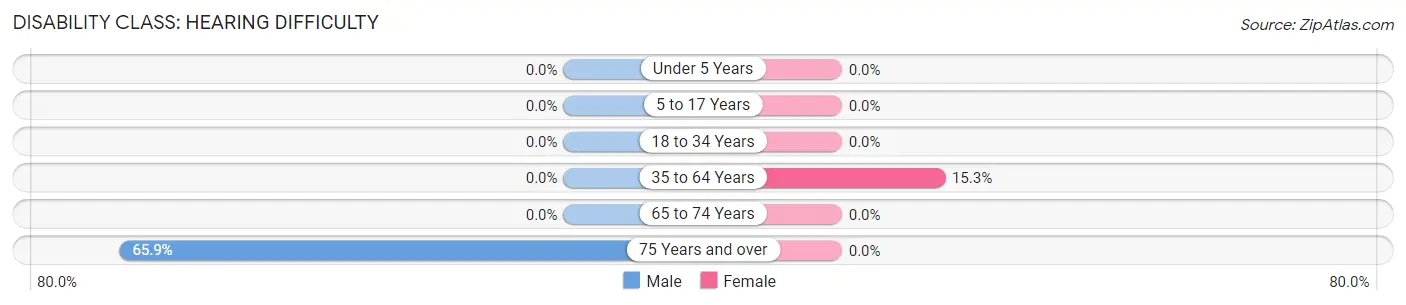
| Age Bracket | Male | Female |
| Under 5 Years | 0 (0.0%) | 0 (0.0%) |
| 5 to 17 Years | 0 (0.0%) | 0 (0.0%) |
| 18 to 34 Years | 0 (0.0%) | 0 (0.0%) |
| 35 to 64 Years | 0 (0.0%) | 17 (15.3%) |
| 65 to 74 Years | 0 (0.0%) | 0 (0.0%) |
| 75 Years and over | 29 (65.9%) | 0 (0.0%) |
Disability Class: Vision Difficulty
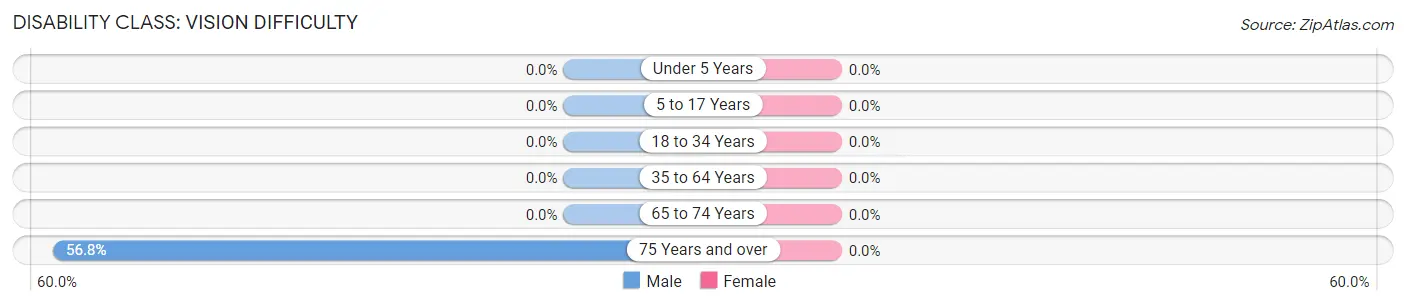
| Age Bracket | Male | Female |
| Under 5 Years | 0 (0.0%) | 0 (0.0%) |
| 5 to 17 Years | 0 (0.0%) | 0 (0.0%) |
| 18 to 34 Years | 0 (0.0%) | 0 (0.0%) |
| 35 to 64 Years | 0 (0.0%) | 0 (0.0%) |
| 65 to 74 Years | 0 (0.0%) | 0 (0.0%) |
| 75 Years and over | 25 (56.8%) | 0 (0.0%) |
Disability Class: Cognitive Difficulty
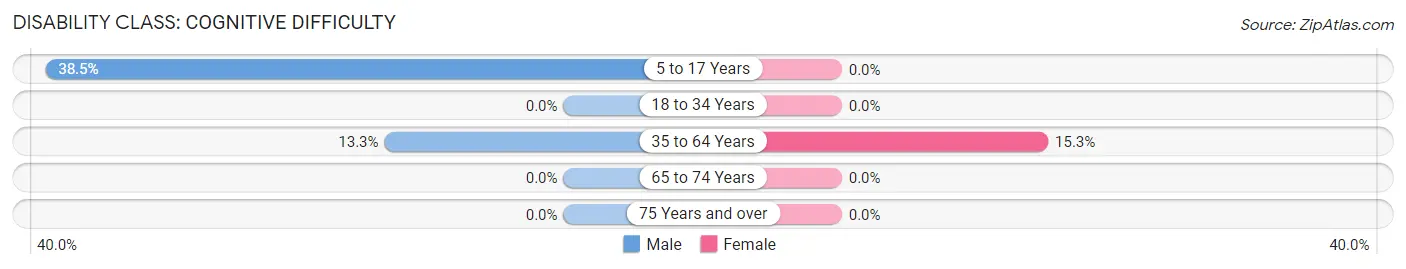
| Age Bracket | Male | Female |
| 5 to 17 Years | 15 (38.5%) | 0 (0.0%) |
| 18 to 34 Years | 0 (0.0%) | 0 (0.0%) |
| 35 to 64 Years | 19 (13.3%) | 17 (15.3%) |
| 65 to 74 Years | 0 (0.0%) | 0 (0.0%) |
| 75 Years and over | 0 (0.0%) | 0 (0.0%) |
Disability Class: Ambulatory Difficulty
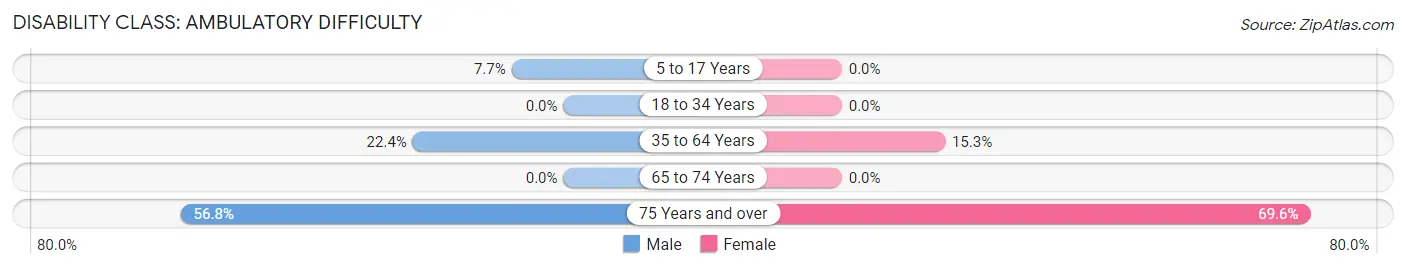
| Age Bracket | Male | Female |
| 5 to 17 Years | 3 (7.7%) | 0 (0.0%) |
| 18 to 34 Years | 0 (0.0%) | 0 (0.0%) |
| 35 to 64 Years | 32 (22.4%) | 17 (15.3%) |
| 65 to 74 Years | 0 (0.0%) | 0 (0.0%) |
| 75 Years and over | 25 (56.8%) | 48 (69.6%) |
Disability Class: Self-Care Difficulty
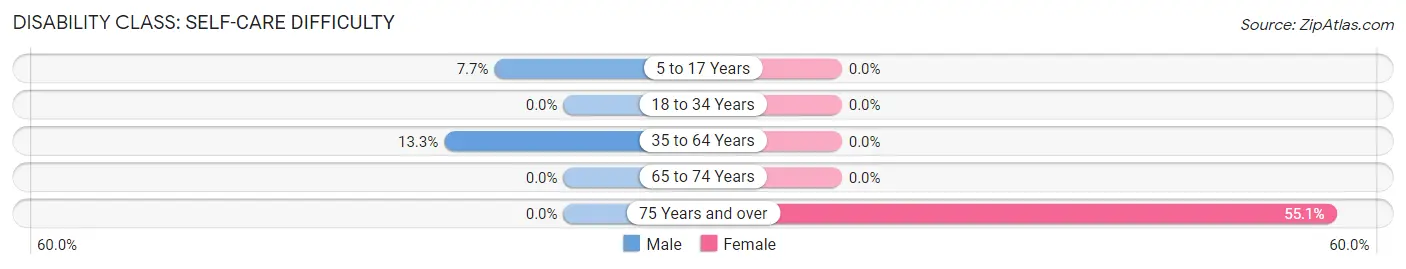
| Age Bracket | Male | Female |
| 5 to 17 Years | 3 (7.7%) | 0 (0.0%) |
| 18 to 34 Years | 0 (0.0%) | 0 (0.0%) |
| 35 to 64 Years | 19 (13.3%) | 0 (0.0%) |
| 65 to 74 Years | 0 (0.0%) | 0 (0.0%) |
| 75 Years and over | 0 (0.0%) | 38 (55.1%) |
Technology Access in Rocky Fork Point
Computing Device Access in Rocky Fork Point
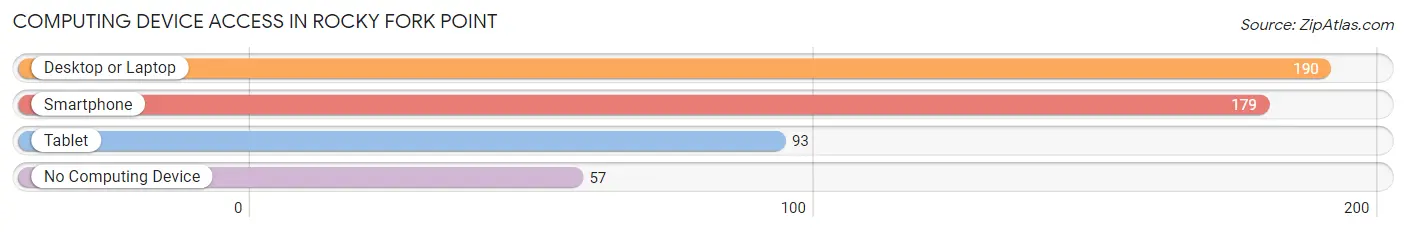
| Device Type | # Households | % Households |
| Desktop or Laptop | 190 | 59.6% |
| Smartphone | 179 | 56.1% |
| Tablet | 93 | 29.1% |
| No Computing Device | 57 | 17.9% |
| Total | 319 | 100.0% |
Internet Access in Rocky Fork Point
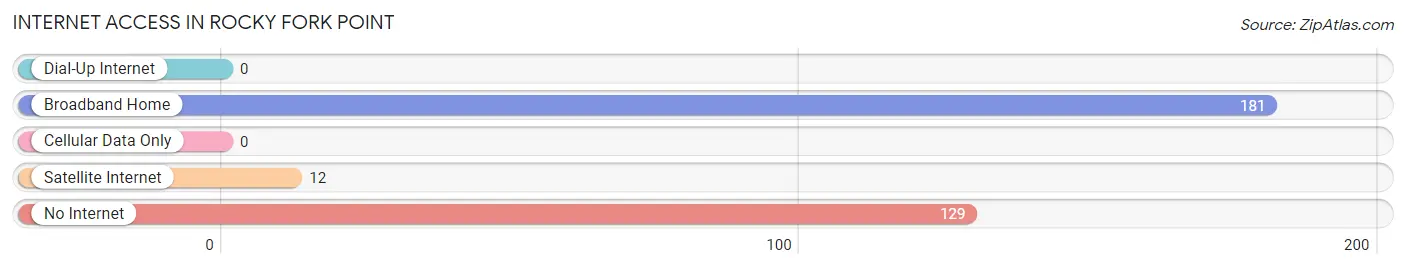
| Internet Type | # Households | % Households |
| Dial-Up Internet | 0 | 0.0% |
| Broadband Home | 181 | 56.7% |
| Cellular Data Only | 0 | 0.0% |
| Satellite Internet | 12 | 3.8% |
| No Internet | 129 | 40.4% |
| Total | 319 | 100.0% |
Rocky Fork Point Summary
Rocky Fork Point is a small unincorporated community located in the state of Ohio, United States. It is situated in the southeastern corner of Highland County, approximately 8 miles south of Hillsboro and 8 miles east of Greenfield. The community is located on the banks of Rocky Fork Creek, a tributary of the Little Miami River.
History
The area that is now Rocky Fork Point was first settled in the early 1800s by a group of settlers from Pennsylvania. The settlers were attracted to the area due to its abundance of natural resources, including timber, fish, and game. The first post office in the area was established in 1837, and the community was officially named Rocky Fork Point in 1845.
The community grew slowly over the years, and by the early 1900s, it had become a popular destination for vacationers. The area was known for its scenic beauty, and it was a popular spot for fishing and hunting.
In the late 1950s, the area began to experience a decline in population as many of the residents moved away in search of better economic opportunities. By the early 2000s, the population had dropped to just over 200 people.
Geography
Rocky Fork Point is located in the southeastern corner of Highland County, approximately 8 miles south of Hillsboro and 8 miles east of Greenfield. The community is situated on the banks of Rocky Fork Creek, a tributary of the Little Miami River. The area is mostly rural, with rolling hills and wooded areas.
The climate in Rocky Fork Point is typical of the Midwest, with hot summers and cold winters. The average annual temperature is around 50 degrees Fahrenheit, and the average annual precipitation is around 40 inches.
Economy
The economy of Rocky Fork Point is largely based on agriculture and tourism. The area is home to several small farms, which produce a variety of crops, including corn, soybeans, and wheat. The area is also popular with tourists, who come to enjoy the scenic beauty and outdoor activities.
Demographics
As of the 2010 census, the population of Rocky Fork Point was 203. The racial makeup of the community was 97.5% White, 0.5% African American, 0.5% Native American, 0.5% Asian, and 1% from other races. The median household income was $37,500, and the median family income was $41,250.
Conclusion
Rocky Fork Point is a small unincorporated community located in the southeastern corner of Highland County, Ohio. The area was first settled in the early 1800s, and it has since become a popular destination for tourists due to its scenic beauty and outdoor activities. The economy of the area is largely based on agriculture and tourism, and the population is mostly White.
Common Questions
What is Per Capita Income in Rocky Fork Point?
Per Capita income in Rocky Fork Point is $18,256.
What is the Median Family Income in Rocky Fork Point?
Median Family Income in Rocky Fork Point is $51,349.
What is the Median Household income in Rocky Fork Point?
Median Household Income in Rocky Fork Point is $34,386.
What is Income or Wage Gap in Rocky Fork Point?
Income or Wage Gap in Rocky Fork Point is 28.2%.
Women in Rocky Fork Point earn 71.8 cents for every dollar earned by a man.
What is Inequality or Gini Index in Rocky Fork Point?
Inequality or Gini Index in Rocky Fork Point is 0.31.
What is the Total Population of Rocky Fork Point?
Total Population of Rocky Fork Point is 701.
What is the Total Male Population of Rocky Fork Point?
Total Male Population of Rocky Fork Point is 342.
What is the Total Female Population of Rocky Fork Point?
Total Female Population of Rocky Fork Point is 359.
What is the Ratio of Males per 100 Females in Rocky Fork Point?
There are 95.26 Males per 100 Females in Rocky Fork Point.
What is the Ratio of Females per 100 Males in Rocky Fork Point?
There are 104.97 Females per 100 Males in Rocky Fork Point.
What is the Median Population Age in Rocky Fork Point?
Median Population Age in Rocky Fork Point is 50.3 Years.
What is the Average Family Size in Rocky Fork Point
Average Family Size in Rocky Fork Point is 3.1 People.
What is the Average Household Size in Rocky Fork Point
Average Household Size in Rocky Fork Point is 2.2 People.
How Large is the Labor Force in Rocky Fork Point?
There are 250 People in the Labor Forcein in Rocky Fork Point.
What is the Percentage of People in the Labor Force in Rocky Fork Point?
44.9% of People are in the Labor Force in Rocky Fork Point.