New Haven CDP Huron County, OH Map & Demographics
New Haven CDP Huron County Overview
$17,224
PER CAPITA INCOME
$52,647
AVG FAMILY INCOME
$52,656
AVG HOUSEHOLD INCOME
62.8%
WAGE / INCOME GAP [ % ]
37.2¢/ $1
WAGE / INCOME GAP [ $ ]
0.30
INEQUALITY / GINI INDEX
520
TOTAL POPULATION
217
MALE POPULATION
303
FEMALE POPULATION
71.62
MALES / 100 FEMALES
139.63
FEMALES / 100 MALES
43.5
MEDIAN AGE
2.5
AVG FAMILY SIZE
2.8
AVG HOUSEHOLD SIZE
291
LABOR FORCE [ PEOPLE ]
64.1%
PERCENT IN LABOR FORCE
5.8%
UNEMPLOYMENT RATE
Income in New Haven CDP Huron County
Income Overview in New Haven CDP Huron County
Per Capita Income in New Haven CDP Huron County is $17,224, while median incomes of families and households are $52,647 and $52,656 respectively.
| Characteristic | Number | Measure |
| Per Capita Income | 520 | $17,224 |
| Median Family Income | 166 | $52,647 |
| Mean Family Income | 166 | $48,347 |
| Median Household Income | 183 | $52,656 |
| Mean Household Income | 183 | $51,880 |
| Income Deficit | 166 | $0 |
| Wage / Income Gap (%) | 520 | 62.79% |
| Wage / Income Gap ($) | 520 | 37.21¢ per $1 |
| Gini / Inequality Index | 520 | 0.30 |
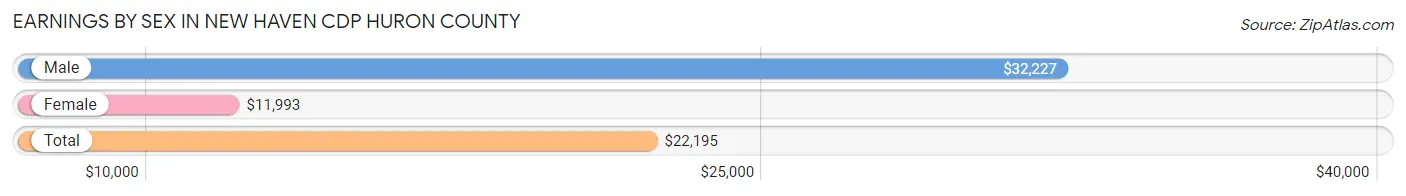
Earnings by Sex in New Haven CDP Huron County
Average Earnings in New Haven CDP Huron County are $22,195, $32,227 for men and $11,993 for women, a difference of 62.8%.
| Sex | Number | Average Earnings |
| Male | 132 (43.1%) | $32,227 |
| Female | 174 (56.9%) | $11,993 |
| Total | 306 (100.0%) | $22,195 |
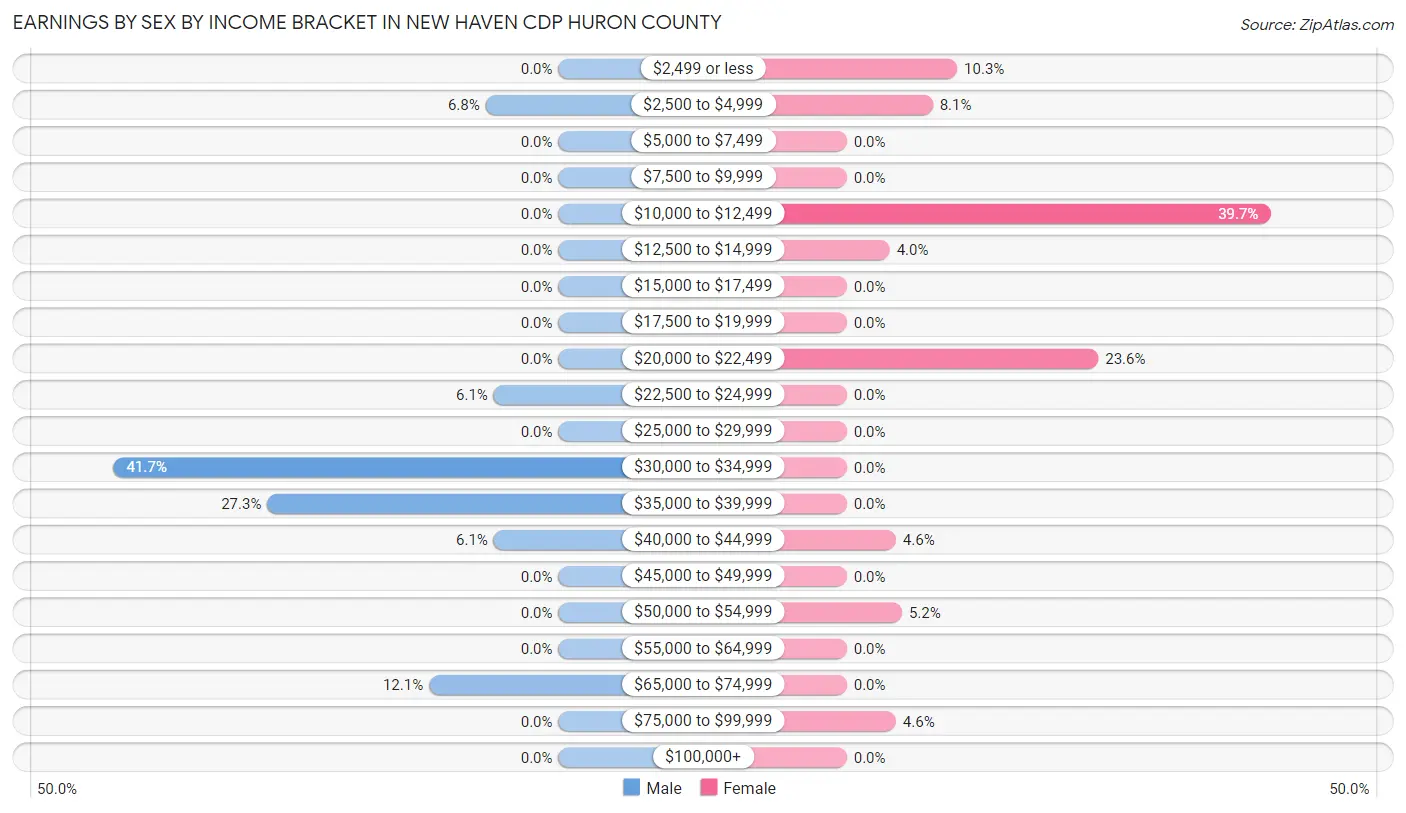
Earnings by Sex by Income Bracket in New Haven CDP Huron County
The most common earnings brackets in New Haven CDP Huron County are $30,000 to $34,999 for men (55 | 41.7%) and $10,000 to $12,499 for women (69 | 39.7%).
| Income | Male | Female |
| $2,499 or less | 0 (0.0%) | 18 (10.3%) |
| $2,500 to $4,999 | 9 (6.8%) | 14 (8.1%) |
| $5,000 to $7,499 | 0 (0.0%) | 0 (0.0%) |
| $7,500 to $9,999 | 0 (0.0%) | 0 (0.0%) |
| $10,000 to $12,499 | 0 (0.0%) | 69 (39.7%) |
| $12,500 to $14,999 | 0 (0.0%) | 7 (4.0%) |
| $15,000 to $17,499 | 0 (0.0%) | 0 (0.0%) |
| $17,500 to $19,999 | 0 (0.0%) | 0 (0.0%) |
| $20,000 to $22,499 | 0 (0.0%) | 41 (23.6%) |
| $22,500 to $24,999 | 8 (6.1%) | 0 (0.0%) |
| $25,000 to $29,999 | 0 (0.0%) | 0 (0.0%) |
| $30,000 to $34,999 | 55 (41.7%) | 0 (0.0%) |
| $35,000 to $39,999 | 36 (27.3%) | 0 (0.0%) |
| $40,000 to $44,999 | 8 (6.1%) | 8 (4.6%) |
| $45,000 to $49,999 | 0 (0.0%) | 0 (0.0%) |
| $50,000 to $54,999 | 0 (0.0%) | 9 (5.2%) |
| $55,000 to $64,999 | 0 (0.0%) | 0 (0.0%) |
| $65,000 to $74,999 | 16 (12.1%) | 0 (0.0%) |
| $75,000 to $99,999 | 0 (0.0%) | 8 (4.6%) |
| $100,000+ | 0 (0.0%) | 0 (0.0%) |
| Total | 132 (100.0%) | 174 (100.0%) |
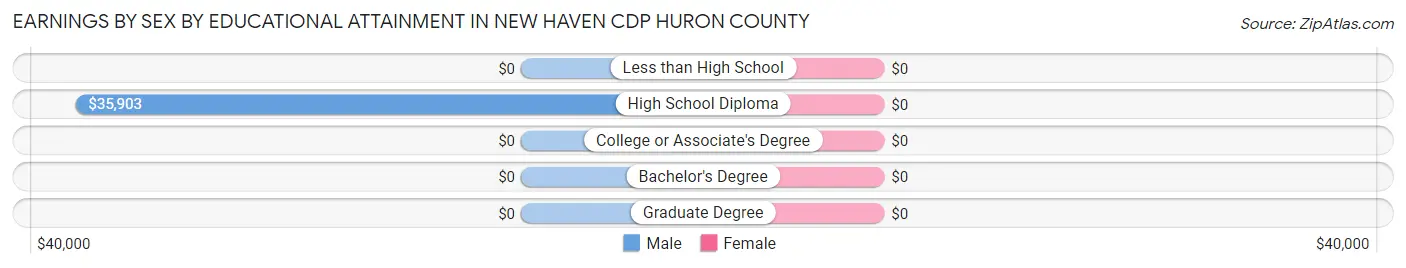
Earnings by Sex by Educational Attainment in New Haven CDP Huron County
| Educational Attainment | Male Income | Female Income |
| Less than High School | - | - |
| High School Diploma | $35,903 | $0 |
| College or Associate's Degree | - | - |
| Bachelor's Degree | - | - |
| Graduate Degree | - | - |
| Total | $32,227 | $21,250 |
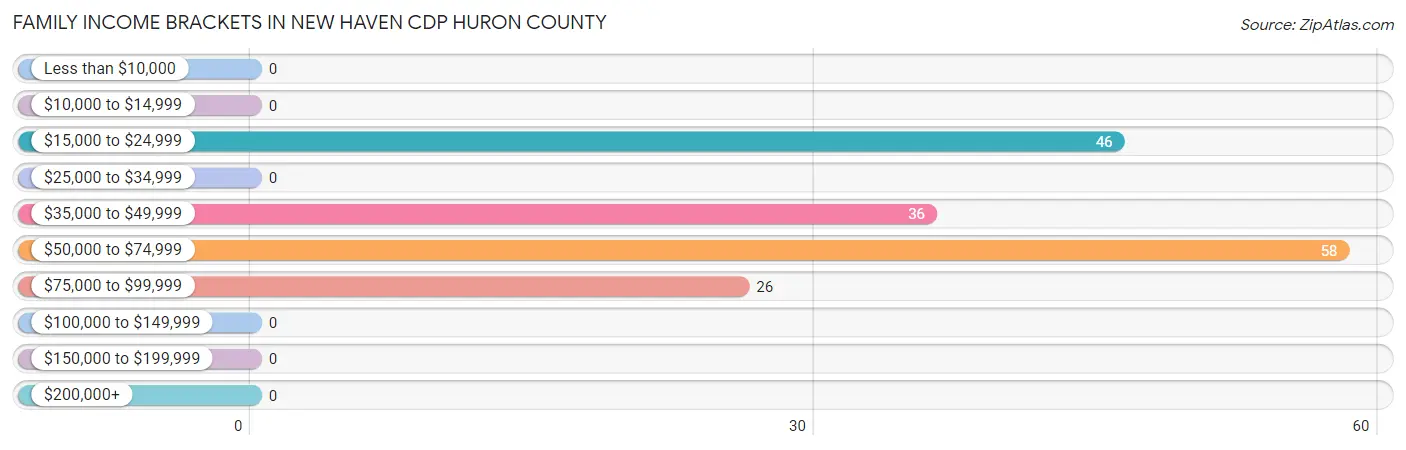
Family Income in New Haven CDP Huron County
Family Income Brackets in New Haven CDP Huron County
According to the New Haven CDP Huron County family income data, there are 58 families falling into the $50,000 to $74,999 income range, which is the most common income bracket and makes up 34.9% of all families.
| Income Bracket | # Families | % Families |
| Less than $10,000 | 0 | 0.0% |
| $10,000 to $14,999 | 0 | 0.0% |
| $15,000 to $24,999 | 46 | 27.7% |
| $25,000 to $34,999 | 0 | 0.0% |
| $35,000 to $49,999 | 36 | 21.7% |
| $50,000 to $74,999 | 58 | 34.9% |
| $75,000 to $99,999 | 26 | 15.7% |
| $100,000 to $149,999 | 0 | 0.0% |
| $150,000 to $199,999 | 0 | 0.0% |
| $200,000+ | 0 | 0.0% |
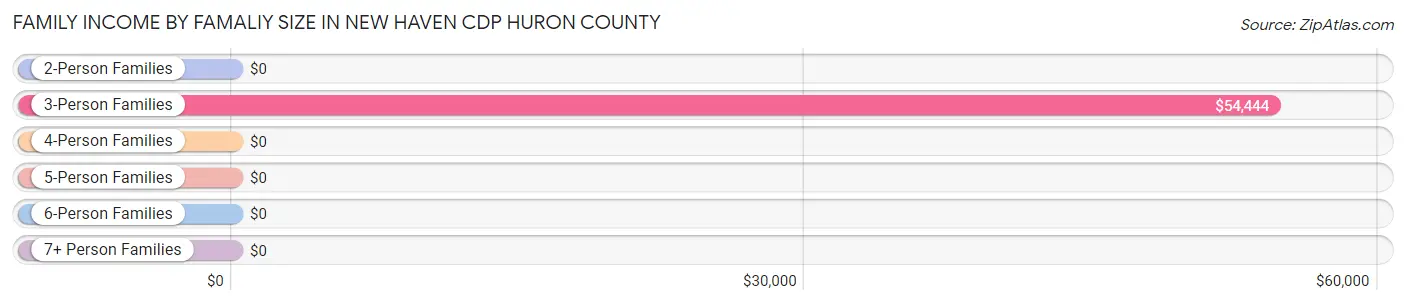
Family Income by Famaliy Size in New Haven CDP Huron County
3-person families (86 | 51.8%) account for the highest median family income in New Haven CDP Huron County with $54,444 per family, while 3-person families (86 | 51.8%) have the highest median income of $18,148 per family member.
| Income Bracket | # Families | Median Income |
| 2-Person Families | 63 (38.0%) | $0 |
| 3-Person Families | 86 (51.8%) | $54,444 |
| 4-Person Families | 17 (10.2%) | $0 |
| 5-Person Families | 0 (0.0%) | $0 |
| 6-Person Families | 0 (0.0%) | $0 |
| 7+ Person Families | 0 (0.0%) | $0 |
| Total | 166 (100.0%) | $52,647 |
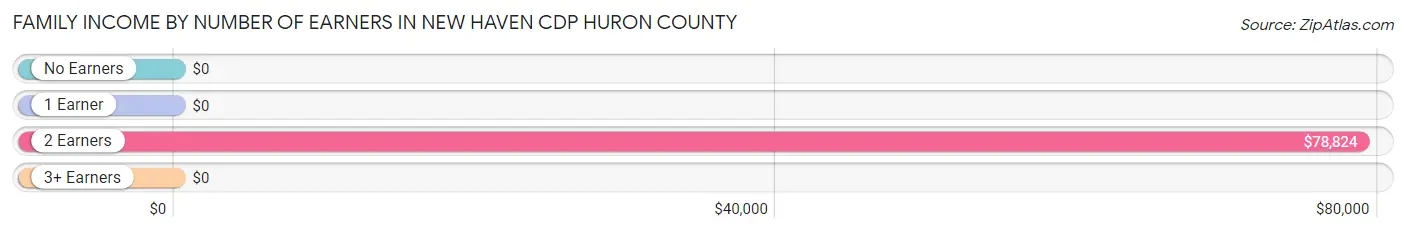
Family Income by Number of Earners in New Haven CDP Huron County
| Number of Earners | # Families | Median Income |
| No Earners | 46 (27.7%) | $0 |
| 1 Earner | 45 (27.1%) | $0 |
| 2 Earners | 34 (20.5%) | $78,824 |
| 3+ Earners | 41 (24.7%) | $0 |
| Total | 166 (100.0%) | $52,647 |
Household Income in New Haven CDP Huron County
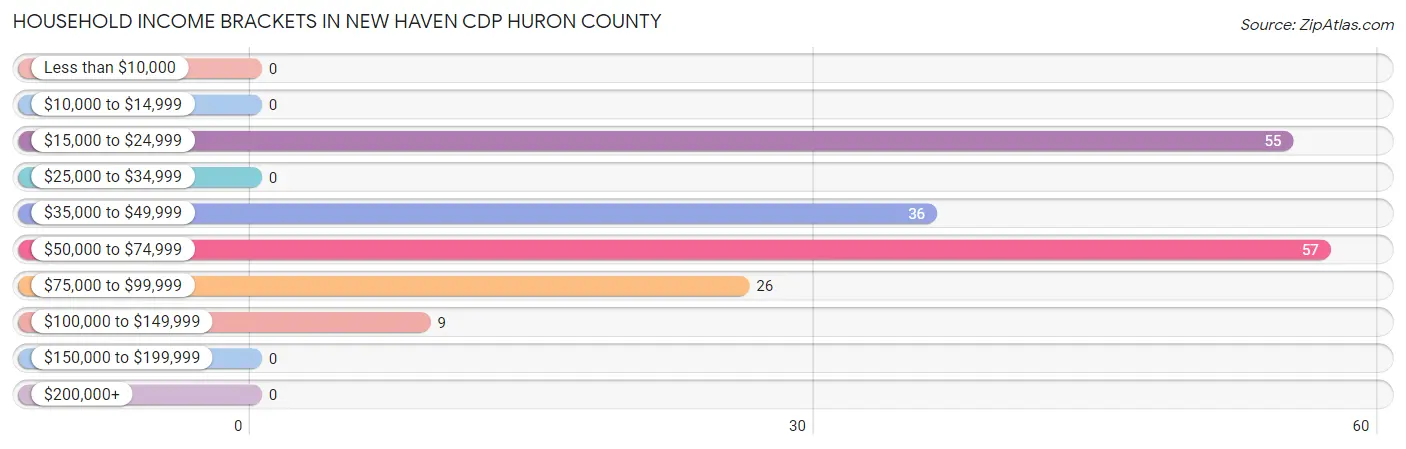
Household Income Brackets in New Haven CDP Huron County
With 57 households falling in the category, the $50,000 to $74,999 income range is the most frequent in New Haven CDP Huron County, accounting for 31.1% of all households.
| Income Bracket | # Households | % Households |
| Less than $10,000 | 0 | 0.0% |
| $10,000 to $14,999 | 0 | 0.0% |
| $15,000 to $24,999 | 55 | 30.1% |
| $25,000 to $34,999 | 0 | 0.0% |
| $35,000 to $49,999 | 36 | 19.7% |
| $50,000 to $74,999 | 57 | 31.1% |
| $75,000 to $99,999 | 26 | 14.2% |
| $100,000 to $149,999 | 9 | 4.9% |
| $150,000 to $199,999 | 0 | 0.0% |
| $200,000+ | 0 | 0.0% |
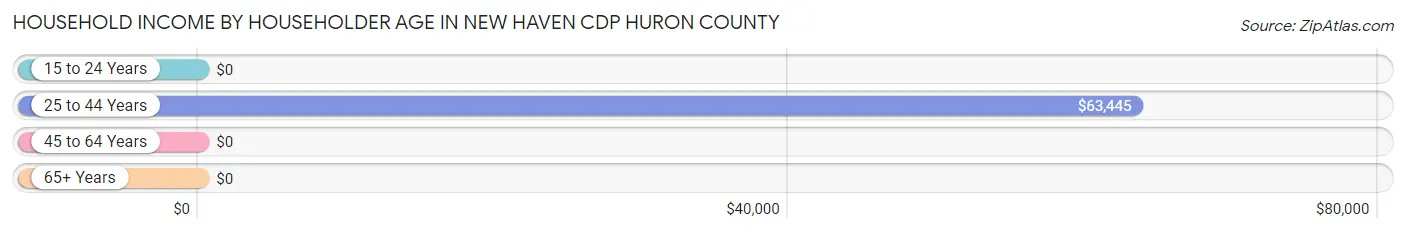
Household Income by Householder Age in New Haven CDP Huron County
The median household income in New Haven CDP Huron County is $52,656, with the highest median household income of $63,445 found in the 25 to 44 years age bracket for the primary householder. A total of 103 households (56.3%) fall into this category.
| Income Bracket | # Households | Median Income |
| 15 to 24 Years | 0 (0.0%) | $0 |
| 25 to 44 Years | 103 (56.3%) | $63,445 |
| 45 to 64 Years | 71 (38.8%) | $0 |
| 65+ Years | 9 (4.9%) | $0 |
| Total | 183 (100.0%) | $52,656 |
Poverty in New Haven CDP Huron County
Income Below Poverty by Sex and Age in New Haven CDP Huron County
With 35.0% poverty level for males and 21.1% for females among the residents of New Haven CDP Huron County, 65 to 74 year old males and 55 to 64 year old females are the most vulnerable to poverty, with 18 males (100.0%) and 46 females (86.8%) in their respective age groups living below the poverty level.
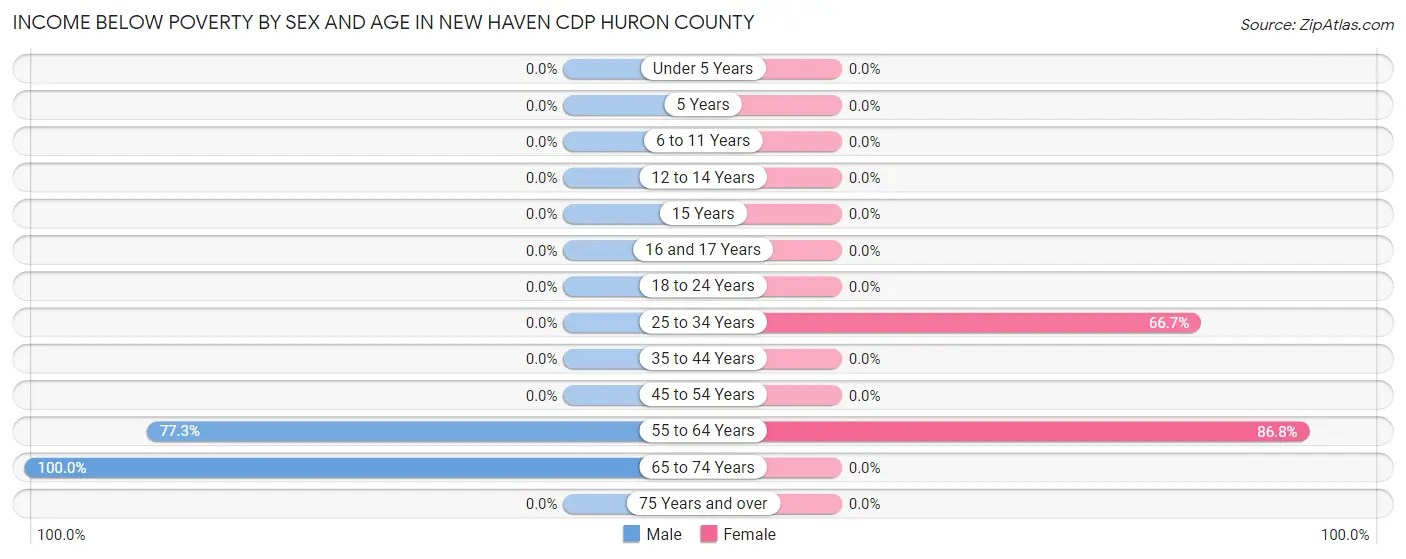
| Age Bracket | Male | Female |
| Under 5 Years | 0 (0.0%) | 0 (0.0%) |
| 5 Years | 0 (0.0%) | 0 (0.0%) |
| 6 to 11 Years | 0 (0.0%) | 0 (0.0%) |
| 12 to 14 Years | 0 (0.0%) | 0 (0.0%) |
| 15 Years | 0 (0.0%) | 0 (0.0%) |
| 16 and 17 Years | 0 (0.0%) | 0 (0.0%) |
| 18 to 24 Years | 0 (0.0%) | 0 (0.0%) |
| 25 to 34 Years | 0 (0.0%) | 18 (66.7%) |
| 35 to 44 Years | 0 (0.0%) | 0 (0.0%) |
| 45 to 54 Years | 0 (0.0%) | 0 (0.0%) |
| 55 to 64 Years | 58 (77.3%) | 46 (86.8%) |
| 65 to 74 Years | 18 (100.0%) | 0 (0.0%) |
| 75 Years and over | 0 (0.0%) | 0 (0.0%) |
| Total | 76 (35.0%) | 64 (21.1%) |
Income Above Poverty by Sex and Age in New Haven CDP Huron County
According to the poverty statistics in New Haven CDP Huron County, males aged 25 to 34 years and females aged under 5 years are the age groups that are most secure financially, with 100.0% of males and 100.0% of females in these age groups living above the poverty line.
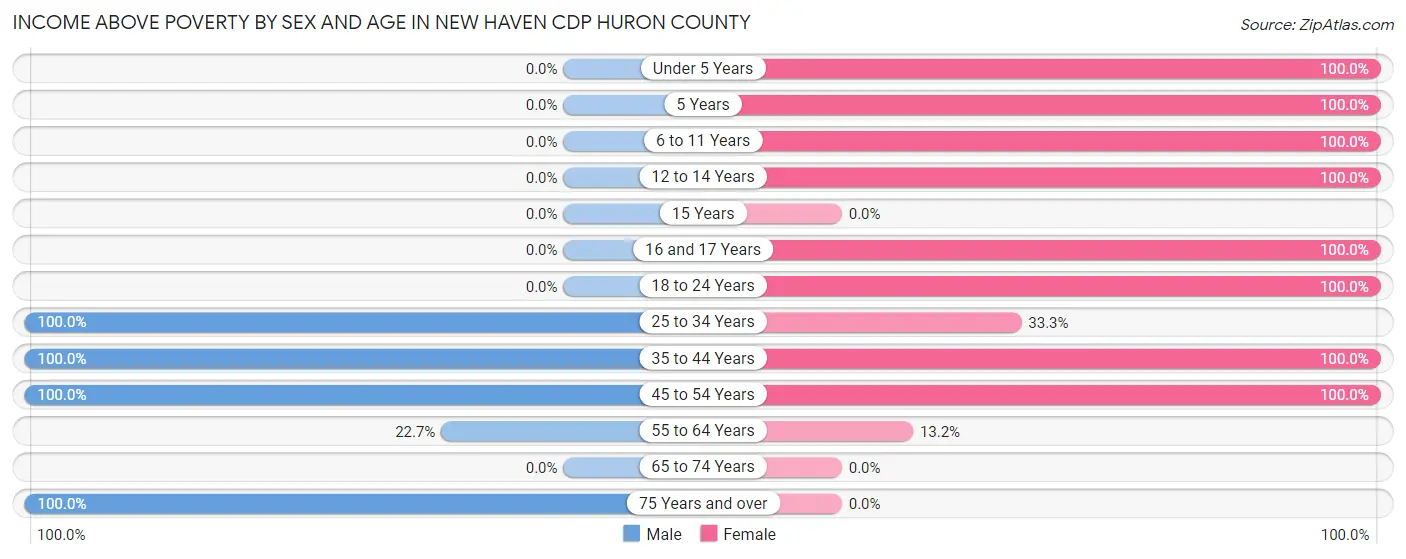
| Age Bracket | Male | Female |
| Under 5 Years | 0 (0.0%) | 31 (100.0%) |
| 5 Years | 0 (0.0%) | 16 (100.0%) |
| 6 to 11 Years | 0 (0.0%) | 7 (100.0%) |
| 12 to 14 Years | 0 (0.0%) | 12 (100.0%) |
| 15 Years | 0 (0.0%) | 0 (0.0%) |
| 16 and 17 Years | 0 (0.0%) | 14 (100.0%) |
| 18 to 24 Years | 0 (0.0%) | 69 (100.0%) |
| 25 to 34 Years | 36 (100.0%) | 9 (33.3%) |
| 35 to 44 Years | 7 (100.0%) | 58 (100.0%) |
| 45 to 54 Years | 72 (100.0%) | 16 (100.0%) |
| 55 to 64 Years | 17 (22.7%) | 7 (13.2%) |
| 65 to 74 Years | 0 (0.0%) | 0 (0.0%) |
| 75 Years and over | 9 (100.0%) | 0 (0.0%) |
| Total | 141 (65.0%) | 239 (78.9%) |
Income Below Poverty Among Married-Couple Families in New Haven CDP Huron County
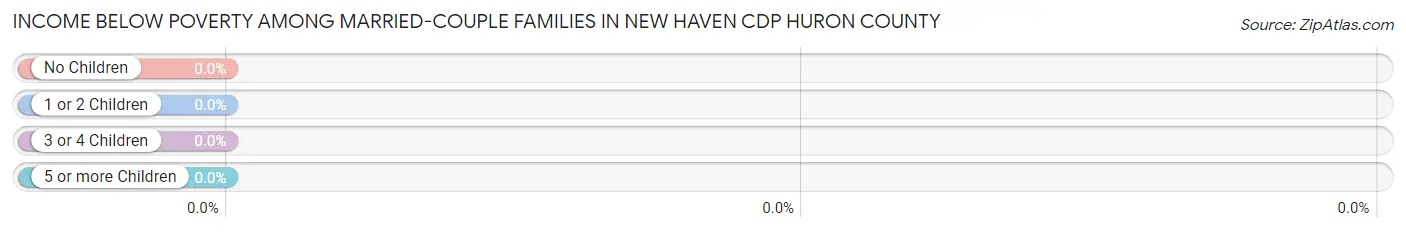
| Children | Above Poverty | Below Poverty |
| No Children | 58 (100.0%) | 0 (0.0%) |
| 1 or 2 Children | 17 (100.0%) | 0 (0.0%) |
| 3 or 4 Children | 0 (0.0%) | 0 (0.0%) |
| 5 or more Children | 0 (0.0%) | 0 (0.0%) |
| Total | 75 (100.0%) | 0 (0.0%) |
Income Below Poverty Among Single-Parent Households in New Haven CDP Huron County
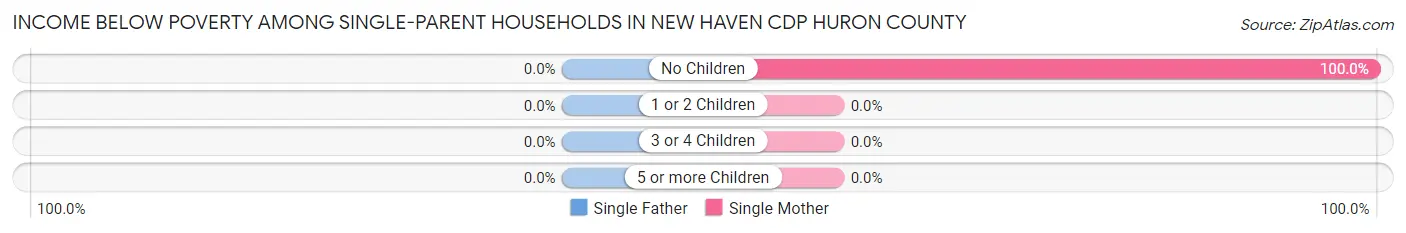
| Children | Single Father | Single Mother |
| No Children | 0 (0.0%) | 46 (100.0%) |
| 1 or 2 Children | 0 (0.0%) | 0 (0.0%) |
| 3 or 4 Children | 0 (0.0%) | 0 (0.0%) |
| 5 or more Children | 0 (0.0%) | 0 (0.0%) |
| Total | 0 (0.0%) | 46 (83.6%) |
Income Below Poverty Among Married-Couple vs Single-Parent Households in New Haven CDP Huron County
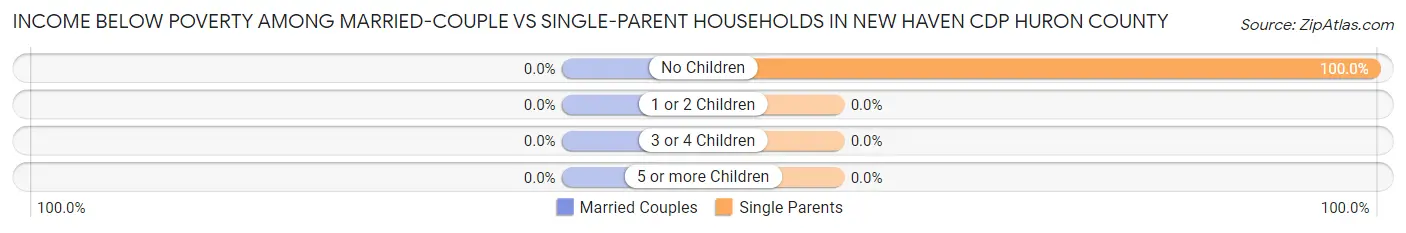
| Children | Married-Couple Families | Single-Parent Households |
| No Children | 0 (0.0%) | 46 (100.0%) |
| 1 or 2 Children | 0 (0.0%) | 0 (0.0%) |
| 3 or 4 Children | 0 (0.0%) | 0 (0.0%) |
| 5 or more Children | 0 (0.0%) | 0 (0.0%) |
| Total | 0 (0.0%) | 46 (50.5%) |
Race in New Haven CDP Huron County
The most populous races in New Haven CDP Huron County are White / Caucasian (275 | 52.9%), Two or more Races (245 | 47.1%), and Hispanic or Latino (198 | 38.1%).
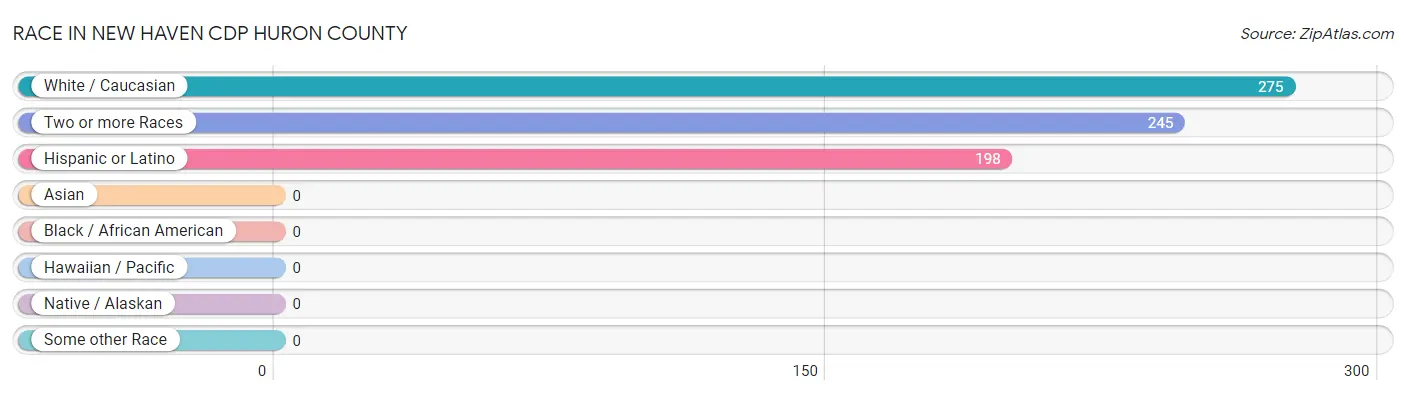
| Race | # Population | % Population |
| Asian | 0 | 0.0% |
| Black / African American | 0 | 0.0% |
| Hawaiian / Pacific | 0 | 0.0% |
| Hispanic or Latino | 198 | 38.1% |
| Native / Alaskan | 0 | 0.0% |
| White / Caucasian | 275 | 52.9% |
| Two or more Races | 245 | 47.1% |
| Some other Race | 0 | 0.0% |
| Total | 520 | 100.0% |
Ancestry in New Haven CDP Huron County
The most populous ancestries reported in New Haven CDP Huron County are Mexican (129 | 24.8%), English (99 | 19.0%), German (75 | 14.4%), American (64 | 12.3%), and Italian (58 | 11.2%), together accounting for 81.7% of all New Haven CDP Huron County residents.
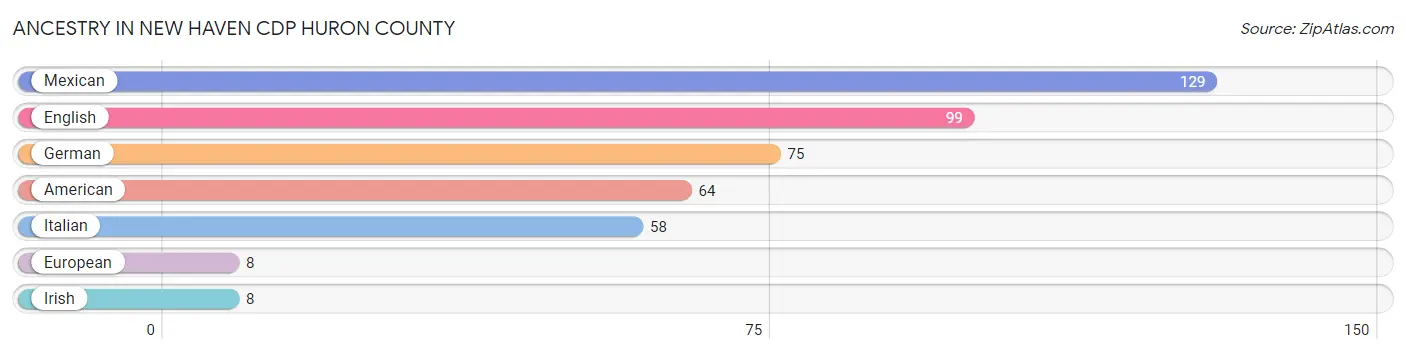
| Ancestry | # Population | % Population |
| American | 64 | 12.3% |
| English | 99 | 19.0% |
| European | 8 | 1.5% |
| German | 75 | 14.4% |
| Irish | 8 | 1.5% |
| Italian | 58 | 11.2% |
| Mexican | 129 | 24.8% | View All 7 Rows |
Immigrants in New Haven CDP Huron County

| Immigration Origin | # Population | % Population | View All 0 Rows |
Sex and Age in New Haven CDP Huron County
Sex and Age in New Haven CDP Huron County
The most populous age groups in New Haven CDP Huron County are 55 to 59 Years (67 | 30.9%) for men and 15 to 19 Years (83 | 27.4%) for women.
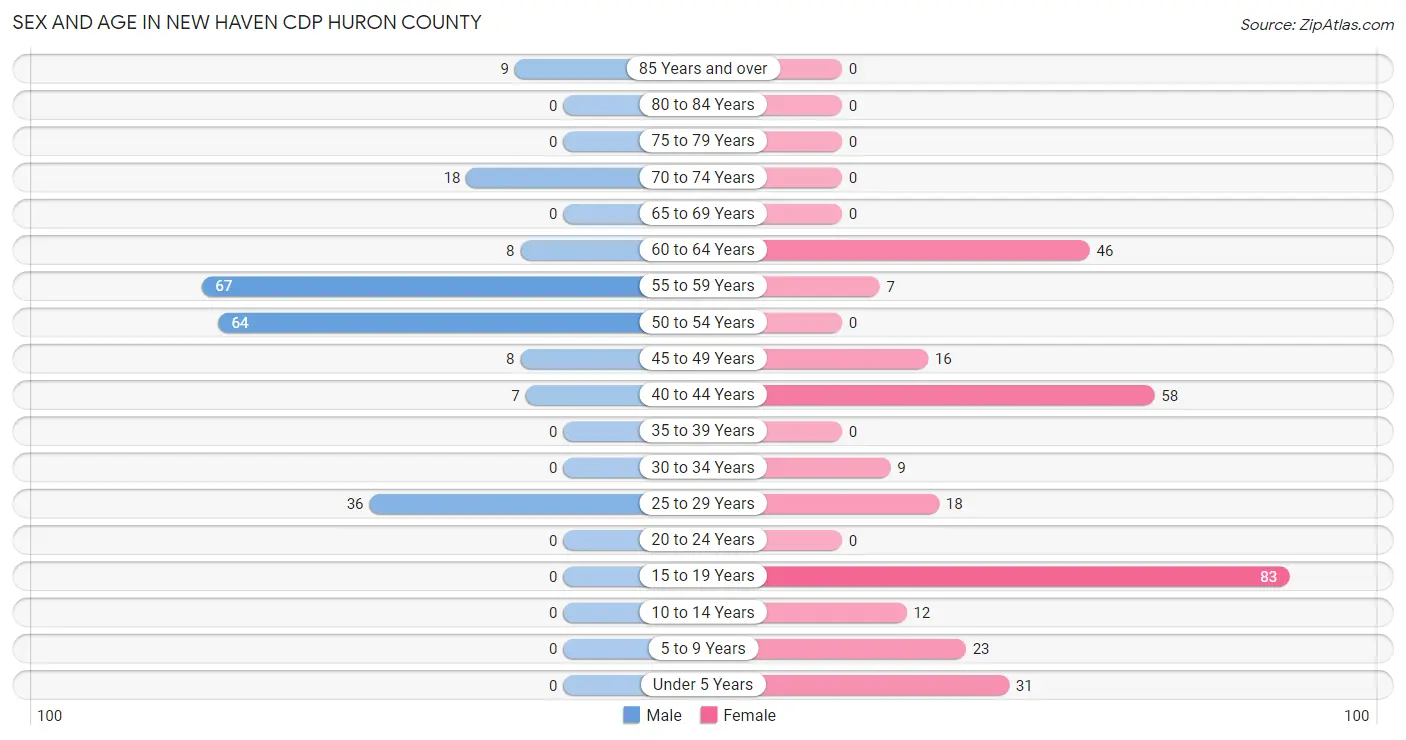
| Age Bracket | Male | Female |
| Under 5 Years | 0 (0.0%) | 31 (10.2%) |
| 5 to 9 Years | 0 (0.0%) | 23 (7.6%) |
| 10 to 14 Years | 0 (0.0%) | 12 (4.0%) |
| 15 to 19 Years | 0 (0.0%) | 83 (27.4%) |
| 20 to 24 Years | 0 (0.0%) | 0 (0.0%) |
| 25 to 29 Years | 36 (16.6%) | 18 (5.9%) |
| 30 to 34 Years | 0 (0.0%) | 9 (3.0%) |
| 35 to 39 Years | 0 (0.0%) | 0 (0.0%) |
| 40 to 44 Years | 7 (3.2%) | 58 (19.1%) |
| 45 to 49 Years | 8 (3.7%) | 16 (5.3%) |
| 50 to 54 Years | 64 (29.5%) | 0 (0.0%) |
| 55 to 59 Years | 67 (30.9%) | 7 (2.3%) |
| 60 to 64 Years | 8 (3.7%) | 46 (15.2%) |
| 65 to 69 Years | 0 (0.0%) | 0 (0.0%) |
| 70 to 74 Years | 18 (8.3%) | 0 (0.0%) |
| 75 to 79 Years | 0 (0.0%) | 0 (0.0%) |
| 80 to 84 Years | 0 (0.0%) | 0 (0.0%) |
| 85 Years and over | 9 (4.2%) | 0 (0.0%) |
| Total | 217 (100.0%) | 303 (100.0%) |
Families and Households in New Haven CDP Huron County
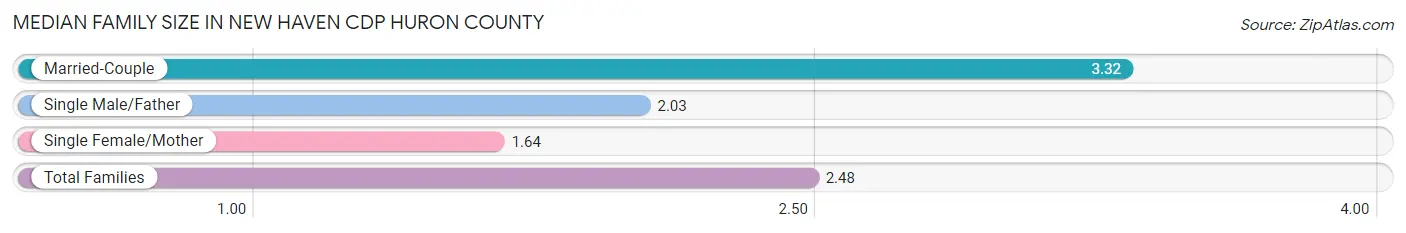
Median Family Size in New Haven CDP Huron County
The median family size in New Haven CDP Huron County is 2.48 persons per family, with married-couple families (75 | 45.2%) accounting for the largest median family size of 3.32 persons per family. On the other hand, single female/mother families (55 | 33.1%) represent the smallest median family size with 1.64 persons per family.
| Family Type | # Families | Family Size |
| Married-Couple | 75 (45.2%) | 3.32 |
| Single Male/Father | 36 (21.7%) | 2.03 |
| Single Female/Mother | 55 (33.1%) | 1.64 |
| Total Families | 166 (100.0%) | 2.48 |
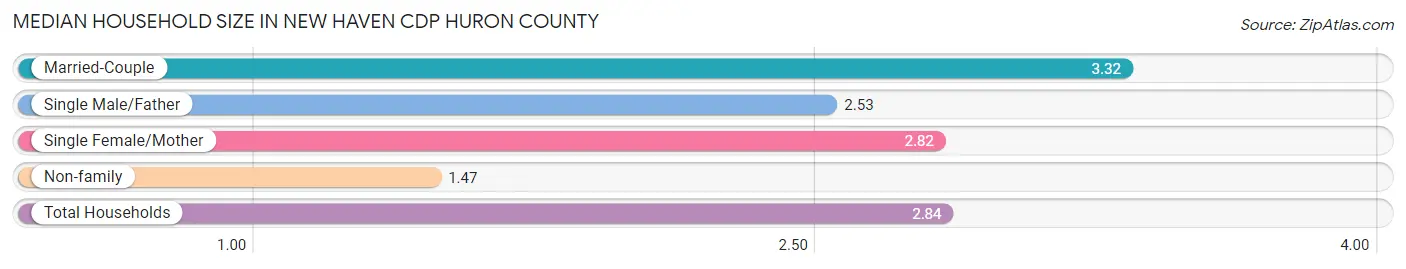
Median Household Size in New Haven CDP Huron County
The median household size in New Haven CDP Huron County is 2.84 persons per household, with married-couple households (75 | 41.0%) accounting for the largest median household size of 3.32 persons per household. non-family households (17 | 9.3%) represent the smallest median household size with 1.47 persons per household.
| Household Type | # Households | Household Size |
| Married-Couple | 75 (41.0%) | 3.32 |
| Single Male/Father | 36 (19.7%) | 2.53 |
| Single Female/Mother | 55 (30.0%) | 2.82 |
| Non-family | 17 (9.3%) | 1.47 |
| Total Households | 183 (100.0%) | 2.84 |
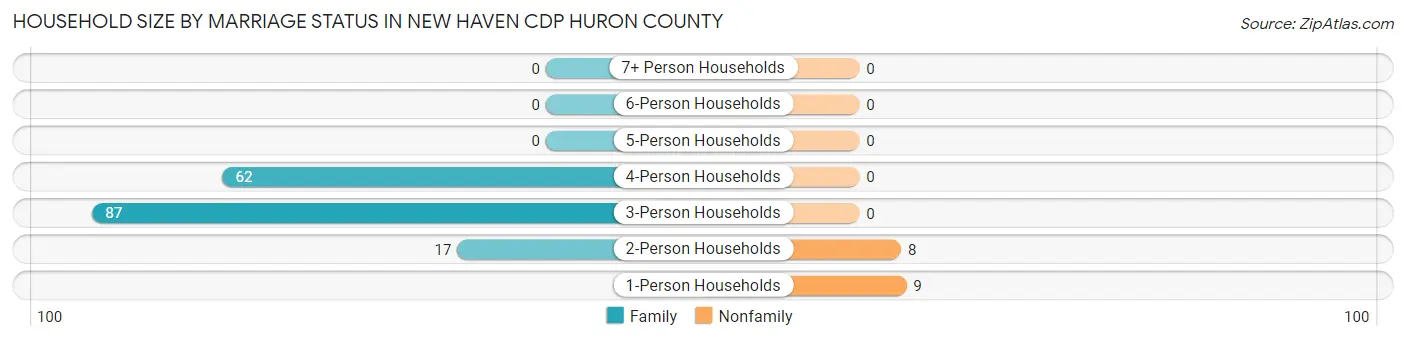
Household Size by Marriage Status in New Haven CDP Huron County
Out of a total of 183 households in New Haven CDP Huron County, 166 (90.7%) are family households, while 17 (9.3%) are nonfamily households. The most numerous type of family households are 3-person households, comprising 87, and the most common type of nonfamily households are 1-person households, comprising 9.
| Household Size | Family Households | Nonfamily Households |
| 1-Person Households | - | 9 (4.9%) |
| 2-Person Households | 17 (9.3%) | 8 (4.4%) |
| 3-Person Households | 87 (47.5%) | 0 (0.0%) |
| 4-Person Households | 62 (33.9%) | 0 (0.0%) |
| 5-Person Households | 0 (0.0%) | 0 (0.0%) |
| 6-Person Households | 0 (0.0%) | 0 (0.0%) |
| 7+ Person Households | 0 (0.0%) | 0 (0.0%) |
| Total | 166 (90.7%) | 17 (9.3%) |
Female Fertility in New Haven CDP Huron County
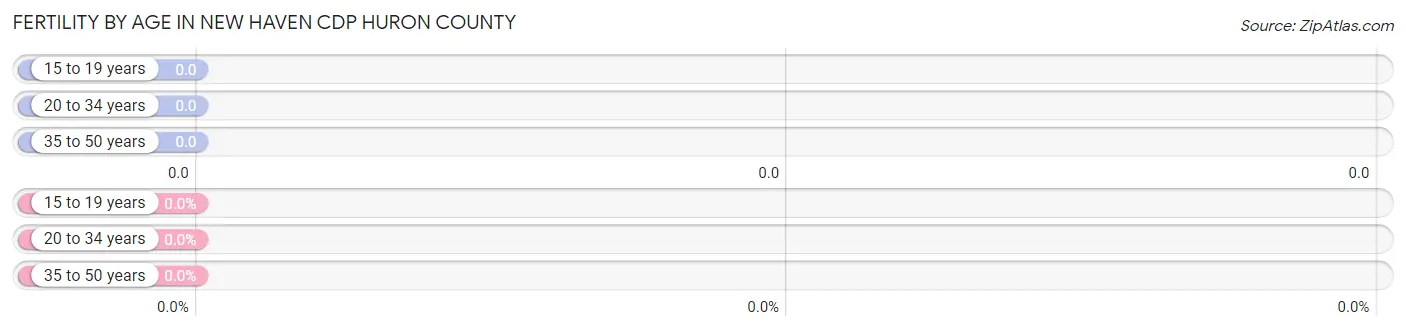
Fertility by Age in New Haven CDP Huron County
| Age Bracket | Women with Births | Births / 1,000 Women |
| 15 to 19 years | 0 (0.0%) | 0.0 |
| 20 to 34 years | 0 (0.0%) | 0.0 |
| 35 to 50 years | 0 (0.0%) | 0.0 |
| Total | 0 (0.0%) | 0.0 |
Fertility by Age by Marriage Status in New Haven CDP Huron County
| Age Bracket | Married | Unmarried |
| 15 to 19 years | 0 (0.0%) | 0 (0.0%) |
| 20 to 34 years | 0 (0.0%) | 0 (0.0%) |
| 35 to 50 years | 0 (0.0%) | 0 (0.0%) |
| Total | 0 (0.0%) | 0 (0.0%) |
Fertility by Education in New Haven CDP Huron County
| Educational Attainment | Women with Births | Births / 1,000 Women |
| Less than High School | 0 (0.0%) | 0.0 |
| High School Diploma | 0 (0.0%) | 0.0 |
| College or Associate's Degree | 0 (0.0%) | 0.0 |
| Bachelor's Degree | 0 (0.0%) | 0.0 |
| Graduate Degree | 0 (0.0%) | 0.0 |
| Total | 0 (0.0%) | 0.0 |
Fertility by Education by Marriage Status in New Haven CDP Huron County
| Educational Attainment | Married | Unmarried |
| Less than High School | 0 (0.0%) | 0 (0.0%) |
| High School Diploma | 0 (0.0%) | 0 (0.0%) |
| College or Associate's Degree | 0 (0.0%) | 0 (0.0%) |
| Bachelor's Degree | 0 (0.0%) | 0 (0.0%) |
| Graduate Degree | 0 (0.0%) | 0 (0.0%) |
| Total | 0 (0.0%) | 0 (0.0%) |
Employment Characteristics in New Haven CDP Huron County
Employment by Class of Employer in New Haven CDP Huron County
Among the 274 employed individuals in New Haven CDP Huron County, private company employees (222 | 81.0%), local government employees (36 | 13.1%), and self-employed (incorporated) (8 | 2.9%) make up the most common classes of employment.
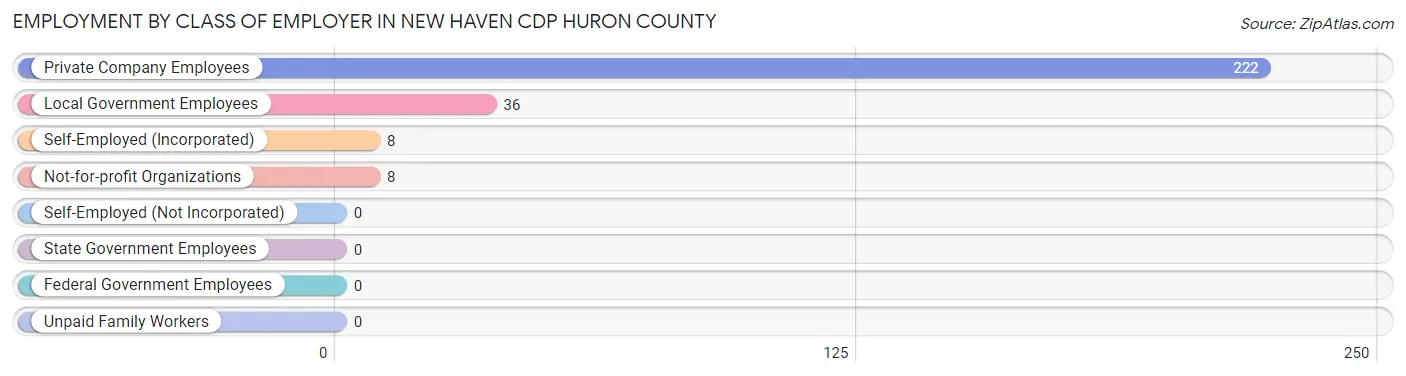
| Employer Class | # Employees | % Employees |
| Private Company Employees | 222 | 81.0% |
| Self-Employed (Incorporated) | 8 | 2.9% |
| Self-Employed (Not Incorporated) | 0 | 0.0% |
| Not-for-profit Organizations | 8 | 2.9% |
| Local Government Employees | 36 | 13.1% |
| State Government Employees | 0 | 0.0% |
| Federal Government Employees | 0 | 0.0% |
| Unpaid Family Workers | 0 | 0.0% |
| Total | 274 | 100.0% |
Employment Status by Age in New Haven CDP Huron County
According to the labor force statistics for New Haven CDP Huron County, out of the total population over 16 years of age (454), 64.1% or 291 individuals are in the labor force, with 5.8% or 17 of them unemployed. The age group with the highest labor force participation rate is 30 to 34 years, with 100.0% or 9 individuals in the labor force. Within the labor force, the 35 to 44 years age range has the highest percentage of unemployed individuals, with 26.2% or 17 of them being unemployed.
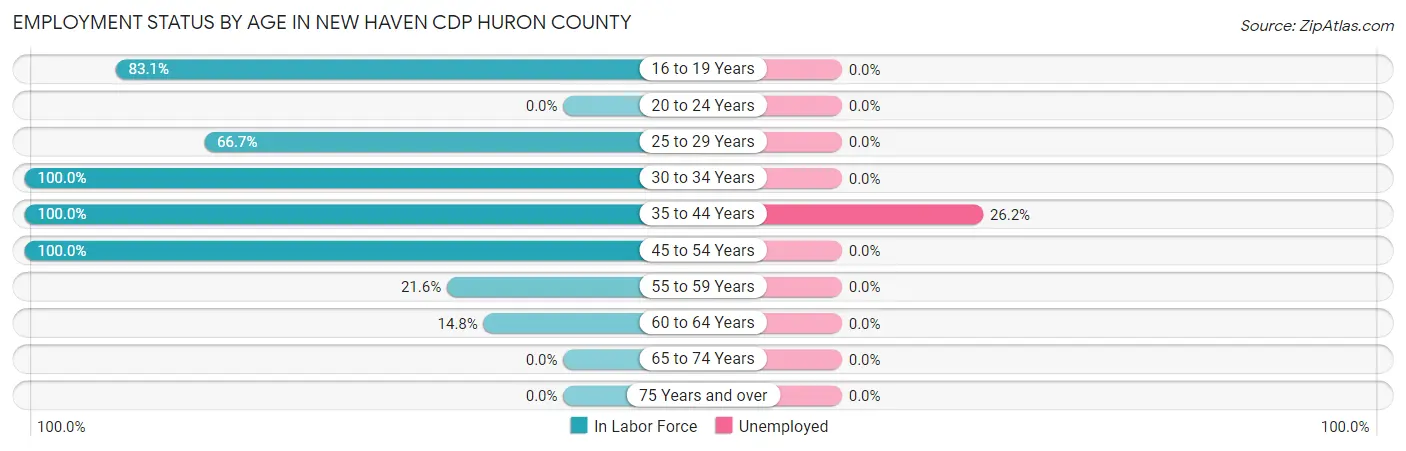
| Age Bracket | In Labor Force | Unemployed |
| 16 to 19 Years | 69 (83.1%) | 0 (0.0%) |
| 20 to 24 Years | 0 (0.0%) | 0 (0.0%) |
| 25 to 29 Years | 36 (66.7%) | 0 (0.0%) |
| 30 to 34 Years | 9 (100.0%) | 0 (0.0%) |
| 35 to 44 Years | 65 (100.0%) | 17 (26.2%) |
| 45 to 54 Years | 88 (100.0%) | 0 (0.0%) |
| 55 to 59 Years | 16 (21.6%) | 0 (0.0%) |
| 60 to 64 Years | 8 (14.8%) | 0 (0.0%) |
| 65 to 74 Years | 0 (0.0%) | 0 (0.0%) |
| 75 Years and over | 0 (0.0%) | 0 (0.0%) |
| Total | 291 (64.1%) | 17 (5.8%) |
Employment Status by Educational Attainment in New Haven CDP Huron County
According to labor force statistics for New Haven CDP Huron County, 64.5% of individuals (222) out of the total population between 25 and 64 years of age (344) are in the labor force, with 7.7% or 17 of them being unemployed. The group with the highest labor force participation rate are those with the educational attainment of college / associate degree, with 100.0% or 51 individuals in the labor force. Within the labor force, individuals with college / associate degree education have the highest percentage of unemployment, with 33.3% or 17 of them being unemployed.
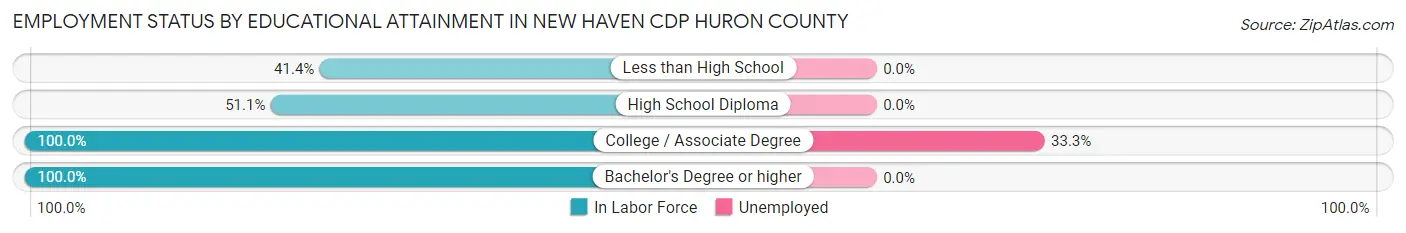
| Educational Attainment | In Labor Force | Unemployed |
| Less than High School | 41 (41.4%) | 0 (0.0%) |
| High School Diploma | 67 (51.1%) | 0 (0.0%) |
| College / Associate Degree | 51 (100.0%) | 17 (33.3%) |
| Bachelor's Degree or higher | 63 (100.0%) | 0 (0.0%) |
| Total | 222 (64.5%) | 26 (7.7%) |
Employment Occupations by Sex in New Haven CDP Huron County
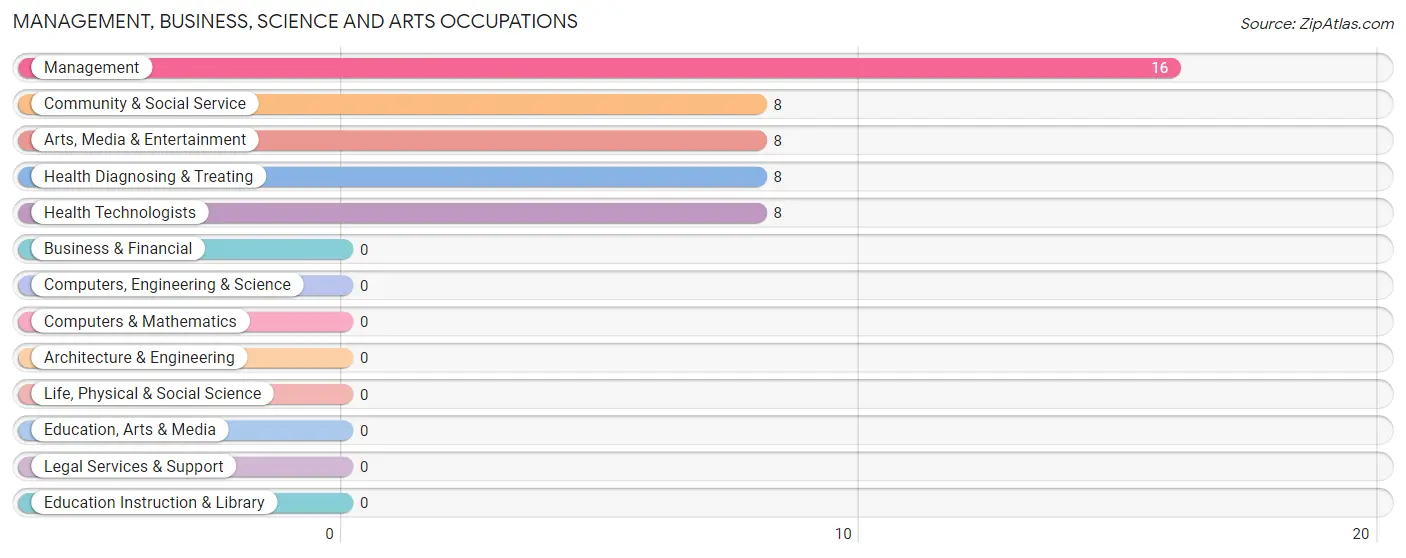
Management, Business, Science and Arts Occupations
The most common Management, Business, Science and Arts occupations in New Haven CDP Huron County are Management (16 | 5.8%), Community & Social Service (8 | 2.9%), Arts, Media & Entertainment (8 | 2.9%), Health Diagnosing & Treating (8 | 2.9%), and Health Technologists (8 | 2.9%).
Management, Business, Science and Arts Occupations by Sex
Within the Management, Business, Science and Arts occupations in New Haven CDP Huron County, the most male-oriented occupations are Community & Social Service (100.0%), Arts, Media & Entertainment (100.0%), and Management (43.8%), while the most female-oriented occupations are Health Diagnosing & Treating (100.0%), Health Technologists (100.0%), and Management (56.2%).
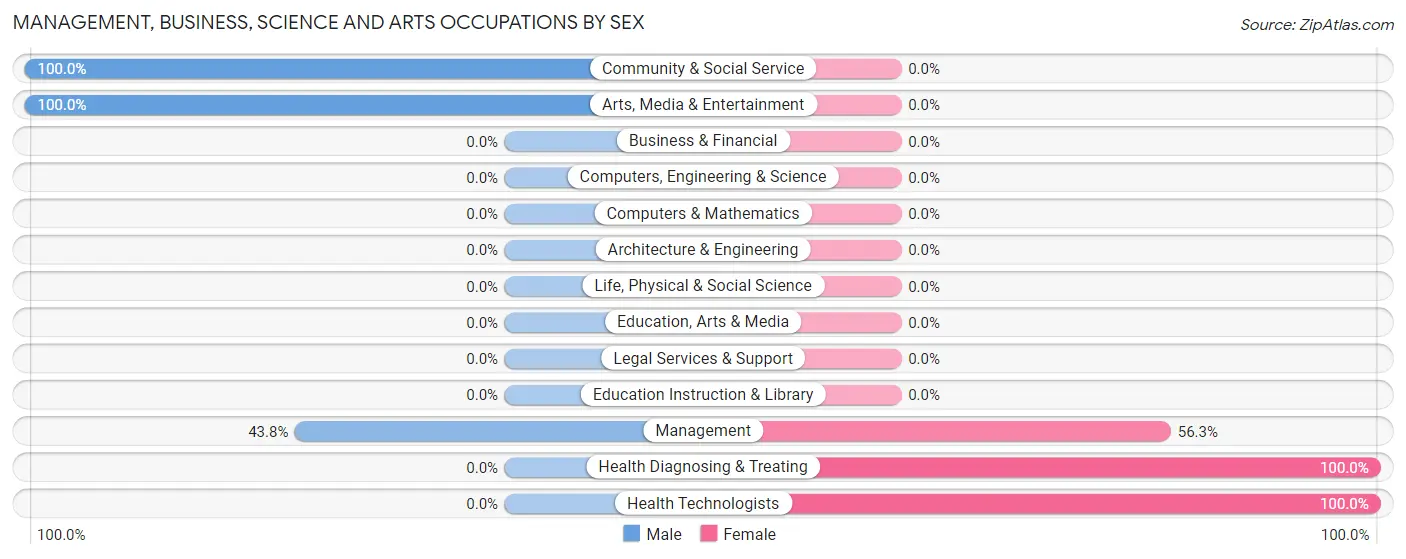
| Occupation | Male | Female |
| Management | 7 (43.8%) | 9 (56.2%) |
| Business & Financial | 0 (0.0%) | 0 (0.0%) |
| Computers, Engineering & Science | 0 (0.0%) | 0 (0.0%) |
| Computers & Mathematics | 0 (0.0%) | 0 (0.0%) |
| Architecture & Engineering | 0 (0.0%) | 0 (0.0%) |
| Life, Physical & Social Science | 0 (0.0%) | 0 (0.0%) |
| Community & Social Service | 8 (100.0%) | 0 (0.0%) |
| Education, Arts & Media | 0 (0.0%) | 0 (0.0%) |
| Legal Services & Support | 0 (0.0%) | 0 (0.0%) |
| Education Instruction & Library | 0 (0.0%) | 0 (0.0%) |
| Arts, Media & Entertainment | 8 (100.0%) | 0 (0.0%) |
| Health Diagnosing & Treating | 0 (0.0%) | 8 (100.0%) |
| Health Technologists | 0 (0.0%) | 8 (100.0%) |
| Total (Category) | 15 (46.9%) | 17 (53.1%) |
| Total (Overall) | 132 (48.2%) | 142 (51.8%) |
Services Occupations
The most common Services occupations in New Haven CDP Huron County are Food Preparation & Serving (69 | 25.2%), and Cleaning & Maintenance (9 | 3.3%).
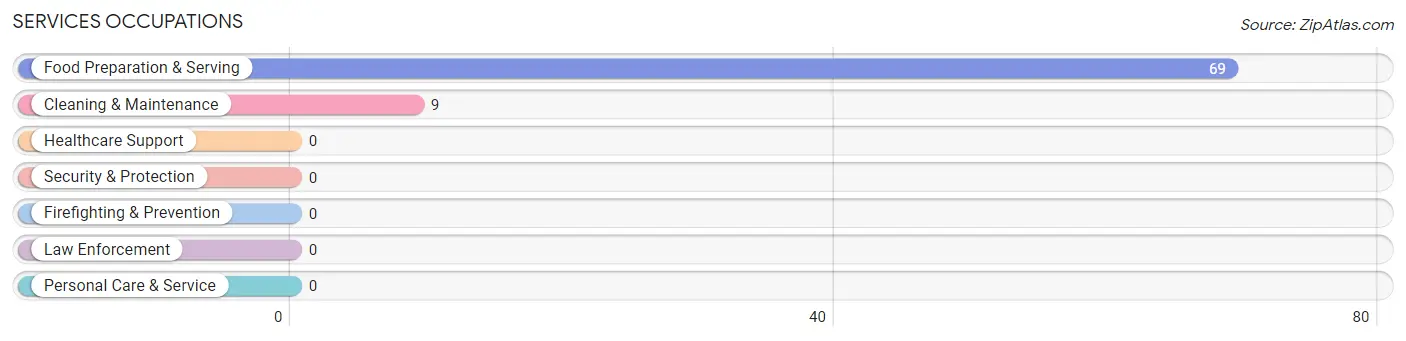
Services Occupations by Sex
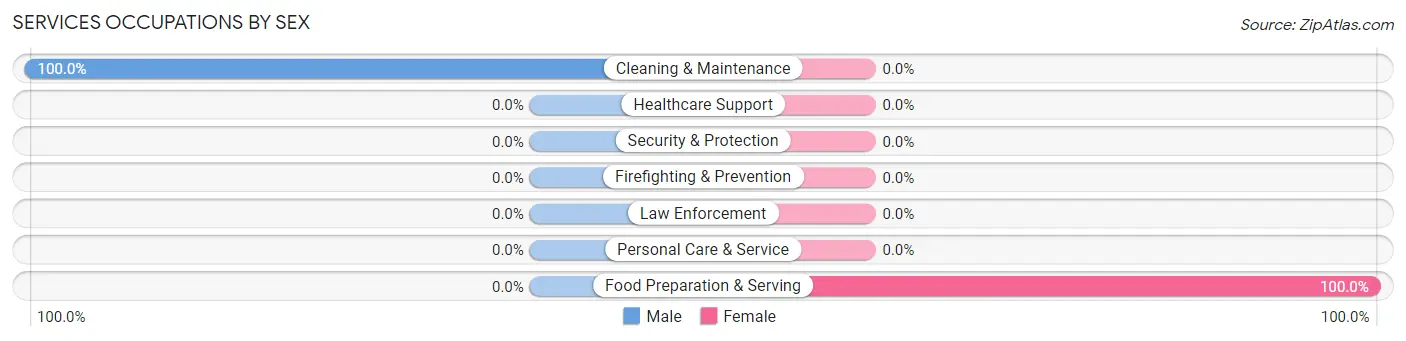
| Occupation | Male | Female |
| Healthcare Support | 0 (0.0%) | 0 (0.0%) |
| Security & Protection | 0 (0.0%) | 0 (0.0%) |
| Firefighting & Prevention | 0 (0.0%) | 0 (0.0%) |
| Law Enforcement | 0 (0.0%) | 0 (0.0%) |
| Food Preparation & Serving | 0 (0.0%) | 69 (100.0%) |
| Cleaning & Maintenance | 9 (100.0%) | 0 (0.0%) |
| Personal Care & Service | 0 (0.0%) | 0 (0.0%) |
| Total (Category) | 9 (11.5%) | 69 (88.5%) |
| Total (Overall) | 132 (48.2%) | 142 (51.8%) |
Sales and Office Occupations
The most common Sales and Office occupations in New Haven CDP Huron County are , and Sales & Related (49 | 17.9%).

Sales and Office Occupations by Sex

| Occupation | Male | Female |
| Sales & Related | 0 (0.0%) | 49 (100.0%) |
| Office & Administration | 0 (0.0%) | 0 (0.0%) |
| Total (Category) | 0 (0.0%) | 49 (100.0%) |
| Total (Overall) | 132 (48.2%) | 142 (51.8%) |
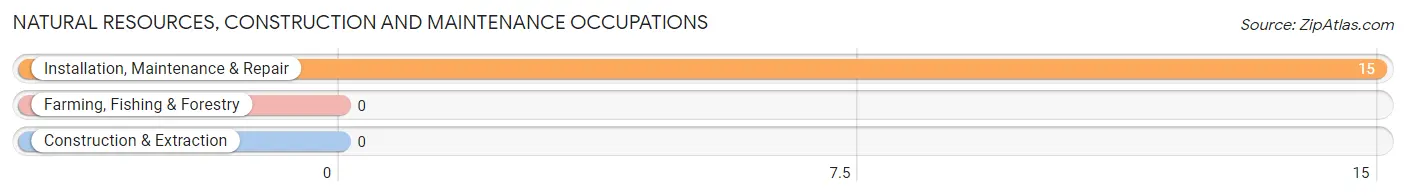
Natural Resources, Construction and Maintenance Occupations
The most common Natural Resources, Construction and Maintenance occupations in New Haven CDP Huron County are , and Installation, Maintenance & Repair (15 | 5.5%).
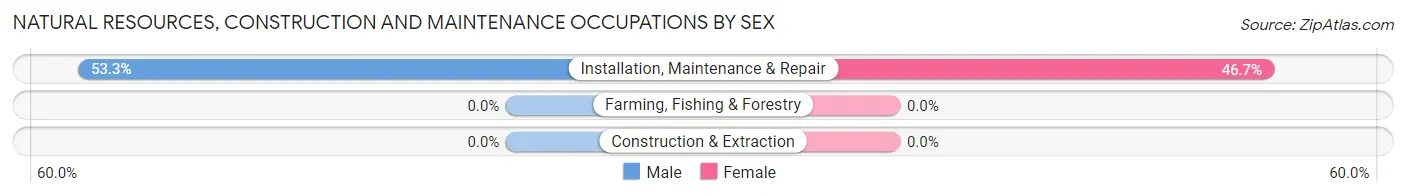
Natural Resources, Construction and Maintenance Occupations by Sex
| Occupation | Male | Female |
| Farming, Fishing & Forestry | 0 (0.0%) | 0 (0.0%) |
| Construction & Extraction | 0 (0.0%) | 0 (0.0%) |
| Installation, Maintenance & Repair | 8 (53.3%) | 7 (46.7%) |
| Total (Category) | 8 (53.3%) | 7 (46.7%) |
| Total (Overall) | 132 (48.2%) | 142 (51.8%) |
Production, Transportation and Moving Occupations
The most common Production, Transportation and Moving occupations in New Haven CDP Huron County are Transportation (55 | 20.1%), and Production (45 | 16.4%).
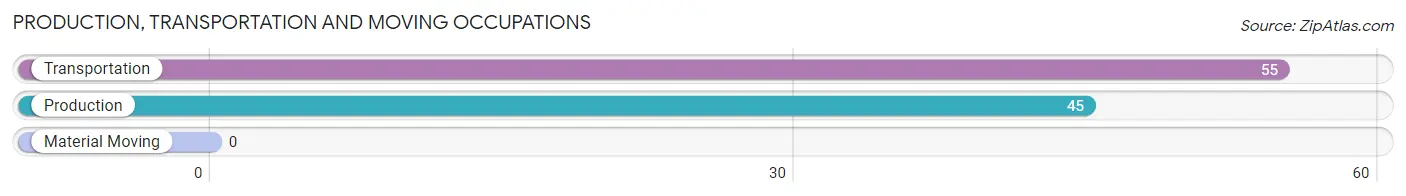
Production, Transportation and Moving Occupations by Sex

| Occupation | Male | Female |
| Production | 45 (100.0%) | 0 (0.0%) |
| Transportation | 55 (100.0%) | 0 (0.0%) |
| Material Moving | 0 (0.0%) | 0 (0.0%) |
| Total (Category) | 100 (100.0%) | 0 (0.0%) |
| Total (Overall) | 132 (48.2%) | 142 (51.8%) |
Employment Industries by Sex in New Haven CDP Huron County
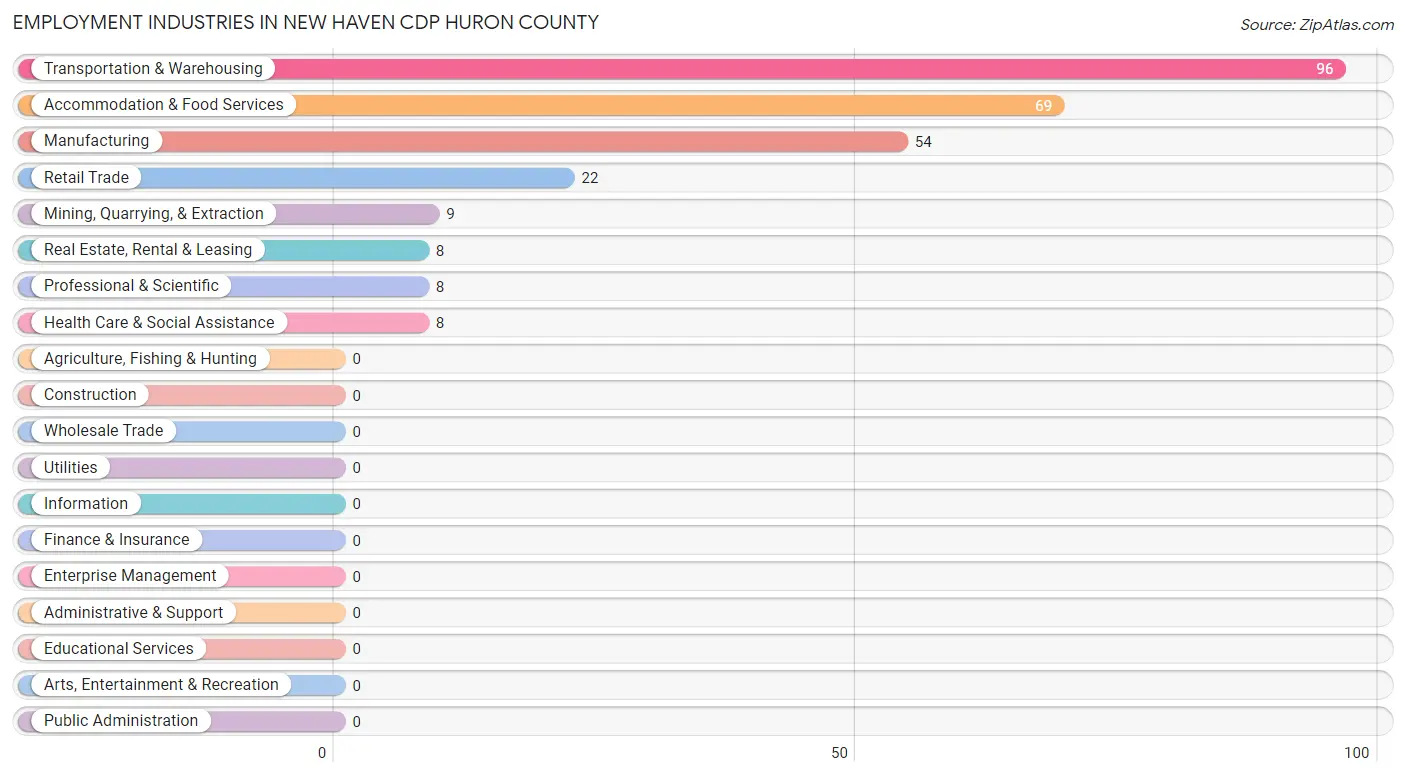
Employment Industries in New Haven CDP Huron County
The major employment industries in New Haven CDP Huron County include Transportation & Warehousing (96 | 35.0%), Accommodation & Food Services (69 | 25.2%), Manufacturing (54 | 19.7%), Retail Trade (22 | 8.0%), and Mining, Quarrying, & Extraction (9 | 3.3%).
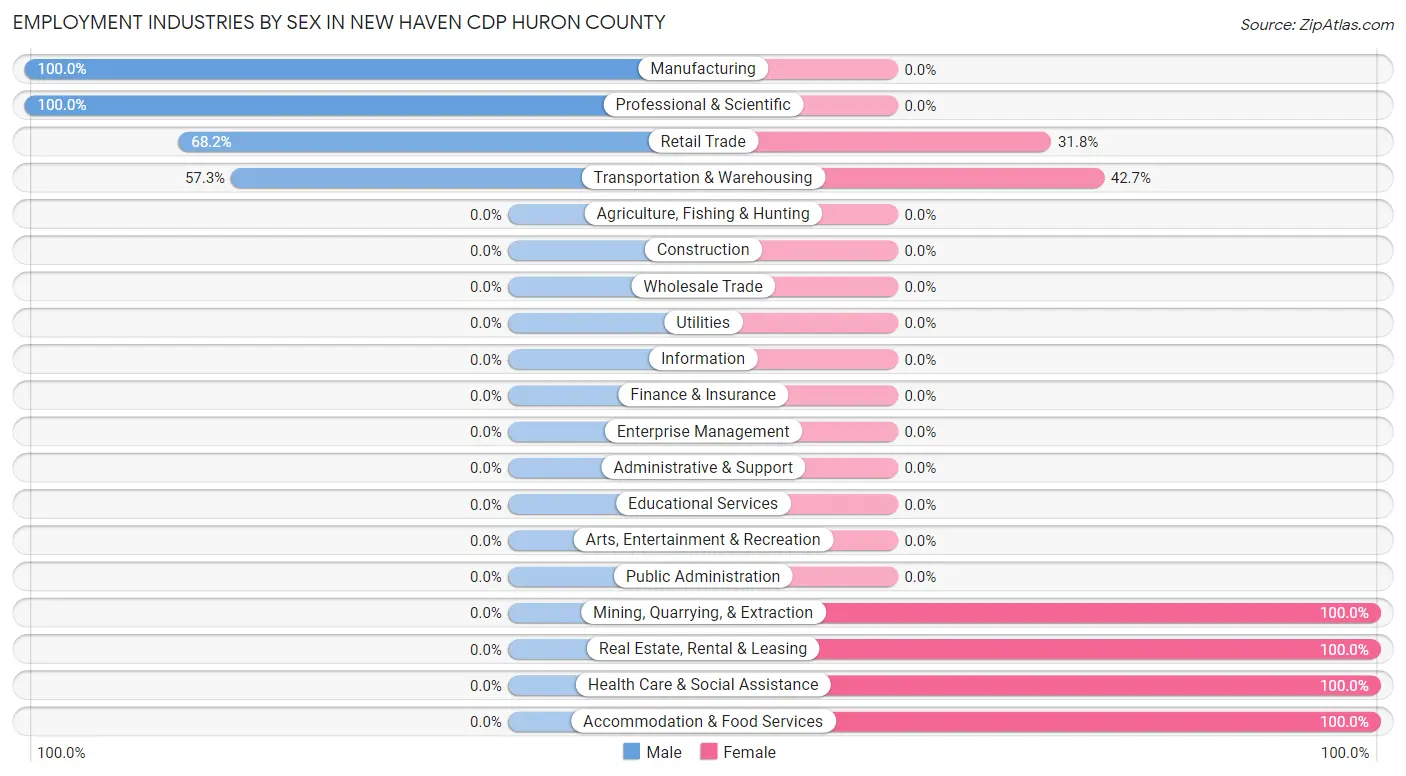
Employment Industries by Sex in New Haven CDP Huron County
The New Haven CDP Huron County industries that see more men than women are Manufacturing (100.0%), Professional & Scientific (100.0%), and Retail Trade (68.2%), whereas the industries that tend to have a higher number of women are Mining, Quarrying, & Extraction (100.0%), Real Estate, Rental & Leasing (100.0%), and Health Care & Social Assistance (100.0%).
| Industry | Male | Female |
| Agriculture, Fishing & Hunting | 0 (0.0%) | 0 (0.0%) |
| Mining, Quarrying, & Extraction | 0 (0.0%) | 9 (100.0%) |
| Construction | 0 (0.0%) | 0 (0.0%) |
| Manufacturing | 54 (100.0%) | 0 (0.0%) |
| Wholesale Trade | 0 (0.0%) | 0 (0.0%) |
| Retail Trade | 15 (68.2%) | 7 (31.8%) |
| Transportation & Warehousing | 55 (57.3%) | 41 (42.7%) |
| Utilities | 0 (0.0%) | 0 (0.0%) |
| Information | 0 (0.0%) | 0 (0.0%) |
| Finance & Insurance | 0 (0.0%) | 0 (0.0%) |
| Real Estate, Rental & Leasing | 0 (0.0%) | 8 (100.0%) |
| Professional & Scientific | 8 (100.0%) | 0 (0.0%) |
| Enterprise Management | 0 (0.0%) | 0 (0.0%) |
| Administrative & Support | 0 (0.0%) | 0 (0.0%) |
| Educational Services | 0 (0.0%) | 0 (0.0%) |
| Health Care & Social Assistance | 0 (0.0%) | 8 (100.0%) |
| Arts, Entertainment & Recreation | 0 (0.0%) | 0 (0.0%) |
| Accommodation & Food Services | 0 (0.0%) | 69 (100.0%) |
| Public Administration | 0 (0.0%) | 0 (0.0%) |
| Total | 132 (48.2%) | 142 (51.8%) |
Education in New Haven CDP Huron County
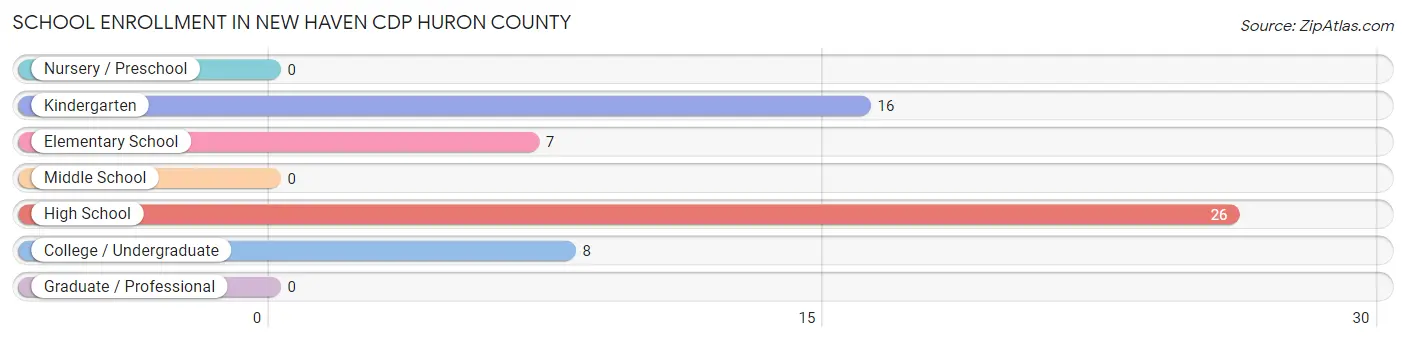
School Enrollment in New Haven CDP Huron County
The most common levels of schooling among the 57 students in New Haven CDP Huron County are high school (26 | 45.6%), kindergarten (16 | 28.1%), and college / undergraduate (8 | 14.0%).
| School Level | # Students | % Students |
| Nursery / Preschool | 0 | 0.0% |
| Kindergarten | 16 | 28.1% |
| Elementary School | 7 | 12.3% |
| Middle School | 0 | 0.0% |
| High School | 26 | 45.6% |
| College / Undergraduate | 8 | 14.0% |
| Graduate / Professional | 0 | 0.0% |
| Total | 57 | 100.0% |
School Enrollment by Age by Funding Source in New Haven CDP Huron County
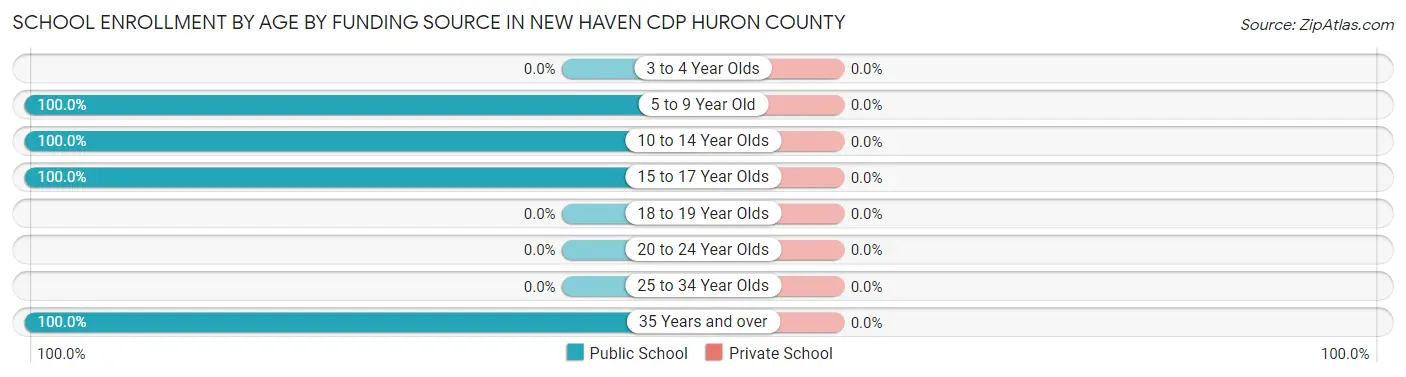
| Age Bracket | Public School | Private School |
| 3 to 4 Year Olds | 0 (0.0%) | 0 (0.0%) |
| 5 to 9 Year Old | 23 (100.0%) | 0 (0.0%) |
| 10 to 14 Year Olds | 12 (100.0%) | 0 (0.0%) |
| 15 to 17 Year Olds | 14 (100.0%) | 0 (0.0%) |
| 18 to 19 Year Olds | 0 (0.0%) | 0 (0.0%) |
| 20 to 24 Year Olds | 0 (0.0%) | 0 (0.0%) |
| 25 to 34 Year Olds | 0 (0.0%) | 0 (0.0%) |
| 35 Years and over | 8 (100.0%) | 0 (0.0%) |
| Total | 57 (100.0%) | 0 (0.0%) |
Educational Attainment by Field of Study in New Haven CDP Huron County
Arts & humanities (55 | 87.3%), and social sciences (8 | 12.7%) are the most common fields of study among 63 individuals in New Haven CDP Huron County who have obtained a bachelor's degree or higher.
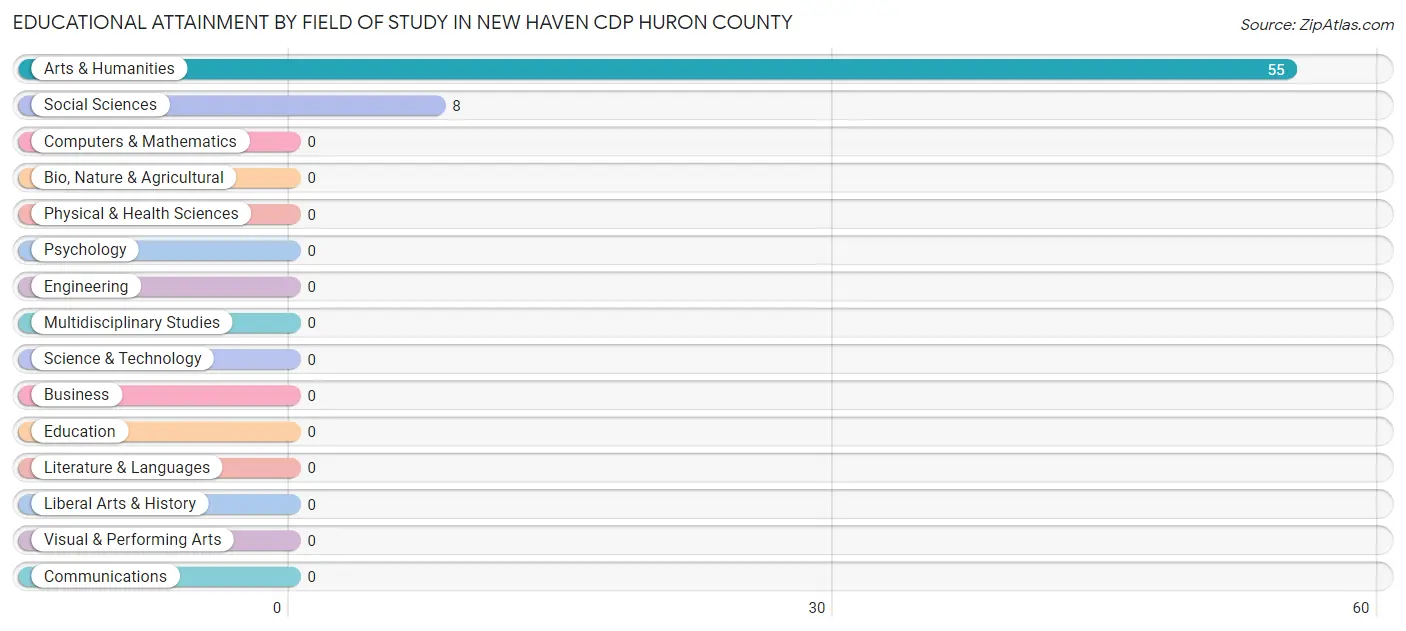
| Field of Study | # Graduates | % Graduates |
| Computers & Mathematics | 0 | 0.0% |
| Bio, Nature & Agricultural | 0 | 0.0% |
| Physical & Health Sciences | 0 | 0.0% |
| Psychology | 0 | 0.0% |
| Social Sciences | 8 | 12.7% |
| Engineering | 0 | 0.0% |
| Multidisciplinary Studies | 0 | 0.0% |
| Science & Technology | 0 | 0.0% |
| Business | 0 | 0.0% |
| Education | 0 | 0.0% |
| Literature & Languages | 0 | 0.0% |
| Liberal Arts & History | 0 | 0.0% |
| Visual & Performing Arts | 0 | 0.0% |
| Communications | 0 | 0.0% |
| Arts & Humanities | 55 | 87.3% |
| Total | 63 | 100.0% |
Transportation & Commute in New Haven CDP Huron County
Vehicle Availability by Sex in New Haven CDP Huron County
The most prevalent vehicle ownership categories in New Haven CDP Huron County are males with 2 vehicles (106, accounting for 80.3%) and females with 2 vehicles (127, making up 74.7%).
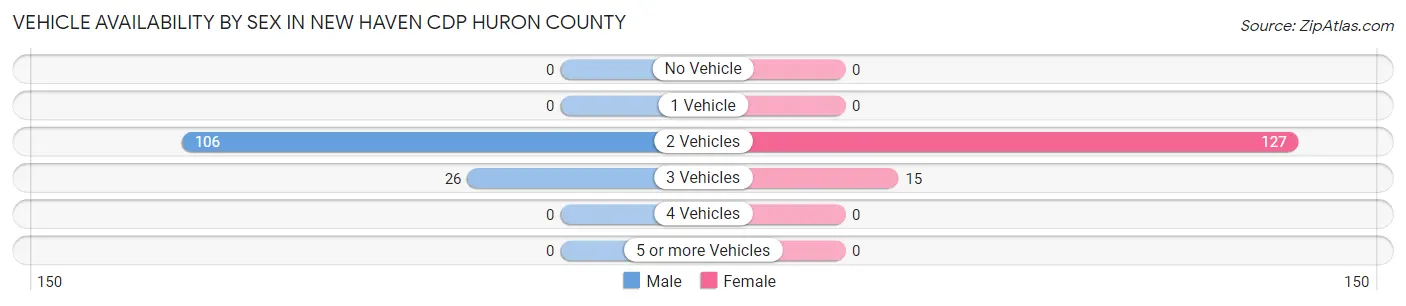
| Vehicles Available | Male | Female |
| No Vehicle | 0 (0.0%) | 0 (0.0%) |
| 1 Vehicle | 0 (0.0%) | 0 (0.0%) |
| 2 Vehicles | 106 (80.3%) | 127 (89.4%) |
| 3 Vehicles | 26 (19.7%) | 15 (10.6%) |
| 4 Vehicles | 0 (0.0%) | 0 (0.0%) |
| 5 or more Vehicles | 0 (0.0%) | 0 (0.0%) |
| Total | 132 (100.0%) | 142 (100.0%) |
Commute Time in New Haven CDP Huron County
The most frequently occuring commute durations in New Haven CDP Huron County are 5 to 9 minutes (78 commuters, 30.3%), 40 to 44 minutes (69 commuters, 26.9%), and less than 5 minutes (41 commuters, 16.0%).
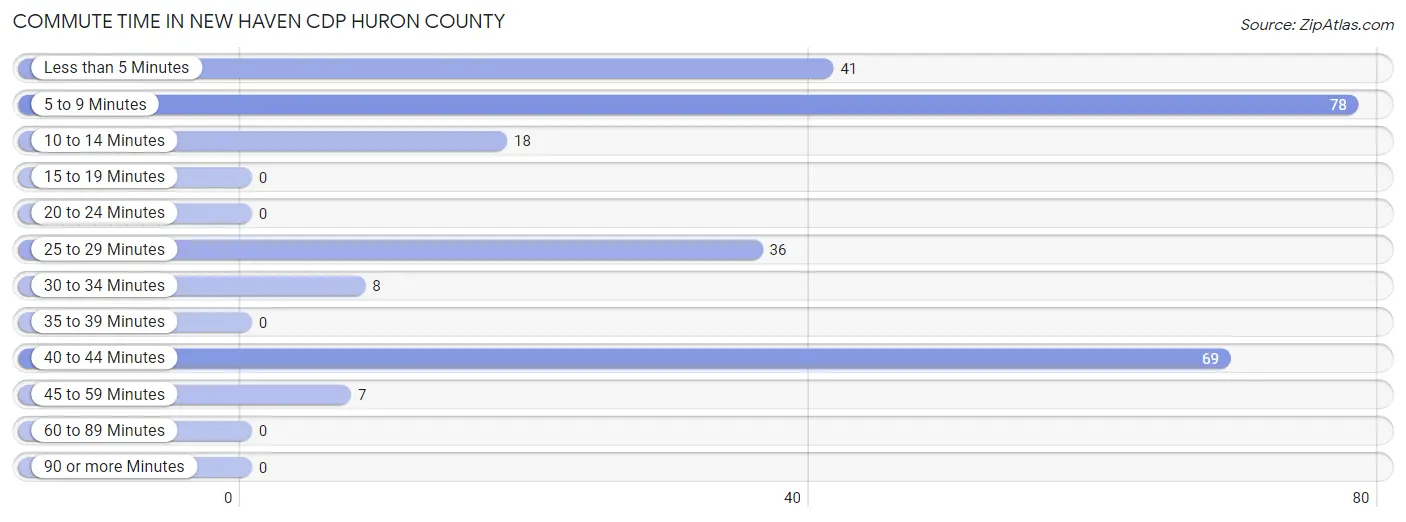
| Commute Time | # Commuters | % Commuters |
| Less than 5 Minutes | 41 | 16.0% |
| 5 to 9 Minutes | 78 | 30.3% |
| 10 to 14 Minutes | 18 | 7.0% |
| 15 to 19 Minutes | 0 | 0.0% |
| 20 to 24 Minutes | 0 | 0.0% |
| 25 to 29 Minutes | 36 | 14.0% |
| 30 to 34 Minutes | 8 | 3.1% |
| 35 to 39 Minutes | 0 | 0.0% |
| 40 to 44 Minutes | 69 | 26.9% |
| 45 to 59 Minutes | 7 | 2.7% |
| 60 to 89 Minutes | 0 | 0.0% |
| 90 or more Minutes | 0 | 0.0% |
Commute Time by Sex in New Haven CDP Huron County
The most common commute times in New Haven CDP Huron County are 5 to 9 minutes (63 commuters, 47.7%) for males and 40 to 44 minutes (69 commuters, 55.2%) for females.
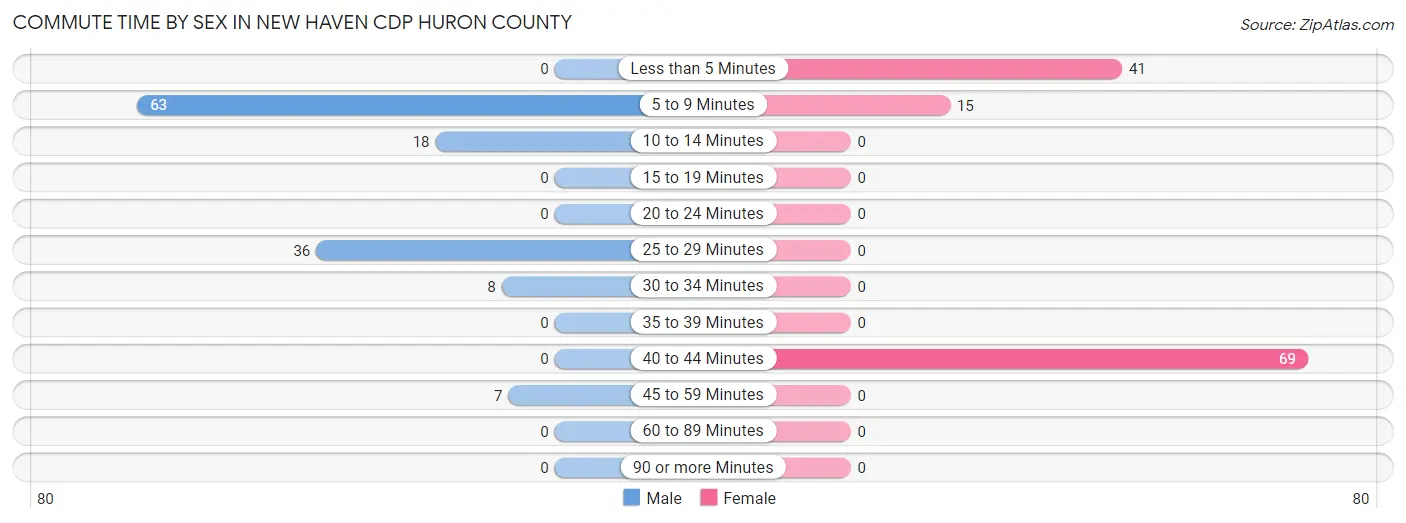
| Commute Time | Male | Female |
| Less than 5 Minutes | 0 (0.0%) | 41 (32.8%) |
| 5 to 9 Minutes | 63 (47.7%) | 15 (12.0%) |
| 10 to 14 Minutes | 18 (13.6%) | 0 (0.0%) |
| 15 to 19 Minutes | 0 (0.0%) | 0 (0.0%) |
| 20 to 24 Minutes | 0 (0.0%) | 0 (0.0%) |
| 25 to 29 Minutes | 36 (27.3%) | 0 (0.0%) |
| 30 to 34 Minutes | 8 (6.1%) | 0 (0.0%) |
| 35 to 39 Minutes | 0 (0.0%) | 0 (0.0%) |
| 40 to 44 Minutes | 0 (0.0%) | 69 (55.2%) |
| 45 to 59 Minutes | 7 (5.3%) | 0 (0.0%) |
| 60 to 89 Minutes | 0 (0.0%) | 0 (0.0%) |
| 90 or more Minutes | 0 (0.0%) | 0 (0.0%) |
Time of Departure to Work by Sex in New Haven CDP Huron County
The most frequent times of departure to work in New Haven CDP Huron County are 5:30 AM to 5:59 AM (55, 41.7%) for males and 9:00 AM to 9:59 AM (69, 55.2%) for females.
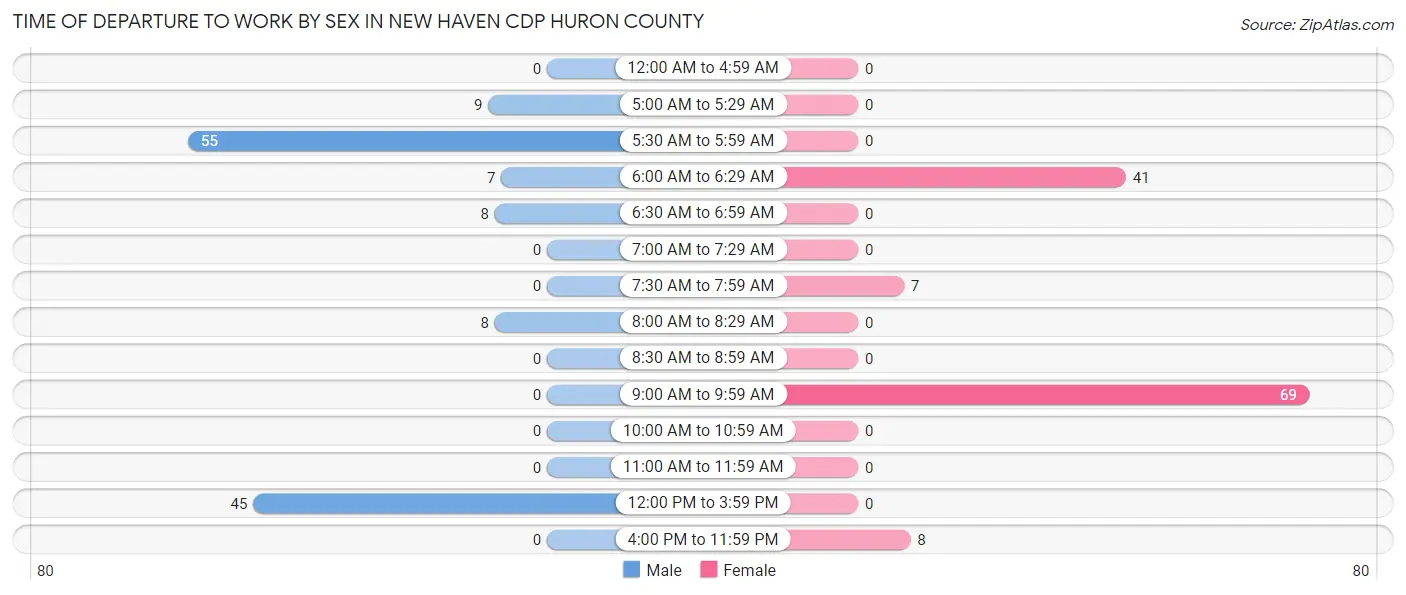
| Time of Departure | Male | Female |
| 12:00 AM to 4:59 AM | 0 (0.0%) | 0 (0.0%) |
| 5:00 AM to 5:29 AM | 9 (6.8%) | 0 (0.0%) |
| 5:30 AM to 5:59 AM | 55 (41.7%) | 0 (0.0%) |
| 6:00 AM to 6:29 AM | 7 (5.3%) | 41 (32.8%) |
| 6:30 AM to 6:59 AM | 8 (6.1%) | 0 (0.0%) |
| 7:00 AM to 7:29 AM | 0 (0.0%) | 0 (0.0%) |
| 7:30 AM to 7:59 AM | 0 (0.0%) | 7 (5.6%) |
| 8:00 AM to 8:29 AM | 8 (6.1%) | 0 (0.0%) |
| 8:30 AM to 8:59 AM | 0 (0.0%) | 0 (0.0%) |
| 9:00 AM to 9:59 AM | 0 (0.0%) | 69 (55.2%) |
| 10:00 AM to 10:59 AM | 0 (0.0%) | 0 (0.0%) |
| 11:00 AM to 11:59 AM | 0 (0.0%) | 0 (0.0%) |
| 12:00 PM to 3:59 PM | 45 (34.1%) | 0 (0.0%) |
| 4:00 PM to 11:59 PM | 0 (0.0%) | 8 (6.4%) |
| Total | 132 (100.0%) | 125 (100.0%) |
Housing Occupancy in New Haven CDP Huron County
Occupancy by Ownership in New Haven CDP Huron County
Of the total 183 dwellings in New Haven CDP Huron County, owner-occupied units account for 183 (100.0%), while renter-occupied units make up 0 (0.0%).
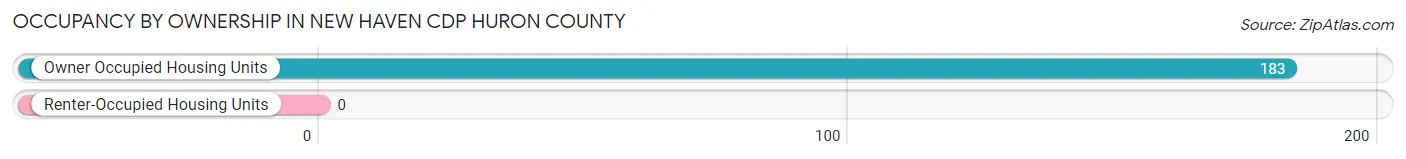
| Occupancy | # Housing Units | % Housing Units |
| Owner Occupied Housing Units | 183 | 100.0% |
| Renter-Occupied Housing Units | 0 | 0.0% |
| Total Occupied Housing Units | 183 | 100.0% |
Occupancy by Household Size in New Haven CDP Huron County
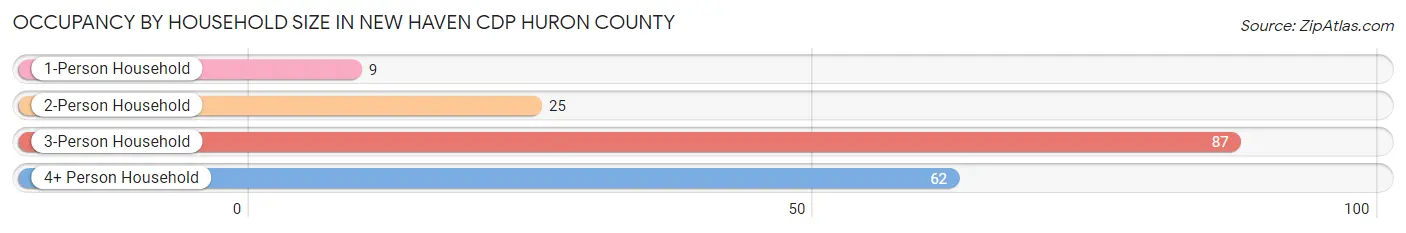
| Household Size | # Housing Units | % Housing Units |
| 1-Person Household | 9 | 4.9% |
| 2-Person Household | 25 | 13.7% |
| 3-Person Household | 87 | 47.5% |
| 4+ Person Household | 62 | 33.9% |
| Total Housing Units | 183 | 100.0% |
Occupancy by Ownership by Household Size in New Haven CDP Huron County
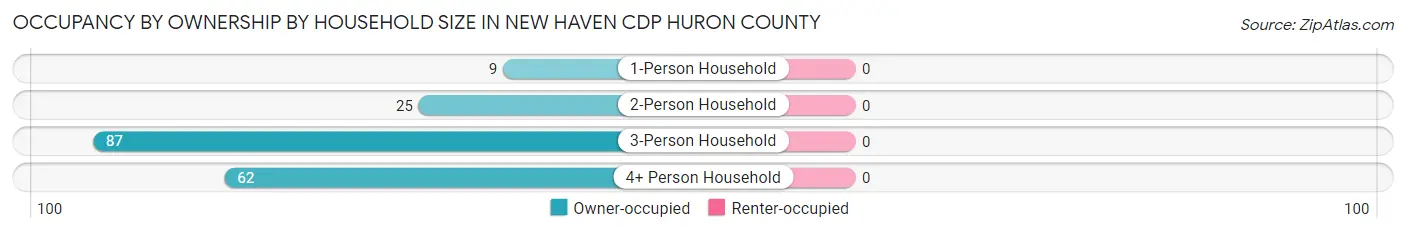
| Household Size | Owner-occupied | Renter-occupied |
| 1-Person Household | 9 (100.0%) | 0 (0.0%) |
| 2-Person Household | 25 (100.0%) | 0 (0.0%) |
| 3-Person Household | 87 (100.0%) | 0 (0.0%) |
| 4+ Person Household | 62 (100.0%) | 0 (0.0%) |
| Total Housing Units | 183 (100.0%) | 0 (0.0%) |
Occupancy by Educational Attainment in New Haven CDP Huron County
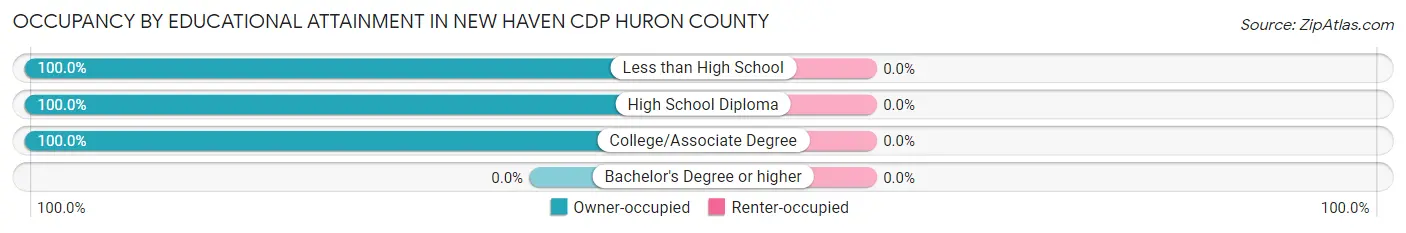
| Household Size | Owner-occupied | Renter-occupied |
| Less than High School | 41 (100.0%) | 0 (0.0%) |
| High School Diploma | 100 (100.0%) | 0 (0.0%) |
| College/Associate Degree | 42 (100.0%) | 0 (0.0%) |
| Bachelor's Degree or higher | 0 (0.0%) | 0 (0.0%) |
Occupancy by Age of Householder in New Haven CDP Huron County
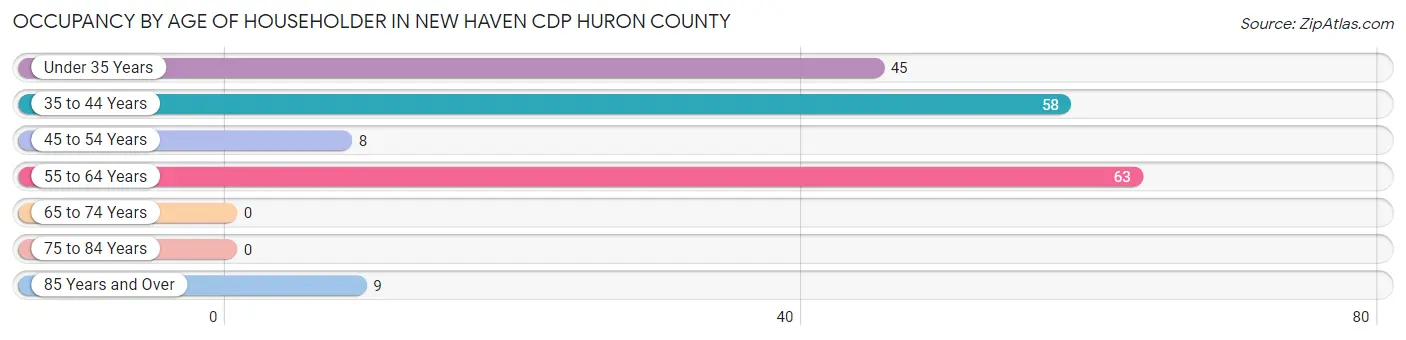
| Age Bracket | # Households | % Households |
| Under 35 Years | 45 | 24.6% |
| 35 to 44 Years | 58 | 31.7% |
| 45 to 54 Years | 8 | 4.4% |
| 55 to 64 Years | 63 | 34.4% |
| 65 to 74 Years | 0 | 0.0% |
| 75 to 84 Years | 0 | 0.0% |
| 85 Years and Over | 9 | 4.9% |
| Total | 183 | 100.0% |
Housing Finances in New Haven CDP Huron County
Median Income by Occupancy in New Haven CDP Huron County
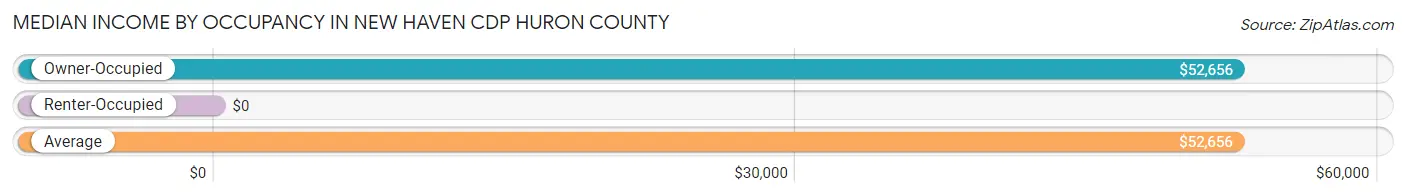
| Occupancy Type | # Households | Median Income |
| Owner-Occupied | 183 (100.0%) | $52,656 |
| Renter-Occupied | 0 (0.0%) | $0 |
| Average | 183 (100.0%) | $52,656 |
Occupancy by Householder Income Bracket in New Haven CDP Huron County
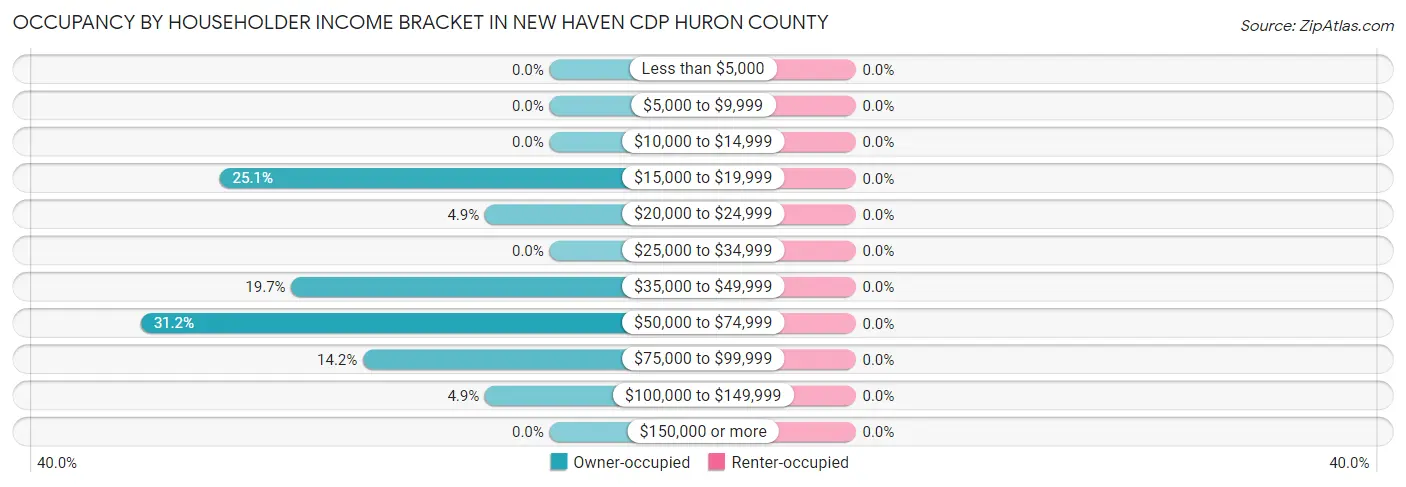
| Income Bracket | Owner-occupied | Renter-occupied |
| Less than $5,000 | 0 (0.0%) | 0 (0.0%) |
| $5,000 to $9,999 | 0 (0.0%) | 0 (0.0%) |
| $10,000 to $14,999 | 0 (0.0%) | 0 (0.0%) |
| $15,000 to $19,999 | 46 (25.1%) | 0 (0.0%) |
| $20,000 to $24,999 | 9 (4.9%) | 0 (0.0%) |
| $25,000 to $34,999 | 0 (0.0%) | 0 (0.0%) |
| $35,000 to $49,999 | 36 (19.7%) | 0 (0.0%) |
| $50,000 to $74,999 | 57 (31.1%) | 0 (0.0%) |
| $75,000 to $99,999 | 26 (14.2%) | 0 (0.0%) |
| $100,000 to $149,999 | 9 (4.9%) | 0 (0.0%) |
| $150,000 or more | 0 (0.0%) | 0 (0.0%) |
| Total | 183 (100.0%) | 0 (0.0%) |
Monthly Housing Cost Tiers in New Haven CDP Huron County
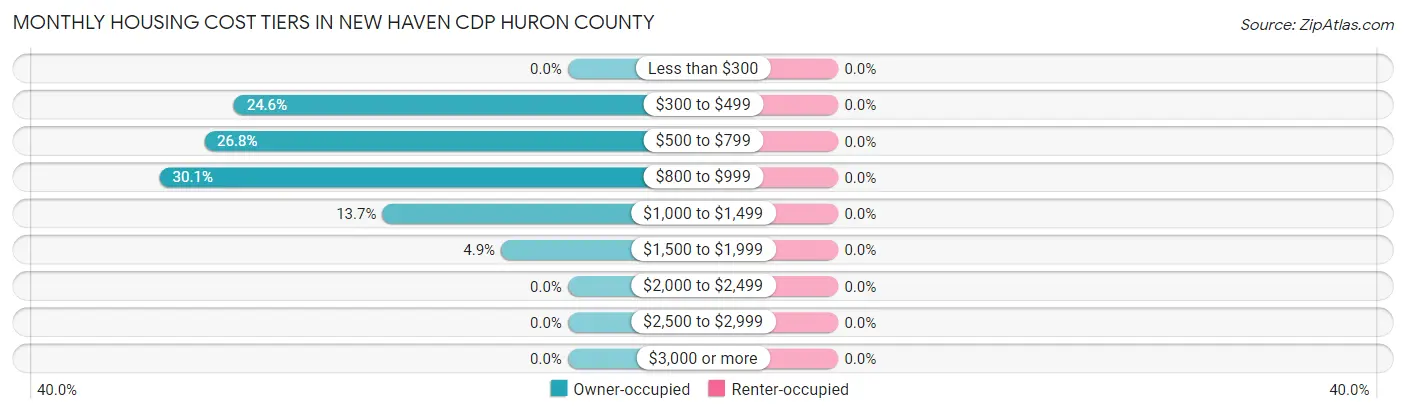
| Monthly Cost | Owner-occupied | Renter-occupied |
| Less than $300 | 0 (0.0%) | 0 (0.0%) |
| $300 to $499 | 45 (24.6%) | 0 (0.0%) |
| $500 to $799 | 49 (26.8%) | 0 (0.0%) |
| $800 to $999 | 55 (30.0%) | 0 (0.0%) |
| $1,000 to $1,499 | 25 (13.7%) | 0 (0.0%) |
| $1,500 to $1,999 | 9 (4.9%) | 0 (0.0%) |
| $2,000 to $2,499 | 0 (0.0%) | 0 (0.0%) |
| $2,500 to $2,999 | 0 (0.0%) | 0 (0.0%) |
| $3,000 or more | 0 (0.0%) | 0 (0.0%) |
| Total | 183 (100.0%) | 0 (0.0%) |
Physical Housing Characteristics in New Haven CDP Huron County
Housing Structures in New Haven CDP Huron County
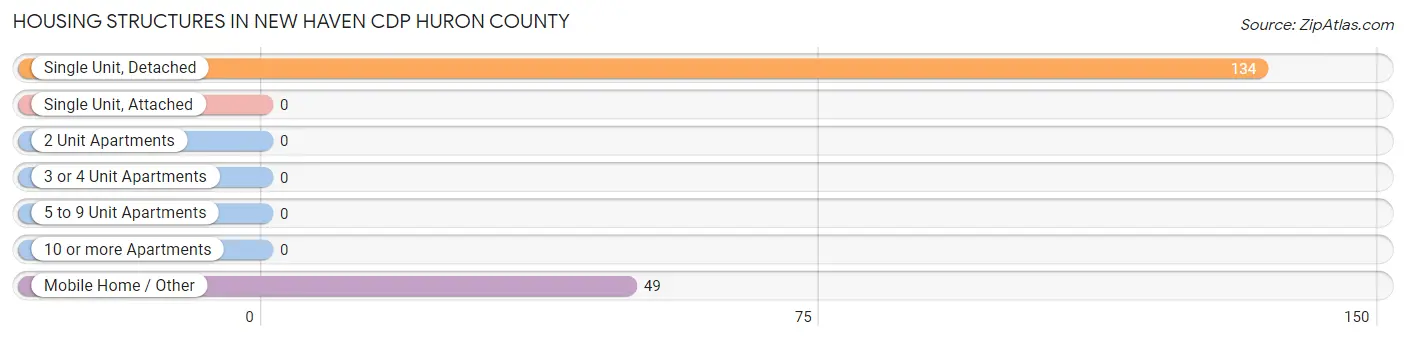
| Structure Type | # Housing Units | % Housing Units |
| Single Unit, Detached | 134 | 73.2% |
| Single Unit, Attached | 0 | 0.0% |
| 2 Unit Apartments | 0 | 0.0% |
| 3 or 4 Unit Apartments | 0 | 0.0% |
| 5 to 9 Unit Apartments | 0 | 0.0% |
| 10 or more Apartments | 0 | 0.0% |
| Mobile Home / Other | 49 | 26.8% |
| Total | 183 | 100.0% |
Housing Structures by Occupancy in New Haven CDP Huron County
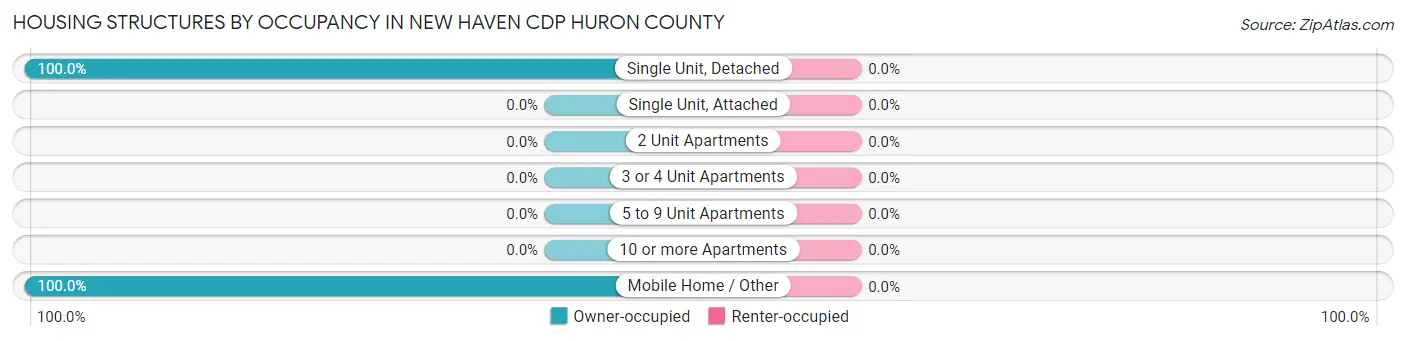
| Structure Type | Owner-occupied | Renter-occupied |
| Single Unit, Detached | 134 (100.0%) | 0 (0.0%) |
| Single Unit, Attached | 0 (0.0%) | 0 (0.0%) |
| 2 Unit Apartments | 0 (0.0%) | 0 (0.0%) |
| 3 or 4 Unit Apartments | 0 (0.0%) | 0 (0.0%) |
| 5 to 9 Unit Apartments | 0 (0.0%) | 0 (0.0%) |
| 10 or more Apartments | 0 (0.0%) | 0 (0.0%) |
| Mobile Home / Other | 49 (100.0%) | 0 (0.0%) |
| Total | 183 (100.0%) | 0 (0.0%) |
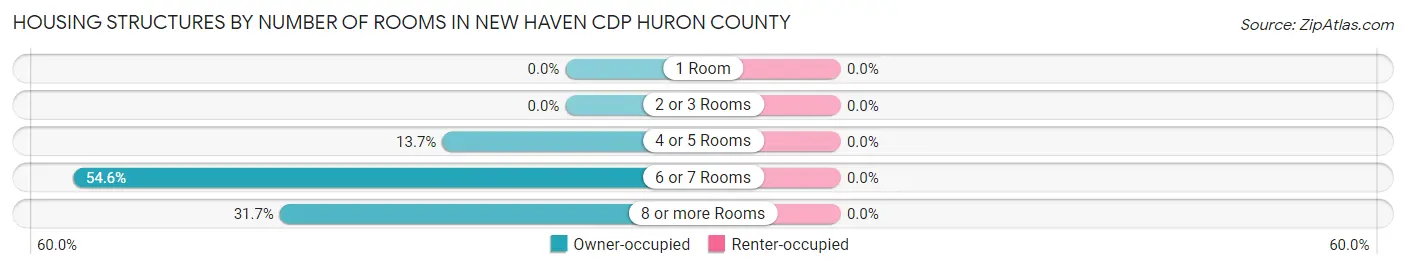
Housing Structures by Number of Rooms in New Haven CDP Huron County
| Number of Rooms | Owner-occupied | Renter-occupied |
| 1 Room | 0 (0.0%) | 0 (0.0%) |
| 2 or 3 Rooms | 0 (0.0%) | 0 (0.0%) |
| 4 or 5 Rooms | 25 (13.7%) | 0 (0.0%) |
| 6 or 7 Rooms | 100 (54.6%) | 0 (0.0%) |
| 8 or more Rooms | 58 (31.7%) | 0 (0.0%) |
| Total | 183 (100.0%) | 0 (0.0%) |
Housing Structure by Heating Type in New Haven CDP Huron County
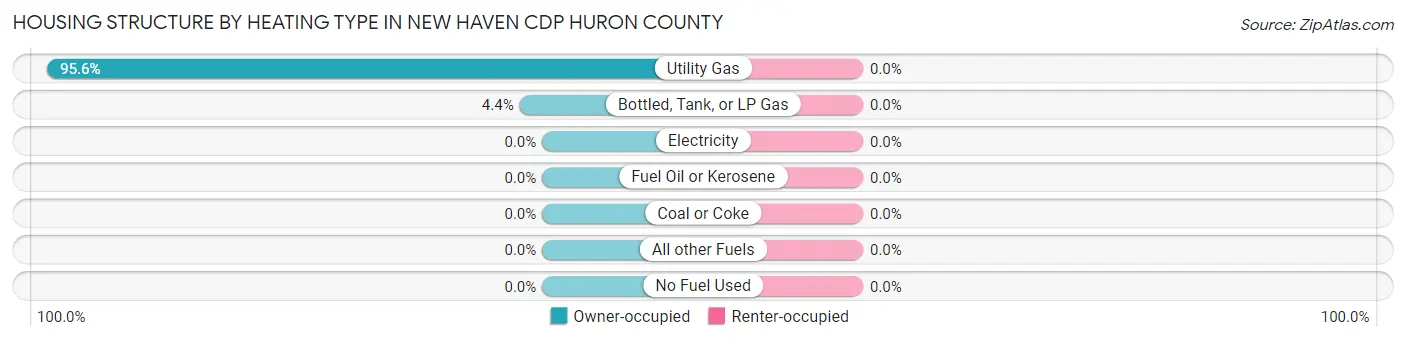
| Heating Type | Owner-occupied | Renter-occupied |
| Utility Gas | 175 (95.6%) | 0 (0.0%) |
| Bottled, Tank, or LP Gas | 8 (4.4%) | 0 (0.0%) |
| Electricity | 0 (0.0%) | 0 (0.0%) |
| Fuel Oil or Kerosene | 0 (0.0%) | 0 (0.0%) |
| Coal or Coke | 0 (0.0%) | 0 (0.0%) |
| All other Fuels | 0 (0.0%) | 0 (0.0%) |
| No Fuel Used | 0 (0.0%) | 0 (0.0%) |
| Total | 183 (100.0%) | 0 (0.0%) |
Household Vehicle Usage in New Haven CDP Huron County
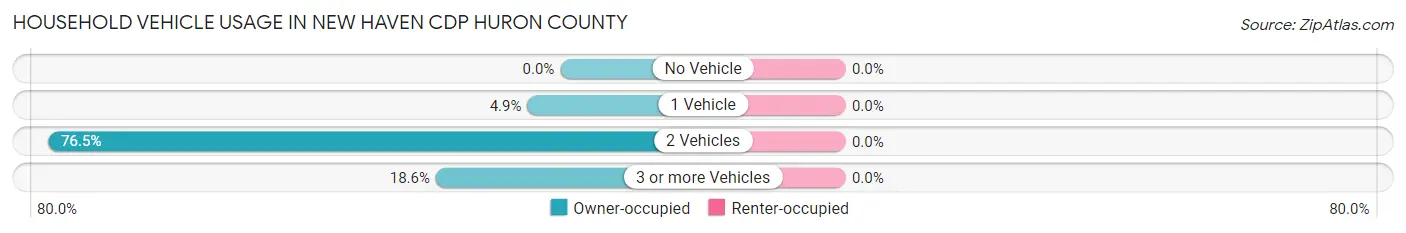
| Vehicles per Household | Owner-occupied | Renter-occupied |
| No Vehicle | 0 (0.0%) | 0 (0.0%) |
| 1 Vehicle | 9 (4.9%) | 0 (0.0%) |
| 2 Vehicles | 140 (76.5%) | 0 (0.0%) |
| 3 or more Vehicles | 34 (18.6%) | 0 (0.0%) |
| Total | 183 (100.0%) | 0 (0.0%) |
Real Estate & Mortgages in New Haven CDP Huron County
Real Estate and Mortgage Overview in New Haven CDP Huron County
| Characteristic | Without Mortgage | With Mortgage |
| Housing Units | 94 | 89 |
| Median Property Value | - | - |
| Median Household Income | $53,125 | $0 |
| Monthly Housing Costs | $525 | $0 |
| Real Estate Taxes | $1,030 | $0 |
Property Value by Mortgage Status in New Haven CDP Huron County
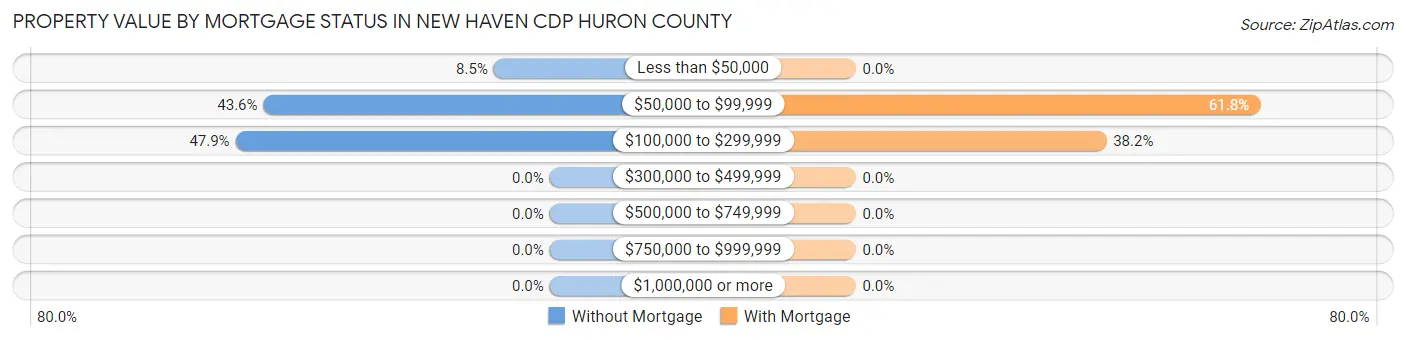
| Property Value | Without Mortgage | With Mortgage |
| Less than $50,000 | 8 (8.5%) | 0 (0.0%) |
| $50,000 to $99,999 | 41 (43.6%) | 55 (61.8%) |
| $100,000 to $299,999 | 45 (47.9%) | 34 (38.2%) |
| $300,000 to $499,999 | 0 (0.0%) | 0 (0.0%) |
| $500,000 to $749,999 | 0 (0.0%) | 0 (0.0%) |
| $750,000 to $999,999 | 0 (0.0%) | 0 (0.0%) |
| $1,000,000 or more | 0 (0.0%) | 0 (0.0%) |
| Total | 94 (100.0%) | 89 (100.0%) |
Household Income by Mortgage Status in New Haven CDP Huron County
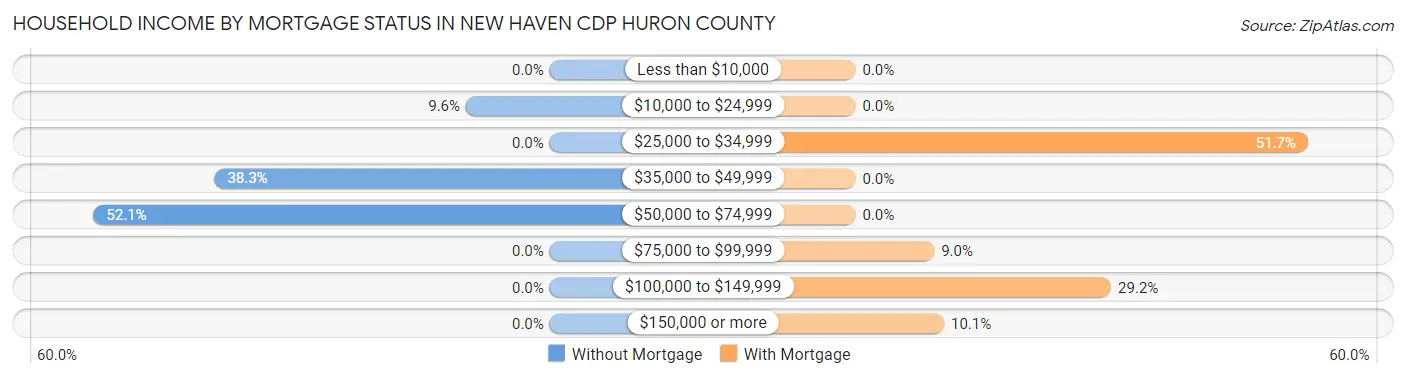
| Household Income | Without Mortgage | With Mortgage |
| Less than $10,000 | 0 (0.0%) | 0 (0.0%) |
| $10,000 to $24,999 | 9 (9.6%) | 0 (0.0%) |
| $25,000 to $34,999 | 0 (0.0%) | 46 (51.7%) |
| $35,000 to $49,999 | 36 (38.3%) | 0 (0.0%) |
| $50,000 to $74,999 | 49 (52.1%) | 0 (0.0%) |
| $75,000 to $99,999 | 0 (0.0%) | 8 (9.0%) |
| $100,000 to $149,999 | 0 (0.0%) | 26 (29.2%) |
| $150,000 or more | 0 (0.0%) | 9 (10.1%) |
| Total | 94 (100.0%) | 89 (100.0%) |
Property Value to Household Income Ratio in New Haven CDP Huron County
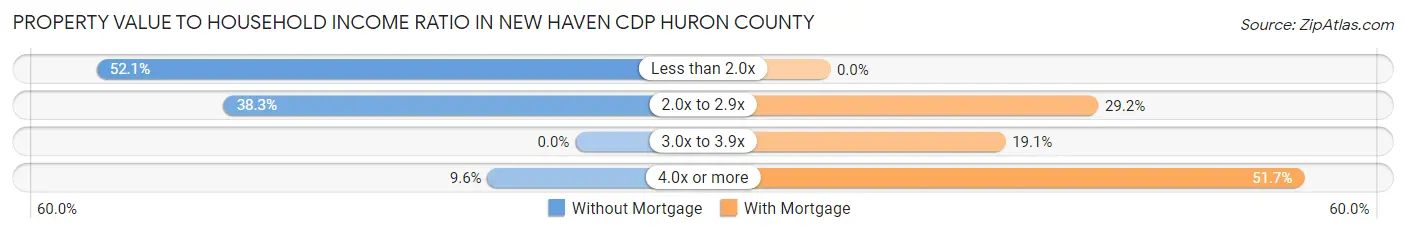
| Value-to-Income Ratio | Without Mortgage | With Mortgage |
| Less than 2.0x | 49 (52.1%) | 0 (0.0%) |
| 2.0x to 2.9x | 36 (38.3%) | 26 (29.2%) |
| 3.0x to 3.9x | 0 (0.0%) | 17 (19.1%) |
| 4.0x or more | 9 (9.6%) | 46 (51.7%) |
| Total | 94 (100.0%) | 89 (100.0%) |
Real Estate Taxes by Mortgage Status in New Haven CDP Huron County
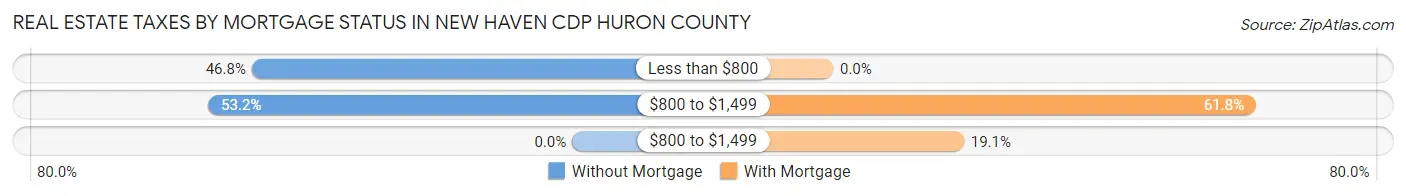
| Property Taxes | Without Mortgage | With Mortgage |
| Less than $800 | 44 (46.8%) | 0 (0.0%) |
| $800 to $1,499 | 50 (53.2%) | 55 (61.8%) |
| $800 to $1,499 | 0 (0.0%) | 17 (19.1%) |
| Total | 94 (100.0%) | 89 (100.0%) |
Health & Disability in New Haven CDP Huron County
Health Insurance Coverage by Age in New Haven CDP Huron County
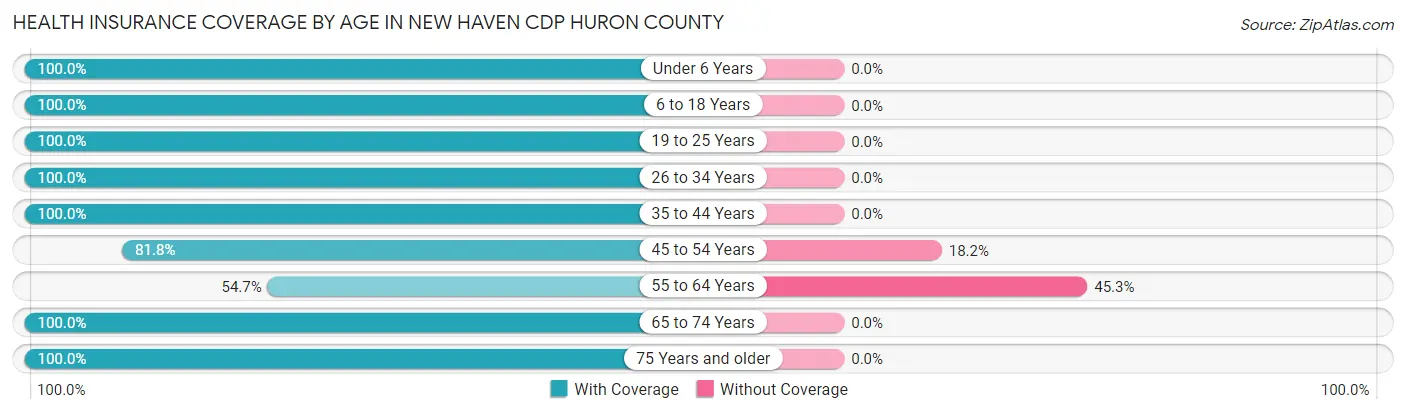
| Age Bracket | With Coverage | Without Coverage |
| Under 6 Years | 47 (100.0%) | 0 (0.0%) |
| 6 to 18 Years | 33 (100.0%) | 0 (0.0%) |
| 19 to 25 Years | 87 (100.0%) | 0 (0.0%) |
| 26 to 34 Years | 45 (100.0%) | 0 (0.0%) |
| 35 to 44 Years | 65 (100.0%) | 0 (0.0%) |
| 45 to 54 Years | 72 (81.8%) | 16 (18.2%) |
| 55 to 64 Years | 70 (54.7%) | 58 (45.3%) |
| 65 to 74 Years | 18 (100.0%) | 0 (0.0%) |
| 75 Years and older | 9 (100.0%) | 0 (0.0%) |
| Total | 446 (85.8%) | 74 (14.2%) |
Health Insurance Coverage by Citizenship Status in New Haven CDP Huron County

| Citizenship Status | With Coverage | Without Coverage |
| Native Born | 47 (100.0%) | 0 (0.0%) |
| Foreign Born, Citizen | 33 (100.0%) | 0 (0.0%) |
| Foreign Born, not a Citizen | 87 (100.0%) | 0 (0.0%) |
Health Insurance Coverage by Household Income in New Haven CDP Huron County
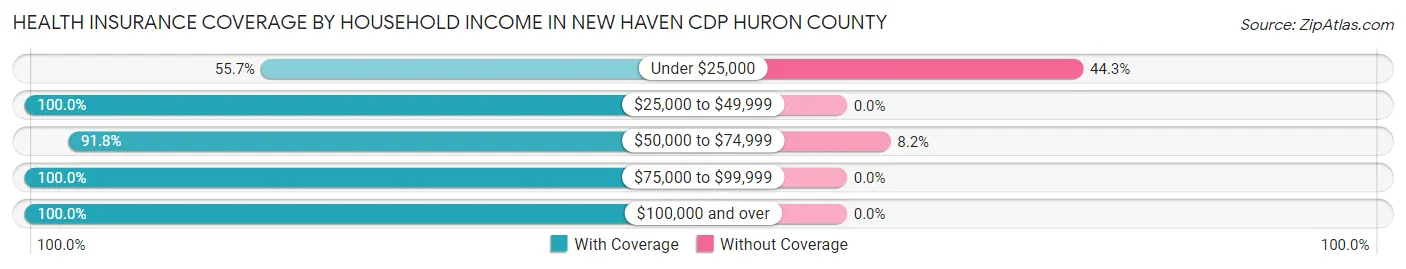
| Household Income | With Coverage | Without Coverage |
| Under $25,000 | 73 (55.7%) | 58 (44.3%) |
| $25,000 to $49,999 | 91 (100.0%) | 0 (0.0%) |
| $50,000 to $74,999 | 180 (91.8%) | 16 (8.2%) |
| $75,000 to $99,999 | 69 (100.0%) | 0 (0.0%) |
| $100,000 and over | 33 (100.0%) | 0 (0.0%) |
Public vs Private Health Insurance Coverage by Age in New Haven CDP Huron County
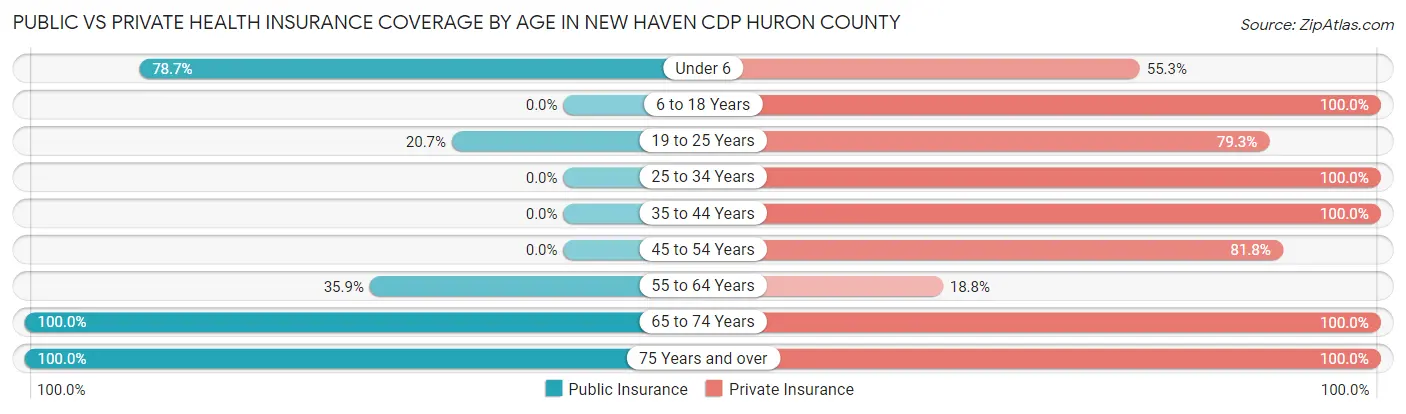
| Age Bracket | Public Insurance | Private Insurance |
| Under 6 | 37 (78.7%) | 26 (55.3%) |
| 6 to 18 Years | 0 (0.0%) | 33 (100.0%) |
| 19 to 25 Years | 18 (20.7%) | 69 (79.3%) |
| 25 to 34 Years | 0 (0.0%) | 45 (100.0%) |
| 35 to 44 Years | 0 (0.0%) | 65 (100.0%) |
| 45 to 54 Years | 0 (0.0%) | 72 (81.8%) |
| 55 to 64 Years | 46 (35.9%) | 24 (18.8%) |
| 65 to 74 Years | 18 (100.0%) | 18 (100.0%) |
| 75 Years and over | 9 (100.0%) | 9 (100.0%) |
| Total | 128 (24.6%) | 361 (69.4%) |
Disability Status by Sex by Age in New Haven CDP Huron County
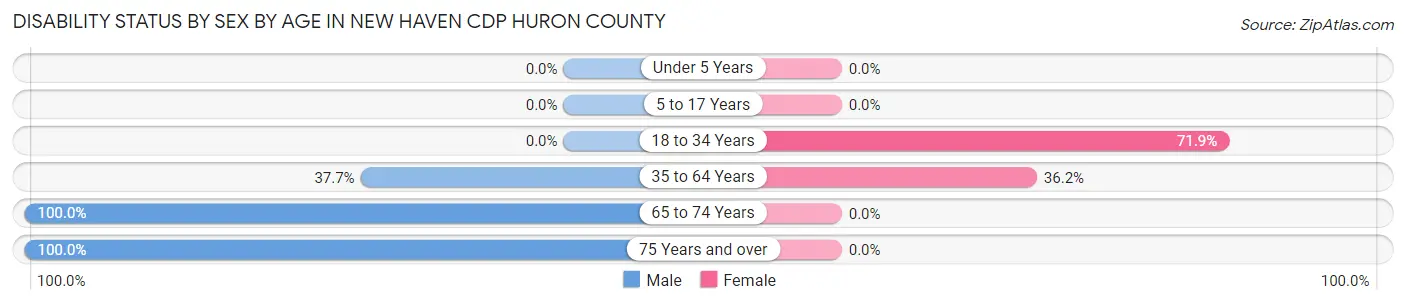
| Age Bracket | Male | Female |
| Under 5 Years | 0 (0.0%) | 0 (0.0%) |
| 5 to 17 Years | 0 (0.0%) | 0 (0.0%) |
| 18 to 34 Years | 0 (0.0%) | 69 (71.9%) |
| 35 to 64 Years | 58 (37.7%) | 46 (36.2%) |
| 65 to 74 Years | 18 (100.0%) | 0 (0.0%) |
| 75 Years and over | 9 (100.0%) | 0 (0.0%) |
Disability Class by Sex by Age in New Haven CDP Huron County
Disability Class: Hearing Difficulty
| Age Bracket | Male | Female |
| Under 5 Years | 0 (0.0%) | 0 (0.0%) |
| 5 to 17 Years | 0 (0.0%) | 0 (0.0%) |
| 18 to 34 Years | 0 (0.0%) | 0 (0.0%) |
| 35 to 64 Years | 0 (0.0%) | 0 (0.0%) |
| 65 to 74 Years | 0 (0.0%) | 0 (0.0%) |
| 75 Years and over | 0 (0.0%) | 0 (0.0%) |
Disability Class: Vision Difficulty
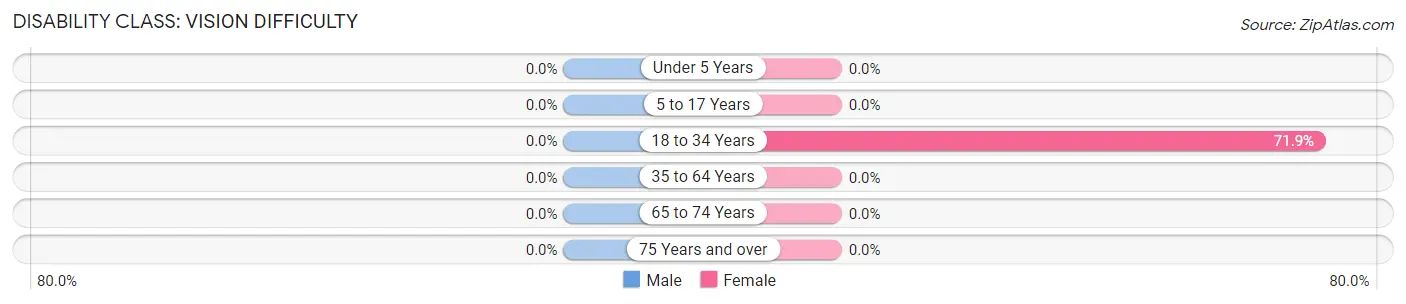
| Age Bracket | Male | Female |
| Under 5 Years | 0 (0.0%) | 0 (0.0%) |
| 5 to 17 Years | 0 (0.0%) | 0 (0.0%) |
| 18 to 34 Years | 0 (0.0%) | 69 (71.9%) |
| 35 to 64 Years | 0 (0.0%) | 0 (0.0%) |
| 65 to 74 Years | 0 (0.0%) | 0 (0.0%) |
| 75 Years and over | 0 (0.0%) | 0 (0.0%) |
Disability Class: Cognitive Difficulty
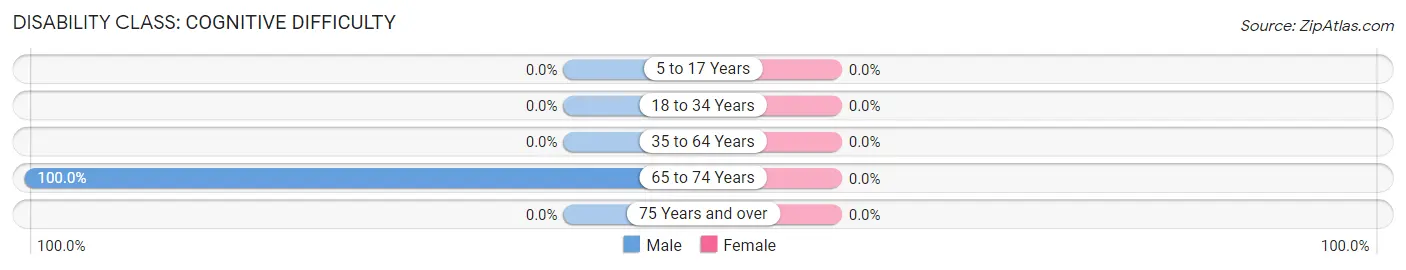
| Age Bracket | Male | Female |
| 5 to 17 Years | 0 (0.0%) | 0 (0.0%) |
| 18 to 34 Years | 0 (0.0%) | 0 (0.0%) |
| 35 to 64 Years | 0 (0.0%) | 0 (0.0%) |
| 65 to 74 Years | 18 (100.0%) | 0 (0.0%) |
| 75 Years and over | 0 (0.0%) | 0 (0.0%) |
Disability Class: Ambulatory Difficulty
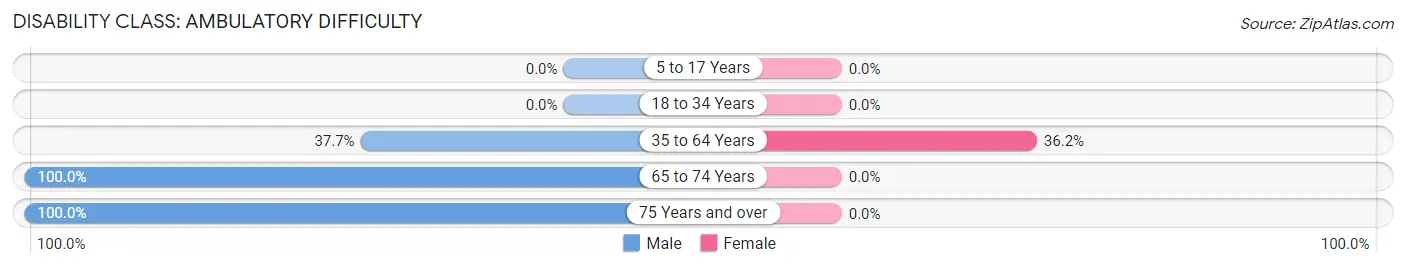
| Age Bracket | Male | Female |
| 5 to 17 Years | 0 (0.0%) | 0 (0.0%) |
| 18 to 34 Years | 0 (0.0%) | 0 (0.0%) |
| 35 to 64 Years | 58 (37.7%) | 46 (36.2%) |
| 65 to 74 Years | 18 (100.0%) | 0 (0.0%) |
| 75 Years and over | 9 (100.0%) | 0 (0.0%) |
Disability Class: Self-Care Difficulty
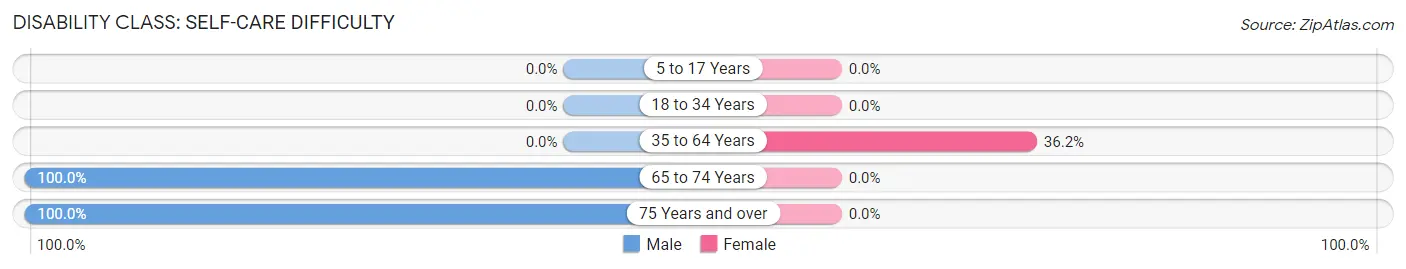
| Age Bracket | Male | Female |
| 5 to 17 Years | 0 (0.0%) | 0 (0.0%) |
| 18 to 34 Years | 0 (0.0%) | 0 (0.0%) |
| 35 to 64 Years | 0 (0.0%) | 46 (36.2%) |
| 65 to 74 Years | 18 (100.0%) | 0 (0.0%) |
| 75 Years and over | 9 (100.0%) | 0 (0.0%) |
Technology Access in New Haven CDP Huron County
Computing Device Access in New Haven CDP Huron County
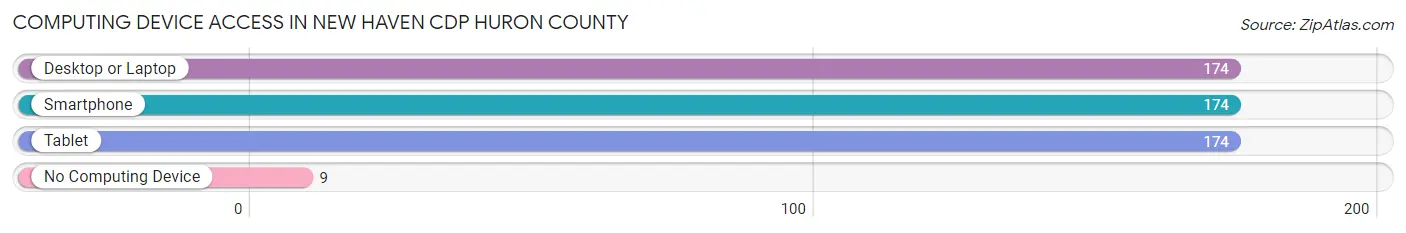
| Device Type | # Households | % Households |
| Desktop or Laptop | 174 | 95.1% |
| Smartphone | 174 | 95.1% |
| Tablet | 174 | 95.1% |
| No Computing Device | 9 | 4.9% |
| Total | 183 | 100.0% |
Internet Access in New Haven CDP Huron County
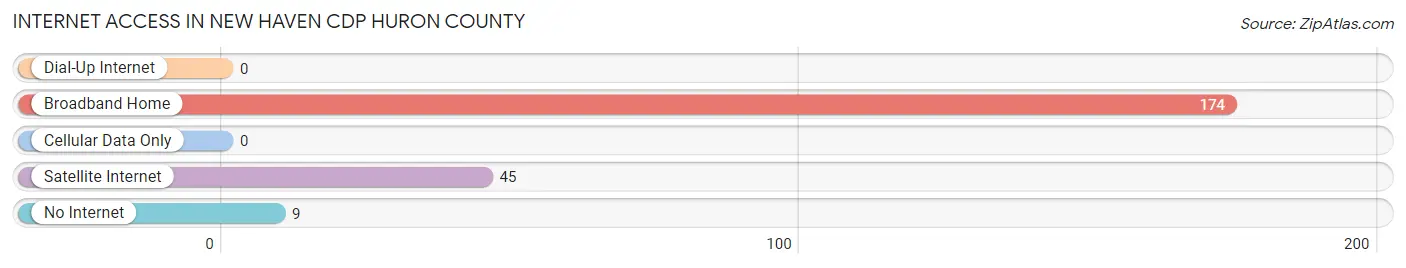
| Internet Type | # Households | % Households |
| Dial-Up Internet | 0 | 0.0% |
| Broadband Home | 174 | 95.1% |
| Cellular Data Only | 0 | 0.0% |
| Satellite Internet | 45 | 24.6% |
| No Internet | 9 | 4.9% |
| Total | 183 | 100.0% |
New Haven CDP Huron County Summary
New Haven Cdp Huron County, OH is a census-designated place (CDP) located in Huron County, Ohio. The CDP is located in the northwest corner of the county, and is bordered by the townships of Sherman, Ridgefield, and Bronson. As of the 2010 census, the population of New Haven Cdp Huron County, OH was 1,845.
History
The area that is now New Haven Cdp Huron County, OH was first settled in the early 1800s by German immigrants. The first settlers were the families of John and Jacob Schmucker, who arrived in 1817. The Schmuckers were followed by other German families, including the Bauers, the Schmidts, and the Schmids. The area was originally known as Schmucker's Settlement, and the first post office was established in 1837.
In 1845, the settlement was renamed New Haven, after the town of New Haven, Connecticut. The name was chosen to honor the original settlers, who had come from New Haven, Connecticut.
The town of New Haven was officially incorporated in 1854. The town grew rapidly, and by the late 1800s, it had become a thriving agricultural and industrial center. The town was home to several factories, including a flour mill, a sawmill, a brickyard, and a furniture factory.
Geography
New Haven Cdp Huron County, OH is located at 41°17'N 82°45'W (41.2833, -82.7500). The CDP has a total area of 4.2 square miles, all of which is land.
The CDP is located in the northwest corner of Huron County, and is bordered by the townships of Sherman, Ridgefield, and Bronson. The CDP is located approximately 10 miles south of Sandusky, and 25 miles east of Toledo.
Economy
The economy of New Haven Cdp Huron County, OH is largely based on agriculture and manufacturing. The town is home to several factories, including a flour mill, a sawmill, a brickyard, and a furniture factory.
The town is also home to several small businesses, including restaurants, retail stores, and service providers. The town is also home to a number of farms, which produce a variety of crops, including corn, soybeans, and wheat.
Demographics
As of the 2010 census, there were 1,845 people, 717 households, and 486 families residing in the CDP. The population density was 441.2 people per square mile. There were 776 housing units at an average density of 185.7 per square mile.
The racial makeup of the CDP was 97.2% White, 0.7% African American, 0.2% Native American, 0.2% Asian, 0.2% from other races, and 1.7% from two or more races. Hispanic or Latino of any race were 1.2% of the population.
There were 717 households, out of which 32.2% had children under the age of 18 living with them, 48.2% were married couples living together, 13.2% had a female householder with no husband present, and 33.2% were non-families. 28.2% of all households were made up of individuals, and 12.7% had someone living alone who was 65 years of age or older. The average household size was 2.56 and the average family size was 3.14.
In the CDP, the population was spread out, with 26.2% under the age of 18, 8.2% from 18 to 24, 27.2% from 25 to 44, 24.2% from 45 to 64, and 14.2% who were 65 years of age or older. The median age was 37 years. For every 100 females, there were 97.2 males. For every 100 females age 18 and over, there were 94.2 males.
The median income for a household in the CDP was $37,917, and the median income for a family was $45,000. Males had a median income of $35,000 versus $25,000 for females. The per capita income for the CDP was $17,845. About 8.2% of families and 10.2% of the population were below the poverty line, including 14.2% of those under age 18 and 8.2% of those age 65 or over.
Common Questions
What is Per Capita Income in New Haven CDP Huron County?
Per Capita income in New Haven CDP Huron County is $17,224.
What is the Median Family Income in New Haven CDP Huron County?
Median Family Income in New Haven CDP Huron County is $52,647.
What is the Median Household income in New Haven CDP Huron County?
Median Household Income in New Haven CDP Huron County is $52,656.
What is Income or Wage Gap in New Haven CDP Huron County?
Income or Wage Gap in New Haven CDP Huron County is 62.8%.
Women in New Haven CDP Huron County earn 37.2 cents for every dollar earned by a man.
What is Inequality or Gini Index in New Haven CDP Huron County?
Inequality or Gini Index in New Haven CDP Huron County is 0.30.
What is the Total Population of New Haven CDP Huron County?
Total Population of New Haven CDP Huron County is 520.
What is the Total Male Population of New Haven CDP Huron County?
Total Male Population of New Haven CDP Huron County is 217.
What is the Total Female Population of New Haven CDP Huron County?
Total Female Population of New Haven CDP Huron County is 303.
What is the Ratio of Males per 100 Females in New Haven CDP Huron County?
There are 71.62 Males per 100 Females in New Haven CDP Huron County.
What is the Ratio of Females per 100 Males in New Haven CDP Huron County?
There are 139.63 Females per 100 Males in New Haven CDP Huron County.
What is the Median Population Age in New Haven CDP Huron County?
Median Population Age in New Haven CDP Huron County is 43.5 Years.
What is the Average Family Size in New Haven CDP Huron County
Average Family Size in New Haven CDP Huron County is 2.5 People.
What is the Average Household Size in New Haven CDP Huron County
Average Household Size in New Haven CDP Huron County is 2.8 People.
How Large is the Labor Force in New Haven CDP Huron County?
There are 291 People in the Labor Forcein in New Haven CDP Huron County.
What is the Percentage of People in the Labor Force in New Haven CDP Huron County?
64.1% of People are in the Labor Force in New Haven CDP Huron County.
What is the Unemployment Rate in New Haven CDP Huron County?
Unemployment Rate in New Haven CDP Huron County is 5.8%.