Zip Codes with the Highest Percentage of Population Employed in Accommodation & Food Services in Canton, OH
RELATED REPORTS & OPTIONS
Accommodation & Food Services
Canton
Compare Zip Codes
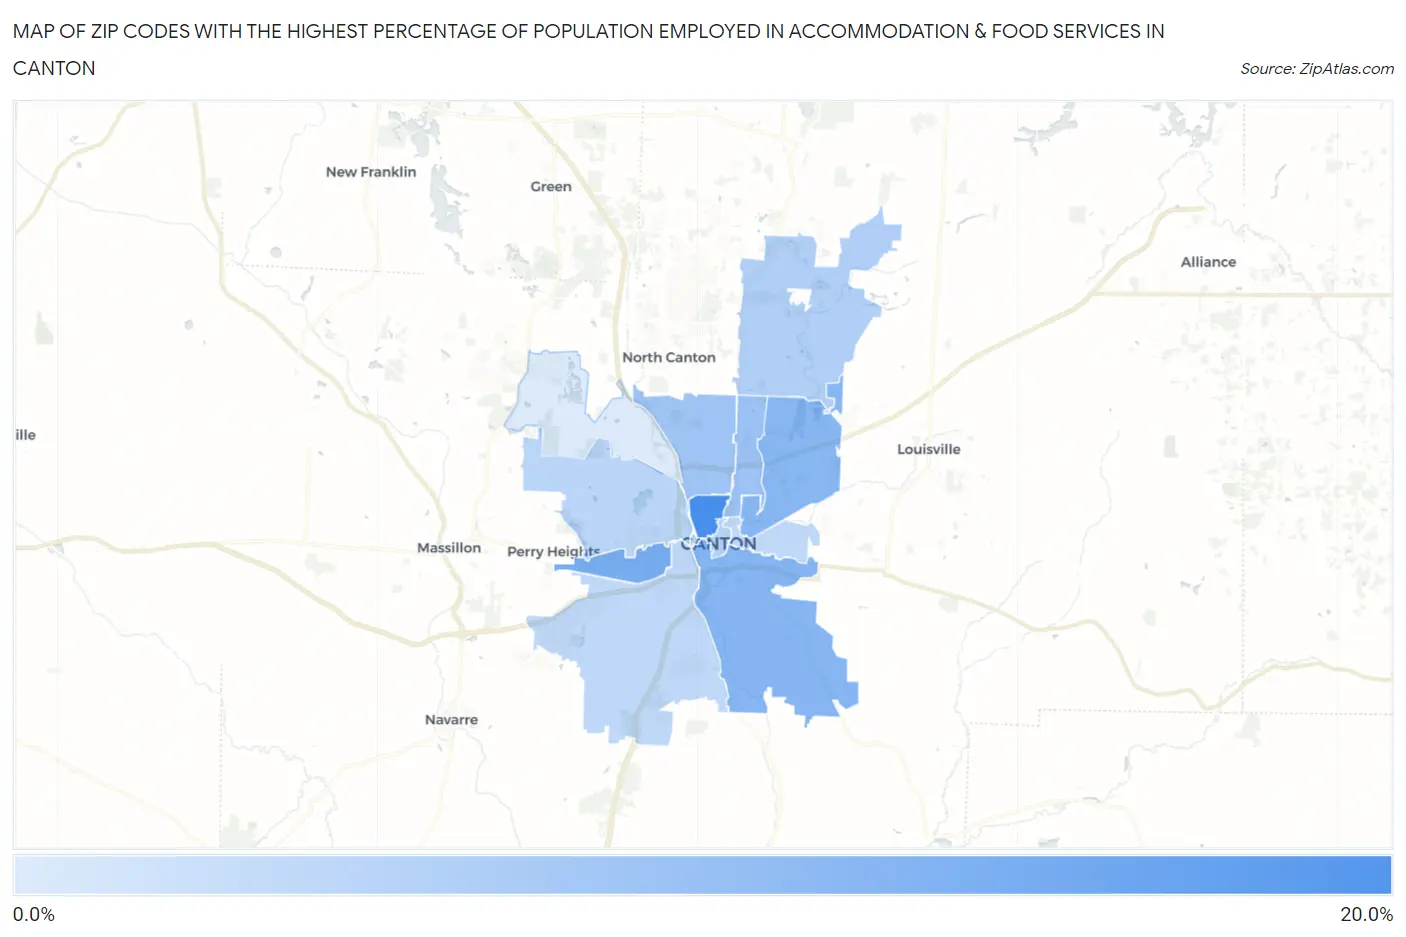
Map of Zip Codes with the Highest Percentage of Population Employed in Accommodation & Food Services in Canton
5.3%
15.8%
Zip Codes with the Highest Percentage of Population Employed in Accommodation & Food Services in Canton, OH
| Zip Code | % Employed | vs State | vs National | |
| 1. | 44703 | 15.8% | 7.0%(+8.82)#49 | 6.9%(+8.95)#1,489 |
| 2. | 44710 | 12.4% | 7.0%(+5.38)#102 | 6.9%(+5.51)#2,639 |
| 3. | 44707 | 11.3% | 7.0%(+4.31)#131 | 6.9%(+4.44)#3,299 |
| 4. | 44705 | 11.1% | 7.0%(+4.13)#140 | 6.9%(+4.26)#3,439 |
| 5. | 44714 | 9.9% | 7.0%(+2.90)#206 | 6.9%(+3.03)#4,653 |
| 6. | 44709 | 9.6% | 7.0%(+2.62)#221 | 6.9%(+2.74)#5,027 |
| 7. | 44721 | 8.3% | 7.0%(+1.25)#328 | 6.9%(+1.38)#7,305 |
| 8. | 44702 | 8.0% | 7.0%(+0.975)#351 | 6.9%(+1.10)#7,852 |
| 9. | 44708 | 7.7% | 7.0%(+0.656)#389 | 6.9%(+0.784)#8,590 |
| 10. | 44706 | 7.4% | 7.0%(+0.398)#412 | 6.9%(+0.526)#9,240 |
| 11. | 44704 | 7.4% | 7.0%(+0.344)#419 | 6.9%(+0.472)#9,369 |
| 12. | 44718 | 5.3% | 7.0%(-1.67)#689 | 6.9%(-1.54)#15,619 |
1
Common Questions
What are the Top 10 Zip Codes with the Highest Percentage of Population Employed in Accommodation & Food Services in Canton, OH?
Top 10 Zip Codes with the Highest Percentage of Population Employed in Accommodation & Food Services in Canton, OH are:
What zip code has the Highest Percentage of Population Employed in Accommodation & Food Services in Canton, OH?
44703 has the Highest Percentage of Population Employed in Accommodation & Food Services in Canton, OH with 15.8%.
What is the Percentage of Population Employed in Accommodation & Food Services in Canton, OH?
Percentage of Population Employed in Accommodation & Food Services in Canton is 10.9%.
What is the Percentage of Population Employed in Accommodation & Food Services in Ohio?
Percentage of Population Employed in Accommodation & Food Services in Ohio is 7.0%.
What is the Percentage of Population Employed in Accommodation & Food Services in the United States?
Percentage of Population Employed in Accommodation & Food Services in the United States is 6.9%.