Withamsville, OH Map & Demographics
Withamsville Map
Withamsville Overview
$32,912
PER CAPITA INCOME
$77,917
AVG FAMILY INCOME
$64,592
AVG HOUSEHOLD INCOME
22.0%
WAGE / INCOME GAP [ % ]
78.0¢/ $1
WAGE / INCOME GAP [ $ ]
0.41
INEQUALITY / GINI INDEX
7,803
TOTAL POPULATION
3,330
MALE POPULATION
4,473
FEMALE POPULATION
74.45
MALES / 100 FEMALES
134.32
FEMALES / 100 MALES
41.2
MEDIAN AGE
2.8
AVG FAMILY SIZE
2.3
AVG HOUSEHOLD SIZE
4,108
LABOR FORCE [ PEOPLE ]
62.6%
PERCENT IN LABOR FORCE
2.4%
UNEMPLOYMENT RATE
Income in Withamsville
Income Overview in Withamsville
Per Capita Income in Withamsville is $32,912, while median incomes of families and households are $77,917 and $64,592 respectively.
| Characteristic | Number | Measure |
| Per Capita Income | 7,803 | $32,912 |
| Median Family Income | 2,024 | $77,917 |
| Mean Family Income | 2,024 | $79,230 |
| Median Household Income | 3,404 | $64,592 |
| Mean Household Income | 3,404 | $75,100 |
| Income Deficit | 2,024 | $0 |
| Wage / Income Gap (%) | 7,803 | 22.02% |
| Wage / Income Gap ($) | 7,803 | 77.98¢ per $1 |
| Gini / Inequality Index | 7,803 | 0.41 |
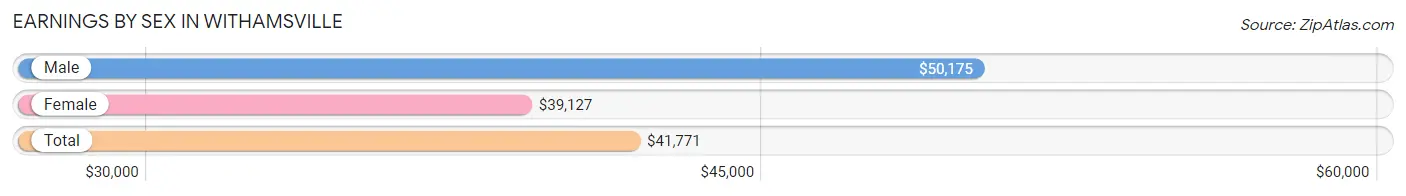
Earnings by Sex in Withamsville
Average Earnings in Withamsville are $41,771, $50,175 for men and $39,127 for women, a difference of 22.0%.
| Sex | Number | Average Earnings |
| Male | 2,138 (50.1%) | $50,175 |
| Female | 2,127 (49.9%) | $39,127 |
| Total | 4,265 (100.0%) | $41,771 |
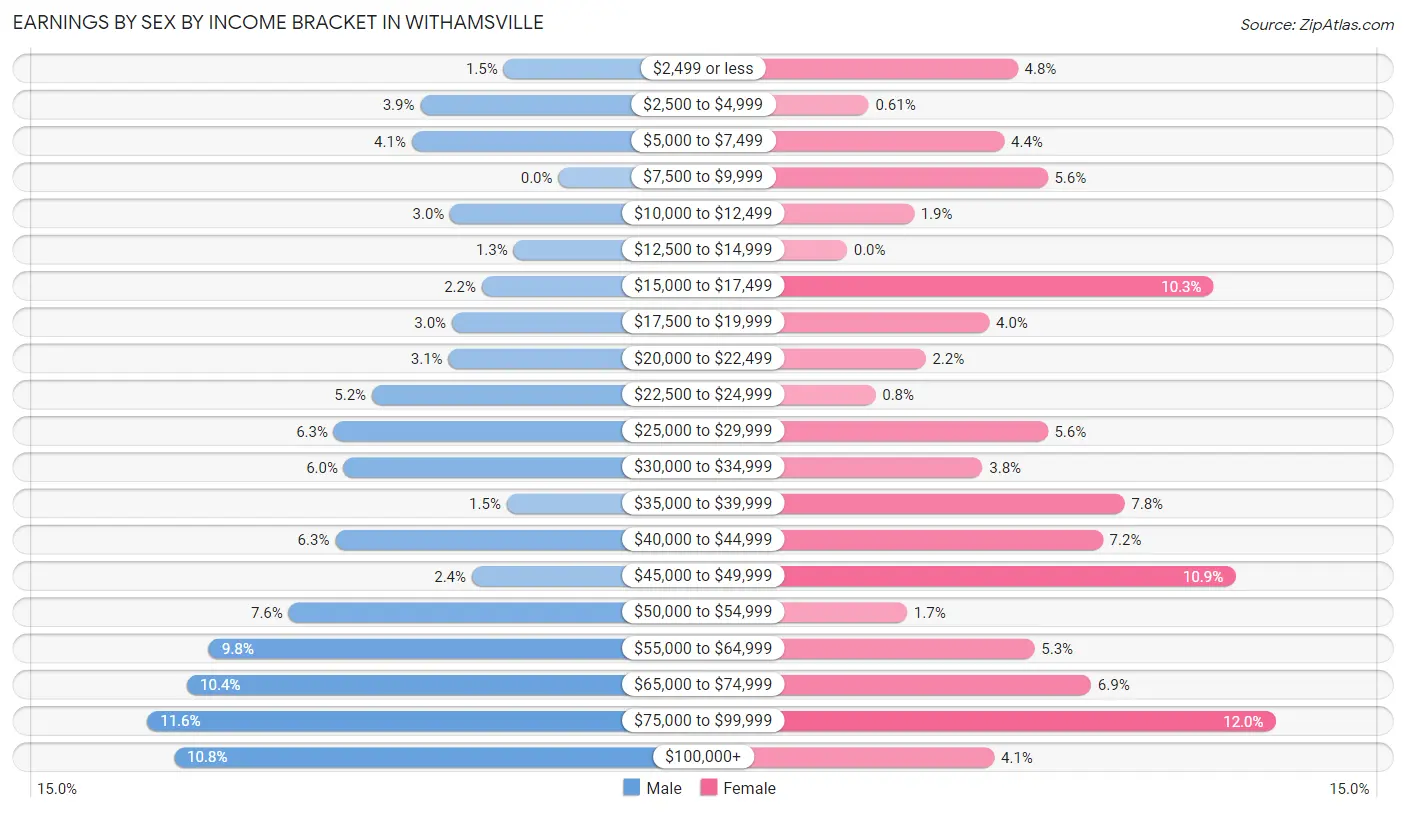
Earnings by Sex by Income Bracket in Withamsville
The most common earnings brackets in Withamsville are $75,000 to $99,999 for men (247 | 11.6%) and $75,000 to $99,999 for women (256 | 12.0%).
| Income | Male | Female |
| $2,499 or less | 33 (1.5%) | 102 (4.8%) |
| $2,500 to $4,999 | 83 (3.9%) | 13 (0.6%) |
| $5,000 to $7,499 | 88 (4.1%) | 94 (4.4%) |
| $7,500 to $9,999 | 0 (0.0%) | 120 (5.6%) |
| $10,000 to $12,499 | 65 (3.0%) | 40 (1.9%) |
| $12,500 to $14,999 | 27 (1.3%) | 0 (0.0%) |
| $15,000 to $17,499 | 46 (2.1%) | 219 (10.3%) |
| $17,500 to $19,999 | 64 (3.0%) | 85 (4.0%) |
| $20,000 to $22,499 | 66 (3.1%) | 47 (2.2%) |
| $22,500 to $24,999 | 112 (5.2%) | 17 (0.8%) |
| $25,000 to $29,999 | 135 (6.3%) | 120 (5.6%) |
| $30,000 to $34,999 | 129 (6.0%) | 81 (3.8%) |
| $35,000 to $39,999 | 31 (1.5%) | 166 (7.8%) |
| $40,000 to $44,999 | 134 (6.3%) | 153 (7.2%) |
| $45,000 to $49,999 | 52 (2.4%) | 232 (10.9%) |
| $50,000 to $54,999 | 162 (7.6%) | 36 (1.7%) |
| $55,000 to $64,999 | 210 (9.8%) | 112 (5.3%) |
| $65,000 to $74,999 | 223 (10.4%) | 146 (6.9%) |
| $75,000 to $99,999 | 247 (11.6%) | 256 (12.0%) |
| $100,000+ | 231 (10.8%) | 88 (4.1%) |
| Total | 2,138 (100.0%) | 2,127 (100.0%) |
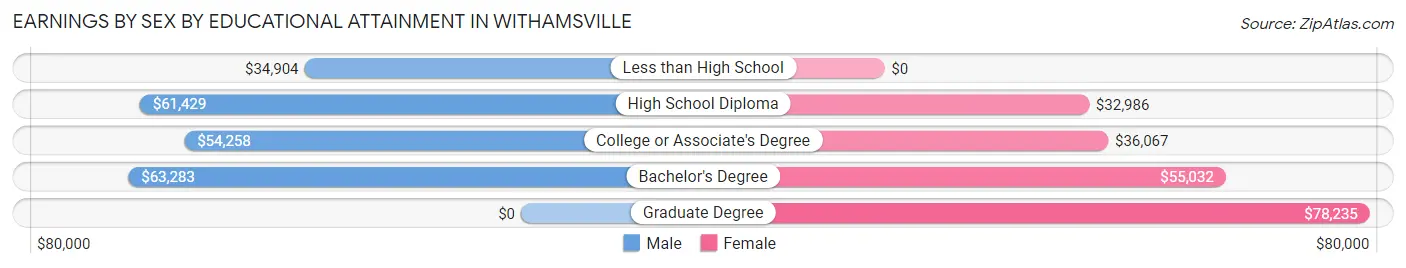
Earnings by Sex by Educational Attainment in Withamsville
Average earnings in Withamsville are $54,595 for men and $45,301 for women, a difference of 17.0%. Men with an educational attainment of bachelor's degree enjoy the highest average annual earnings of $63,283, while those with less than high school education earn the least with $34,904. Women with an educational attainment of graduate degree earn the most with the average annual earnings of $78,235, while those with high school diploma education have the smallest earnings of $32,986.
| Educational Attainment | Male Income | Female Income |
| Less than High School | $34,904 | $0 |
| High School Diploma | $61,429 | $32,986 |
| College or Associate's Degree | $54,258 | $36,067 |
| Bachelor's Degree | $63,283 | $55,032 |
| Graduate Degree | - | - |
| Total | $54,595 | $45,301 |
Family Income in Withamsville
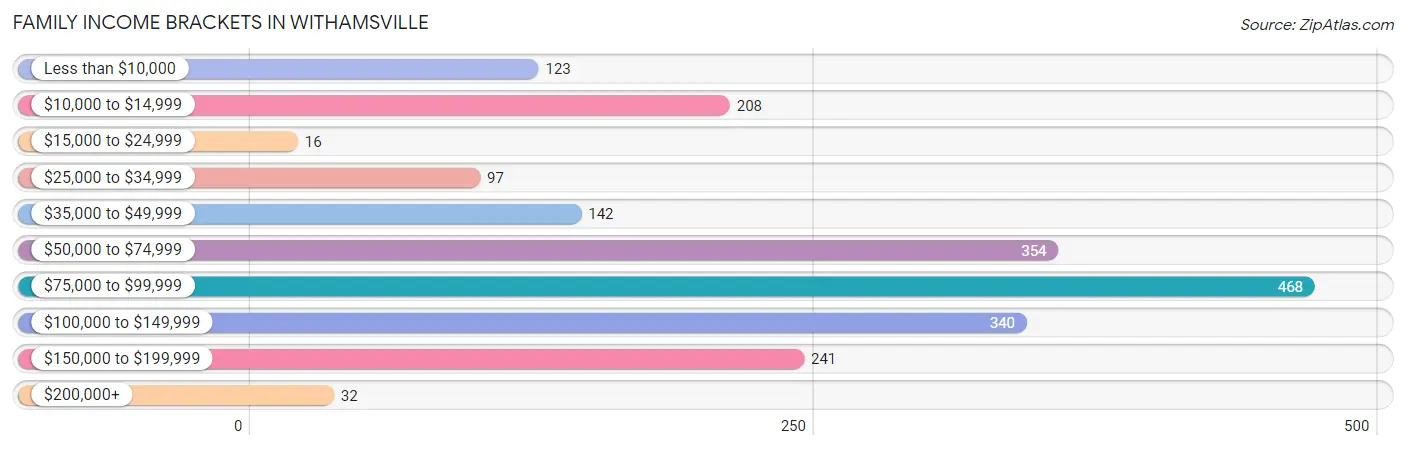
Family Income Brackets in Withamsville
According to the Withamsville family income data, there are 468 families falling into the $75,000 to $99,999 income range, which is the most common income bracket and makes up 23.1% of all families. Conversely, the $15,000 to $24,999 income bracket is the least frequent group with only 16 families (0.8%) belonging to this category.
| Income Bracket | # Families | % Families |
| Less than $10,000 | 123 | 6.1% |
| $10,000 to $14,999 | 208 | 10.3% |
| $15,000 to $24,999 | 16 | 0.8% |
| $25,000 to $34,999 | 97 | 4.8% |
| $35,000 to $49,999 | 142 | 7.0% |
| $50,000 to $74,999 | 354 | 17.5% |
| $75,000 to $99,999 | 468 | 23.1% |
| $100,000 to $149,999 | 340 | 16.8% |
| $150,000 to $199,999 | 241 | 11.9% |
| $200,000+ | 32 | 1.6% |
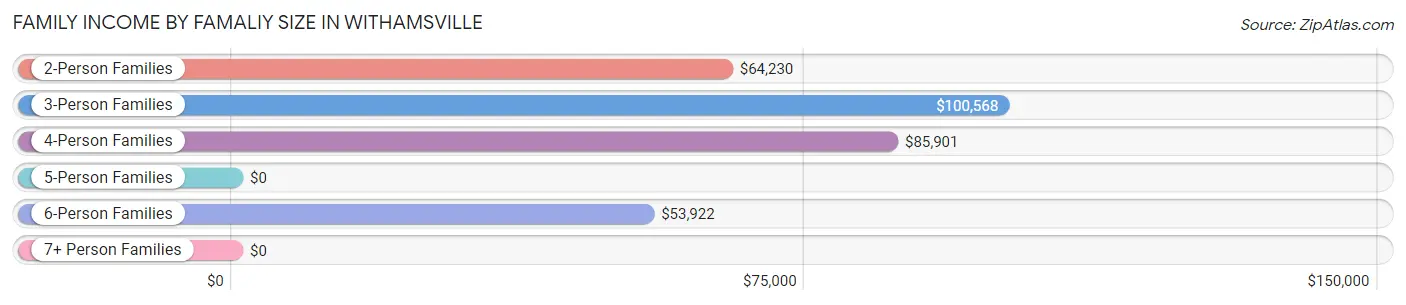
Family Income by Famaliy Size in Withamsville
3-person families (394 | 19.5%) account for the highest median family income in Withamsville with $100,568 per family, while 3-person families (394 | 19.5%) have the highest median income of $33,523 per family member.
| Income Bracket | # Families | Median Income |
| 2-Person Families | 1,145 (56.6%) | $64,230 |
| 3-Person Families | 394 (19.5%) | $100,568 |
| 4-Person Families | 195 (9.6%) | $85,901 |
| 5-Person Families | 200 (9.9%) | $0 |
| 6-Person Families | 66 (3.3%) | $53,922 |
| 7+ Person Families | 24 (1.2%) | $0 |
| Total | 2,024 (100.0%) | $77,917 |
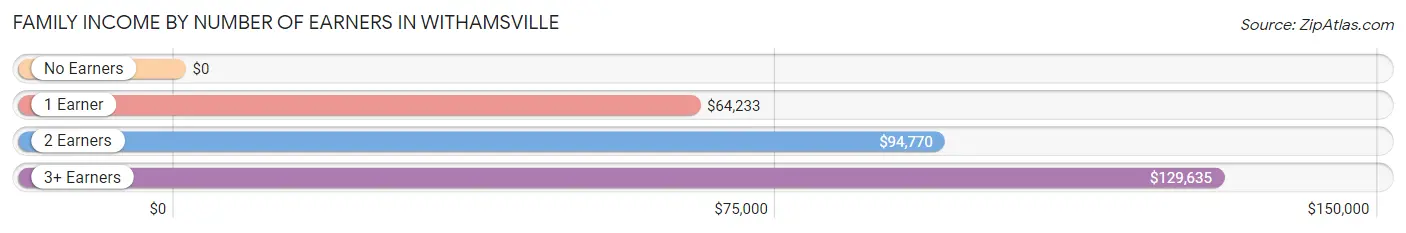
Family Income by Number of Earners in Withamsville
| Number of Earners | # Families | Median Income |
| No Earners | 538 (26.6%) | $0 |
| 1 Earner | 542 (26.8%) | $64,233 |
| 2 Earners | 743 (36.7%) | $94,770 |
| 3+ Earners | 201 (9.9%) | $129,635 |
| Total | 2,024 (100.0%) | $77,917 |
Household Income in Withamsville
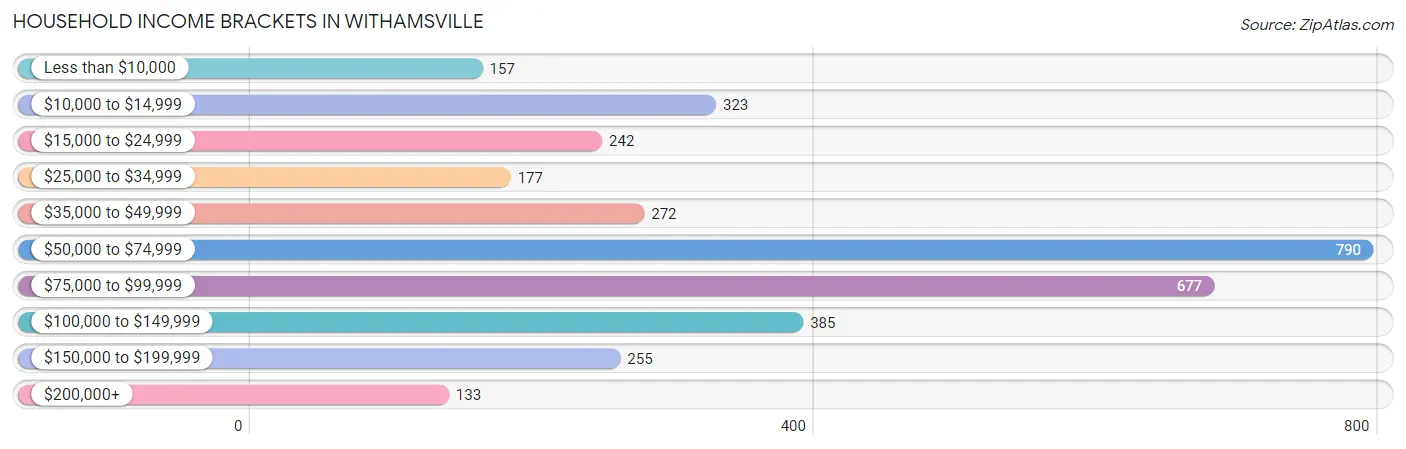
Household Income Brackets in Withamsville
With 790 households falling in the category, the $50,000 to $74,999 income range is the most frequent in Withamsville, accounting for 23.2% of all households. In contrast, only 133 households (3.9%) fall into the $200,000+ income bracket, making it the least populous group.
| Income Bracket | # Households | % Households |
| Less than $10,000 | 157 | 4.6% |
| $10,000 to $14,999 | 323 | 9.5% |
| $15,000 to $24,999 | 242 | 7.1% |
| $25,000 to $34,999 | 177 | 5.2% |
| $35,000 to $49,999 | 272 | 8.0% |
| $50,000 to $74,999 | 790 | 23.2% |
| $75,000 to $99,999 | 677 | 19.9% |
| $100,000 to $149,999 | 385 | 11.3% |
| $150,000 to $199,999 | 255 | 7.5% |
| $200,000+ | 133 | 3.9% |
Household Income by Householder Age in Withamsville
The median household income in Withamsville is $64,592, with the highest median household income of $72,200 found in the 15 to 24 years age bracket for the primary householder. A total of 138 households (4.1%) fall into this category. Meanwhile, the 65+ years age bracket for the primary householder has the lowest median household income of $60,625, with 862 households (25.3%) in this group.
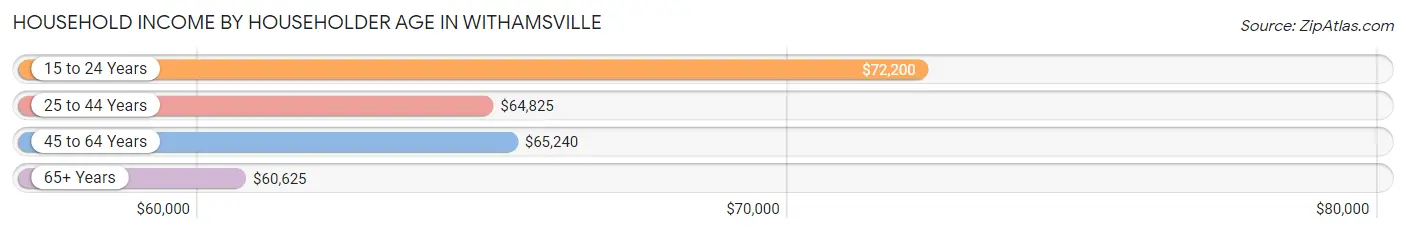
| Income Bracket | # Households | Median Income |
| 15 to 24 Years | 138 (4.1%) | $72,200 |
| 25 to 44 Years | 1,099 (32.3%) | $64,825 |
| 45 to 64 Years | 1,305 (38.3%) | $65,240 |
| 65+ Years | 862 (25.3%) | $60,625 |
| Total | 3,404 (100.0%) | $64,592 |
Poverty in Withamsville
Income Below Poverty by Sex and Age in Withamsville
With 9.9% poverty level for males and 20.4% for females among the residents of Withamsville, 6 to 11 year old males and 6 to 11 year old females are the most vulnerable to poverty, with 46 males (31.9%) and 140 females (47.1%) in their respective age groups living below the poverty level.
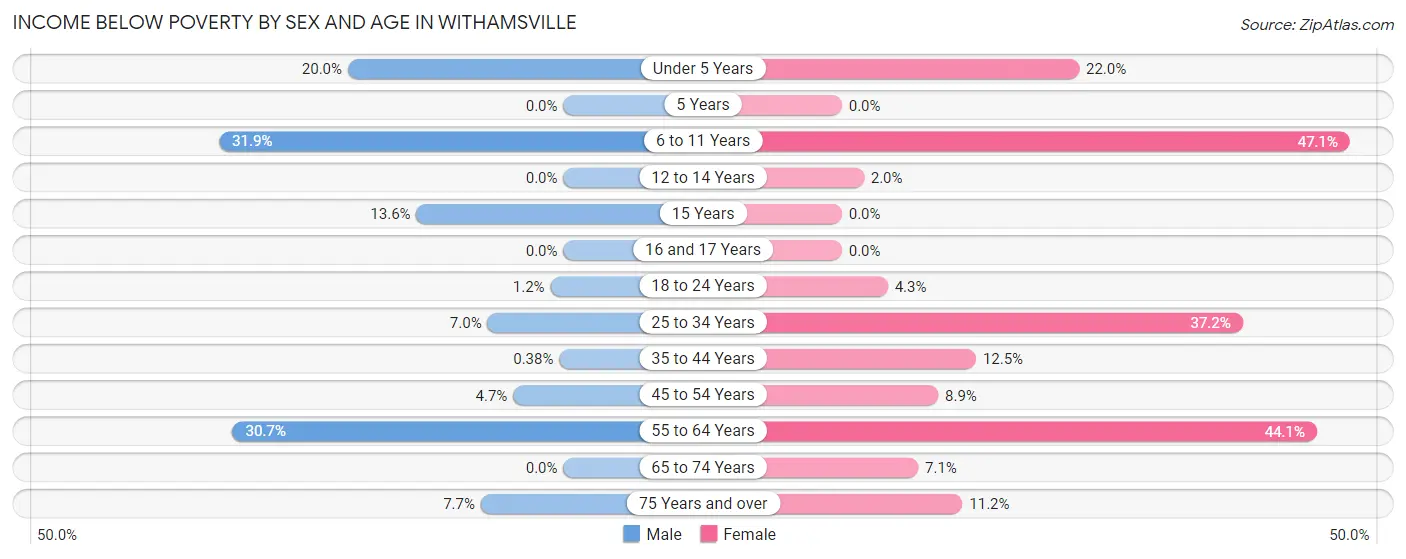
| Age Bracket | Male | Female |
| Under 5 Years | 19 (20.0%) | 61 (22.0%) |
| 5 Years | 0 (0.0%) | 0 (0.0%) |
| 6 to 11 Years | 46 (31.9%) | 140 (47.1%) |
| 12 to 14 Years | 0 (0.0%) | 3 (2.0%) |
| 15 Years | 3 (13.6%) | 0 (0.0%) |
| 16 and 17 Years | 0 (0.0%) | 0 (0.0%) |
| 18 to 24 Years | 4 (1.2%) | 22 (4.3%) |
| 25 to 34 Years | 28 (7.0%) | 164 (37.2%) |
| 35 to 44 Years | 2 (0.4%) | 85 (12.4%) |
| 45 to 54 Years | 24 (4.7%) | 37 (8.9%) |
| 55 to 64 Years | 183 (30.7%) | 324 (44.1%) |
| 65 to 74 Years | 0 (0.0%) | 38 (7.1%) |
| 75 Years and over | 16 (7.7%) | 30 (11.2%) |
| Total | 325 (9.9%) | 904 (20.4%) |
Income Above Poverty by Sex and Age in Withamsville
According to the poverty statistics in Withamsville, males aged 12 to 14 years and females aged 15 years are the age groups that are most secure financially, with 100.0% of males and 100.0% of females in these age groups living above the poverty line.
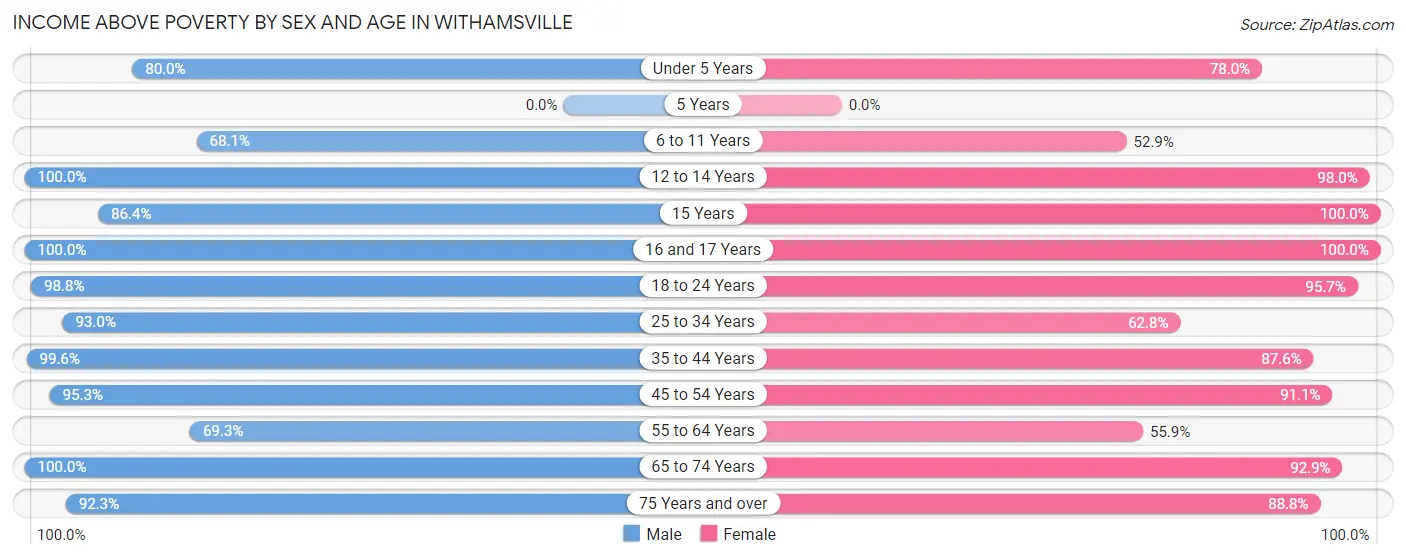
| Age Bracket | Male | Female |
| Under 5 Years | 76 (80.0%) | 216 (78.0%) |
| 5 Years | 0 (0.0%) | 0 (0.0%) |
| 6 to 11 Years | 98 (68.1%) | 157 (52.9%) |
| 12 to 14 Years | 138 (100.0%) | 144 (98.0%) |
| 15 Years | 19 (86.4%) | 90 (100.0%) |
| 16 and 17 Years | 74 (100.0%) | 31 (100.0%) |
| 18 to 24 Years | 329 (98.8%) | 494 (95.7%) |
| 25 to 34 Years | 370 (93.0%) | 277 (62.8%) |
| 35 to 44 Years | 522 (99.6%) | 598 (87.5%) |
| 45 to 54 Years | 491 (95.3%) | 377 (91.1%) |
| 55 to 64 Years | 413 (69.3%) | 411 (55.9%) |
| 65 to 74 Years | 247 (100.0%) | 499 (92.9%) |
| 75 Years and over | 193 (92.3%) | 238 (88.8%) |
| Total | 2,970 (90.1%) | 3,532 (79.6%) |
Income Below Poverty Among Married-Couple Families in Withamsville
The poverty statistics for married-couple families in Withamsville show that 14.2% or 199 of the total 1,403 families live below the poverty line. Families with no children have the highest poverty rate of 17.9%, comprising of 199 families. On the other hand, families with 1 or 2 children have the lowest poverty rate of 0.0%, which includes 0 families.
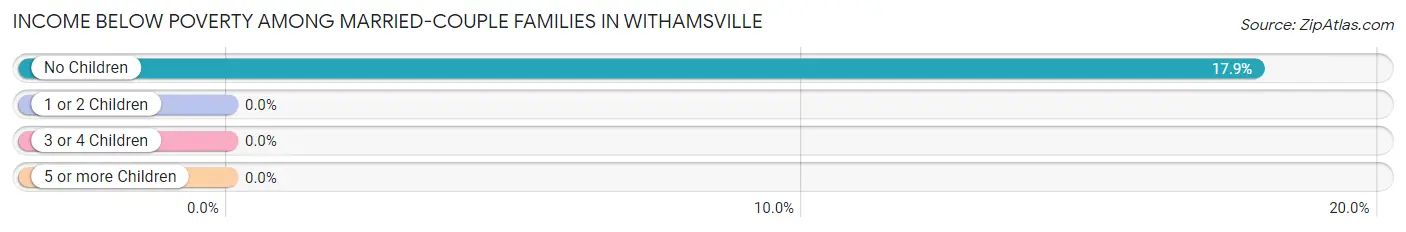
| Children | Above Poverty | Below Poverty |
| No Children | 915 (82.1%) | 199 (17.9%) |
| 1 or 2 Children | 221 (100.0%) | 0 (0.0%) |
| 3 or 4 Children | 68 (100.0%) | 0 (0.0%) |
| 5 or more Children | 0 (0.0%) | 0 (0.0%) |
| Total | 1,204 (85.8%) | 199 (14.2%) |
Income Below Poverty Among Single-Parent Households in Withamsville
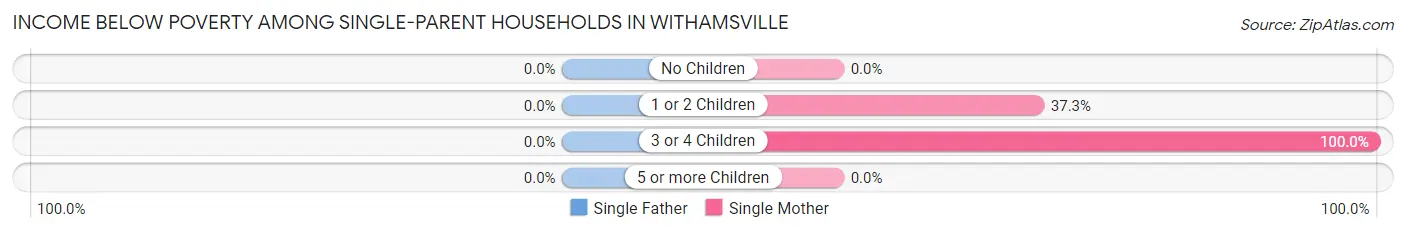
| Children | Single Father | Single Mother |
| No Children | 0 (0.0%) | 0 (0.0%) |
| 1 or 2 Children | 0 (0.0%) | 88 (37.3%) |
| 3 or 4 Children | 0 (0.0%) | 79 (100.0%) |
| 5 or more Children | 0 (0.0%) | 0 (0.0%) |
| Total | 0 (0.0%) | 167 (38.5%) |
Income Below Poverty Among Married-Couple vs Single-Parent Households in Withamsville
The poverty data for Withamsville shows that 199 of the married-couple family households (14.2%) and 167 of the single-parent households (26.9%) are living below the poverty level. Within the married-couple family households, those with no children have the highest poverty rate, with 199 households (17.9%) falling below the poverty line. Among the single-parent households, those with 3 or 4 children have the highest poverty rate, with 79 household (41.8%) living below poverty.
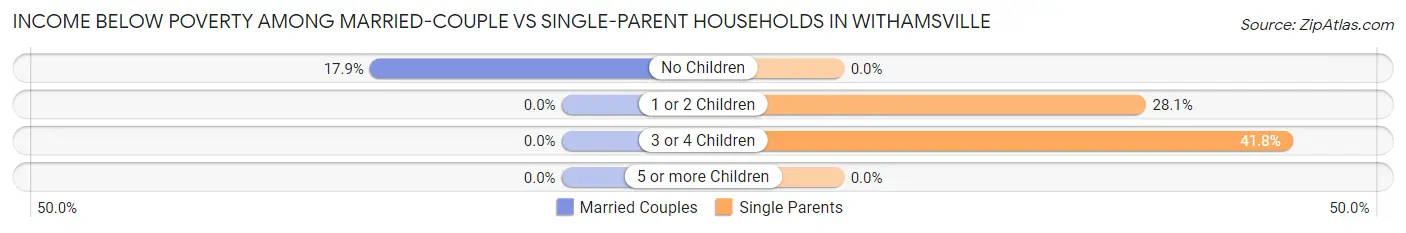
| Children | Married-Couple Families | Single-Parent Households |
| No Children | 199 (17.9%) | 0 (0.0%) |
| 1 or 2 Children | 0 (0.0%) | 88 (28.1%) |
| 3 or 4 Children | 0 (0.0%) | 79 (41.8%) |
| 5 or more Children | 0 (0.0%) | 0 (0.0%) |
| Total | 199 (14.2%) | 167 (26.9%) |
Race in Withamsville
The most populous races in Withamsville are White / Caucasian (6,718 | 86.1%), Two or more Races (683 | 8.7%), and Hispanic or Latino (240 | 3.1%).
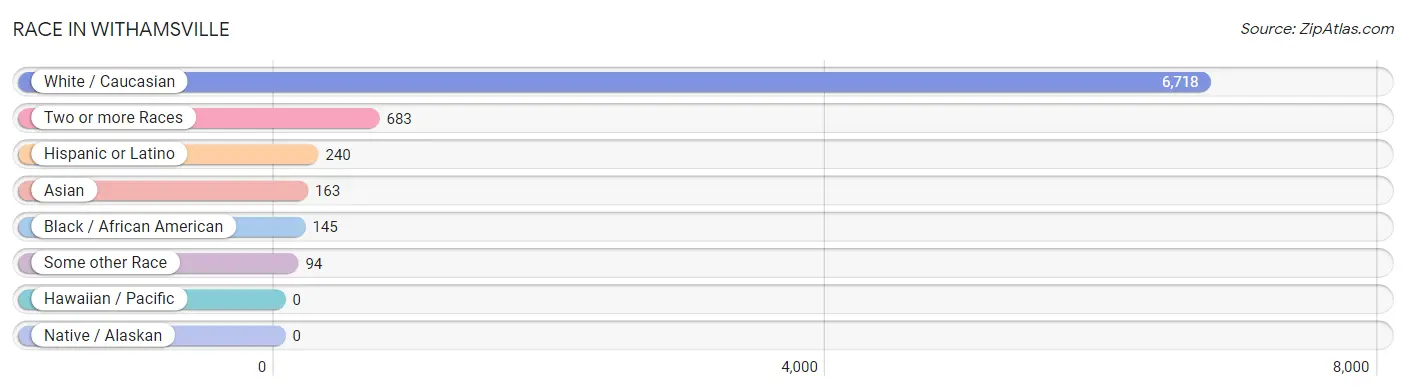
| Race | # Population | % Population |
| Asian | 163 | 2.1% |
| Black / African American | 145 | 1.9% |
| Hawaiian / Pacific | 0 | 0.0% |
| Hispanic or Latino | 240 | 3.1% |
| Native / Alaskan | 0 | 0.0% |
| White / Caucasian | 6,718 | 86.1% |
| Two or more Races | 683 | 8.7% |
| Some other Race | 94 | 1.2% |
| Total | 7,803 | 100.0% |
Ancestry in Withamsville
The most populous ancestries reported in Withamsville are German (2,036 | 26.1%), Irish (1,066 | 13.7%), English (682 | 8.7%), American (616 | 7.9%), and Scotch-Irish (235 | 3.0%), together accounting for 59.4% of all Withamsville residents.
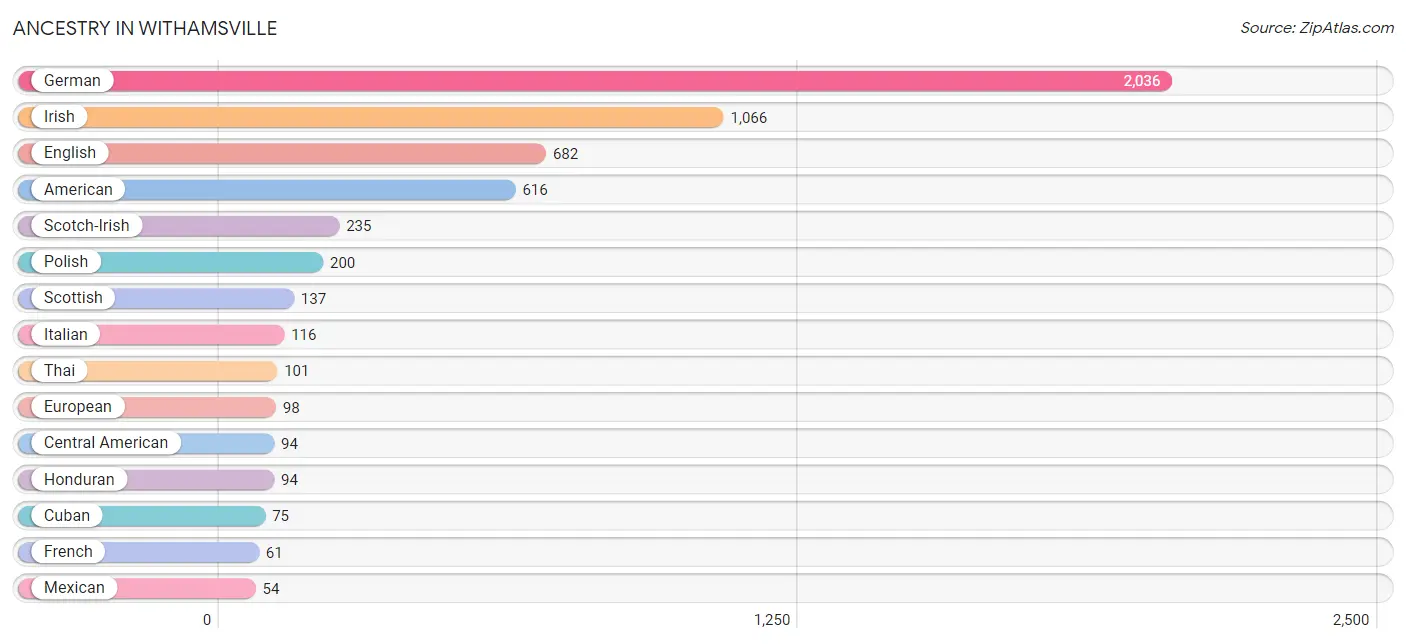
| Ancestry | # Population | % Population |
| American | 616 | 7.9% |
| Arab | 32 | 0.4% |
| Bhutanese | 17 | 0.2% |
| British | 13 | 0.2% |
| Burmese | 16 | 0.2% |
| Central American | 94 | 1.2% |
| Cherokee | 1 | 0.0% |
| Cuban | 75 | 1.0% |
| Czech | 28 | 0.4% |
| Danish | 16 | 0.2% |
| Dutch | 51 | 0.6% |
| English | 682 | 8.7% |
| European | 98 | 1.3% |
| French | 61 | 0.8% |
| French Canadian | 29 | 0.4% |
| German | 2,036 | 26.1% |
| Honduran | 94 | 1.2% |
| Hungarian | 46 | 0.6% |
| Inupiat | 1 | 0.0% |
| Irish | 1,066 | 13.7% |
| Italian | 116 | 1.5% |
| Korean | 27 | 0.4% |
| Lithuanian | 16 | 0.2% |
| Mexican | 54 | 0.7% |
| Northern European | 17 | 0.2% |
| Norwegian | 39 | 0.5% |
| Polish | 200 | 2.6% |
| Puerto Rican | 17 | 0.2% |
| Russian | 52 | 0.7% |
| Scotch-Irish | 235 | 3.0% |
| Scottish | 137 | 1.8% |
| Swedish | 7 | 0.1% |
| Swiss | 16 | 0.2% |
| Thai | 101 | 1.3% |
| Turkish | 12 | 0.2% |
| Welsh | 30 | 0.4% | View All 36 Rows |
Immigrants in Withamsville
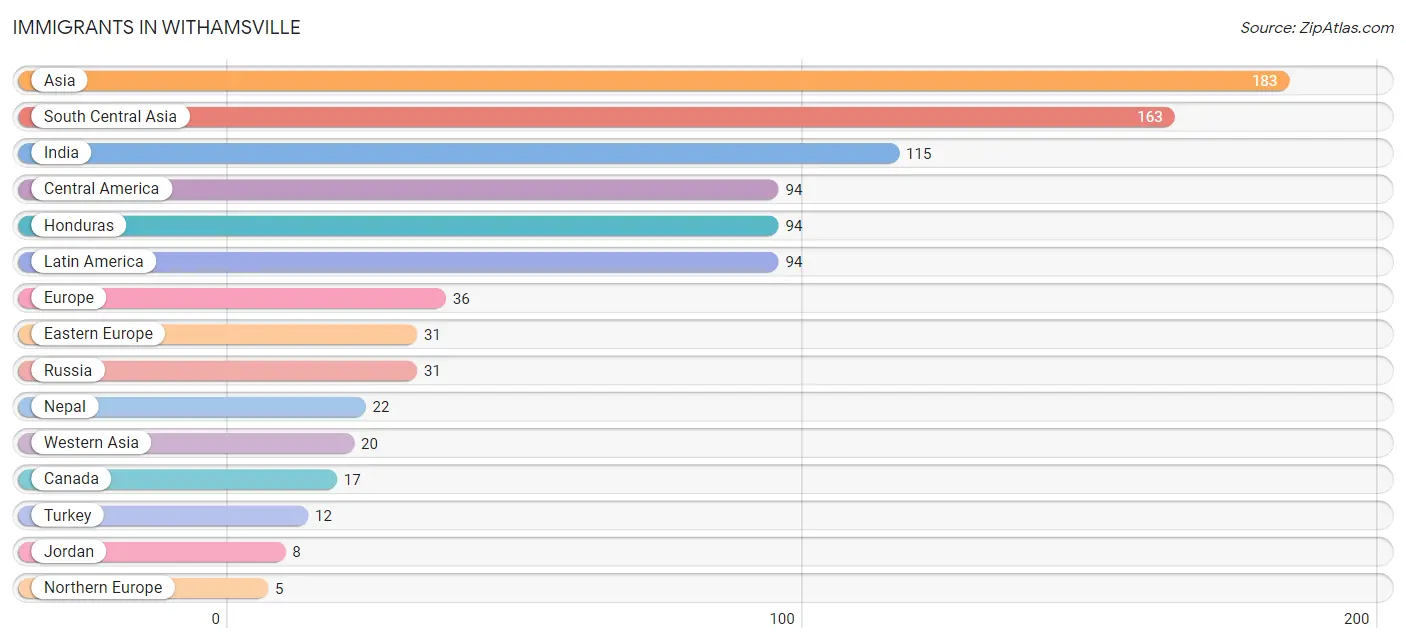
The most numerous immigrant groups reported in Withamsville came from Asia (183 | 2.4%), South Central Asia (163 | 2.1%), India (115 | 1.5%), Central America (94 | 1.2%), and Honduras (94 | 1.2%), together accounting for 8.3% of all Withamsville residents.
| Immigration Origin | # Population | % Population |
| Africa | 3 | 0.0% |
| Asia | 183 | 2.4% |
| Canada | 17 | 0.2% |
| Central America | 94 | 1.2% |
| Eastern Europe | 31 | 0.4% |
| Egypt | 3 | 0.0% |
| Europe | 36 | 0.5% |
| Honduras | 94 | 1.2% |
| India | 115 | 1.5% |
| Jordan | 8 | 0.1% |
| Latin America | 94 | 1.2% |
| Nepal | 22 | 0.3% |
| Northern Africa | 3 | 0.0% |
| Northern Europe | 5 | 0.1% |
| Russia | 31 | 0.4% |
| Scotland | 5 | 0.1% |
| South Central Asia | 163 | 2.1% |
| Turkey | 12 | 0.2% |
| Western Asia | 20 | 0.3% | View All 19 Rows |
Sex and Age in Withamsville
Sex and Age in Withamsville
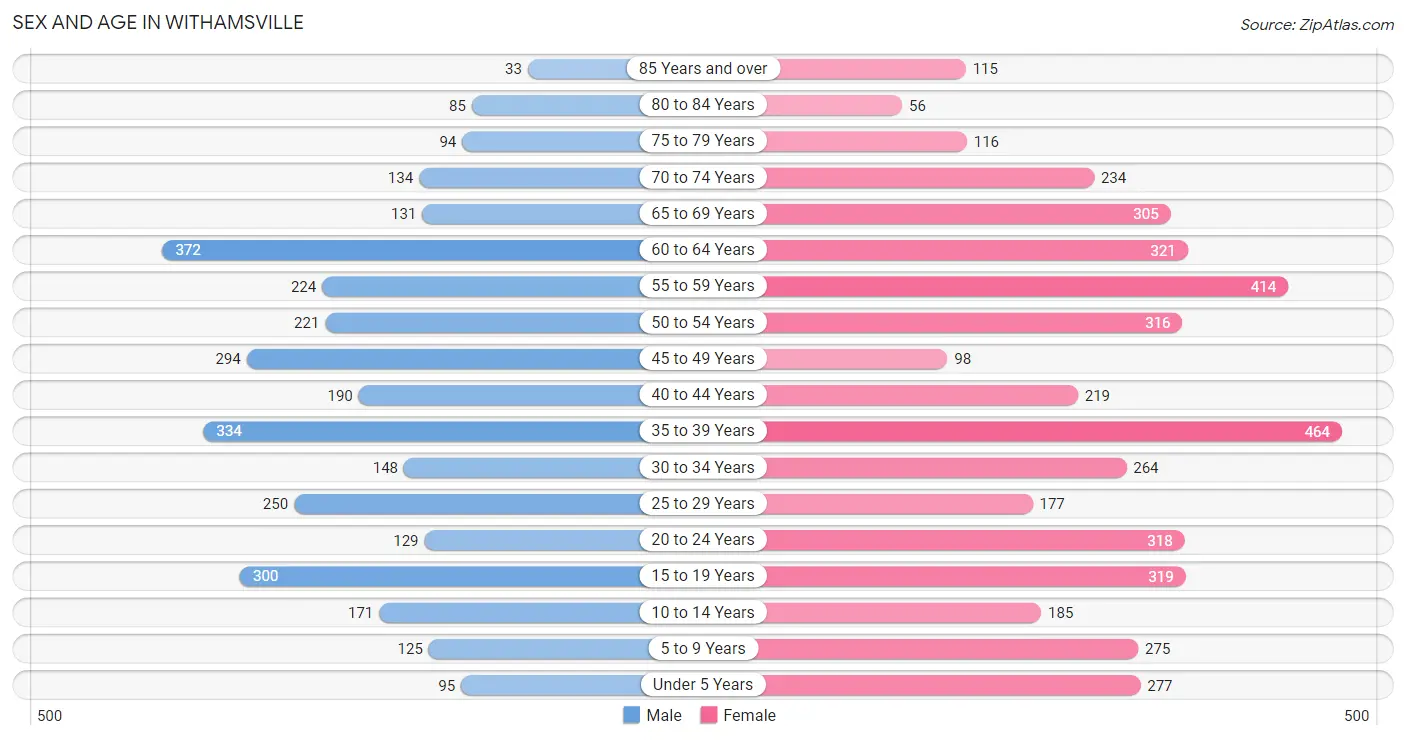
The most populous age groups in Withamsville are 60 to 64 Years (372 | 11.2%) for men and 35 to 39 Years (464 | 10.4%) for women.
| Age Bracket | Male | Female |
| Under 5 Years | 95 (2.9%) | 277 (6.2%) |
| 5 to 9 Years | 125 (3.7%) | 275 (6.1%) |
| 10 to 14 Years | 171 (5.1%) | 185 (4.1%) |
| 15 to 19 Years | 300 (9.0%) | 319 (7.1%) |
| 20 to 24 Years | 129 (3.9%) | 318 (7.1%) |
| 25 to 29 Years | 250 (7.5%) | 177 (4.0%) |
| 30 to 34 Years | 148 (4.4%) | 264 (5.9%) |
| 35 to 39 Years | 334 (10.0%) | 464 (10.4%) |
| 40 to 44 Years | 190 (5.7%) | 219 (4.9%) |
| 45 to 49 Years | 294 (8.8%) | 98 (2.2%) |
| 50 to 54 Years | 221 (6.6%) | 316 (7.1%) |
| 55 to 59 Years | 224 (6.7%) | 414 (9.3%) |
| 60 to 64 Years | 372 (11.2%) | 321 (7.2%) |
| 65 to 69 Years | 131 (3.9%) | 305 (6.8%) |
| 70 to 74 Years | 134 (4.0%) | 234 (5.2%) |
| 75 to 79 Years | 94 (2.8%) | 116 (2.6%) |
| 80 to 84 Years | 85 (2.5%) | 56 (1.3%) |
| 85 Years and over | 33 (1.0%) | 115 (2.6%) |
| Total | 3,330 (100.0%) | 4,473 (100.0%) |
Families and Households in Withamsville
Median Family Size in Withamsville
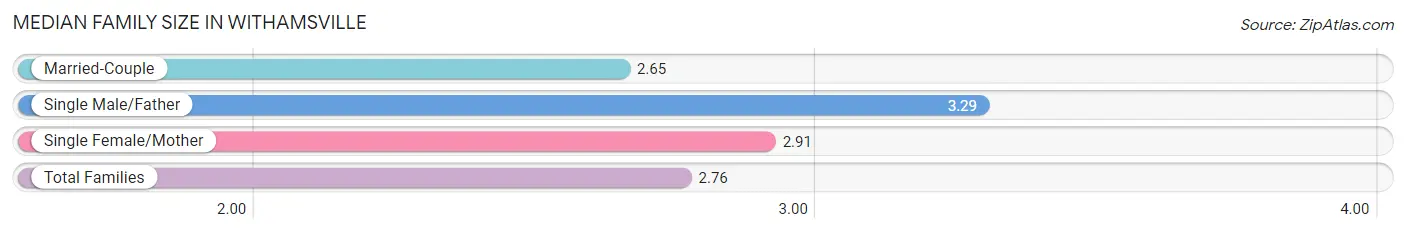
The median family size in Withamsville is 2.76 persons per family, with single male/father families (187 | 9.2%) accounting for the largest median family size of 3.29 persons per family. On the other hand, married-couple families (1,403 | 69.3%) represent the smallest median family size with 2.65 persons per family.
| Family Type | # Families | Family Size |
| Married-Couple | 1,403 (69.3%) | 2.65 |
| Single Male/Father | 187 (9.2%) | 3.29 |
| Single Female/Mother | 434 (21.4%) | 2.91 |
| Total Families | 2,024 (100.0%) | 2.76 |
Median Household Size in Withamsville
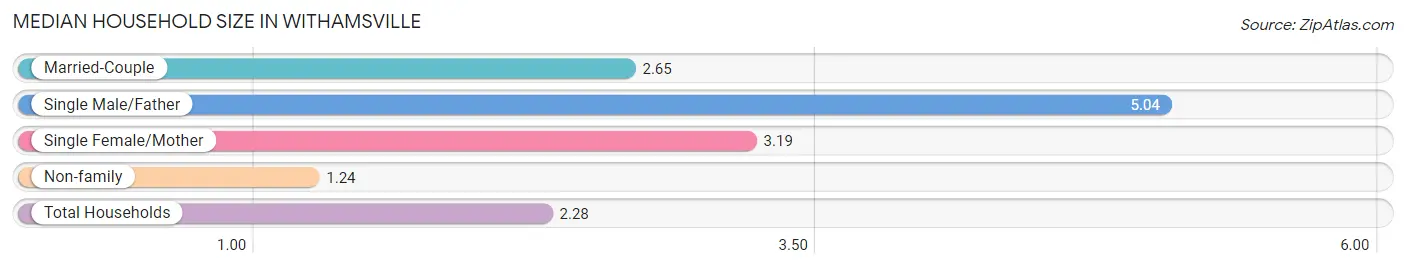
The median household size in Withamsville is 2.28 persons per household, with single male/father households (187 | 5.5%) accounting for the largest median household size of 5.04 persons per household. non-family households (1,380 | 40.5%) represent the smallest median household size with 1.24 persons per household.
| Household Type | # Households | Household Size |
| Married-Couple | 1,403 (41.2%) | 2.65 |
| Single Male/Father | 187 (5.5%) | 5.04 |
| Single Female/Mother | 434 (12.8%) | 3.19 |
| Non-family | 1,380 (40.5%) | 1.24 |
| Total Households | 3,404 (100.0%) | 2.28 |
Household Size by Marriage Status in Withamsville
Out of a total of 3,404 households in Withamsville, 2,024 (59.5%) are family households, while 1,380 (40.5%) are nonfamily households. The most numerous type of family households are 2-person households, comprising 1,087, and the most common type of nonfamily households are 1-person households, comprising 1,063.
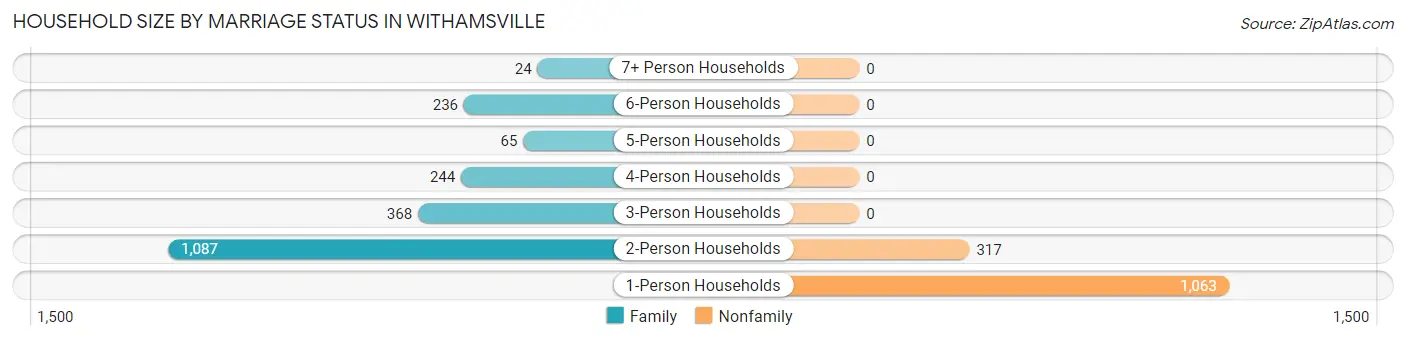
| Household Size | Family Households | Nonfamily Households |
| 1-Person Households | - | 1,063 (31.2%) |
| 2-Person Households | 1,087 (31.9%) | 317 (9.3%) |
| 3-Person Households | 368 (10.8%) | 0 (0.0%) |
| 4-Person Households | 244 (7.2%) | 0 (0.0%) |
| 5-Person Households | 65 (1.9%) | 0 (0.0%) |
| 6-Person Households | 236 (6.9%) | 0 (0.0%) |
| 7+ Person Households | 24 (0.7%) | 0 (0.0%) |
| Total | 2,024 (59.5%) | 1,380 (40.5%) |
Female Fertility in Withamsville
Fertility by Age in Withamsville
Average fertility rate in Withamsville is 92.0 births per 1,000 women. Women in the age bracket of 20 to 34 years have the highest fertility rate with 233.0 births per 1,000 women. Women in the age bracket of 20 to 34 years acount for 100.0% of all women with births.
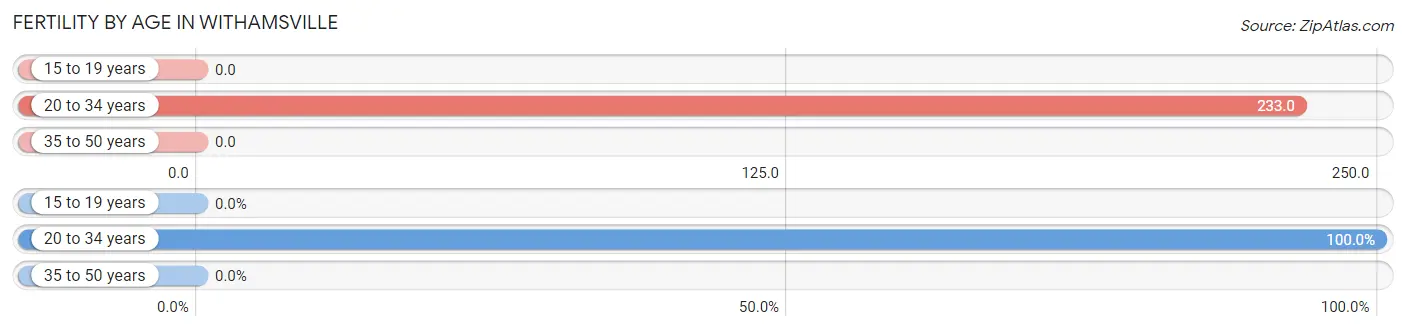
| Age Bracket | Women with Births | Births / 1,000 Women |
| 15 to 19 years | 0 (0.0%) | 0.0 |
| 20 to 34 years | 177 (100.0%) | 233.0 |
| 35 to 50 years | 0 (0.0%) | 0.0 |
| Total | 177 (100.0%) | 92.0 |
Fertility by Age by Marriage Status in Withamsville
3.4% of women with births (177) in Withamsville are married. The highest percentage of unmarried women with births falls into 20 to 34 years age bracket with 96.6% of them unmarried at the time of birth, while the lowest percentage of unmarried women with births belong to 20 to 34 years age bracket with 96.6% of them unmarried.
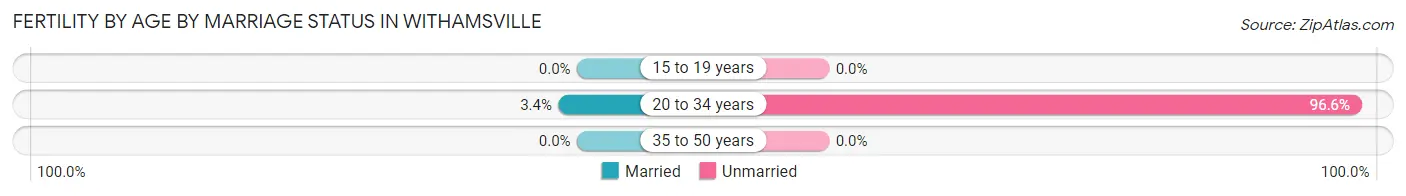
| Age Bracket | Married | Unmarried |
| 15 to 19 years | 0 (0.0%) | 0 (0.0%) |
| 20 to 34 years | 6 (3.4%) | 171 (96.6%) |
| 35 to 50 years | 0 (0.0%) | 0 (0.0%) |
| Total | 6 (3.4%) | 171 (96.6%) |
Fertility by Education in Withamsville
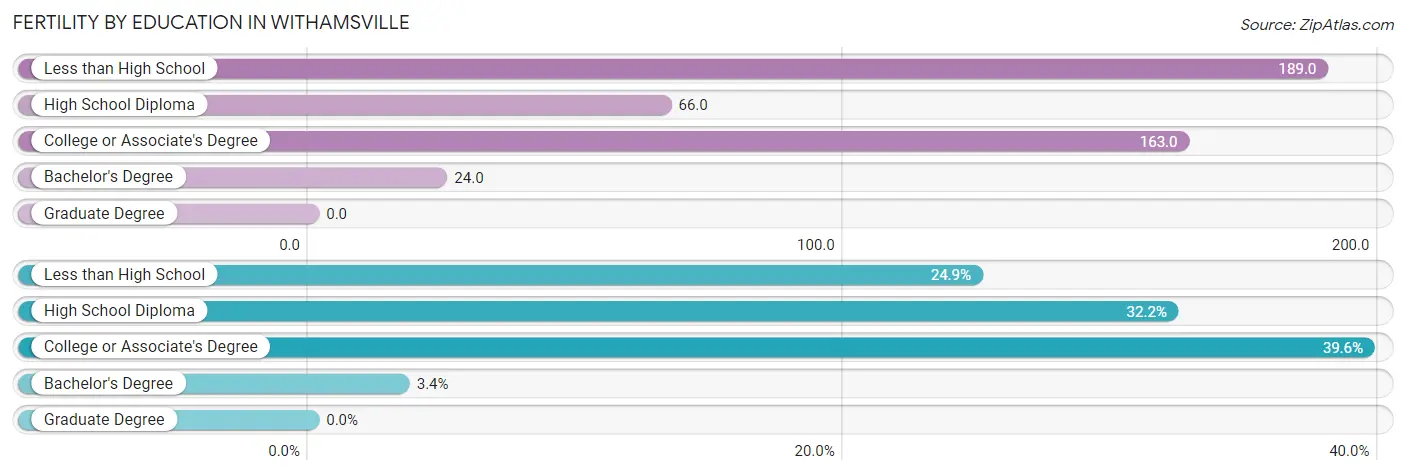
| Educational Attainment | Women with Births | Births / 1,000 Women |
| Less than High School | 44 (24.9%) | 189.0 |
| High School Diploma | 57 (32.2%) | 66.0 |
| College or Associate's Degree | 70 (39.6%) | 163.0 |
| Bachelor's Degree | 6 (3.4%) | 24.0 |
| Graduate Degree | 0 (0.0%) | 0.0 |
| Total | 177 (100.0%) | 92.0 |
Fertility by Education by Marriage Status in Withamsville
96.6% of women with births in Withamsville are unmarried. Women with the educational attainment of bachelor's degree are most likely to be married with 100.0% of them married at childbirth, while women with the educational attainment of less than high school are least likely to be married with 100.0% of them unmarried at childbirth.
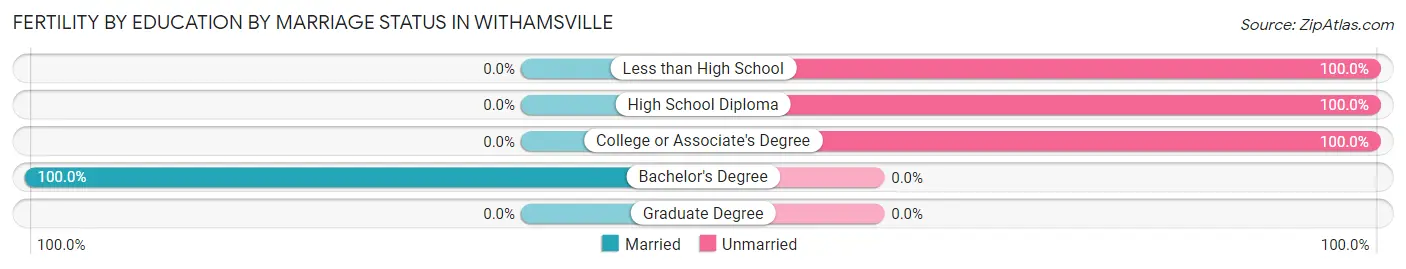
| Educational Attainment | Married | Unmarried |
| Less than High School | 0 (0.0%) | 44 (100.0%) |
| High School Diploma | 0 (0.0%) | 57 (100.0%) |
| College or Associate's Degree | 0 (0.0%) | 70 (100.0%) |
| Bachelor's Degree | 6 (100.0%) | 0 (0.0%) |
| Graduate Degree | 0 (0.0%) | 0 (0.0%) |
| Total | 6 (3.4%) | 171 (96.6%) |
Employment Characteristics in Withamsville
Employment by Class of Employer in Withamsville
Among the 3,919 employed individuals in Withamsville, private company employees (3,096 | 79.0%), not-for-profit organizations (393 | 10.0%), and local government employees (118 | 3.0%) make up the most common classes of employment.
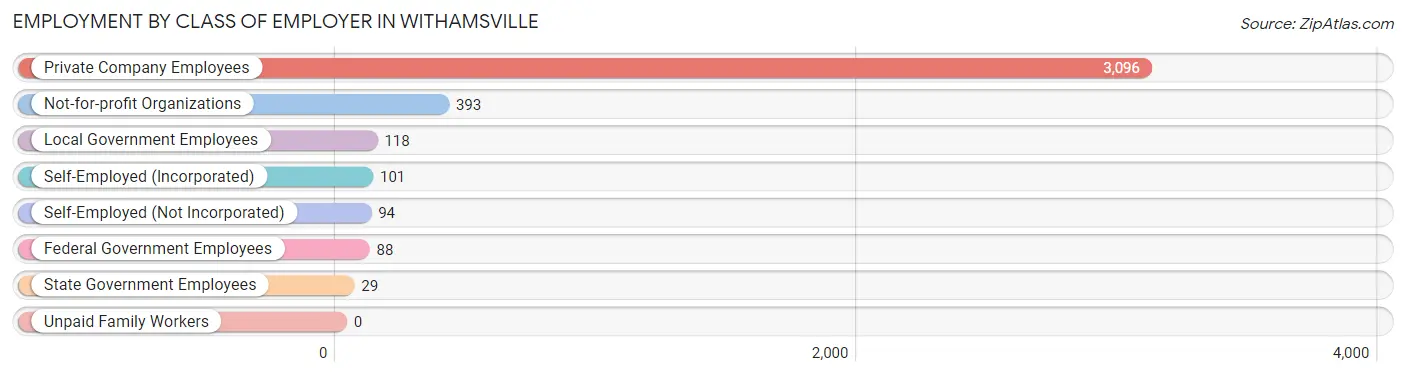
| Employer Class | # Employees | % Employees |
| Private Company Employees | 3,096 | 79.0% |
| Self-Employed (Incorporated) | 101 | 2.6% |
| Self-Employed (Not Incorporated) | 94 | 2.4% |
| Not-for-profit Organizations | 393 | 10.0% |
| Local Government Employees | 118 | 3.0% |
| State Government Employees | 29 | 0.7% |
| Federal Government Employees | 88 | 2.2% |
| Unpaid Family Workers | 0 | 0.0% |
| Total | 3,919 | 100.0% |
Employment Status by Age in Withamsville
According to the labor force statistics for Withamsville, out of the total population over 16 years of age (6,563), 62.6% or 4,108 individuals are in the labor force, with 2.4% or 99 of them unemployed. The age group with the highest labor force participation rate is 20 to 24 years, with 96.0% or 429 individuals in the labor force. Within the labor force, the 20 to 24 years age range has the highest percentage of unemployed individuals, with 12.1% or 52 of them being unemployed.
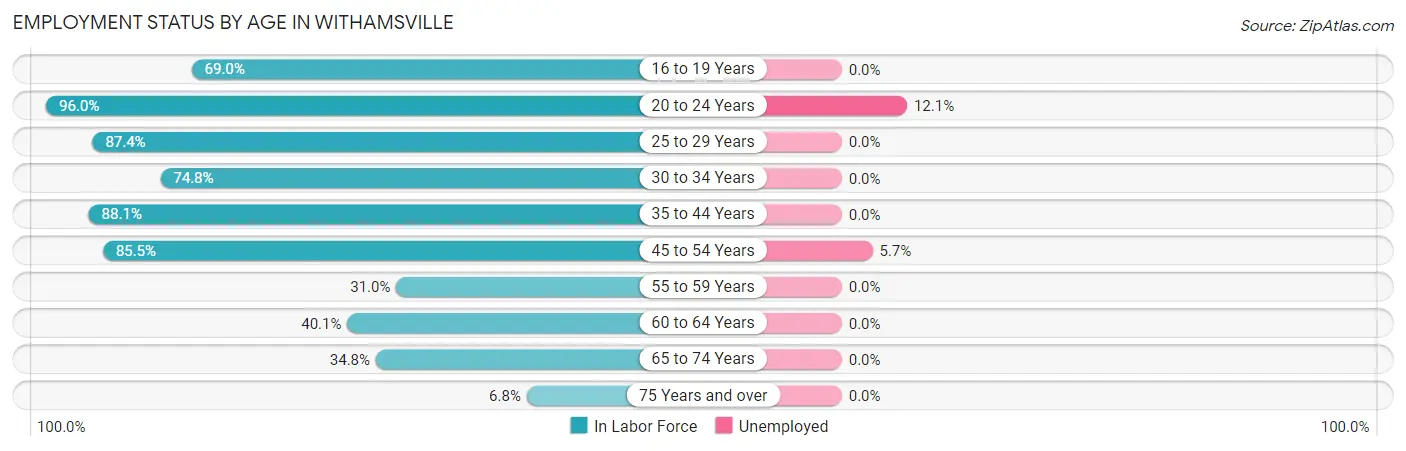
| Age Bracket | In Labor Force | Unemployed |
| 16 to 19 Years | 350 (69.0%) | 0 (0.0%) |
| 20 to 24 Years | 429 (96.0%) | 52 (12.1%) |
| 25 to 29 Years | 373 (87.4%) | 0 (0.0%) |
| 30 to 34 Years | 308 (74.8%) | 0 (0.0%) |
| 35 to 44 Years | 1,063 (88.1%) | 0 (0.0%) |
| 45 to 54 Years | 794 (85.5%) | 45 (5.7%) |
| 55 to 59 Years | 198 (31.0%) | 0 (0.0%) |
| 60 to 64 Years | 278 (40.1%) | 0 (0.0%) |
| 65 to 74 Years | 280 (34.8%) | 0 (0.0%) |
| 75 Years and over | 34 (6.8%) | 0 (0.0%) |
| Total | 4,108 (62.6%) | 99 (2.4%) |
Employment Status by Educational Attainment in Withamsville
According to labor force statistics for Withamsville, 70.0% of individuals (3,014) out of the total population between 25 and 64 years of age (4,306) are in the labor force, with 1.5% or 45 of them being unemployed. The group with the highest labor force participation rate are those with the educational attainment of bachelor's degree or higher, with 91.6% or 912 individuals in the labor force. Within the labor force, individuals with college / associate degree education have the highest percentage of unemployment, with 4.5% or 44 of them being unemployed.
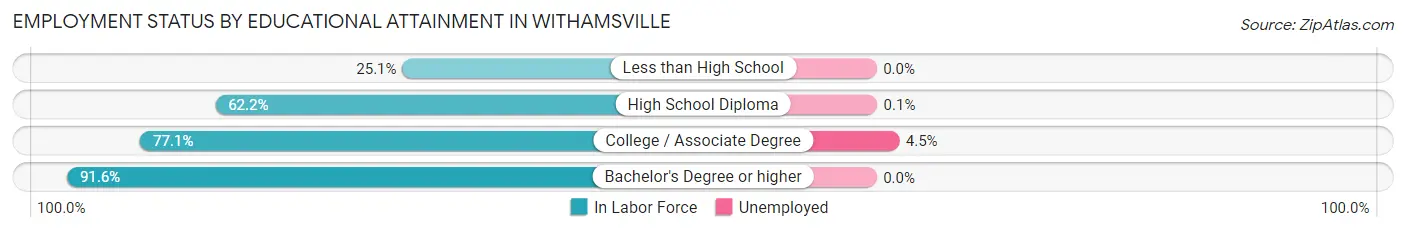
| Educational Attainment | In Labor Force | Unemployed |
| Less than High School | 98 (25.1%) | 0 (0.0%) |
| High School Diploma | 1,034 (62.2%) | 2 (0.1%) |
| College / Associate Degree | 968 (77.1%) | 57 (4.5%) |
| Bachelor's Degree or higher | 912 (91.6%) | 0 (0.0%) |
| Total | 3,014 (70.0%) | 65 (1.5%) |
Employment Occupations by Sex in Withamsville
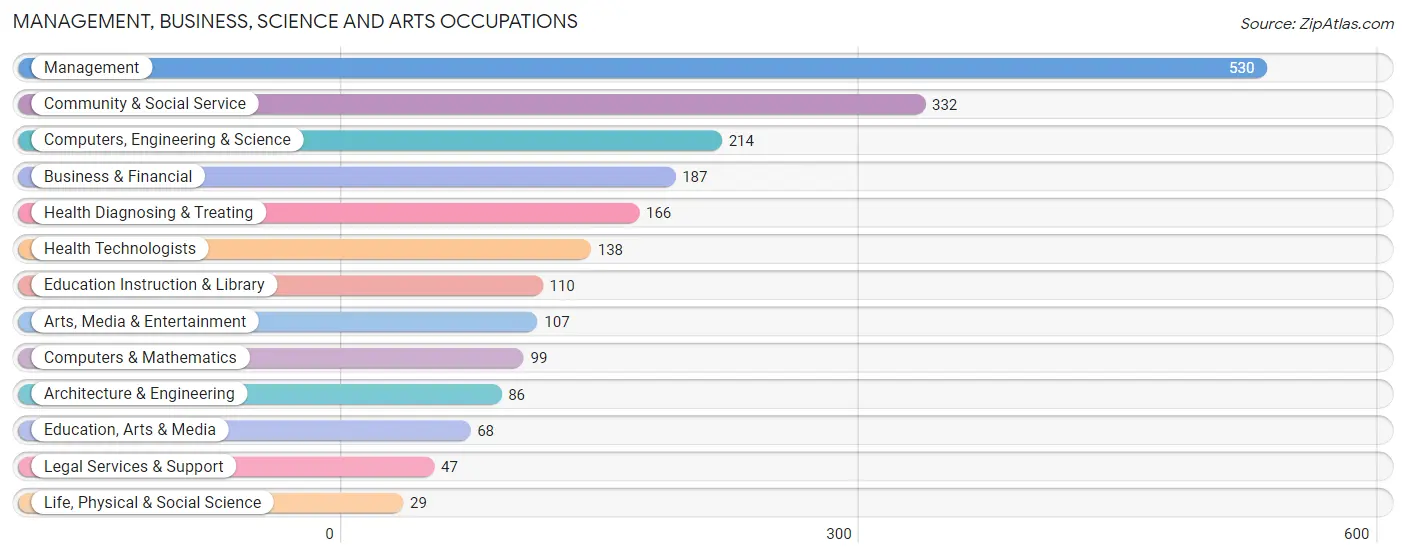
Management, Business, Science and Arts Occupations
The most common Management, Business, Science and Arts occupations in Withamsville are Management (530 | 13.2%), Community & Social Service (332 | 8.3%), Computers, Engineering & Science (214 | 5.3%), Business & Financial (187 | 4.7%), and Health Diagnosing & Treating (166 | 4.1%).
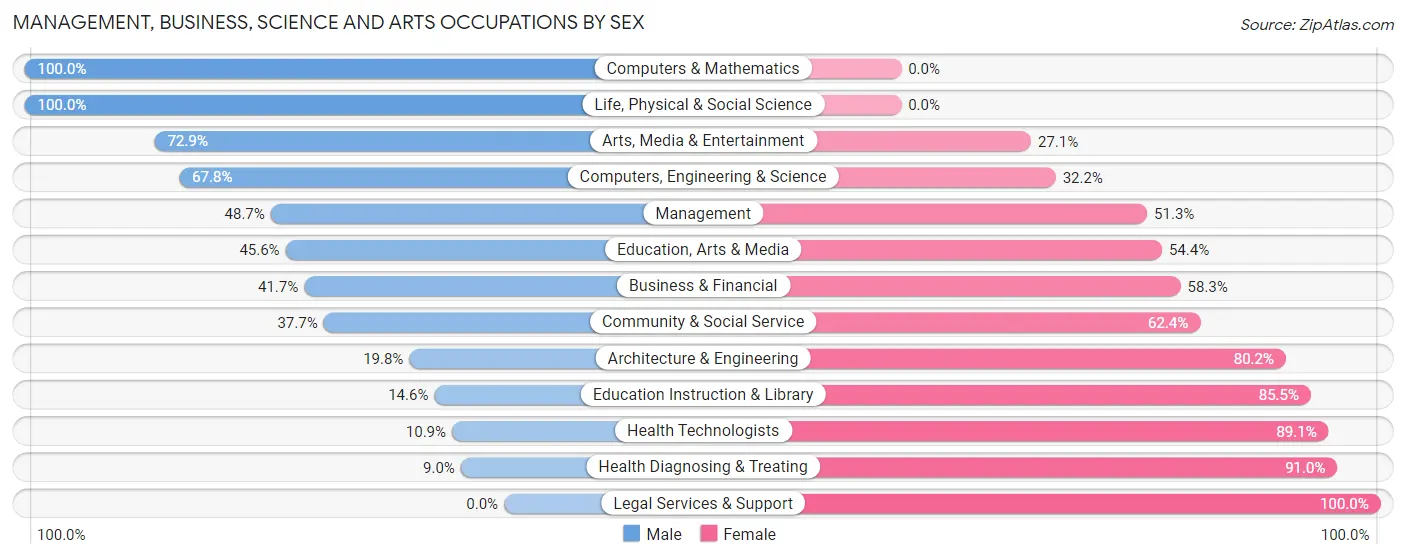
Management, Business, Science and Arts Occupations by Sex
Within the Management, Business, Science and Arts occupations in Withamsville, the most male-oriented occupations are Computers & Mathematics (100.0%), Life, Physical & Social Science (100.0%), and Arts, Media & Entertainment (72.9%), while the most female-oriented occupations are Legal Services & Support (100.0%), Health Diagnosing & Treating (91.0%), and Health Technologists (89.1%).
| Occupation | Male | Female |
| Management | 258 (48.7%) | 272 (51.3%) |
| Business & Financial | 78 (41.7%) | 109 (58.3%) |
| Computers, Engineering & Science | 145 (67.8%) | 69 (32.2%) |
| Computers & Mathematics | 99 (100.0%) | 0 (0.0%) |
| Architecture & Engineering | 17 (19.8%) | 69 (80.2%) |
| Life, Physical & Social Science | 29 (100.0%) | 0 (0.0%) |
| Community & Social Service | 125 (37.7%) | 207 (62.4%) |
| Education, Arts & Media | 31 (45.6%) | 37 (54.4%) |
| Legal Services & Support | 0 (0.0%) | 47 (100.0%) |
| Education Instruction & Library | 16 (14.5%) | 94 (85.5%) |
| Arts, Media & Entertainment | 78 (72.9%) | 29 (27.1%) |
| Health Diagnosing & Treating | 15 (9.0%) | 151 (91.0%) |
| Health Technologists | 15 (10.9%) | 123 (89.1%) |
| Total (Category) | 621 (43.5%) | 808 (56.5%) |
| Total (Overall) | 1,979 (49.3%) | 2,031 (50.6%) |
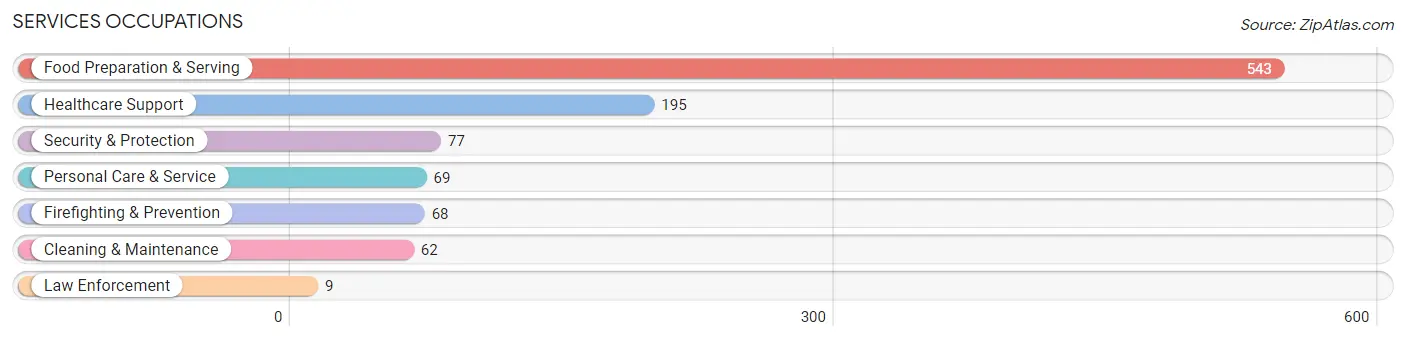
Services Occupations
The most common Services occupations in Withamsville are Food Preparation & Serving (543 | 13.5%), Healthcare Support (195 | 4.9%), Security & Protection (77 | 1.9%), Personal Care & Service (69 | 1.7%), and Firefighting & Prevention (68 | 1.7%).
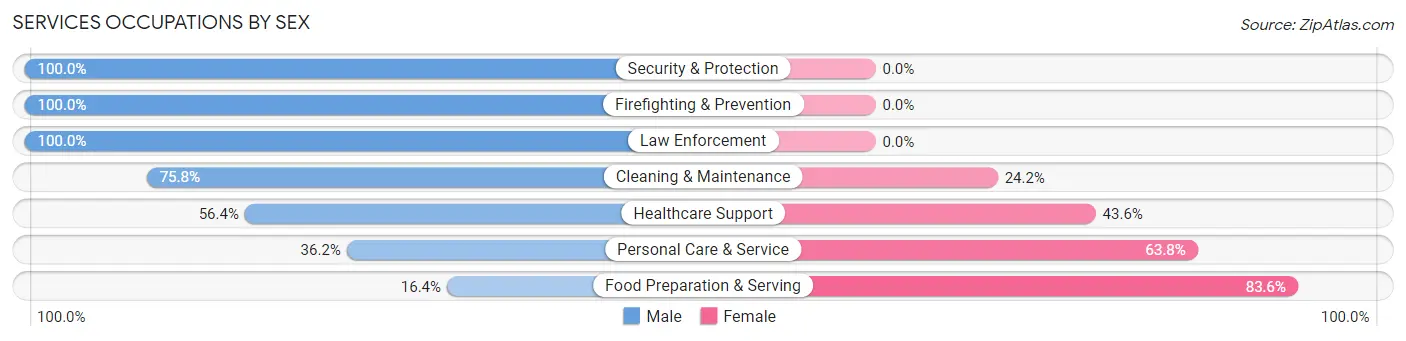
Services Occupations by Sex
Within the Services occupations in Withamsville, the most male-oriented occupations are Security & Protection (100.0%), Firefighting & Prevention (100.0%), and Law Enforcement (100.0%), while the most female-oriented occupations are Food Preparation & Serving (83.6%), Personal Care & Service (63.8%), and Healthcare Support (43.6%).
| Occupation | Male | Female |
| Healthcare Support | 110 (56.4%) | 85 (43.6%) |
| Security & Protection | 77 (100.0%) | 0 (0.0%) |
| Firefighting & Prevention | 68 (100.0%) | 0 (0.0%) |
| Law Enforcement | 9 (100.0%) | 0 (0.0%) |
| Food Preparation & Serving | 89 (16.4%) | 454 (83.6%) |
| Cleaning & Maintenance | 47 (75.8%) | 15 (24.2%) |
| Personal Care & Service | 25 (36.2%) | 44 (63.8%) |
| Total (Category) | 348 (36.8%) | 598 (63.2%) |
| Total (Overall) | 1,979 (49.3%) | 2,031 (50.6%) |
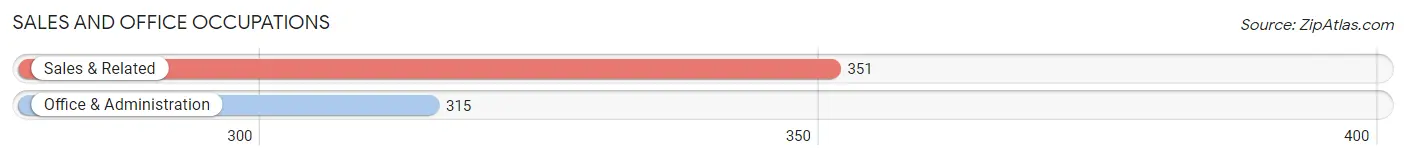
Sales and Office Occupations
The most common Sales and Office occupations in Withamsville are Sales & Related (351 | 8.7%), and Office & Administration (315 | 7.9%).
Sales and Office Occupations by Sex
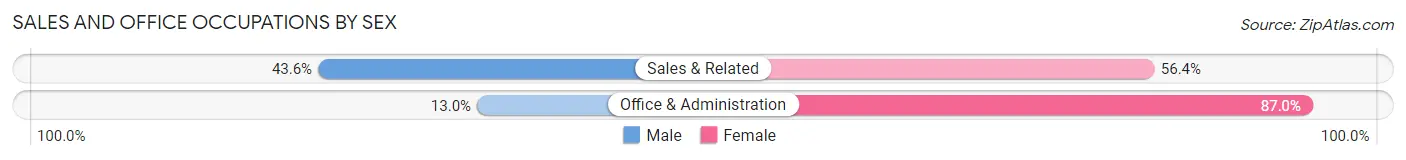
| Occupation | Male | Female |
| Sales & Related | 153 (43.6%) | 198 (56.4%) |
| Office & Administration | 41 (13.0%) | 274 (87.0%) |
| Total (Category) | 194 (29.1%) | 472 (70.9%) |
| Total (Overall) | 1,979 (49.3%) | 2,031 (50.6%) |
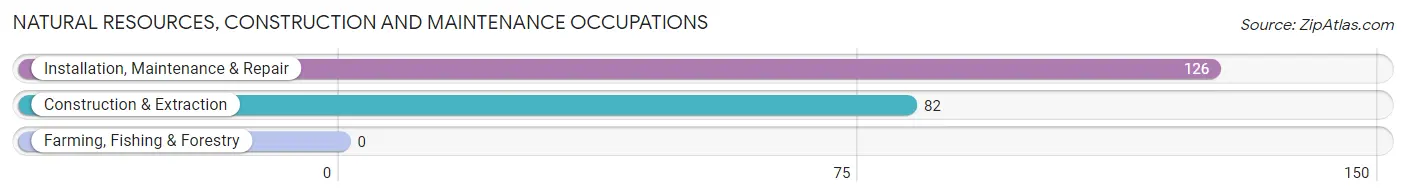
Natural Resources, Construction and Maintenance Occupations
The most common Natural Resources, Construction and Maintenance occupations in Withamsville are Installation, Maintenance & Repair (126 | 3.1%), and Construction & Extraction (82 | 2.0%).
Natural Resources, Construction and Maintenance Occupations by Sex
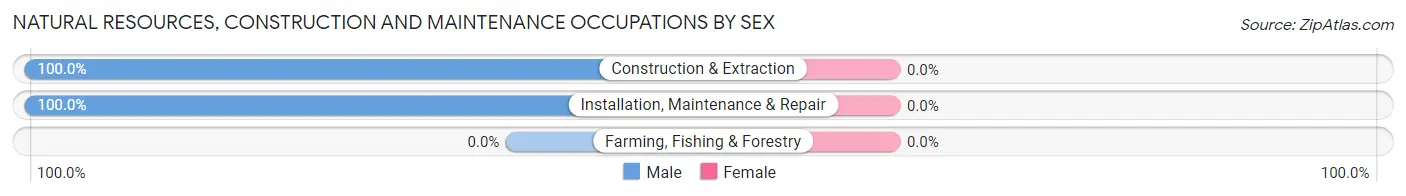
| Occupation | Male | Female |
| Farming, Fishing & Forestry | 0 (0.0%) | 0 (0.0%) |
| Construction & Extraction | 82 (100.0%) | 0 (0.0%) |
| Installation, Maintenance & Repair | 126 (100.0%) | 0 (0.0%) |
| Total (Category) | 208 (100.0%) | 0 (0.0%) |
| Total (Overall) | 1,979 (49.3%) | 2,031 (50.6%) |
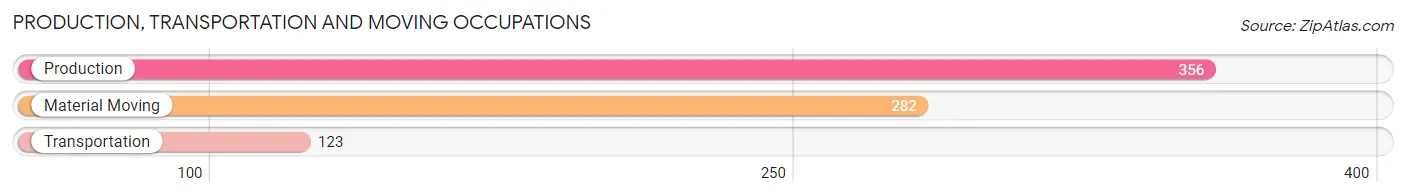
Production, Transportation and Moving Occupations
The most common Production, Transportation and Moving occupations in Withamsville are Production (356 | 8.9%), Material Moving (282 | 7.0%), and Transportation (123 | 3.1%).
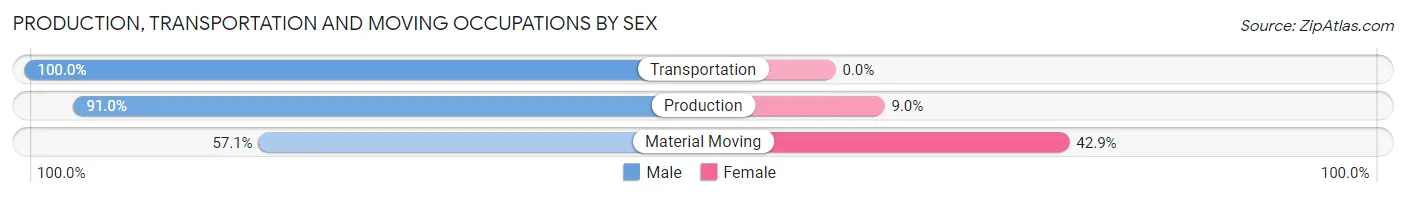
Production, Transportation and Moving Occupations by Sex
| Occupation | Male | Female |
| Production | 324 (91.0%) | 32 (9.0%) |
| Transportation | 123 (100.0%) | 0 (0.0%) |
| Material Moving | 161 (57.1%) | 121 (42.9%) |
| Total (Category) | 608 (79.9%) | 153 (20.1%) |
| Total (Overall) | 1,979 (49.3%) | 2,031 (50.6%) |
Employment Industries by Sex in Withamsville
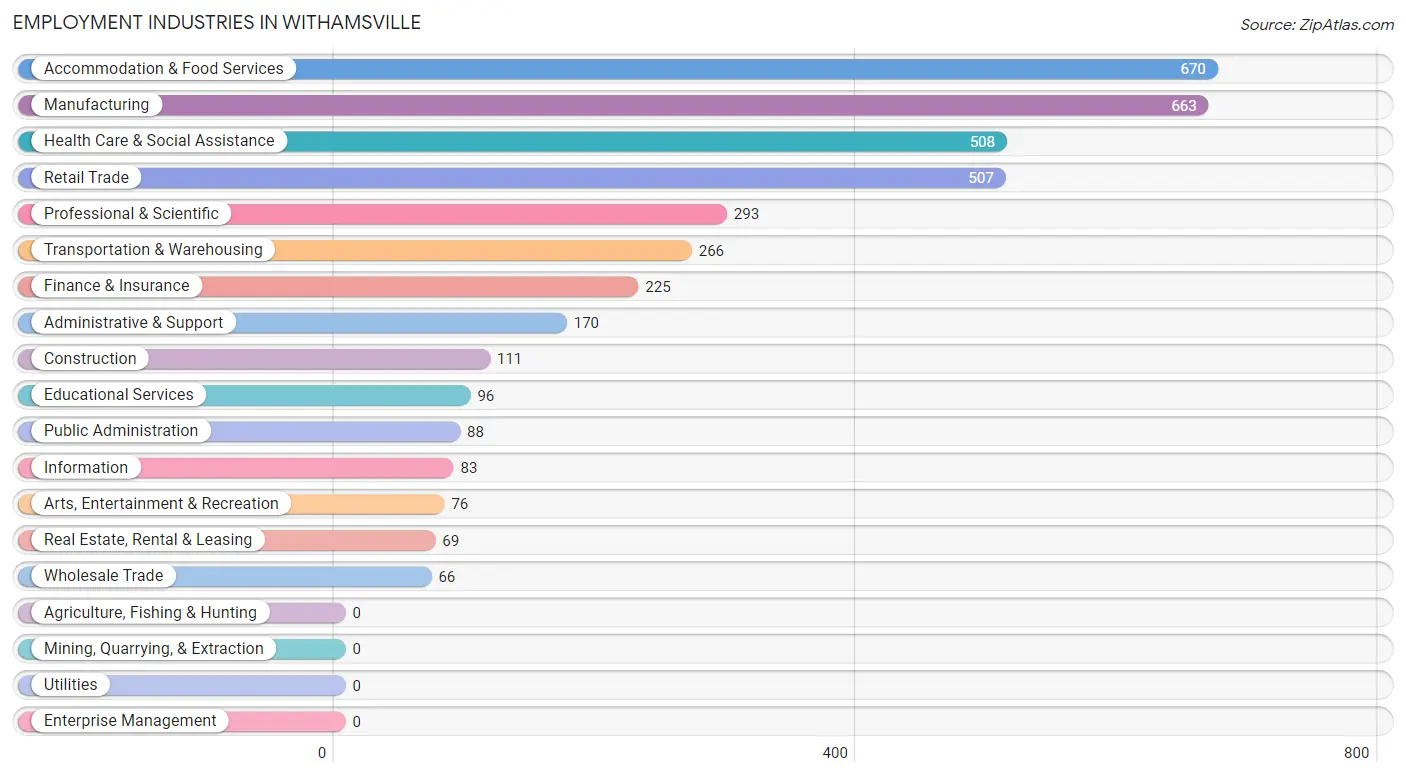
Employment Industries in Withamsville
The major employment industries in Withamsville include Accommodation & Food Services (670 | 16.7%), Manufacturing (663 | 16.5%), Health Care & Social Assistance (508 | 12.7%), Retail Trade (507 | 12.6%), and Professional & Scientific (293 | 7.3%).
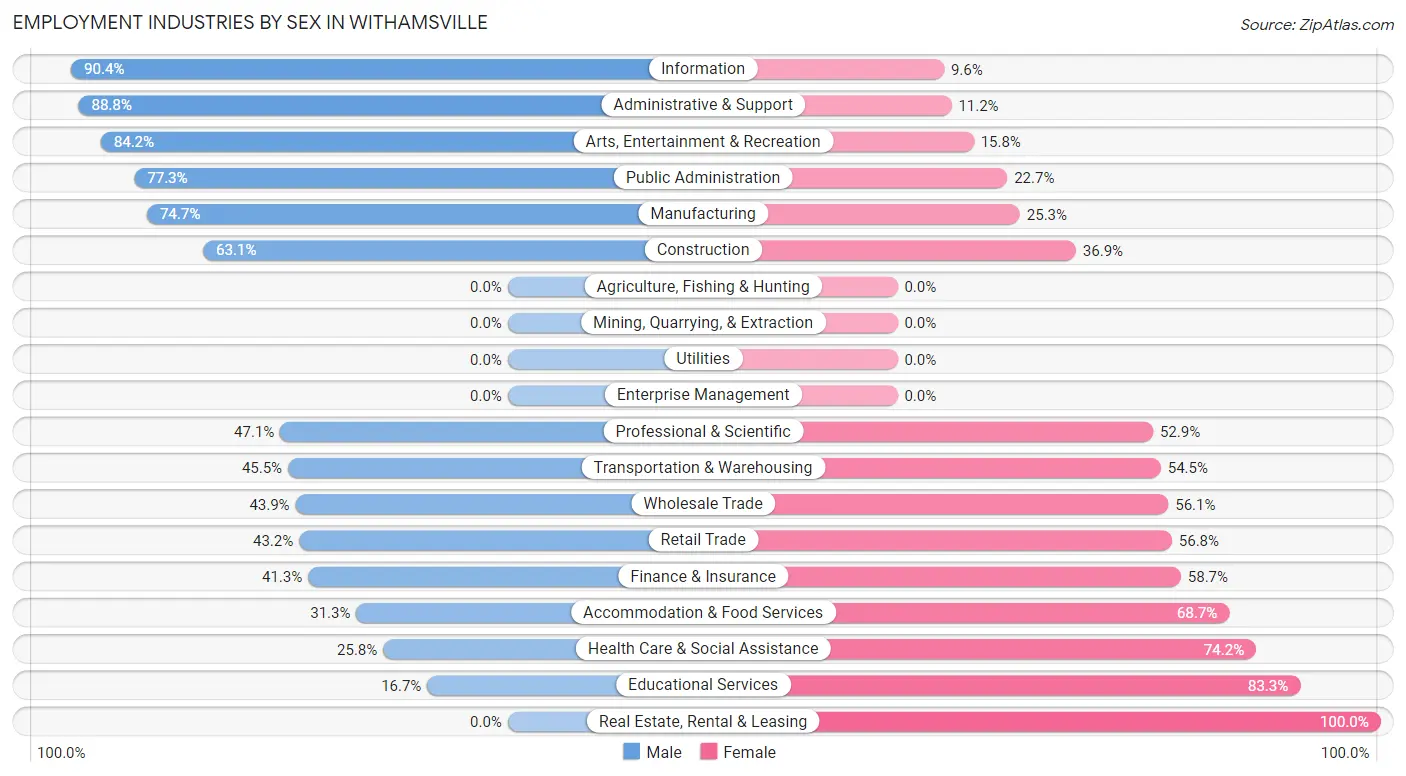
Employment Industries by Sex in Withamsville
The Withamsville industries that see more men than women are Information (90.4%), Administrative & Support (88.8%), and Arts, Entertainment & Recreation (84.2%), whereas the industries that tend to have a higher number of women are Real Estate, Rental & Leasing (100.0%), Educational Services (83.3%), and Health Care & Social Assistance (74.2%).
| Industry | Male | Female |
| Agriculture, Fishing & Hunting | 0 (0.0%) | 0 (0.0%) |
| Mining, Quarrying, & Extraction | 0 (0.0%) | 0 (0.0%) |
| Construction | 70 (63.1%) | 41 (36.9%) |
| Manufacturing | 495 (74.7%) | 168 (25.3%) |
| Wholesale Trade | 29 (43.9%) | 37 (56.1%) |
| Retail Trade | 219 (43.2%) | 288 (56.8%) |
| Transportation & Warehousing | 121 (45.5%) | 145 (54.5%) |
| Utilities | 0 (0.0%) | 0 (0.0%) |
| Information | 75 (90.4%) | 8 (9.6%) |
| Finance & Insurance | 93 (41.3%) | 132 (58.7%) |
| Real Estate, Rental & Leasing | 0 (0.0%) | 69 (100.0%) |
| Professional & Scientific | 138 (47.1%) | 155 (52.9%) |
| Enterprise Management | 0 (0.0%) | 0 (0.0%) |
| Administrative & Support | 151 (88.8%) | 19 (11.2%) |
| Educational Services | 16 (16.7%) | 80 (83.3%) |
| Health Care & Social Assistance | 131 (25.8%) | 377 (74.2%) |
| Arts, Entertainment & Recreation | 64 (84.2%) | 12 (15.8%) |
| Accommodation & Food Services | 210 (31.3%) | 460 (68.7%) |
| Public Administration | 68 (77.3%) | 20 (22.7%) |
| Total | 1,979 (49.3%) | 2,031 (50.6%) |
Education in Withamsville
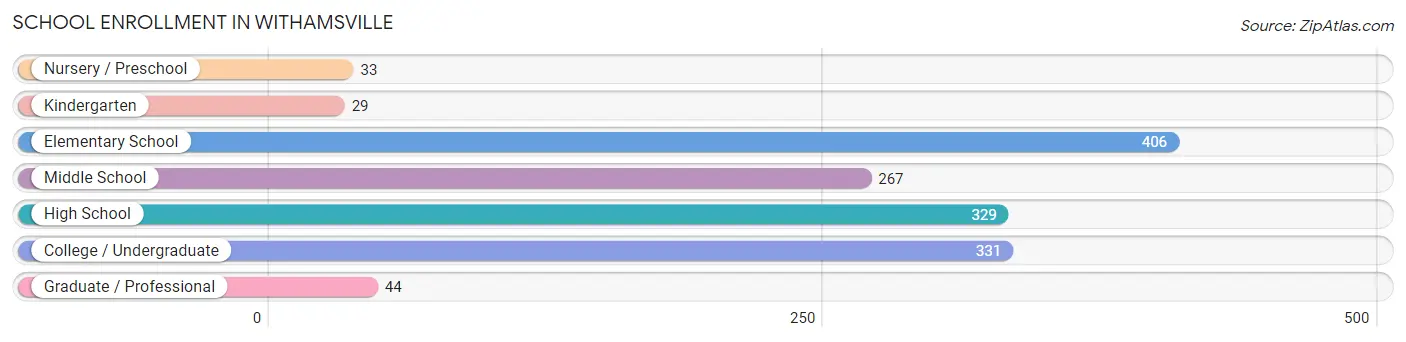
School Enrollment in Withamsville
The most common levels of schooling among the 1,439 students in Withamsville are elementary school (406 | 28.2%), college / undergraduate (331 | 23.0%), and high school (329 | 22.9%).
| School Level | # Students | % Students |
| Nursery / Preschool | 33 | 2.3% |
| Kindergarten | 29 | 2.0% |
| Elementary School | 406 | 28.2% |
| Middle School | 267 | 18.5% |
| High School | 329 | 22.9% |
| College / Undergraduate | 331 | 23.0% |
| Graduate / Professional | 44 | 3.1% |
| Total | 1,439 | 100.0% |
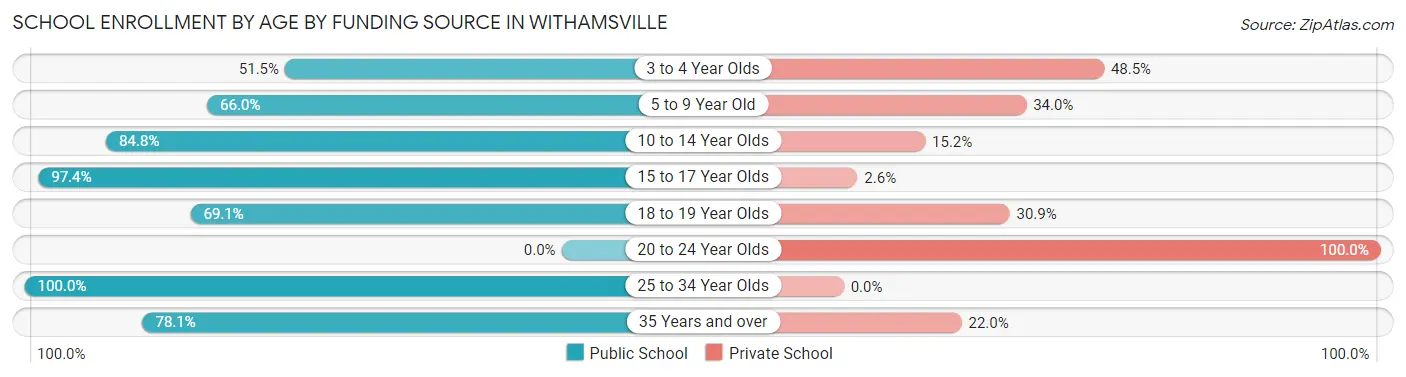
School Enrollment by Age by Funding Source in Withamsville
Out of a total of 1,439 students who are enrolled in schools in Withamsville, 374 (26.0%) attend a private institution, while the remaining 1,065 (74.0%) are enrolled in public schools. The age group of 20 to 24 year olds has the highest likelihood of being enrolled in private schools, with 52 (100.0% in the age bracket) enrolled. Conversely, the age group of 25 to 34 year olds has the lowest likelihood of being enrolled in a private school, with 20 (100.0% in the age bracket) attending a public institution.
| Age Bracket | Public School | Private School |
| 3 to 4 Year Olds | 17 (51.5%) | 16 (48.5%) |
| 5 to 9 Year Old | 264 (66.0%) | 136 (34.0%) |
| 10 to 14 Year Olds | 302 (84.8%) | 54 (15.2%) |
| 15 to 17 Year Olds | 190 (97.4%) | 5 (2.6%) |
| 18 to 19 Year Olds | 208 (69.1%) | 93 (30.9%) |
| 20 to 24 Year Olds | 0 (0.0%) | 52 (100.0%) |
| 25 to 34 Year Olds | 20 (100.0%) | 0 (0.0%) |
| 35 Years and over | 64 (78.0%) | 18 (22.0%) |
| Total | 1,065 (74.0%) | 374 (26.0%) |
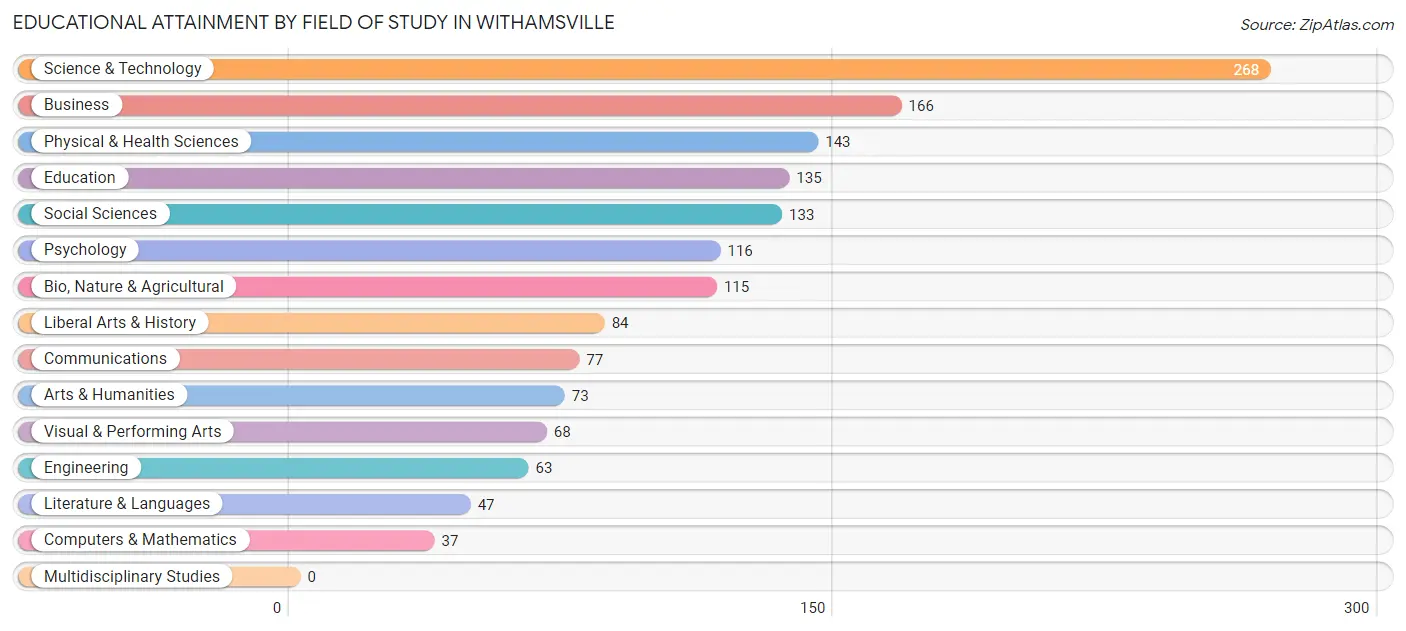
Educational Attainment by Field of Study in Withamsville
Science & technology (268 | 17.6%), business (166 | 10.9%), physical & health sciences (143 | 9.4%), education (135 | 8.8%), and social sciences (133 | 8.7%) are the most common fields of study among 1,525 individuals in Withamsville who have obtained a bachelor's degree or higher.
| Field of Study | # Graduates | % Graduates |
| Computers & Mathematics | 37 | 2.4% |
| Bio, Nature & Agricultural | 115 | 7.5% |
| Physical & Health Sciences | 143 | 9.4% |
| Psychology | 116 | 7.6% |
| Social Sciences | 133 | 8.7% |
| Engineering | 63 | 4.1% |
| Multidisciplinary Studies | 0 | 0.0% |
| Science & Technology | 268 | 17.6% |
| Business | 166 | 10.9% |
| Education | 135 | 8.8% |
| Literature & Languages | 47 | 3.1% |
| Liberal Arts & History | 84 | 5.5% |
| Visual & Performing Arts | 68 | 4.5% |
| Communications | 77 | 5.1% |
| Arts & Humanities | 73 | 4.8% |
| Total | 1,525 | 100.0% |
Transportation & Commute in Withamsville
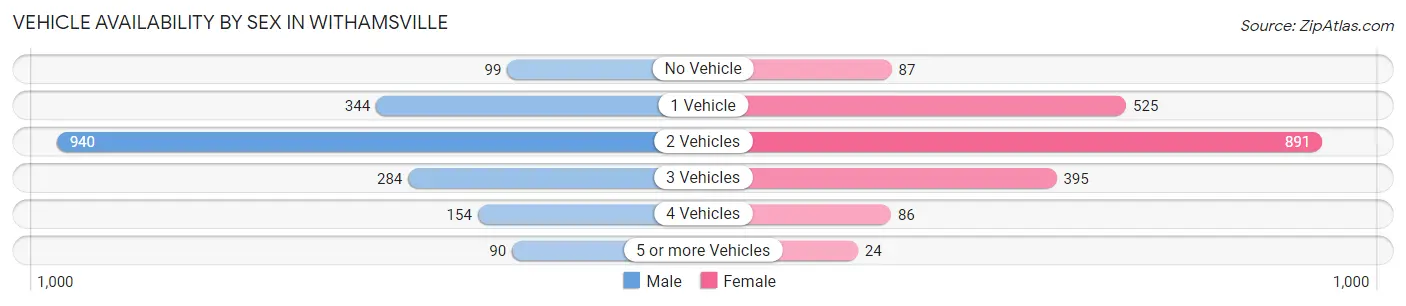
Vehicle Availability by Sex in Withamsville
The most prevalent vehicle ownership categories in Withamsville are males with 2 vehicles (940, accounting for 49.2%) and females with 2 vehicles (891, making up 46.8%).
| Vehicles Available | Male | Female |
| No Vehicle | 99 (5.2%) | 87 (4.3%) |
| 1 Vehicle | 344 (18.0%) | 525 (26.2%) |
| 2 Vehicles | 940 (49.2%) | 891 (44.4%) |
| 3 Vehicles | 284 (14.9%) | 395 (19.7%) |
| 4 Vehicles | 154 (8.1%) | 86 (4.3%) |
| 5 or more Vehicles | 90 (4.7%) | 24 (1.2%) |
| Total | 1,911 (100.0%) | 2,008 (100.0%) |
Commute Time in Withamsville
The most frequently occuring commute durations in Withamsville are 15 to 19 minutes (652 commuters, 17.6%), 30 to 34 minutes (566 commuters, 15.3%), and 20 to 24 minutes (509 commuters, 13.7%).
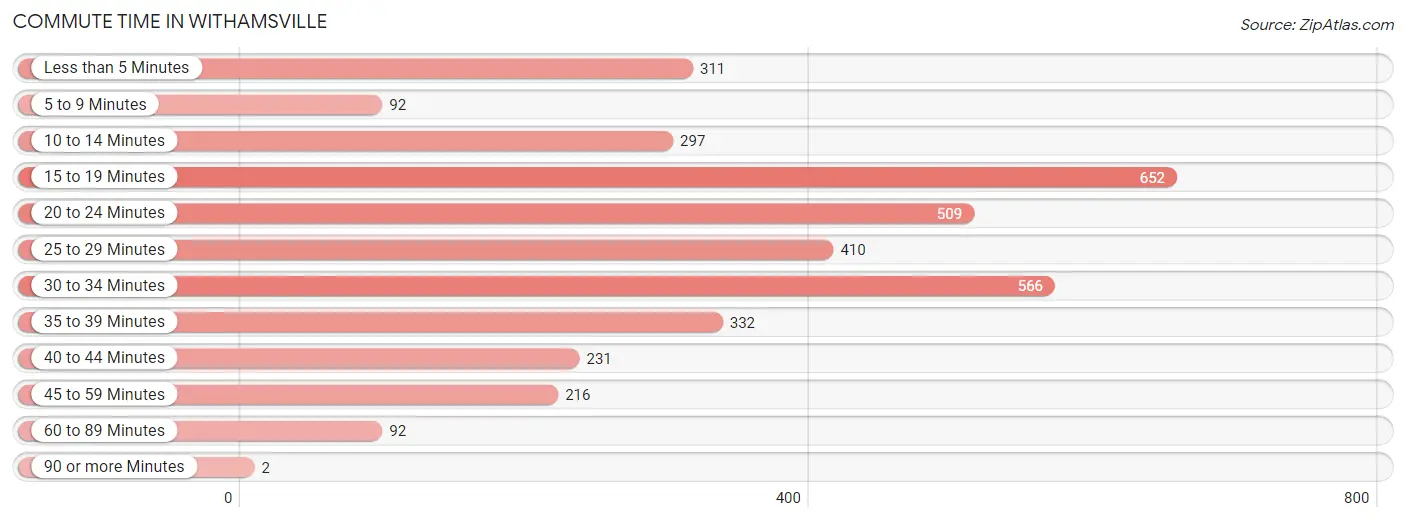
| Commute Time | # Commuters | % Commuters |
| Less than 5 Minutes | 311 | 8.4% |
| 5 to 9 Minutes | 92 | 2.5% |
| 10 to 14 Minutes | 297 | 8.0% |
| 15 to 19 Minutes | 652 | 17.6% |
| 20 to 24 Minutes | 509 | 13.7% |
| 25 to 29 Minutes | 410 | 11.1% |
| 30 to 34 Minutes | 566 | 15.3% |
| 35 to 39 Minutes | 332 | 8.9% |
| 40 to 44 Minutes | 231 | 6.2% |
| 45 to 59 Minutes | 216 | 5.8% |
| 60 to 89 Minutes | 92 | 2.5% |
| 90 or more Minutes | 2 | 0.1% |
Commute Time by Sex in Withamsville
The most common commute times in Withamsville are 15 to 19 minutes (308 commuters, 16.9%) for males and 15 to 19 minutes (344 commuters, 18.3%) for females.
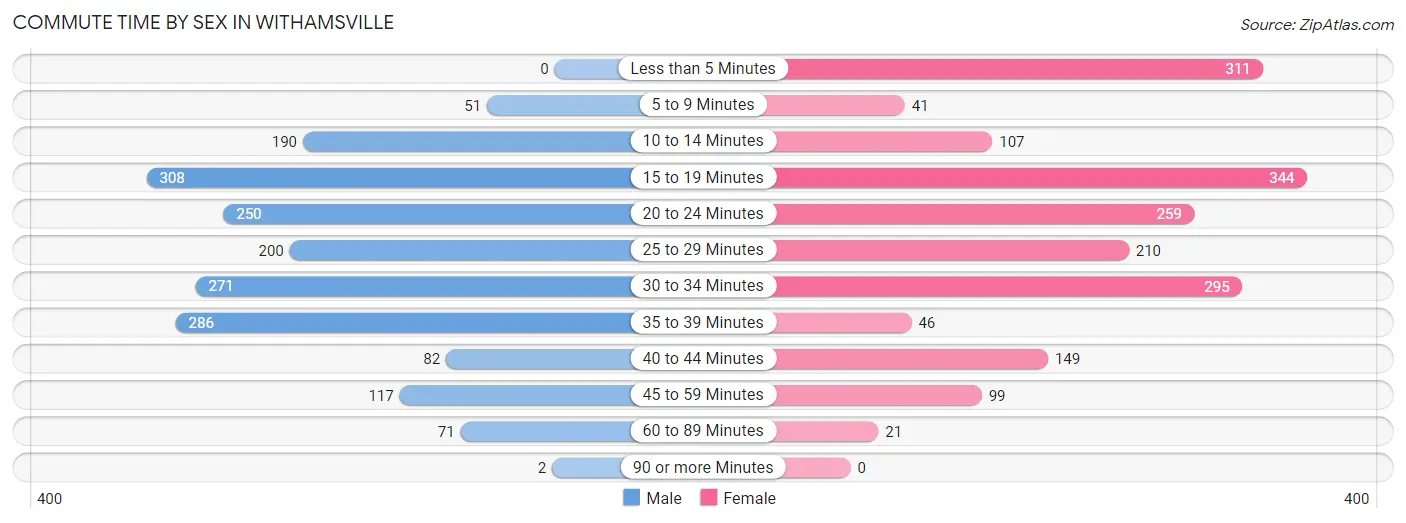
| Commute Time | Male | Female |
| Less than 5 Minutes | 0 (0.0%) | 311 (16.5%) |
| 5 to 9 Minutes | 51 (2.8%) | 41 (2.2%) |
| 10 to 14 Minutes | 190 (10.4%) | 107 (5.7%) |
| 15 to 19 Minutes | 308 (16.9%) | 344 (18.3%) |
| 20 to 24 Minutes | 250 (13.7%) | 259 (13.8%) |
| 25 to 29 Minutes | 200 (10.9%) | 210 (11.2%) |
| 30 to 34 Minutes | 271 (14.8%) | 295 (15.7%) |
| 35 to 39 Minutes | 286 (15.7%) | 46 (2.4%) |
| 40 to 44 Minutes | 82 (4.5%) | 149 (7.9%) |
| 45 to 59 Minutes | 117 (6.4%) | 99 (5.3%) |
| 60 to 89 Minutes | 71 (3.9%) | 21 (1.1%) |
| 90 or more Minutes | 2 (0.1%) | 0 (0.0%) |
Time of Departure to Work by Sex in Withamsville
The most frequent times of departure to work in Withamsville are 12:00 PM to 3:59 PM (342, 18.7%) for males and 8:00 AM to 8:29 AM (286, 15.2%) for females.
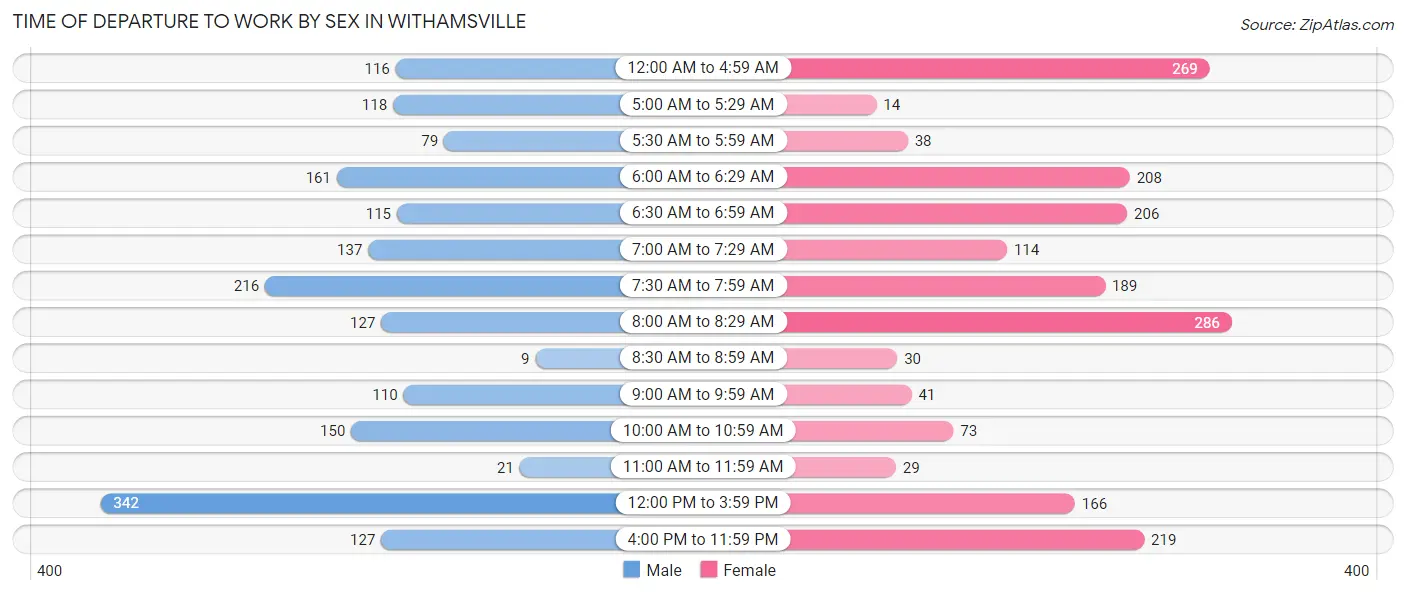
| Time of Departure | Male | Female |
| 12:00 AM to 4:59 AM | 116 (6.4%) | 269 (14.3%) |
| 5:00 AM to 5:29 AM | 118 (6.5%) | 14 (0.7%) |
| 5:30 AM to 5:59 AM | 79 (4.3%) | 38 (2.0%) |
| 6:00 AM to 6:29 AM | 161 (8.8%) | 208 (11.1%) |
| 6:30 AM to 6:59 AM | 115 (6.3%) | 206 (11.0%) |
| 7:00 AM to 7:29 AM | 137 (7.5%) | 114 (6.1%) |
| 7:30 AM to 7:59 AM | 216 (11.8%) | 189 (10.0%) |
| 8:00 AM to 8:29 AM | 127 (7.0%) | 286 (15.2%) |
| 8:30 AM to 8:59 AM | 9 (0.5%) | 30 (1.6%) |
| 9:00 AM to 9:59 AM | 110 (6.0%) | 41 (2.2%) |
| 10:00 AM to 10:59 AM | 150 (8.2%) | 73 (3.9%) |
| 11:00 AM to 11:59 AM | 21 (1.1%) | 29 (1.5%) |
| 12:00 PM to 3:59 PM | 342 (18.7%) | 166 (8.8%) |
| 4:00 PM to 11:59 PM | 127 (7.0%) | 219 (11.6%) |
| Total | 1,828 (100.0%) | 1,882 (100.0%) |
Housing Occupancy in Withamsville
Occupancy by Ownership in Withamsville
Of the total 3,404 dwellings in Withamsville, owner-occupied units account for 1,546 (45.4%), while renter-occupied units make up 1,858 (54.6%).
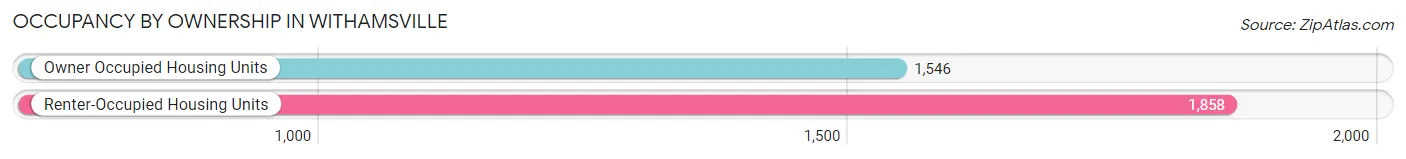
| Occupancy | # Housing Units | % Housing Units |
| Owner Occupied Housing Units | 1,546 | 45.4% |
| Renter-Occupied Housing Units | 1,858 | 54.6% |
| Total Occupied Housing Units | 3,404 | 100.0% |
Occupancy by Household Size in Withamsville
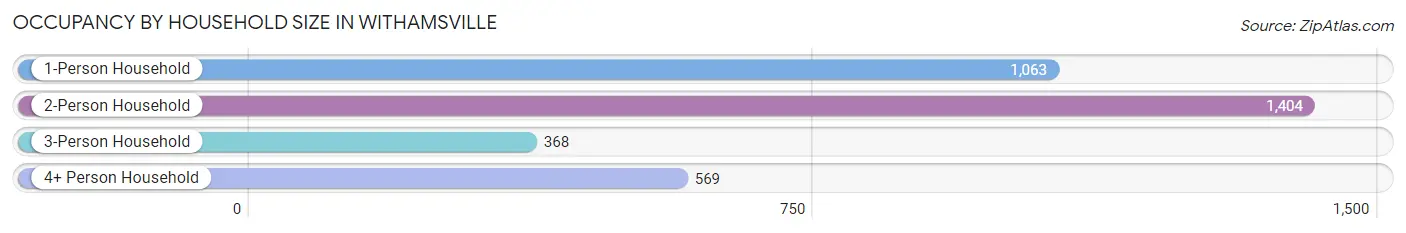
| Household Size | # Housing Units | % Housing Units |
| 1-Person Household | 1,063 | 31.2% |
| 2-Person Household | 1,404 | 41.2% |
| 3-Person Household | 368 | 10.8% |
| 4+ Person Household | 569 | 16.7% |
| Total Housing Units | 3,404 | 100.0% |
Occupancy by Ownership by Household Size in Withamsville
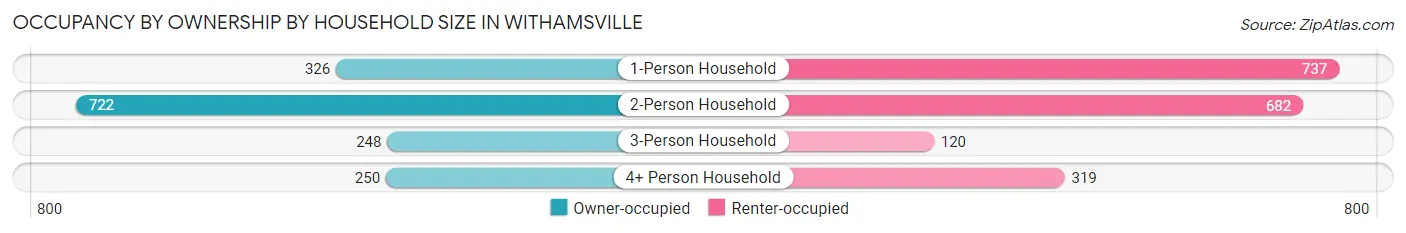
| Household Size | Owner-occupied | Renter-occupied |
| 1-Person Household | 326 (30.7%) | 737 (69.3%) |
| 2-Person Household | 722 (51.4%) | 682 (48.6%) |
| 3-Person Household | 248 (67.4%) | 120 (32.6%) |
| 4+ Person Household | 250 (43.9%) | 319 (56.1%) |
| Total Housing Units | 1,546 (45.4%) | 1,858 (54.6%) |
Occupancy by Educational Attainment in Withamsville
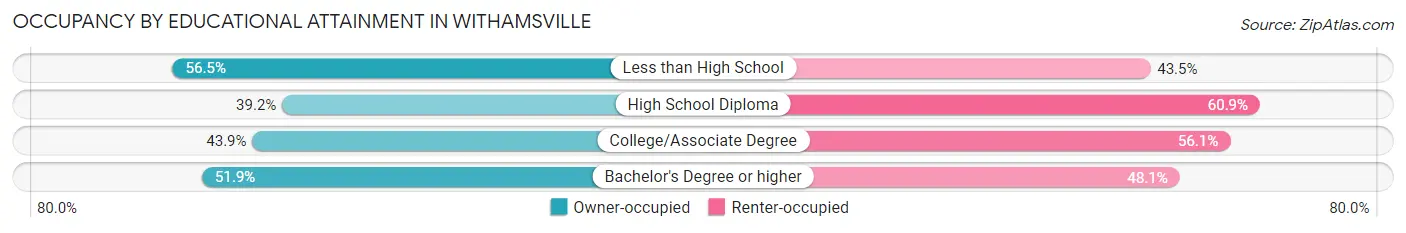
| Household Size | Owner-occupied | Renter-occupied |
| Less than High School | 104 (56.5%) | 80 (43.5%) |
| High School Diploma | 467 (39.2%) | 726 (60.9%) |
| College/Associate Degree | 419 (43.9%) | 536 (56.1%) |
| Bachelor's Degree or higher | 556 (51.9%) | 516 (48.1%) |
Occupancy by Age of Householder in Withamsville
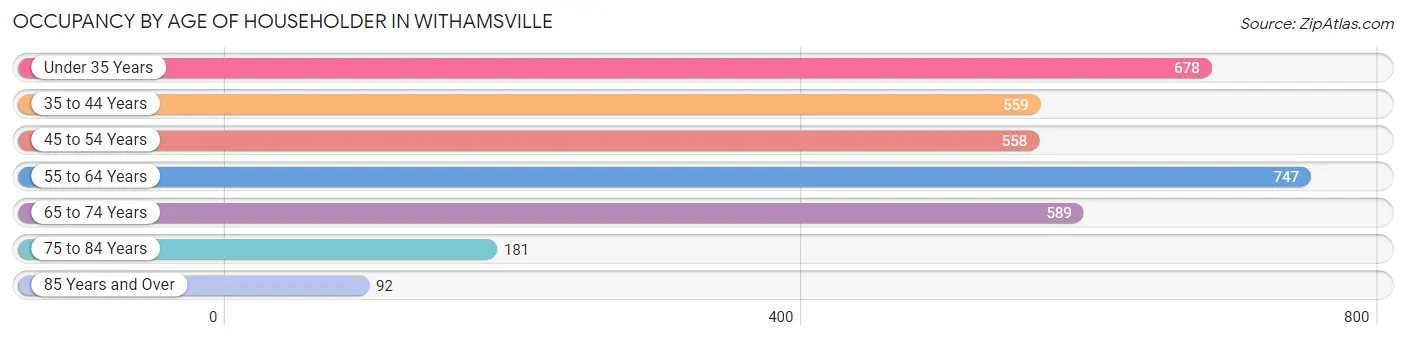
| Age Bracket | # Households | % Households |
| Under 35 Years | 678 | 19.9% |
| 35 to 44 Years | 559 | 16.4% |
| 45 to 54 Years | 558 | 16.4% |
| 55 to 64 Years | 747 | 21.9% |
| 65 to 74 Years | 589 | 17.3% |
| 75 to 84 Years | 181 | 5.3% |
| 85 Years and Over | 92 | 2.7% |
| Total | 3,404 | 100.0% |
Housing Finances in Withamsville
Median Income by Occupancy in Withamsville
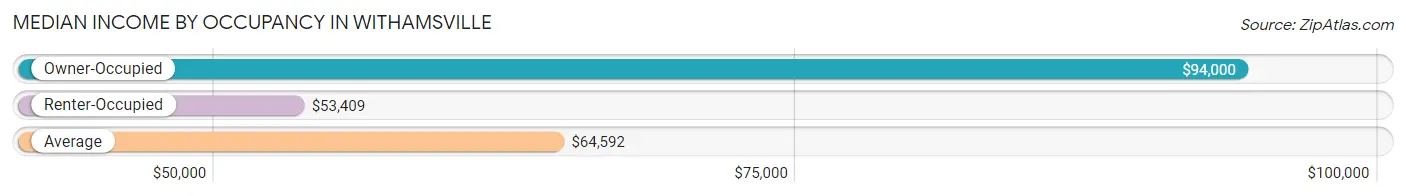
| Occupancy Type | # Households | Median Income |
| Owner-Occupied | 1,546 (45.4%) | $94,000 |
| Renter-Occupied | 1,858 (54.6%) | $53,409 |
| Average | 3,404 (100.0%) | $64,592 |
Occupancy by Householder Income Bracket in Withamsville
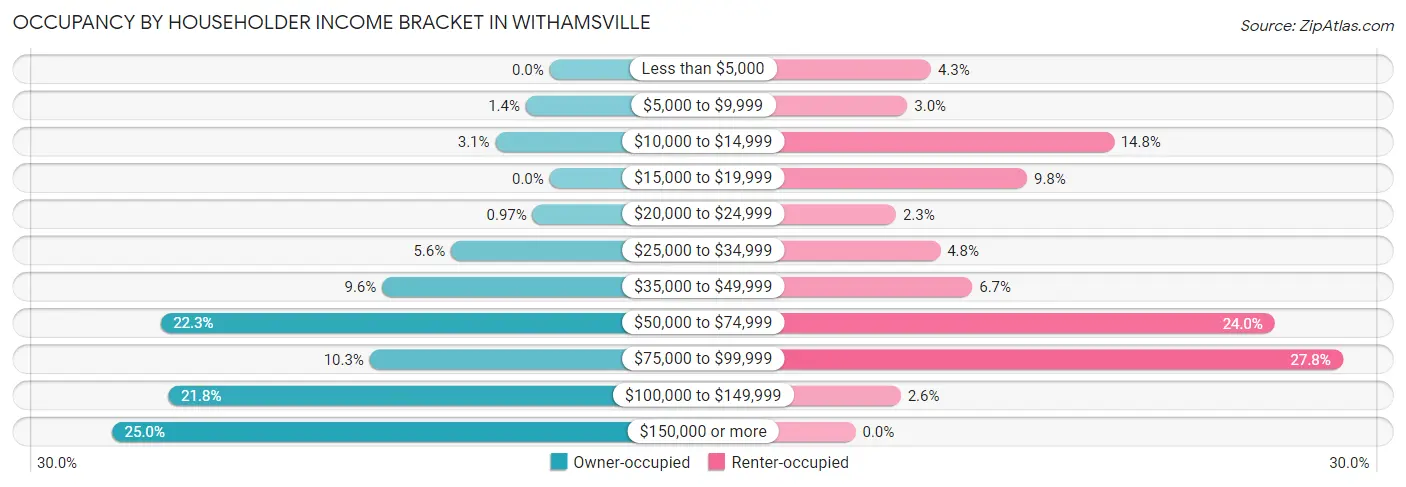
| Income Bracket | Owner-occupied | Renter-occupied |
| Less than $5,000 | 0 (0.0%) | 80 (4.3%) |
| $5,000 to $9,999 | 21 (1.4%) | 55 (3.0%) |
| $10,000 to $14,999 | 48 (3.1%) | 274 (14.7%) |
| $15,000 to $19,999 | 0 (0.0%) | 182 (9.8%) |
| $20,000 to $24,999 | 15 (1.0%) | 43 (2.3%) |
| $25,000 to $34,999 | 87 (5.6%) | 90 (4.8%) |
| $35,000 to $49,999 | 148 (9.6%) | 124 (6.7%) |
| $50,000 to $74,999 | 344 (22.3%) | 445 (23.9%) |
| $75,000 to $99,999 | 159 (10.3%) | 517 (27.8%) |
| $100,000 to $149,999 | 337 (21.8%) | 48 (2.6%) |
| $150,000 or more | 387 (25.0%) | 0 (0.0%) |
| Total | 1,546 (100.0%) | 1,858 (100.0%) |
Monthly Housing Cost Tiers in Withamsville
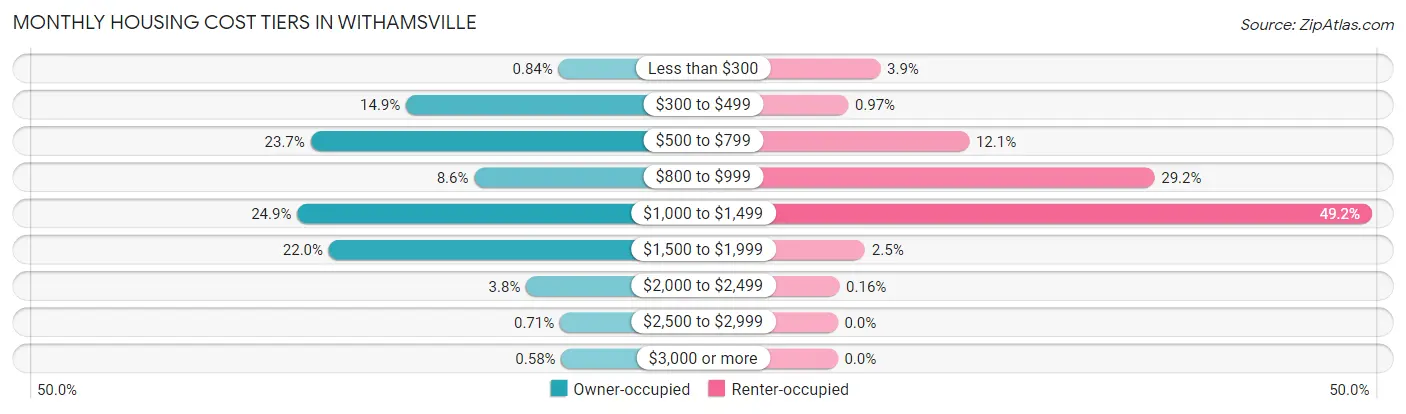
| Monthly Cost | Owner-occupied | Renter-occupied |
| Less than $300 | 13 (0.8%) | 73 (3.9%) |
| $300 to $499 | 230 (14.9%) | 18 (1.0%) |
| $500 to $799 | 366 (23.7%) | 225 (12.1%) |
| $800 to $999 | 133 (8.6%) | 542 (29.2%) |
| $1,000 to $1,499 | 385 (24.9%) | 914 (49.2%) |
| $1,500 to $1,999 | 340 (22.0%) | 47 (2.5%) |
| $2,000 to $2,499 | 59 (3.8%) | 3 (0.2%) |
| $2,500 to $2,999 | 11 (0.7%) | 0 (0.0%) |
| $3,000 or more | 9 (0.6%) | 0 (0.0%) |
| Total | 1,546 (100.0%) | 1,858 (100.0%) |
Physical Housing Characteristics in Withamsville
Housing Structures in Withamsville
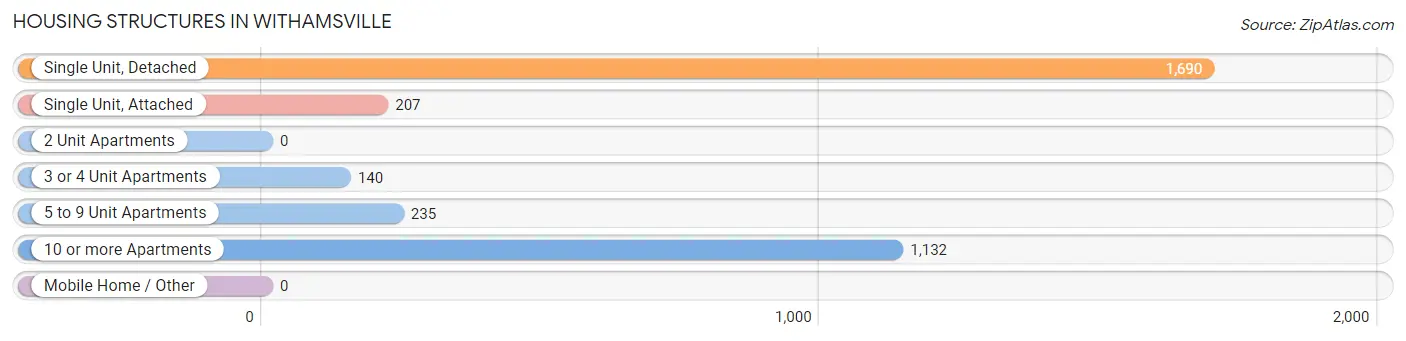
| Structure Type | # Housing Units | % Housing Units |
| Single Unit, Detached | 1,690 | 49.6% |
| Single Unit, Attached | 207 | 6.1% |
| 2 Unit Apartments | 0 | 0.0% |
| 3 or 4 Unit Apartments | 140 | 4.1% |
| 5 to 9 Unit Apartments | 235 | 6.9% |
| 10 or more Apartments | 1,132 | 33.3% |
| Mobile Home / Other | 0 | 0.0% |
| Total | 3,404 | 100.0% |
Housing Structures by Occupancy in Withamsville
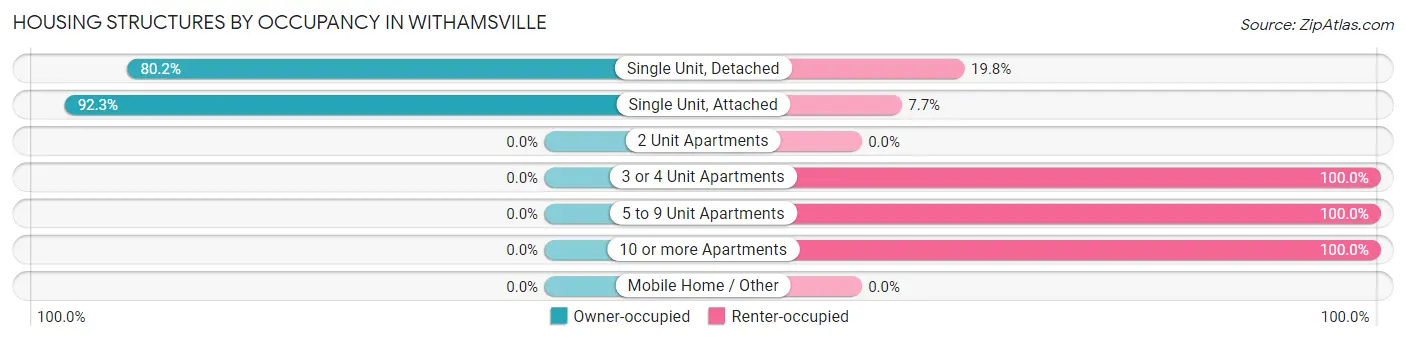
| Structure Type | Owner-occupied | Renter-occupied |
| Single Unit, Detached | 1,355 (80.2%) | 335 (19.8%) |
| Single Unit, Attached | 191 (92.3%) | 16 (7.7%) |
| 2 Unit Apartments | 0 (0.0%) | 0 (0.0%) |
| 3 or 4 Unit Apartments | 0 (0.0%) | 140 (100.0%) |
| 5 to 9 Unit Apartments | 0 (0.0%) | 235 (100.0%) |
| 10 or more Apartments | 0 (0.0%) | 1,132 (100.0%) |
| Mobile Home / Other | 0 (0.0%) | 0 (0.0%) |
| Total | 1,546 (45.4%) | 1,858 (54.6%) |
Housing Structures by Number of Rooms in Withamsville
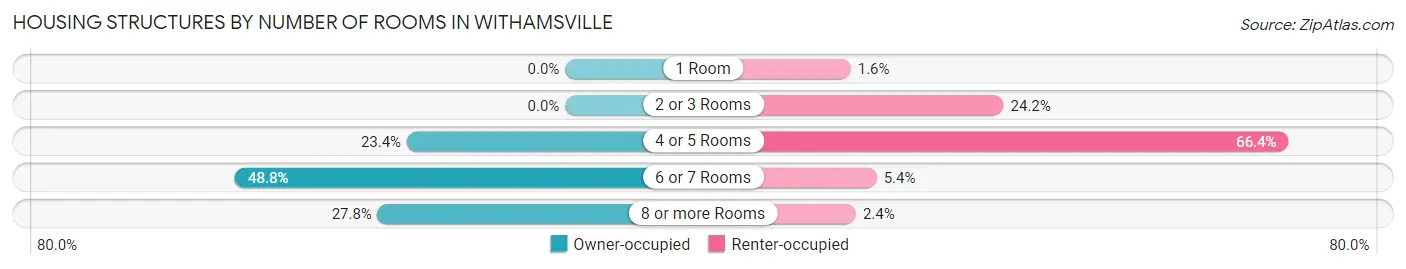
| Number of Rooms | Owner-occupied | Renter-occupied |
| 1 Room | 0 (0.0%) | 30 (1.6%) |
| 2 or 3 Rooms | 0 (0.0%) | 450 (24.2%) |
| 4 or 5 Rooms | 362 (23.4%) | 1,233 (66.4%) |
| 6 or 7 Rooms | 755 (48.8%) | 101 (5.4%) |
| 8 or more Rooms | 429 (27.8%) | 44 (2.4%) |
| Total | 1,546 (100.0%) | 1,858 (100.0%) |
Housing Structure by Heating Type in Withamsville
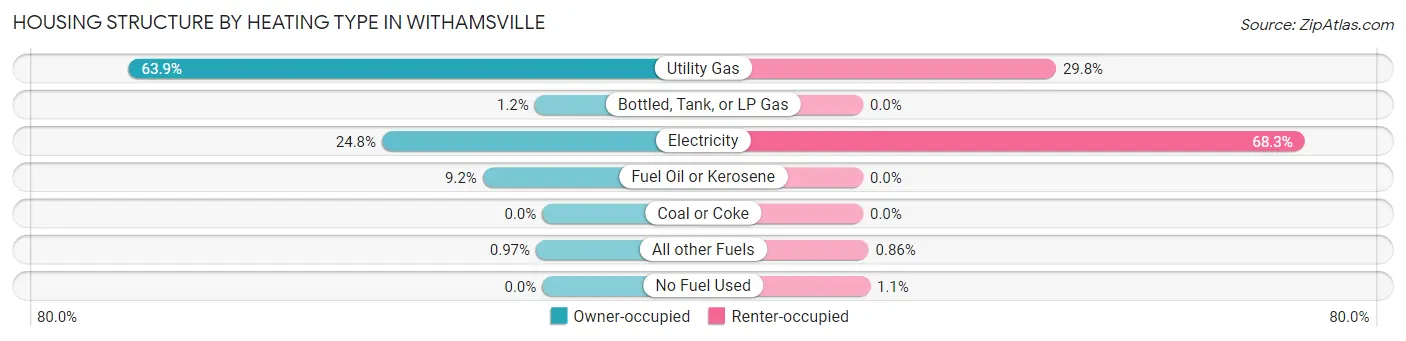
| Heating Type | Owner-occupied | Renter-occupied |
| Utility Gas | 988 (63.9%) | 554 (29.8%) |
| Bottled, Tank, or LP Gas | 18 (1.2%) | 0 (0.0%) |
| Electricity | 383 (24.8%) | 1,268 (68.2%) |
| Fuel Oil or Kerosene | 142 (9.2%) | 0 (0.0%) |
| Coal or Coke | 0 (0.0%) | 0 (0.0%) |
| All other Fuels | 15 (1.0%) | 16 (0.9%) |
| No Fuel Used | 0 (0.0%) | 20 (1.1%) |
| Total | 1,546 (100.0%) | 1,858 (100.0%) |
Household Vehicle Usage in Withamsville
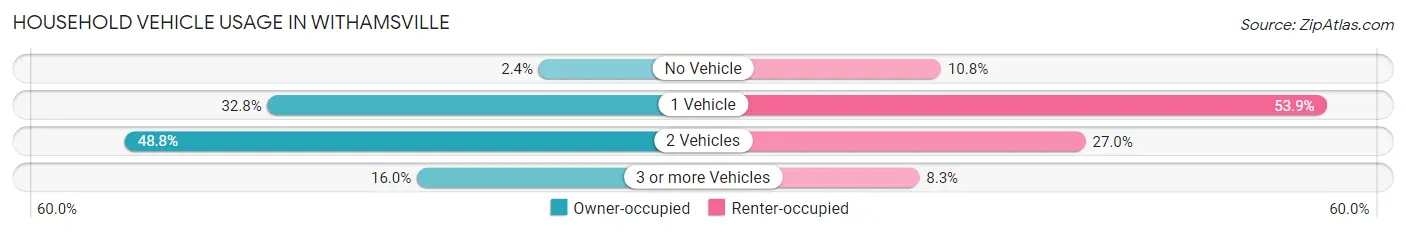
| Vehicles per Household | Owner-occupied | Renter-occupied |
| No Vehicle | 37 (2.4%) | 200 (10.8%) |
| 1 Vehicle | 507 (32.8%) | 1,002 (53.9%) |
| 2 Vehicles | 754 (48.8%) | 501 (27.0%) |
| 3 or more Vehicles | 248 (16.0%) | 155 (8.3%) |
| Total | 1,546 (100.0%) | 1,858 (100.0%) |
Real Estate & Mortgages in Withamsville
Real Estate and Mortgage Overview in Withamsville
| Characteristic | Without Mortgage | With Mortgage |
| Housing Units | 698 | 848 |
| Median Property Value | $179,000 | $191,200 |
| Median Household Income | $62,857 | $236 |
| Monthly Housing Costs | $582 | $9 |
| Real Estate Taxes | $2,583 | $13 |
Property Value by Mortgage Status in Withamsville
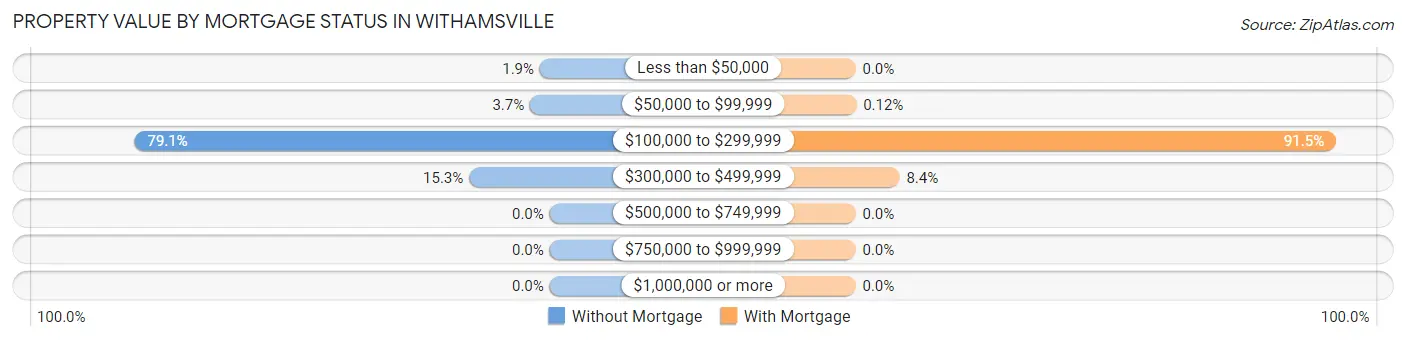
| Property Value | Without Mortgage | With Mortgage |
| Less than $50,000 | 13 (1.9%) | 0 (0.0%) |
| $50,000 to $99,999 | 26 (3.7%) | 1 (0.1%) |
| $100,000 to $299,999 | 552 (79.1%) | 776 (91.5%) |
| $300,000 to $499,999 | 107 (15.3%) | 71 (8.4%) |
| $500,000 to $749,999 | 0 (0.0%) | 0 (0.0%) |
| $750,000 to $999,999 | 0 (0.0%) | 0 (0.0%) |
| $1,000,000 or more | 0 (0.0%) | 0 (0.0%) |
| Total | 698 (100.0%) | 848 (100.0%) |
Household Income by Mortgage Status in Withamsville
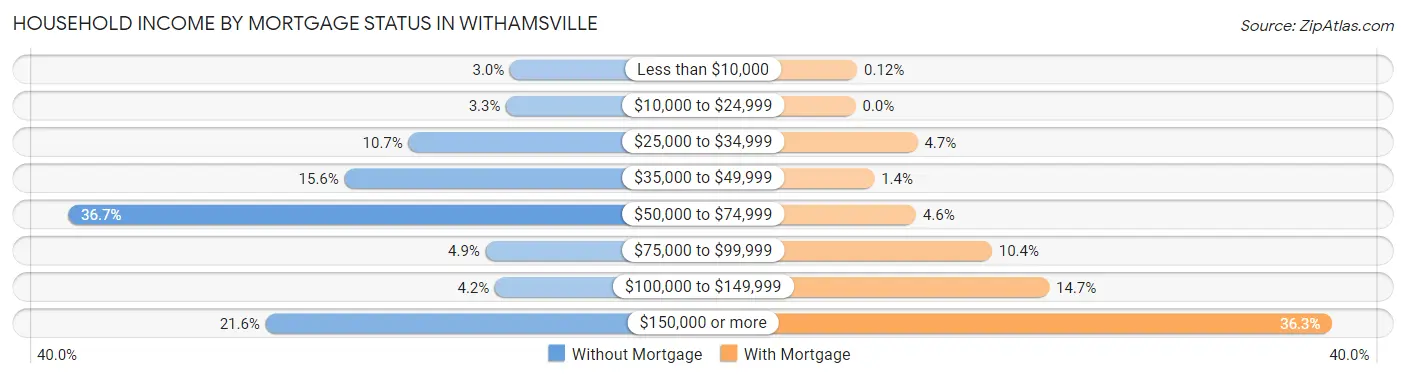
| Household Income | Without Mortgage | With Mortgage |
| Less than $10,000 | 21 (3.0%) | 1 (0.1%) |
| $10,000 to $24,999 | 23 (3.3%) | 0 (0.0%) |
| $25,000 to $34,999 | 75 (10.7%) | 40 (4.7%) |
| $35,000 to $49,999 | 109 (15.6%) | 12 (1.4%) |
| $50,000 to $74,999 | 256 (36.7%) | 39 (4.6%) |
| $75,000 to $99,999 | 34 (4.9%) | 88 (10.4%) |
| $100,000 to $149,999 | 29 (4.2%) | 125 (14.7%) |
| $150,000 or more | 151 (21.6%) | 308 (36.3%) |
| Total | 698 (100.0%) | 848 (100.0%) |
Property Value to Household Income Ratio in Withamsville
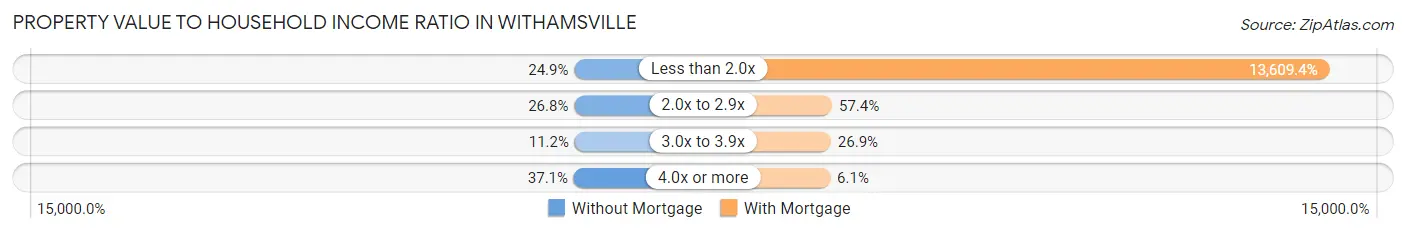
| Value-to-Income Ratio | Without Mortgage | With Mortgage |
| Less than 2.0x | 174 (24.9%) | 115,408 (13,609.4%) |
| 2.0x to 2.9x | 187 (26.8%) | 487 (57.4%) |
| 3.0x to 3.9x | 78 (11.2%) | 228 (26.9%) |
| 4.0x or more | 259 (37.1%) | 52 (6.1%) |
| Total | 698 (100.0%) | 848 (100.0%) |
Real Estate Taxes by Mortgage Status in Withamsville
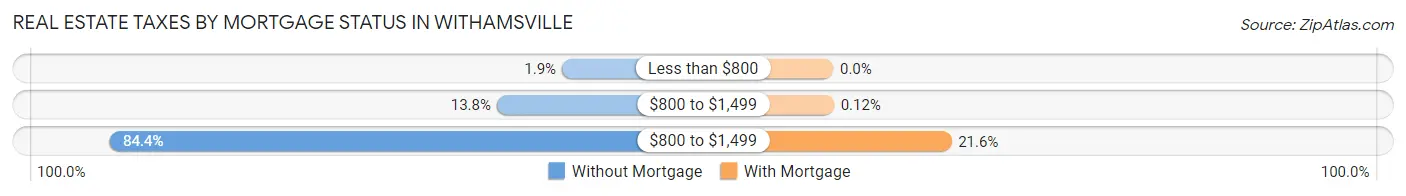
| Property Taxes | Without Mortgage | With Mortgage |
| Less than $800 | 13 (1.9%) | 0 (0.0%) |
| $800 to $1,499 | 96 (13.8%) | 1 (0.1%) |
| $800 to $1,499 | 589 (84.4%) | 183 (21.6%) |
| Total | 698 (100.0%) | 848 (100.0%) |
Health & Disability in Withamsville
Health Insurance Coverage by Age in Withamsville
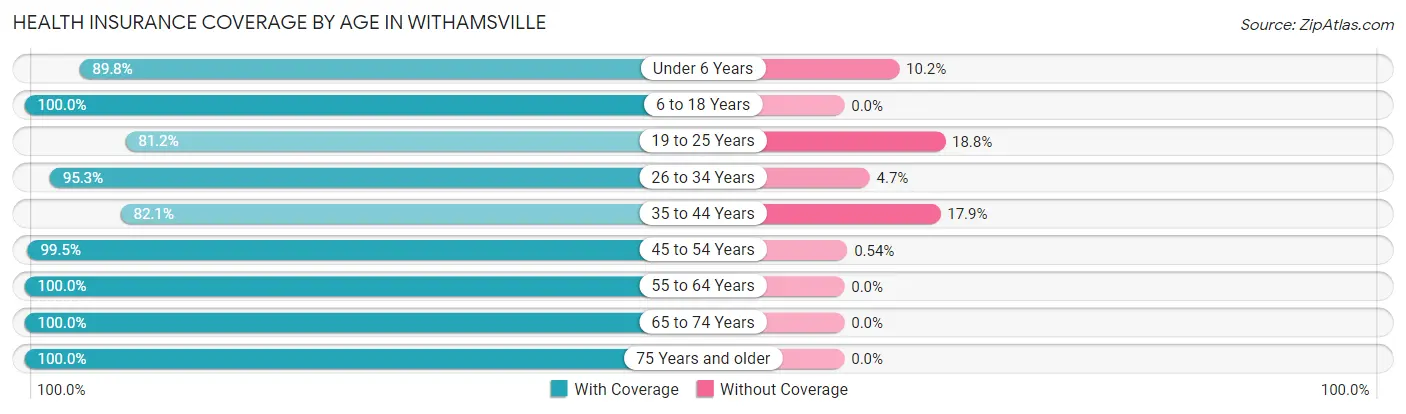
| Age Bracket | With Coverage | Without Coverage |
| Under 6 Years | 334 (89.8%) | 38 (10.2%) |
| 6 to 18 Years | 1,095 (100.0%) | 0 (0.0%) |
| 19 to 25 Years | 670 (81.2%) | 155 (18.8%) |
| 26 to 34 Years | 706 (95.3%) | 35 (4.7%) |
| 35 to 44 Years | 991 (82.1%) | 216 (17.9%) |
| 45 to 54 Years | 924 (99.5%) | 5 (0.5%) |
| 55 to 64 Years | 1,331 (100.0%) | 0 (0.0%) |
| 65 to 74 Years | 784 (100.0%) | 0 (0.0%) |
| 75 Years and older | 477 (100.0%) | 0 (0.0%) |
| Total | 7,312 (94.2%) | 449 (5.8%) |
Health Insurance Coverage by Citizenship Status in Withamsville
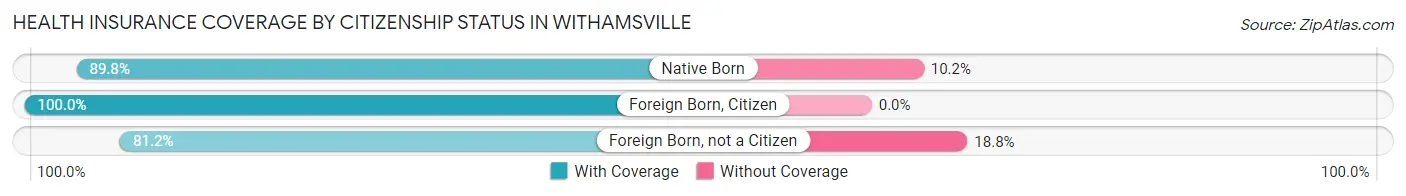
| Citizenship Status | With Coverage | Without Coverage |
| Native Born | 334 (89.8%) | 38 (10.2%) |
| Foreign Born, Citizen | 1,095 (100.0%) | 0 (0.0%) |
| Foreign Born, not a Citizen | 670 (81.2%) | 155 (18.8%) |
Health Insurance Coverage by Household Income in Withamsville
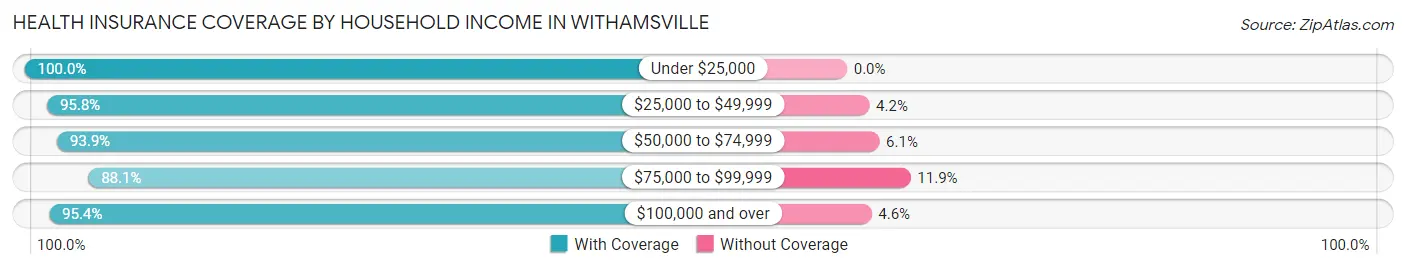
| Household Income | With Coverage | Without Coverage |
| Under $25,000 | 1,194 (100.0%) | 0 (0.0%) |
| $25,000 to $49,999 | 869 (95.8%) | 38 (4.2%) |
| $50,000 to $74,999 | 1,691 (93.9%) | 109 (6.1%) |
| $75,000 to $99,999 | 1,500 (88.1%) | 203 (11.9%) |
| $100,000 and over | 2,054 (95.4%) | 99 (4.6%) |
Public vs Private Health Insurance Coverage by Age in Withamsville
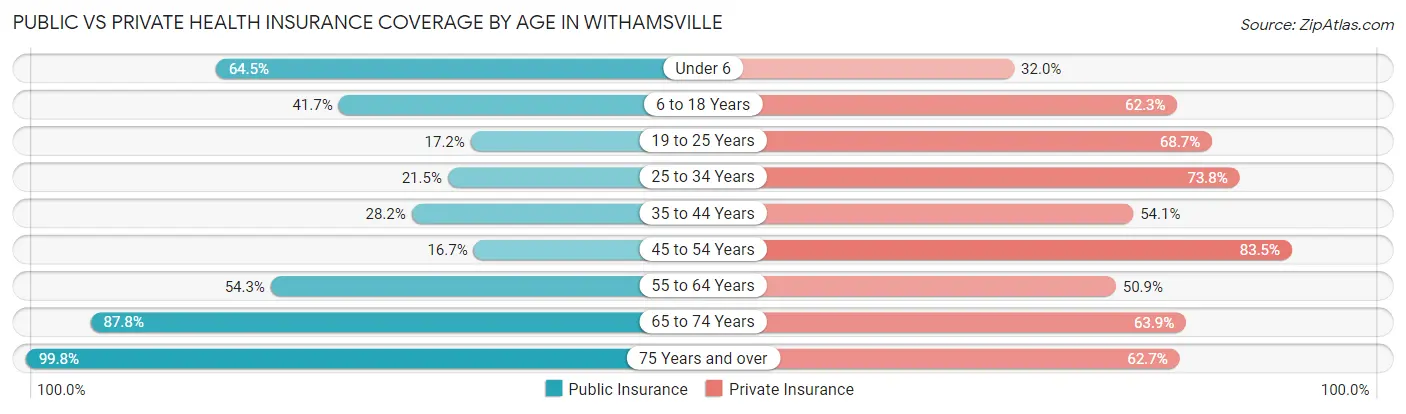
| Age Bracket | Public Insurance | Private Insurance |
| Under 6 | 240 (64.5%) | 119 (32.0%) |
| 6 to 18 Years | 457 (41.7%) | 682 (62.3%) |
| 19 to 25 Years | 142 (17.2%) | 567 (68.7%) |
| 25 to 34 Years | 159 (21.5%) | 547 (73.8%) |
| 35 to 44 Years | 340 (28.2%) | 653 (54.1%) |
| 45 to 54 Years | 155 (16.7%) | 776 (83.5%) |
| 55 to 64 Years | 723 (54.3%) | 677 (50.9%) |
| 65 to 74 Years | 688 (87.8%) | 501 (63.9%) |
| 75 Years and over | 476 (99.8%) | 299 (62.7%) |
| Total | 3,380 (43.5%) | 4,821 (62.1%) |
Disability Status by Sex by Age in Withamsville
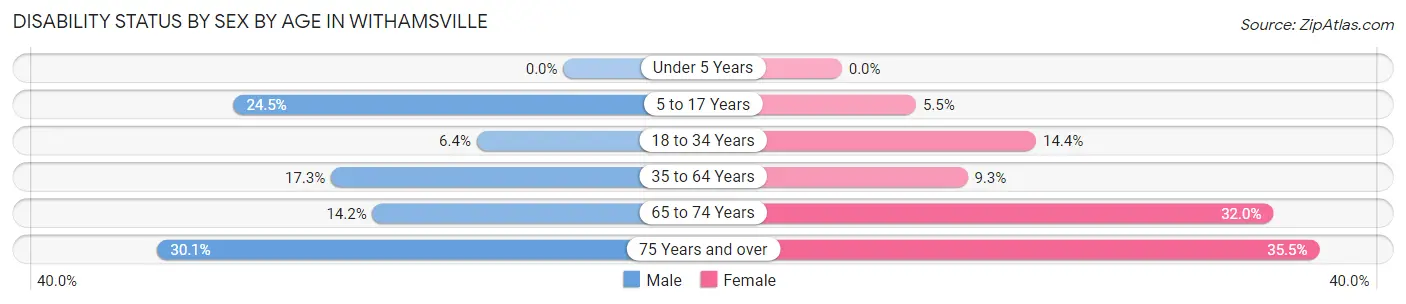
| Age Bracket | Male | Female |
| Under 5 Years | 0 (0.0%) | 0 (0.0%) |
| 5 to 17 Years | 96 (24.5%) | 32 (5.5%) |
| 18 to 34 Years | 47 (6.4%) | 138 (14.4%) |
| 35 to 64 Years | 282 (17.2%) | 171 (9.3%) |
| 65 to 74 Years | 35 (14.2%) | 172 (32.0%) |
| 75 Years and over | 63 (30.1%) | 95 (35.4%) |
Disability Class by Sex by Age in Withamsville
Disability Class: Hearing Difficulty
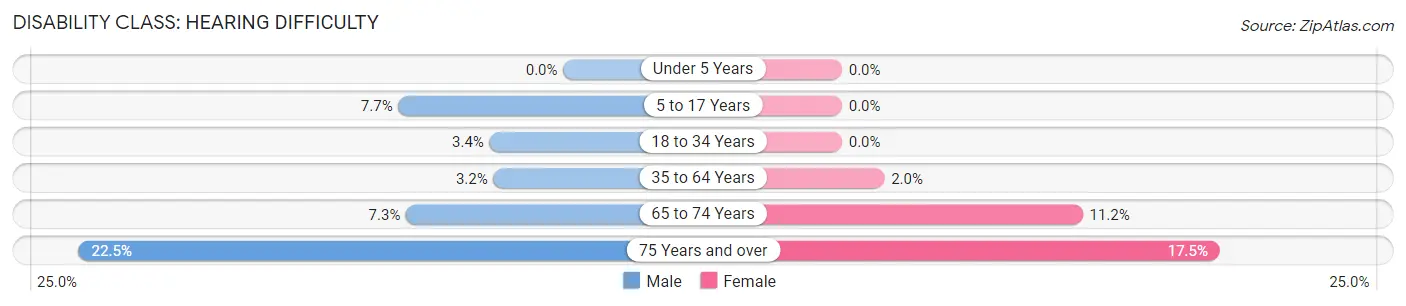
| Age Bracket | Male | Female |
| Under 5 Years | 0 (0.0%) | 0 (0.0%) |
| 5 to 17 Years | 30 (7.6%) | 0 (0.0%) |
| 18 to 34 Years | 25 (3.4%) | 0 (0.0%) |
| 35 to 64 Years | 53 (3.2%) | 36 (2.0%) |
| 65 to 74 Years | 18 (7.3%) | 60 (11.2%) |
| 75 Years and over | 47 (22.5%) | 47 (17.5%) |
Disability Class: Vision Difficulty
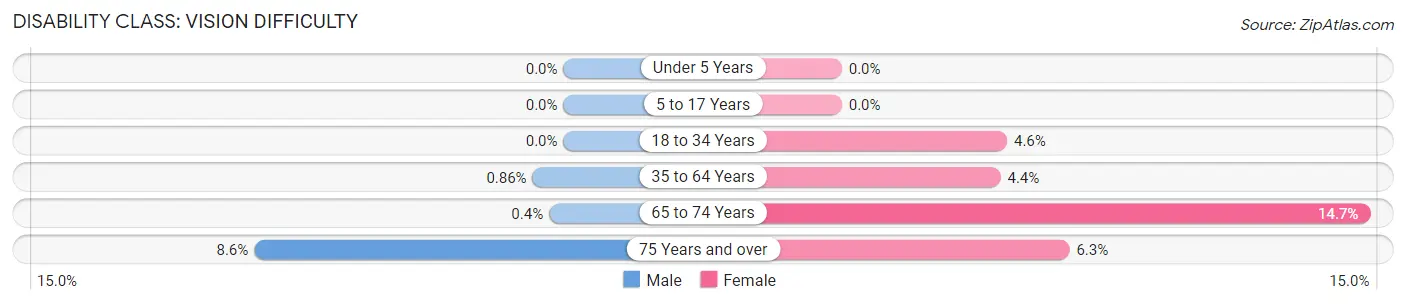
| Age Bracket | Male | Female |
| Under 5 Years | 0 (0.0%) | 0 (0.0%) |
| 5 to 17 Years | 0 (0.0%) | 0 (0.0%) |
| 18 to 34 Years | 0 (0.0%) | 44 (4.6%) |
| 35 to 64 Years | 14 (0.9%) | 81 (4.4%) |
| 65 to 74 Years | 1 (0.4%) | 79 (14.7%) |
| 75 Years and over | 18 (8.6%) | 17 (6.3%) |
Disability Class: Cognitive Difficulty
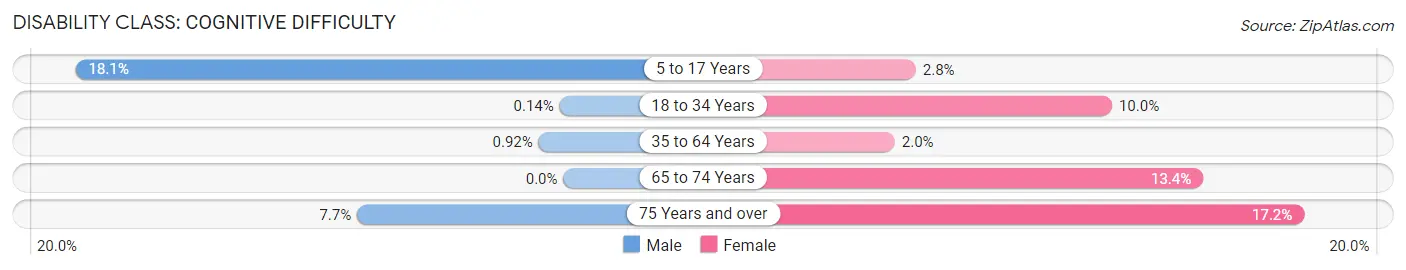
| Age Bracket | Male | Female |
| 5 to 17 Years | 71 (18.1%) | 16 (2.8%) |
| 18 to 34 Years | 1 (0.1%) | 96 (10.0%) |
| 35 to 64 Years | 15 (0.9%) | 36 (2.0%) |
| 65 to 74 Years | 0 (0.0%) | 72 (13.4%) |
| 75 Years and over | 16 (7.7%) | 46 (17.2%) |
Disability Class: Ambulatory Difficulty
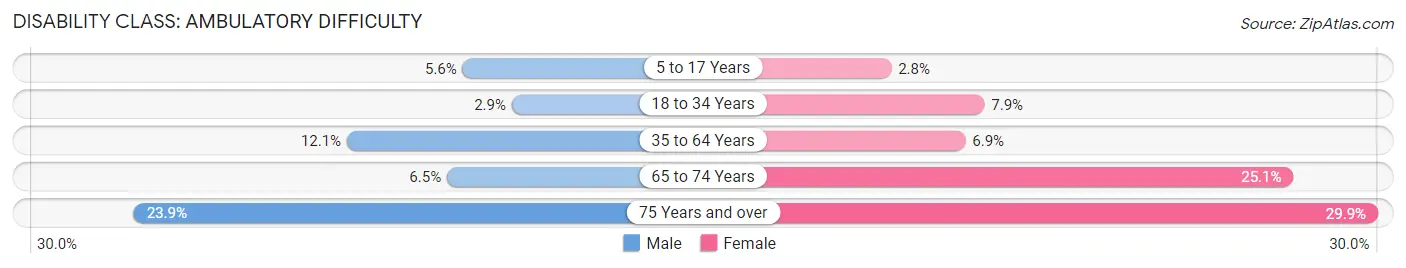
| Age Bracket | Male | Female |
| 5 to 17 Years | 22 (5.6%) | 16 (2.8%) |
| 18 to 34 Years | 21 (2.9%) | 76 (7.9%) |
| 35 to 64 Years | 197 (12.0%) | 126 (6.9%) |
| 65 to 74 Years | 16 (6.5%) | 135 (25.1%) |
| 75 Years and over | 50 (23.9%) | 80 (29.8%) |
Disability Class: Self-Care Difficulty
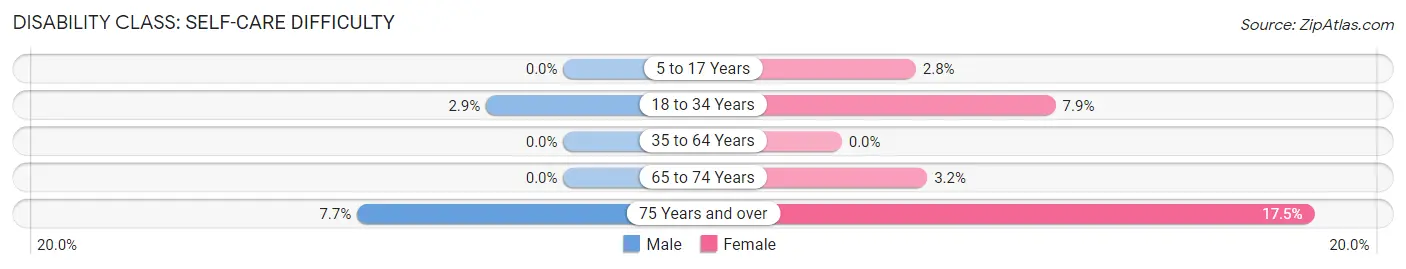
| Age Bracket | Male | Female |
| 5 to 17 Years | 0 (0.0%) | 16 (2.8%) |
| 18 to 34 Years | 21 (2.9%) | 76 (7.9%) |
| 35 to 64 Years | 0 (0.0%) | 0 (0.0%) |
| 65 to 74 Years | 0 (0.0%) | 17 (3.2%) |
| 75 Years and over | 16 (7.7%) | 47 (17.5%) |
Technology Access in Withamsville
Computing Device Access in Withamsville
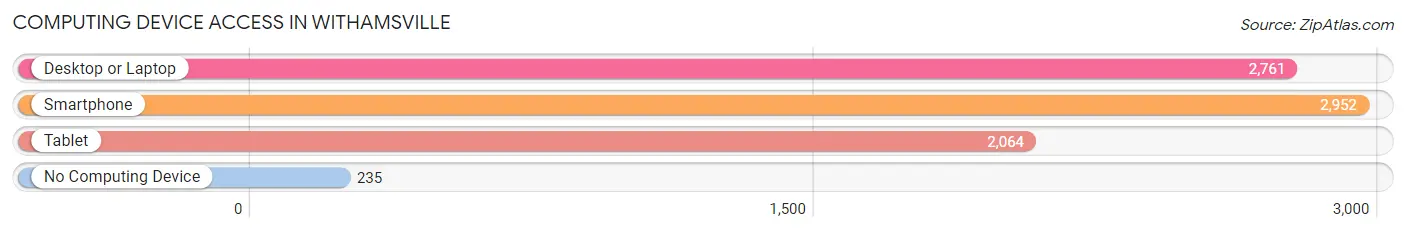
| Device Type | # Households | % Households |
| Desktop or Laptop | 2,761 | 81.1% |
| Smartphone | 2,952 | 86.7% |
| Tablet | 2,064 | 60.6% |
| No Computing Device | 235 | 6.9% |
| Total | 3,404 | 100.0% |
Internet Access in Withamsville
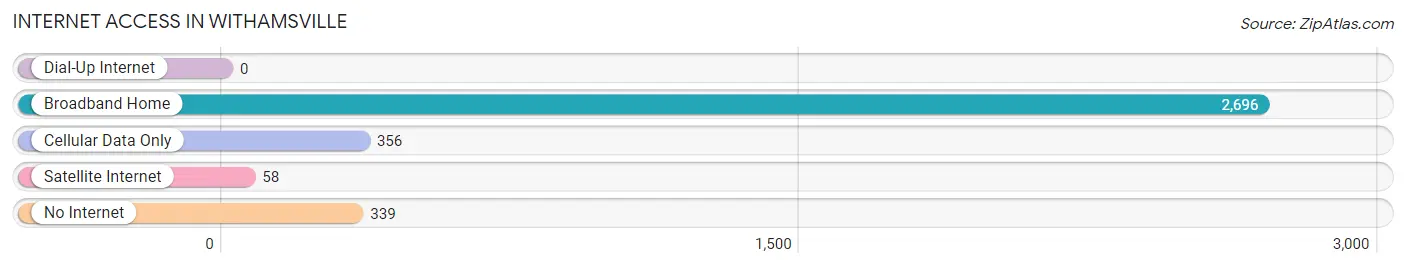
| Internet Type | # Households | % Households |
| Dial-Up Internet | 0 | 0.0% |
| Broadband Home | 2,696 | 79.2% |
| Cellular Data Only | 356 | 10.5% |
| Satellite Internet | 58 | 1.7% |
| No Internet | 339 | 10.0% |
| Total | 3,404 | 100.0% |
Withamsville Summary
Withamsville is a small unincorporated community located in the southeastern corner of Ohio, in the county of Clermont. It is situated along the Ohio River, just south of the city of Cincinnati. Withamsville is a rural community with a population of just over 1,000 people.
History
Withamsville was first settled in 1805 by William Witham, a Revolutionary War veteran. He purchased the land from the government and built a log cabin on the property. The area was originally known as Witham's Settlement, but the name was changed to Withamsville in 1817.
The community grew slowly over the years, and by the mid-1800s, it had become a thriving agricultural center. The town was home to several mills, a blacksmith shop, a general store, and a post office. The Withamsville Methodist Church was established in 1845, and the Withamsville Baptist Church was established in 1848.
In the late 1800s, the town began to decline as the railroad bypassed it. The population decreased, and the town became a quiet, rural community.
Geography
Withamsville is located in the southeastern corner of Ohio, in Clermont County. It is situated along the Ohio River, just south of the city of Cincinnati. The town is surrounded by rolling hills and farmland. The nearest major city is Cincinnati, which is located about 20 miles to the north.
The climate in Withamsville is humid continental, with hot summers and cold winters. The average annual temperature is around 50 degrees Fahrenheit. The average annual precipitation is around 40 inches.
Economy
The economy of Withamsville is largely based on agriculture. The town is home to several farms, which produce a variety of crops, including corn, soybeans, wheat, and hay. The town also has a few small businesses, including a general store, a gas station, and a few restaurants.
Demographics
As of the 2010 census, the population of Withamsville was 1,072. The racial makeup of the town was 97.3% White, 0.9% African American, 0.3% Native American, 0.2% Asian, and 1.3% from other races. The median household income was $45,000, and the median family income was $50,000.
The town is served by the Withamsville-Tobasco Elementary School, which is part of the West Clermont Local School District. The town also has a public library, which is part of the Clermont County Public Library system.
Withamsville is a small, rural community with a rich history and a strong sense of community. The town is home to a variety of businesses and organizations, and it is a great place to live and raise a family.
Common Questions
What is Per Capita Income in Withamsville?
Per Capita income in Withamsville is $32,912.
What is the Median Family Income in Withamsville?
Median Family Income in Withamsville is $77,917.
What is the Median Household income in Withamsville?
Median Household Income in Withamsville is $64,592.
What is Income or Wage Gap in Withamsville?
Income or Wage Gap in Withamsville is 22.0%.
Women in Withamsville earn 78.0 cents for every dollar earned by a man.
What is Inequality or Gini Index in Withamsville?
Inequality or Gini Index in Withamsville is 0.41.
What is the Total Population of Withamsville?
Total Population of Withamsville is 7,803.
What is the Total Male Population of Withamsville?
Total Male Population of Withamsville is 3,330.
What is the Total Female Population of Withamsville?
Total Female Population of Withamsville is 4,473.
What is the Ratio of Males per 100 Females in Withamsville?
There are 74.45 Males per 100 Females in Withamsville.
What is the Ratio of Females per 100 Males in Withamsville?
There are 134.32 Females per 100 Males in Withamsville.
What is the Median Population Age in Withamsville?
Median Population Age in Withamsville is 41.2 Years.
What is the Average Family Size in Withamsville
Average Family Size in Withamsville is 2.8 People.
What is the Average Household Size in Withamsville
Average Household Size in Withamsville is 2.3 People.
How Large is the Labor Force in Withamsville?
There are 4,108 People in the Labor Forcein in Withamsville.
What is the Percentage of People in the Labor Force in Withamsville?
62.6% of People are in the Labor Force in Withamsville.
What is the Unemployment Rate in Withamsville?
Unemployment Rate in Withamsville is 2.4%.