South Lockport, NY Map & Demographics
South Lockport Map
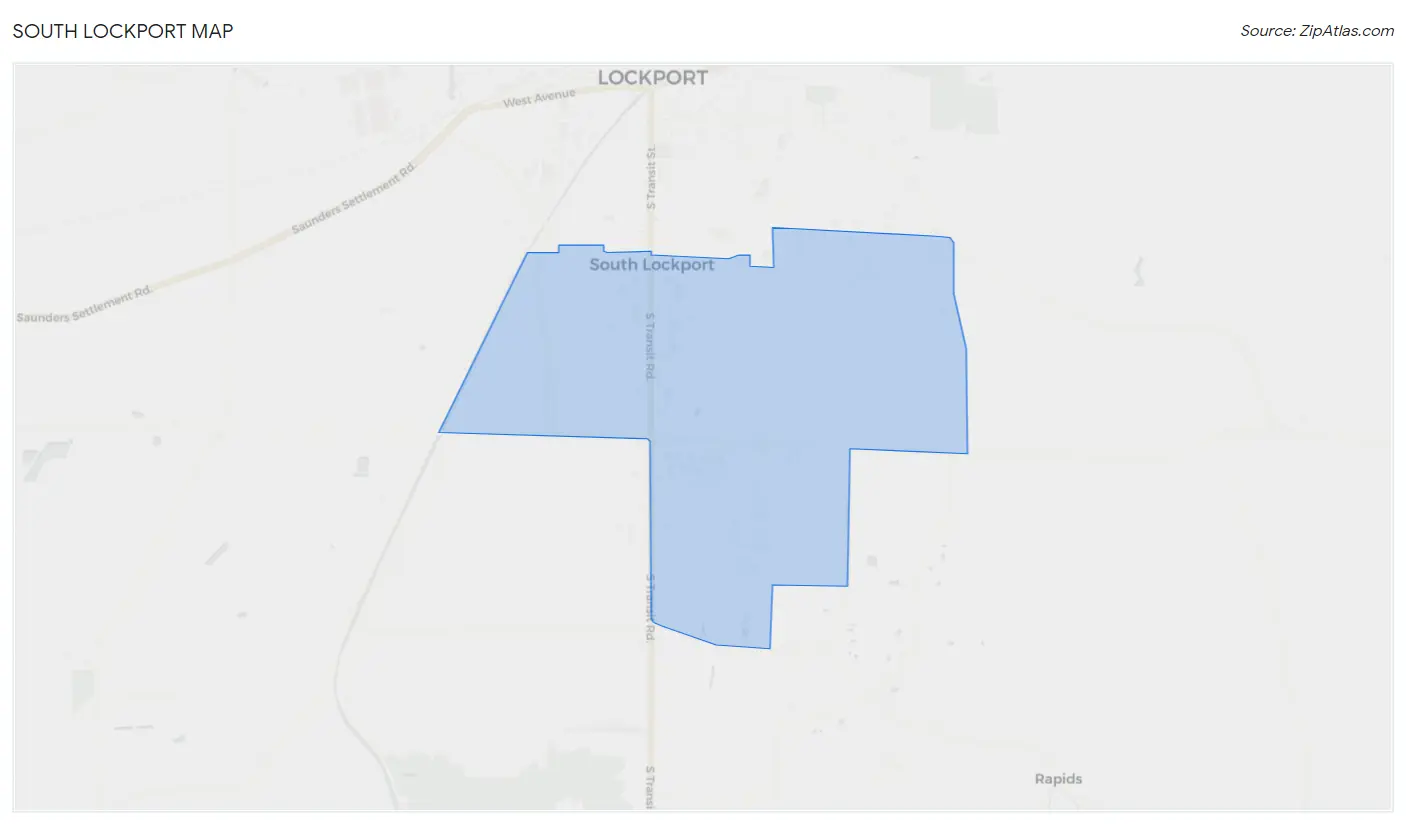
South Lockport Overview
$33,610
PER CAPITA INCOME
$81,545
AVG FAMILY INCOME
$48,274
AVG HOUSEHOLD INCOME
26.3%
WAGE / INCOME GAP [ % ]
73.7¢/ $1
WAGE / INCOME GAP [ $ ]
0.45
INEQUALITY / GINI INDEX
8,403
TOTAL POPULATION
4,168
MALE POPULATION
4,235
FEMALE POPULATION
98.42
MALES / 100 FEMALES
101.61
FEMALES / 100 MALES
44.7
MEDIAN AGE
2.9
AVG FAMILY SIZE
2.1
AVG HOUSEHOLD SIZE
4,512
LABOR FORCE [ PEOPLE ]
63.3%
PERCENT IN LABOR FORCE
7.2%
UNEMPLOYMENT RATE
Income in South Lockport
Income Overview in South Lockport
Per Capita Income in South Lockport is $33,610, while median incomes of families and households are $81,545 and $48,274 respectively.
| Characteristic | Number | Measure |
| Per Capita Income | 8,403 | $33,610 |
| Median Family Income | 2,035 | $81,545 |
| Mean Family Income | 2,035 | $98,397 |
| Median Household Income | 3,927 | $48,274 |
| Mean Household Income | 3,927 | $71,652 |
| Income Deficit | 2,035 | $0 |
| Wage / Income Gap (%) | 8,403 | 26.34% |
| Wage / Income Gap ($) | 8,403 | 73.66¢ per $1 |
| Gini / Inequality Index | 8,403 | 0.45 |
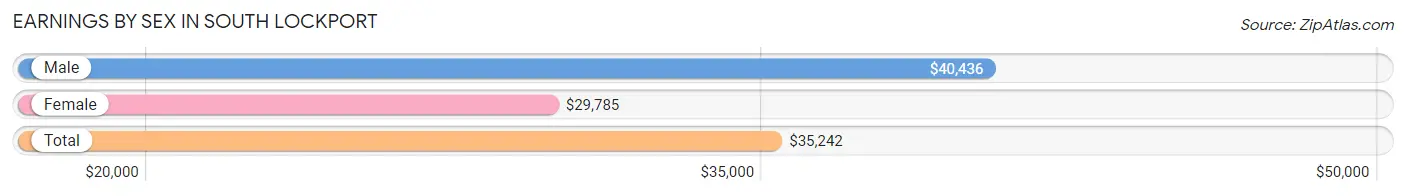
Earnings by Sex in South Lockport
Average Earnings in South Lockport are $35,242, $40,436 for men and $29,785 for women, a difference of 26.3%.
| Sex | Number | Average Earnings |
| Male | 2,304 (49.6%) | $40,436 |
| Female | 2,343 (50.4%) | $29,785 |
| Total | 4,647 (100.0%) | $35,242 |
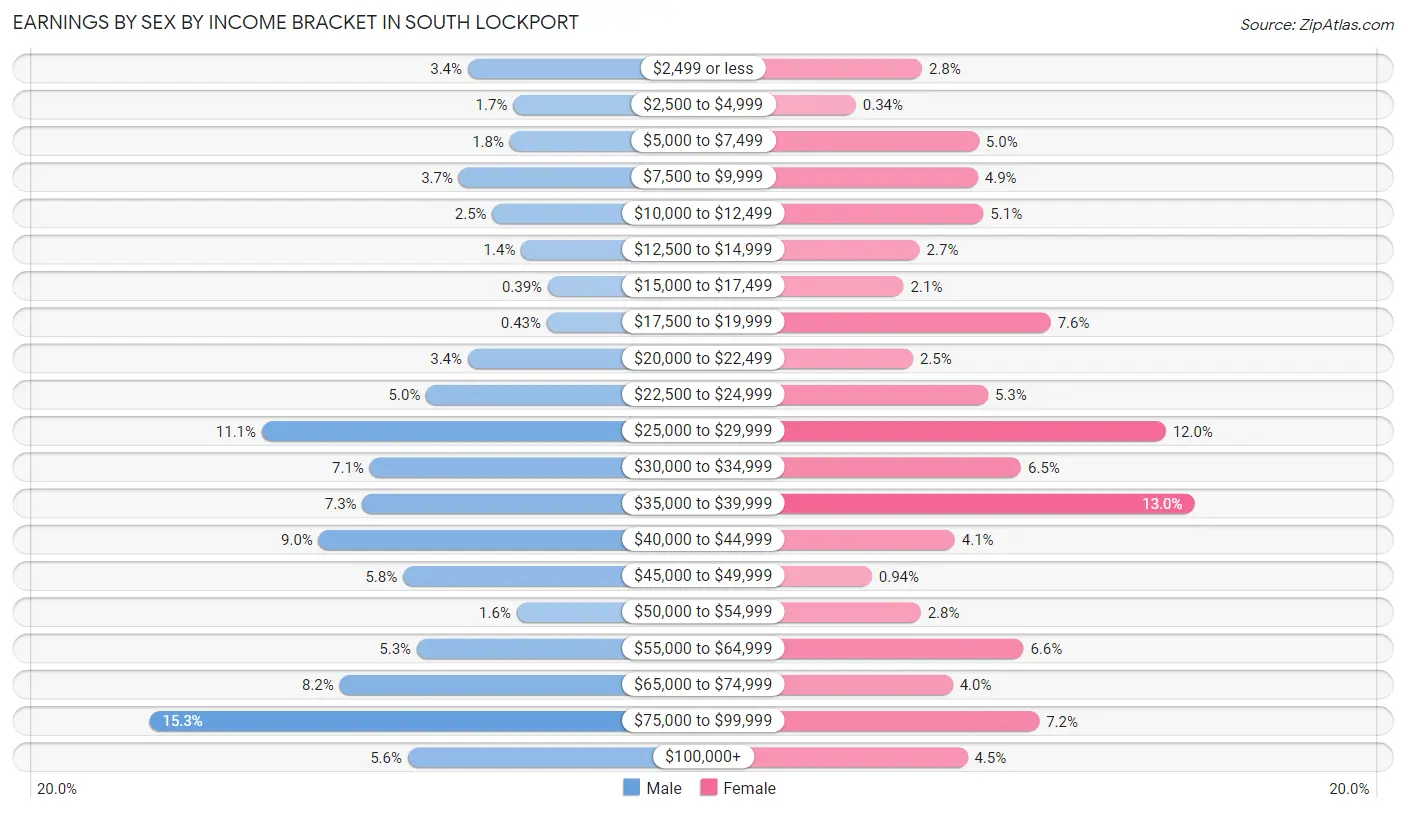
Earnings by Sex by Income Bracket in South Lockport
The most common earnings brackets in South Lockport are $75,000 to $99,999 for men (353 | 15.3%) and $35,000 to $39,999 for women (305 | 13.0%).
| Income | Male | Female |
| $2,499 or less | 78 (3.4%) | 66 (2.8%) |
| $2,500 to $4,999 | 39 (1.7%) | 8 (0.3%) |
| $5,000 to $7,499 | 42 (1.8%) | 116 (5.0%) |
| $7,500 to $9,999 | 86 (3.7%) | 115 (4.9%) |
| $10,000 to $12,499 | 57 (2.5%) | 120 (5.1%) |
| $12,500 to $14,999 | 32 (1.4%) | 64 (2.7%) |
| $15,000 to $17,499 | 9 (0.4%) | 50 (2.1%) |
| $17,500 to $19,999 | 10 (0.4%) | 179 (7.6%) |
| $20,000 to $22,499 | 78 (3.4%) | 58 (2.5%) |
| $22,500 to $24,999 | 114 (5.0%) | 124 (5.3%) |
| $25,000 to $29,999 | 256 (11.1%) | 280 (11.9%) |
| $30,000 to $34,999 | 163 (7.1%) | 153 (6.5%) |
| $35,000 to $39,999 | 169 (7.3%) | 305 (13.0%) |
| $40,000 to $44,999 | 207 (9.0%) | 95 (4.1%) |
| $45,000 to $49,999 | 134 (5.8%) | 22 (0.9%) |
| $50,000 to $54,999 | 36 (1.6%) | 65 (2.8%) |
| $55,000 to $64,999 | 122 (5.3%) | 155 (6.6%) |
| $65,000 to $74,999 | 189 (8.2%) | 93 (4.0%) |
| $75,000 to $99,999 | 353 (15.3%) | 169 (7.2%) |
| $100,000+ | 130 (5.6%) | 106 (4.5%) |
| Total | 2,304 (100.0%) | 2,343 (100.0%) |
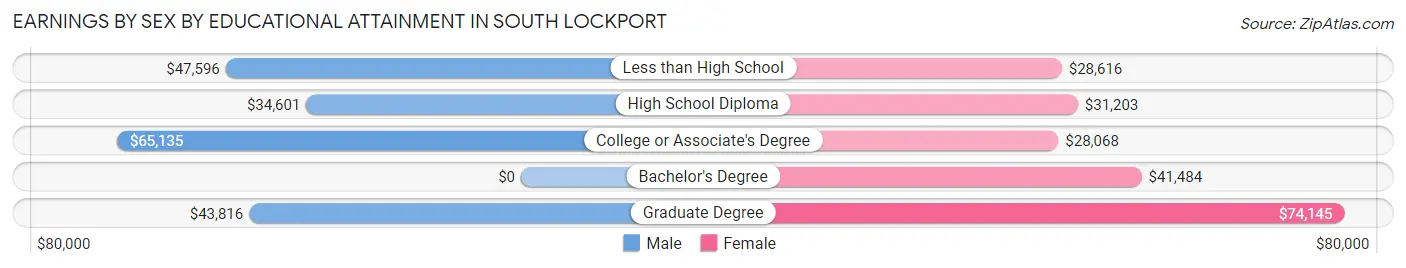
Earnings by Sex by Educational Attainment in South Lockport
Average earnings in South Lockport are $45,329 for men and $35,396 for women, a difference of 21.9%. Men with an educational attainment of college or associate's degree enjoy the highest average annual earnings of $65,135, while those with high school diploma education earn the least with $34,601. Women with an educational attainment of graduate degree earn the most with the average annual earnings of $74,145, while those with college or associate's degree education have the smallest earnings of $28,068.
| Educational Attainment | Male Income | Female Income |
| Less than High School | $47,596 | $28,616 |
| High School Diploma | $34,601 | $31,203 |
| College or Associate's Degree | $65,135 | $28,068 |
| Bachelor's Degree | - | - |
| Graduate Degree | $43,816 | $74,145 |
| Total | $45,329 | $35,396 |
Family Income in South Lockport
Family Income Brackets in South Lockport
According to the South Lockport family income data, there are 348 families falling into the $150,000 to $199,999 income range, which is the most common income bracket and makes up 17.1% of all families. Conversely, the $10,000 to $14,999 income bracket is the least frequent group with only 41 families (2.0%) belonging to this category.
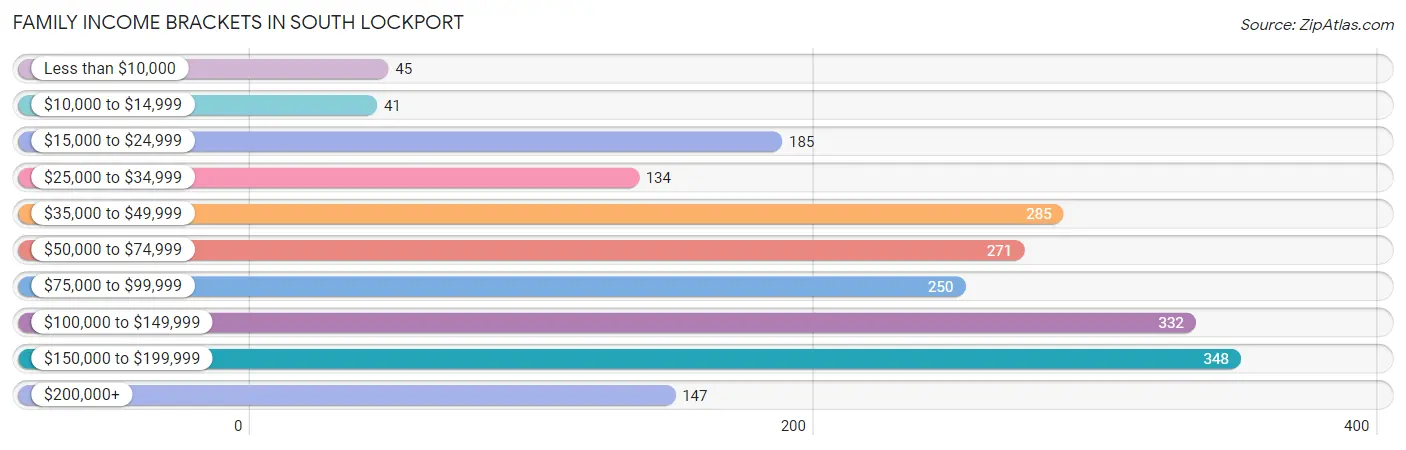
| Income Bracket | # Families | % Families |
| Less than $10,000 | 45 | 2.2% |
| $10,000 to $14,999 | 41 | 2.0% |
| $15,000 to $24,999 | 185 | 9.1% |
| $25,000 to $34,999 | 134 | 6.6% |
| $35,000 to $49,999 | 285 | 14.0% |
| $50,000 to $74,999 | 271 | 13.3% |
| $75,000 to $99,999 | 250 | 12.3% |
| $100,000 to $149,999 | 332 | 16.3% |
| $150,000 to $199,999 | 348 | 17.1% |
| $200,000+ | 147 | 7.2% |
Family Income by Famaliy Size in South Lockport
4-person families (292 | 14.3%) account for the highest median family income in South Lockport with $148,500 per family, while 4-person families (292 | 14.3%) have the highest median income of $37,125 per family member.
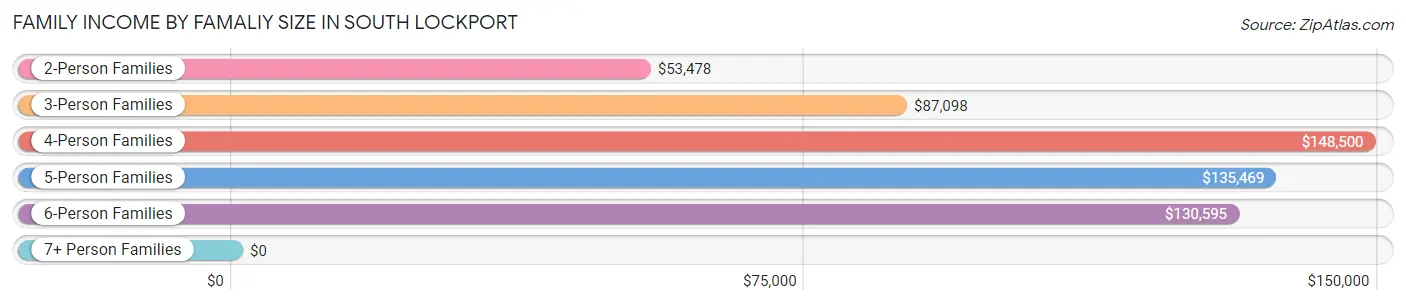
| Income Bracket | # Families | Median Income |
| 2-Person Families | 1,066 (52.4%) | $53,478 |
| 3-Person Families | 535 (26.3%) | $87,098 |
| 4-Person Families | 292 (14.3%) | $148,500 |
| 5-Person Families | 67 (3.3%) | $135,469 |
| 6-Person Families | 64 (3.1%) | $130,595 |
| 7+ Person Families | 11 (0.5%) | $0 |
| Total | 2,035 (100.0%) | $81,545 |
Family Income by Number of Earners in South Lockport
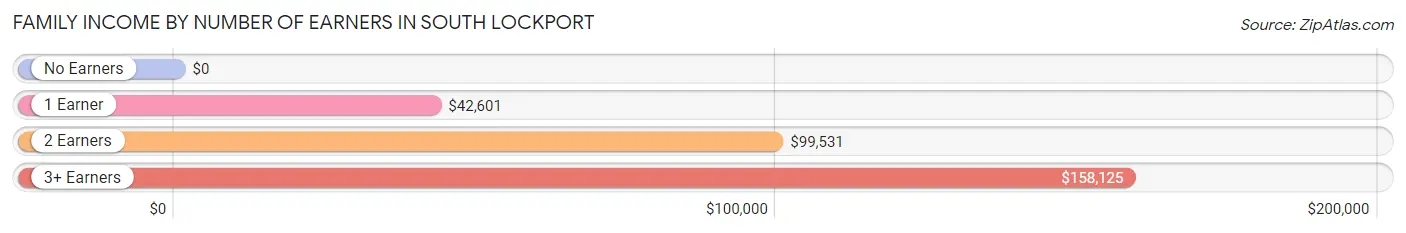
| Number of Earners | # Families | Median Income |
| No Earners | 347 (17.1%) | $0 |
| 1 Earner | 709 (34.8%) | $42,601 |
| 2 Earners | 666 (32.7%) | $99,531 |
| 3+ Earners | 313 (15.4%) | $158,125 |
| Total | 2,035 (100.0%) | $81,545 |
Household Income in South Lockport
Household Income Brackets in South Lockport
With 715 households falling in the category, the $35,000 to $49,999 income range is the most frequent in South Lockport, accounting for 18.2% of all households. In contrast, only 145 households (3.7%) fall into the $200,000+ income bracket, making it the least populous group.
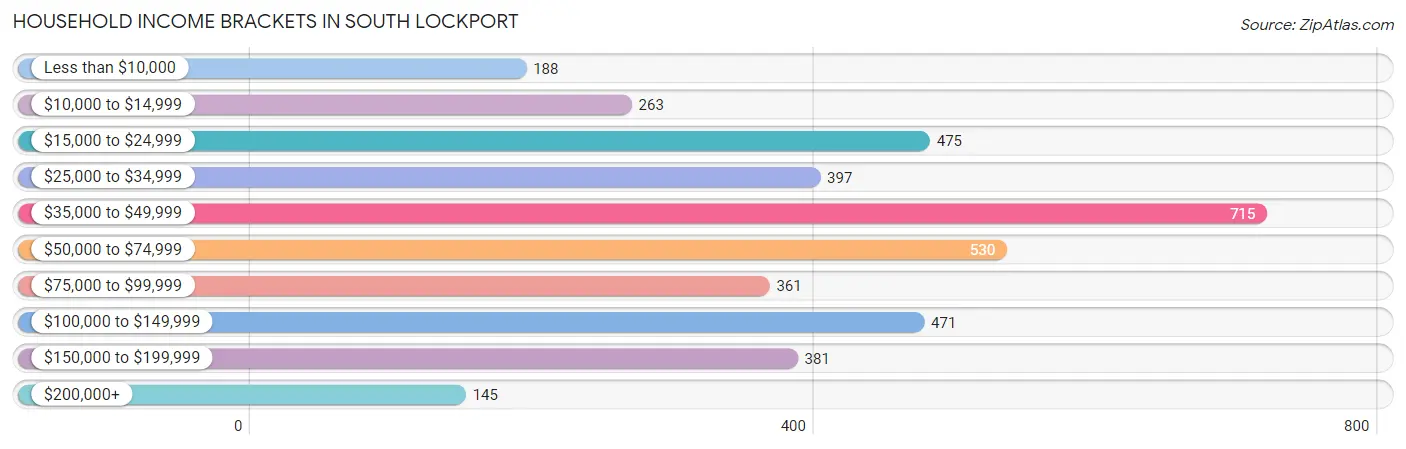
| Income Bracket | # Households | % Households |
| Less than $10,000 | 188 | 4.8% |
| $10,000 to $14,999 | 263 | 6.7% |
| $15,000 to $24,999 | 475 | 12.1% |
| $25,000 to $34,999 | 397 | 10.1% |
| $35,000 to $49,999 | 715 | 18.2% |
| $50,000 to $74,999 | 530 | 13.5% |
| $75,000 to $99,999 | 361 | 9.2% |
| $100,000 to $149,999 | 471 | 12.0% |
| $150,000 to $199,999 | 381 | 9.7% |
| $200,000+ | 145 | 3.7% |
Household Income by Householder Age in South Lockport
The median household income in South Lockport is $48,274, with the highest median household income of $66,786 found in the 45 to 64 years age bracket for the primary householder. A total of 1,768 households (45.0%) fall into this category. Meanwhile, the 25 to 44 years age bracket for the primary householder has the lowest median household income of $43,136, with 964 households (24.5%) in this group.
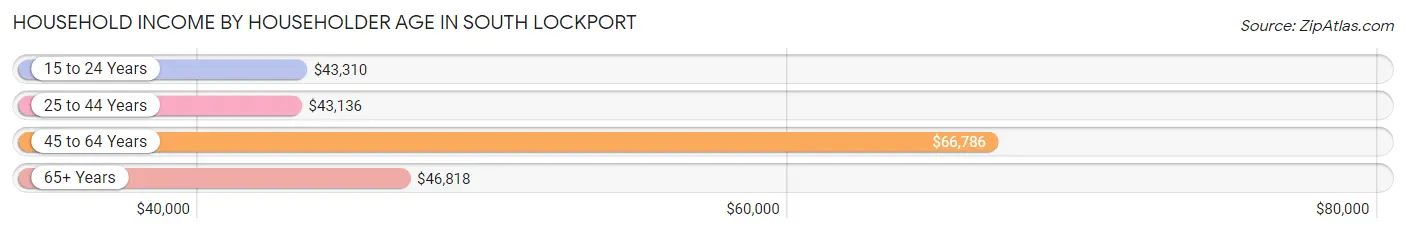
| Income Bracket | # Households | Median Income |
| 15 to 24 Years | 241 (6.1%) | $43,310 |
| 25 to 44 Years | 964 (24.5%) | $43,136 |
| 45 to 64 Years | 1,768 (45.0%) | $66,786 |
| 65+ Years | 954 (24.3%) | $46,818 |
| Total | 3,927 (100.0%) | $48,274 |
Poverty in South Lockport
Income Below Poverty by Sex and Age in South Lockport
With 9.3% poverty level for males and 13.6% for females among the residents of South Lockport, 35 to 44 year old males and 25 to 34 year old females are the most vulnerable to poverty, with 100 males (19.4%) and 121 females (24.6%) in their respective age groups living below the poverty level.
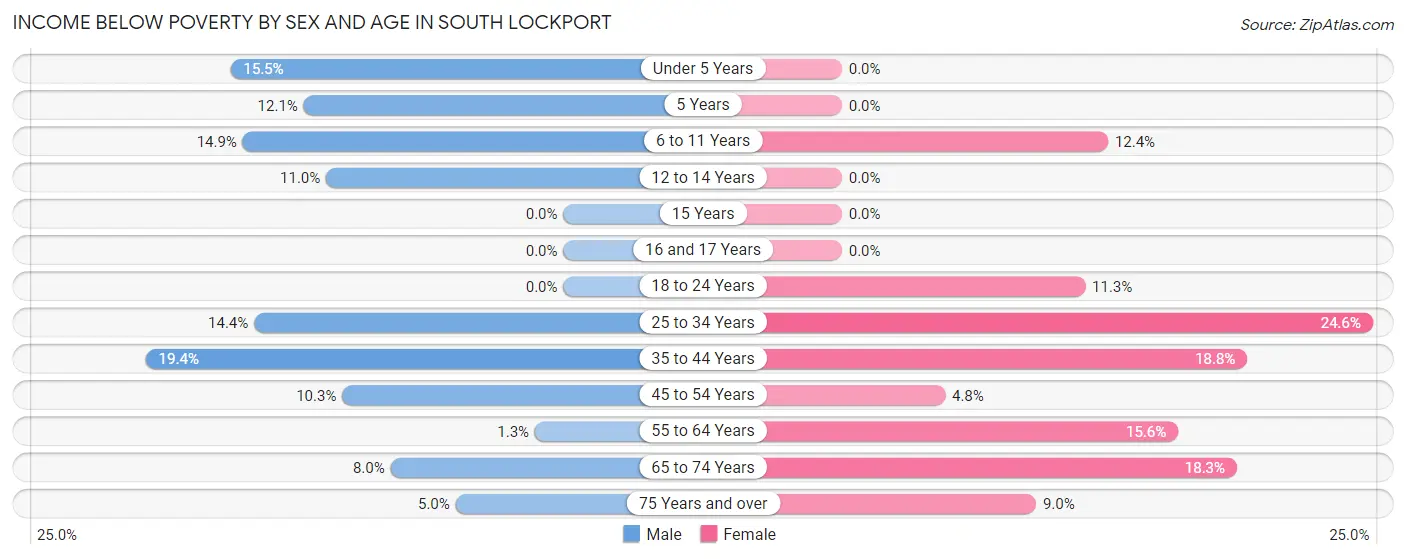
| Age Bracket | Male | Female |
| Under 5 Years | 38 (15.4%) | 0 (0.0%) |
| 5 Years | 10 (12.0%) | 0 (0.0%) |
| 6 to 11 Years | 32 (14.9%) | 30 (12.3%) |
| 12 to 14 Years | 12 (11.0%) | 0 (0.0%) |
| 15 Years | 0 (0.0%) | 0 (0.0%) |
| 16 and 17 Years | 0 (0.0%) | 0 (0.0%) |
| 18 to 24 Years | 0 (0.0%) | 55 (11.3%) |
| 25 to 34 Years | 66 (14.3%) | 121 (24.6%) |
| 35 to 44 Years | 100 (19.4%) | 98 (18.8%) |
| 45 to 54 Years | 76 (10.3%) | 24 (4.8%) |
| 55 to 64 Years | 9 (1.3%) | 122 (15.6%) |
| 65 to 74 Years | 30 (8.0%) | 90 (18.3%) |
| 75 Years and over | 13 (5.0%) | 31 (9.0%) |
| Total | 386 (9.3%) | 571 (13.6%) |
Income Above Poverty by Sex and Age in South Lockport
According to the poverty statistics in South Lockport, males aged 16 and 17 years and females aged under 5 years are the age groups that are most secure financially, with 100.0% of males and 100.0% of females in these age groups living above the poverty line.
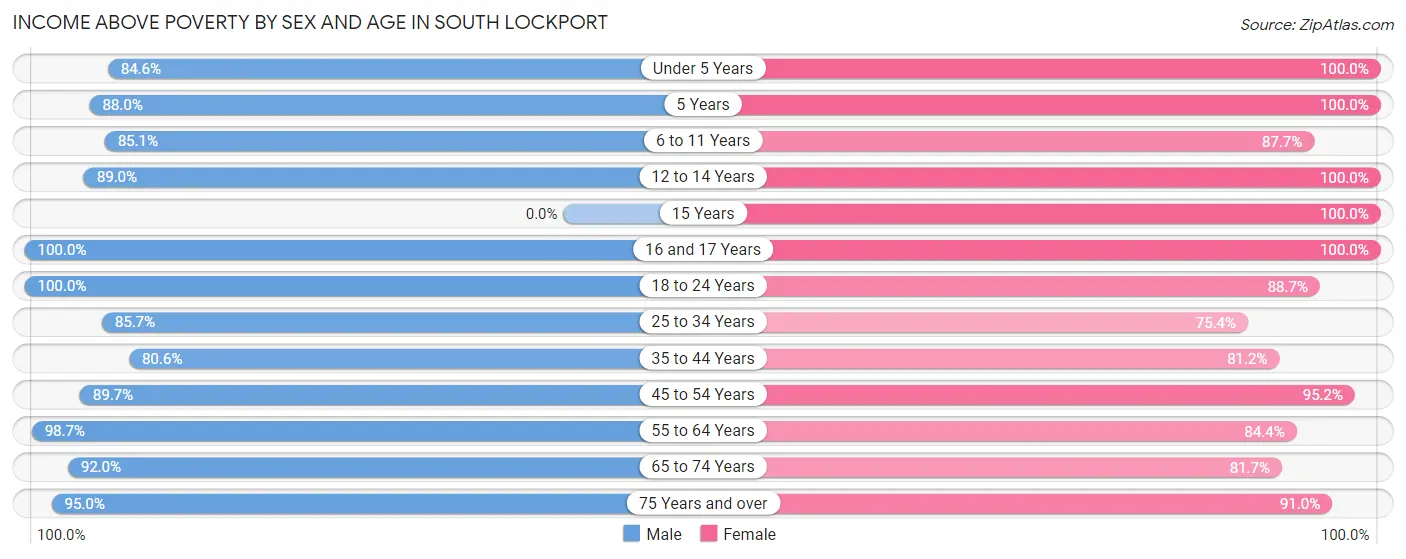
| Age Bracket | Male | Female |
| Under 5 Years | 208 (84.6%) | 88 (100.0%) |
| 5 Years | 73 (87.9%) | 12 (100.0%) |
| 6 to 11 Years | 183 (85.1%) | 213 (87.6%) |
| 12 to 14 Years | 97 (89.0%) | 162 (100.0%) |
| 15 Years | 0 (0.0%) | 59 (100.0%) |
| 16 and 17 Years | 53 (100.0%) | 15 (100.0%) |
| 18 to 24 Years | 397 (100.0%) | 432 (88.7%) |
| 25 to 34 Years | 394 (85.7%) | 370 (75.4%) |
| 35 to 44 Years | 416 (80.6%) | 423 (81.2%) |
| 45 to 54 Years | 665 (89.7%) | 477 (95.2%) |
| 55 to 64 Years | 674 (98.7%) | 660 (84.4%) |
| 65 to 74 Years | 344 (92.0%) | 401 (81.7%) |
| 75 Years and over | 247 (95.0%) | 313 (91.0%) |
| Total | 3,751 (90.7%) | 3,625 (86.4%) |
Income Below Poverty Among Married-Couple Families in South Lockport
The poverty statistics for married-couple families in South Lockport show that 3.4% or 48 of the total 1,417 families live below the poverty line. Families with 1 or 2 children have the highest poverty rate of 4.5%, comprising of 14 families. On the other hand, families with 3 or 4 children have the lowest poverty rate of 0.0%, which includes 0 families.
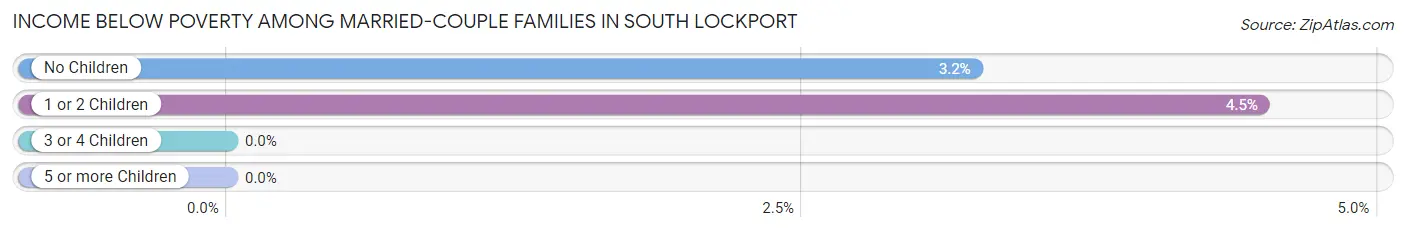
| Children | Above Poverty | Below Poverty |
| No Children | 1,015 (96.8%) | 34 (3.2%) |
| 1 or 2 Children | 298 (95.5%) | 14 (4.5%) |
| 3 or 4 Children | 56 (100.0%) | 0 (0.0%) |
| 5 or more Children | 0 (0.0%) | 0 (0.0%) |
| Total | 1,369 (96.6%) | 48 (3.4%) |
Income Below Poverty Among Single-Parent Households in South Lockport
According to the poverty data in South Lockport, 6.5% or 14 single-father households and 10.4% or 42 single-mother households are living below the poverty line. Among single-father households, those with 1 or 2 children have the highest poverty rate, with 14 households (8.4%) experiencing poverty. Likewise, among single-mother households, those with 3 or 4 children have the highest poverty rate, with 10 households (100.0%) falling below the poverty line.
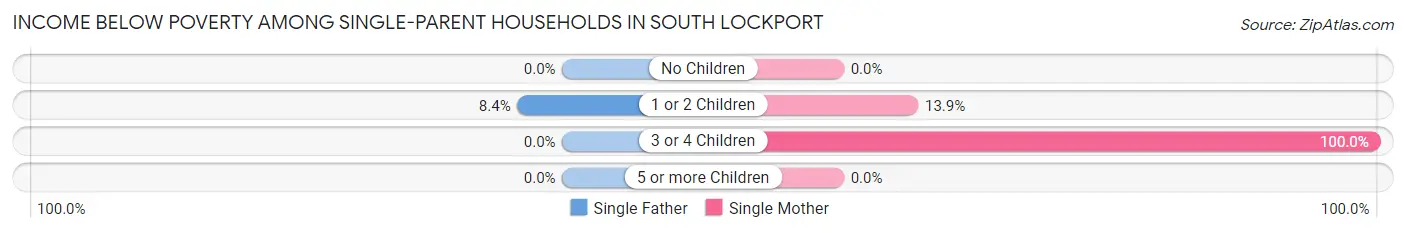
| Children | Single Father | Single Mother |
| No Children | 0 (0.0%) | 0 (0.0%) |
| 1 or 2 Children | 14 (8.4%) | 32 (13.9%) |
| 3 or 4 Children | 0 (0.0%) | 10 (100.0%) |
| 5 or more Children | 0 (0.0%) | 0 (0.0%) |
| Total | 14 (6.5%) | 42 (10.4%) |
Income Below Poverty Among Married-Couple vs Single-Parent Households in South Lockport
The poverty data for South Lockport shows that 48 of the married-couple family households (3.4%) and 56 of the single-parent households (9.1%) are living below the poverty level. Within the married-couple family households, those with 1 or 2 children have the highest poverty rate, with 14 households (4.5%) falling below the poverty line. Among the single-parent households, those with 3 or 4 children have the highest poverty rate, with 10 household (100.0%) living below poverty.
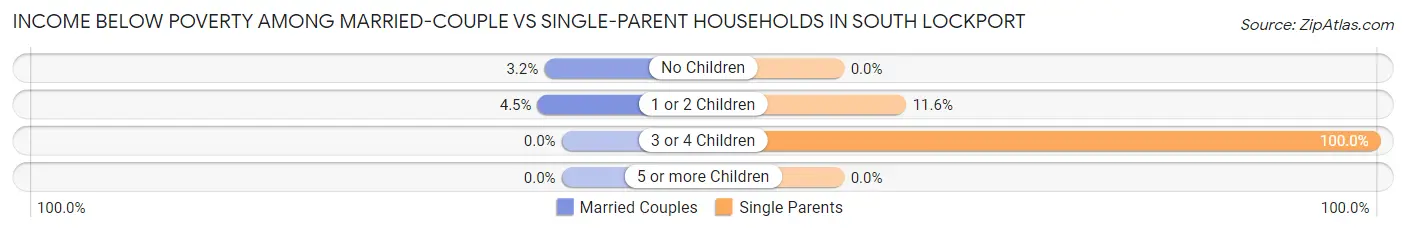
| Children | Married-Couple Families | Single-Parent Households |
| No Children | 34 (3.2%) | 0 (0.0%) |
| 1 or 2 Children | 14 (4.5%) | 46 (11.6%) |
| 3 or 4 Children | 0 (0.0%) | 10 (100.0%) |
| 5 or more Children | 0 (0.0%) | 0 (0.0%) |
| Total | 48 (3.4%) | 56 (9.1%) |
Race in South Lockport
The most populous races in South Lockport are White / Caucasian (7,290 | 86.8%), Two or more Races (466 | 5.6%), and Hispanic or Latino (307 | 3.6%).
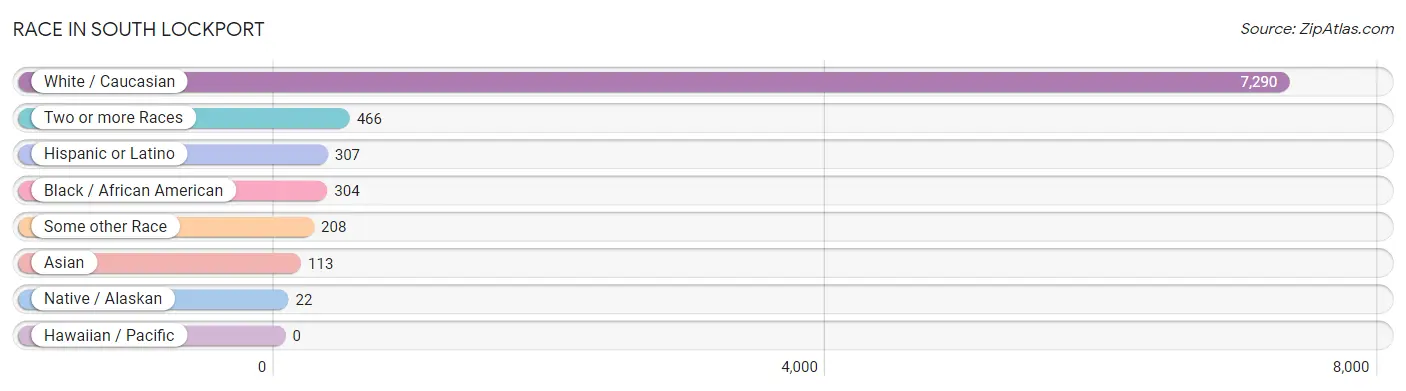
| Race | # Population | % Population |
| Asian | 113 | 1.3% |
| Black / African American | 304 | 3.6% |
| Hawaiian / Pacific | 0 | 0.0% |
| Hispanic or Latino | 307 | 3.6% |
| Native / Alaskan | 22 | 0.3% |
| White / Caucasian | 7,290 | 86.8% |
| Two or more Races | 466 | 5.6% |
| Some other Race | 208 | 2.5% |
| Total | 8,403 | 100.0% |
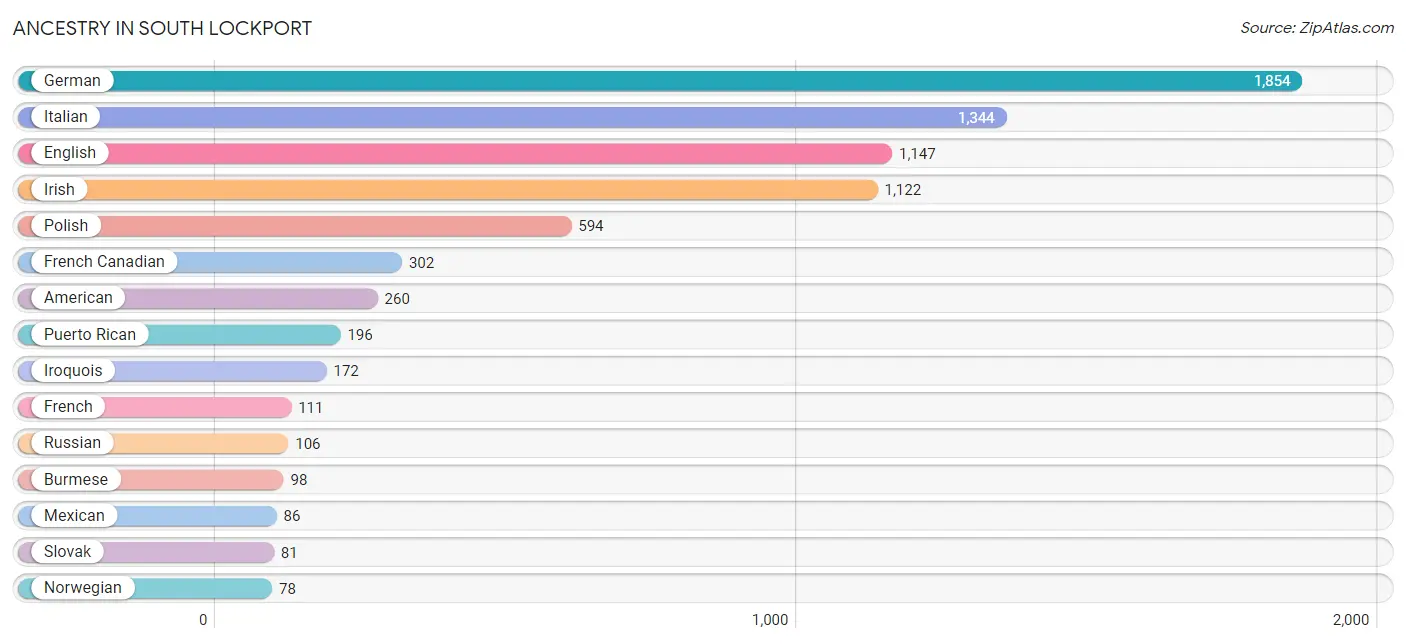
Ancestry in South Lockport
The most populous ancestries reported in South Lockport are German (1,854 | 22.1%), Italian (1,344 | 16.0%), English (1,147 | 13.7%), Irish (1,122 | 13.4%), and Polish (594 | 7.1%), together accounting for 72.1% of all South Lockport residents.
| Ancestry | # Population | % Population |
| American | 260 | 3.1% |
| Arab | 51 | 0.6% |
| Austrian | 8 | 0.1% |
| Bhutanese | 22 | 0.3% |
| British | 68 | 0.8% |
| Burmese | 98 | 1.2% |
| Canadian | 57 | 0.7% |
| Central American | 8 | 0.1% |
| Chippewa | 16 | 0.2% |
| Colombian | 11 | 0.1% |
| Czech | 33 | 0.4% |
| Danish | 22 | 0.3% |
| Dutch | 60 | 0.7% |
| Eastern European | 30 | 0.4% |
| English | 1,147 | 13.7% |
| European | 72 | 0.9% |
| French | 111 | 1.3% |
| French Canadian | 302 | 3.6% |
| German | 1,854 | 22.1% |
| Greek | 10 | 0.1% |
| Guatemalan | 8 | 0.1% |
| Hungarian | 12 | 0.1% |
| Irish | 1,122 | 13.4% |
| Iroquois | 172 | 2.1% |
| Italian | 1,344 | 16.0% |
| Jamaican | 27 | 0.3% |
| Korean | 77 | 0.9% |
| Lebanese | 51 | 0.6% |
| Mexican | 86 | 1.0% |
| Northern European | 24 | 0.3% |
| Norwegian | 78 | 0.9% |
| Polish | 594 | 7.1% |
| Puerto Rican | 196 | 2.3% |
| Romanian | 14 | 0.2% |
| Russian | 106 | 1.3% |
| Scandinavian | 24 | 0.3% |
| Scotch-Irish | 32 | 0.4% |
| Scottish | 16 | 0.2% |
| Slovak | 81 | 1.0% |
| South American | 11 | 0.1% |
| Spaniard | 6 | 0.1% |
| Sri Lankan | 57 | 0.7% |
| Swedish | 62 | 0.7% |
| Swiss | 12 | 0.1% |
| Ukrainian | 40 | 0.5% |
| Welsh | 19 | 0.2% |
| West Indian | 43 | 0.5% | View All 47 Rows |
Immigrants in South Lockport
The most numerous immigrant groups reported in South Lockport came from Europe (112 | 1.3%), Canada (103 | 1.2%), Latin America (99 | 1.2%), Caribbean (80 | 0.9%), and Jamaica (80 | 0.9%), together accounting for 5.6% of all South Lockport residents.
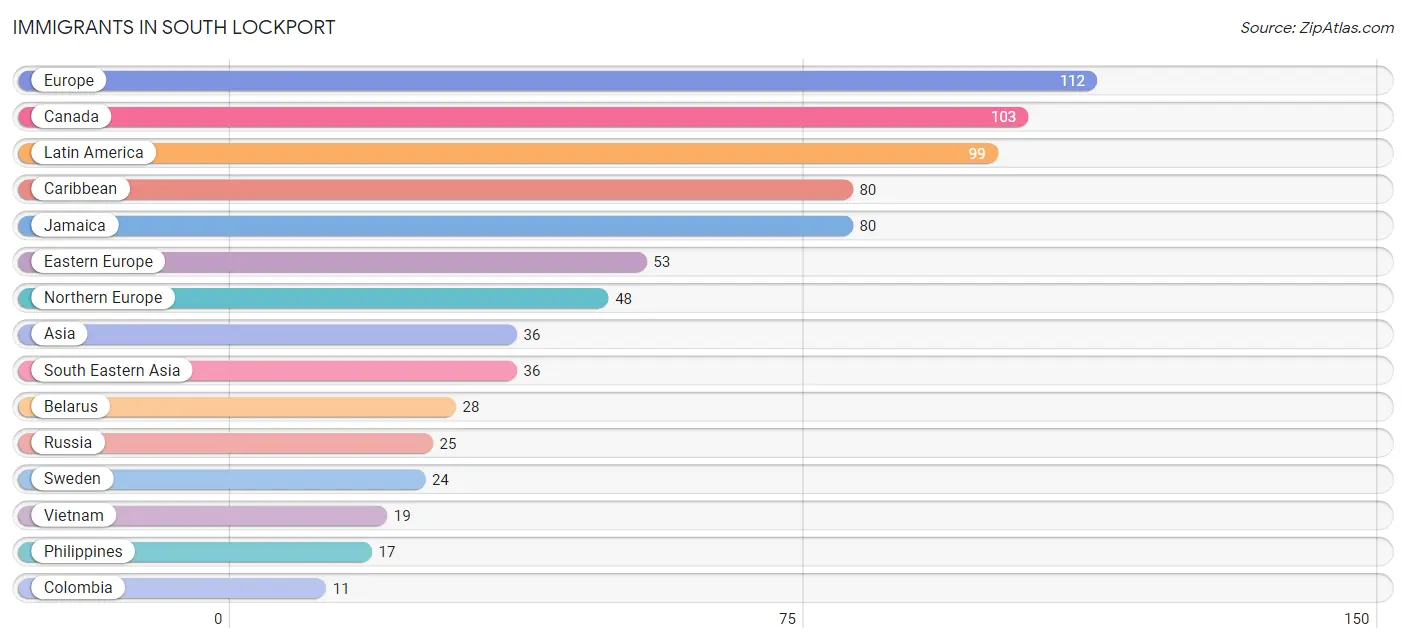
| Immigration Origin | # Population | % Population |
| Asia | 36 | 0.4% |
| Belarus | 28 | 0.3% |
| Canada | 103 | 1.2% |
| Caribbean | 80 | 0.9% |
| Central America | 8 | 0.1% |
| Colombia | 11 | 0.1% |
| Eastern Europe | 53 | 0.6% |
| Europe | 112 | 1.3% |
| France | 11 | 0.1% |
| Guatemala | 8 | 0.1% |
| Jamaica | 80 | 0.9% |
| Latin America | 99 | 1.2% |
| Northern Europe | 48 | 0.6% |
| Philippines | 17 | 0.2% |
| Russia | 25 | 0.3% |
| South America | 11 | 0.1% |
| South Eastern Asia | 36 | 0.4% |
| Sweden | 24 | 0.3% |
| Vietnam | 19 | 0.2% |
| Western Europe | 11 | 0.1% | View All 20 Rows |
Sex and Age in South Lockport
Sex and Age in South Lockport
The most populous age groups in South Lockport are 50 to 54 Years (433 | 10.4%) for men and 60 to 64 Years (418 | 9.9%) for women.
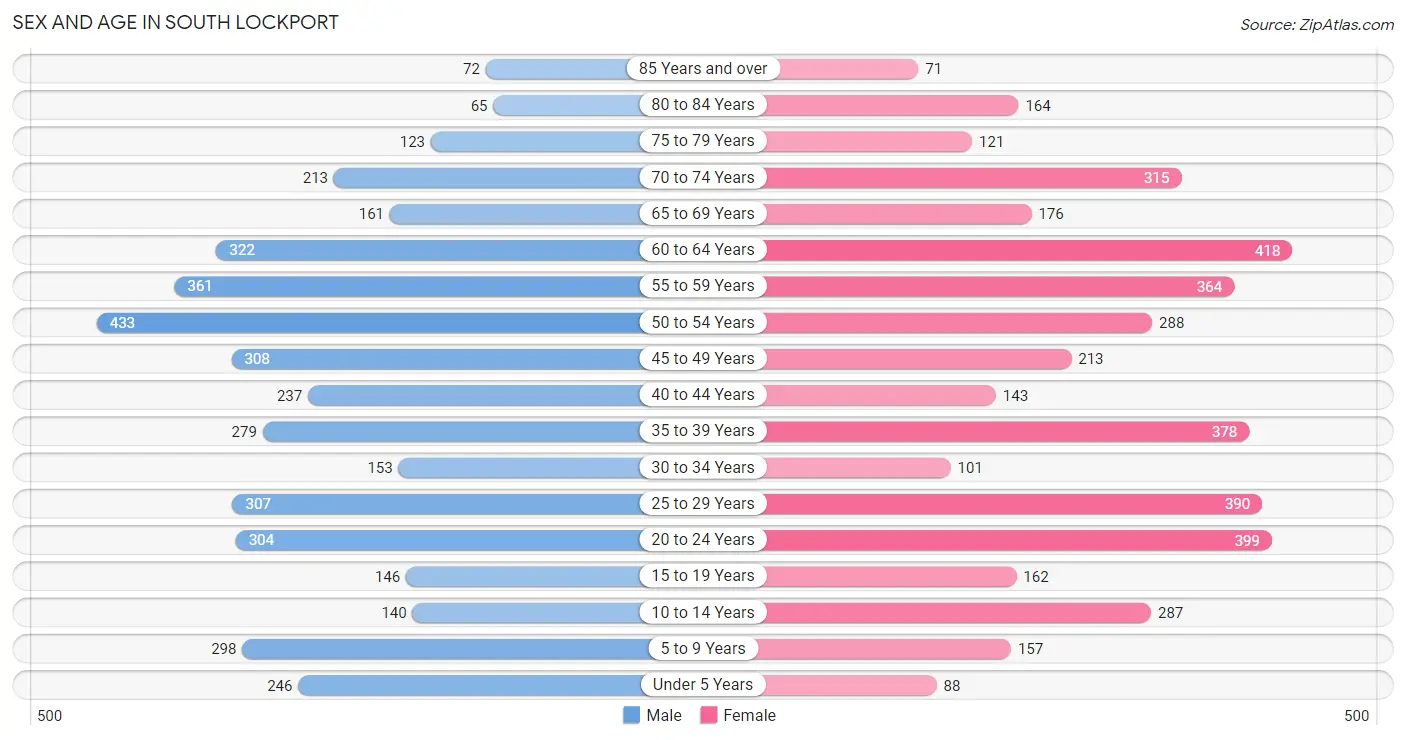
| Age Bracket | Male | Female |
| Under 5 Years | 246 (5.9%) | 88 (2.1%) |
| 5 to 9 Years | 298 (7.1%) | 157 (3.7%) |
| 10 to 14 Years | 140 (3.4%) | 287 (6.8%) |
| 15 to 19 Years | 146 (3.5%) | 162 (3.8%) |
| 20 to 24 Years | 304 (7.3%) | 399 (9.4%) |
| 25 to 29 Years | 307 (7.4%) | 390 (9.2%) |
| 30 to 34 Years | 153 (3.7%) | 101 (2.4%) |
| 35 to 39 Years | 279 (6.7%) | 378 (8.9%) |
| 40 to 44 Years | 237 (5.7%) | 143 (3.4%) |
| 45 to 49 Years | 308 (7.4%) | 213 (5.0%) |
| 50 to 54 Years | 433 (10.4%) | 288 (6.8%) |
| 55 to 59 Years | 361 (8.7%) | 364 (8.6%) |
| 60 to 64 Years | 322 (7.7%) | 418 (9.9%) |
| 65 to 69 Years | 161 (3.9%) | 176 (4.2%) |
| 70 to 74 Years | 213 (5.1%) | 315 (7.4%) |
| 75 to 79 Years | 123 (2.9%) | 121 (2.9%) |
| 80 to 84 Years | 65 (1.6%) | 164 (3.9%) |
| 85 Years and over | 72 (1.7%) | 71 (1.7%) |
| Total | 4,168 (100.0%) | 4,235 (100.0%) |
Families and Households in South Lockport
Median Family Size in South Lockport
The median family size in South Lockport is 2.89 persons per family, with single male/father families (214 | 10.5%) accounting for the largest median family size of 3.14 persons per family. On the other hand, married-couple families (1,417 | 69.6%) represent the smallest median family size with 2.84 persons per family.
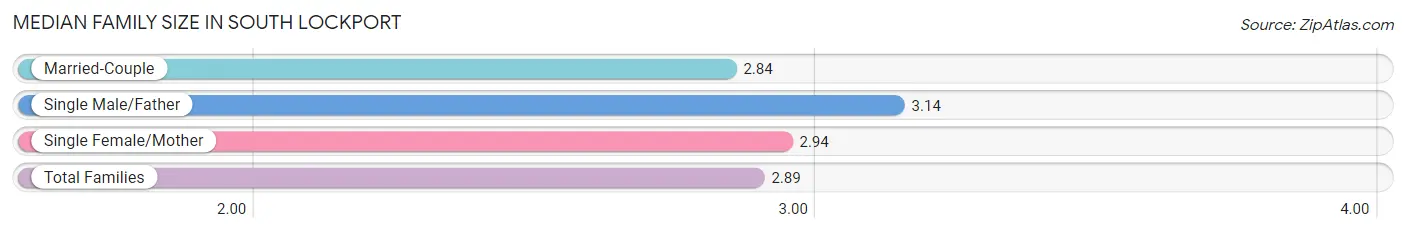
| Family Type | # Families | Family Size |
| Married-Couple | 1,417 (69.6%) | 2.84 |
| Single Male/Father | 214 (10.5%) | 3.14 |
| Single Female/Mother | 404 (19.9%) | 2.94 |
| Total Families | 2,035 (100.0%) | 2.89 |
Median Household Size in South Lockport
The median household size in South Lockport is 2.12 persons per household, with single male/father households (214 | 5.4%) accounting for the largest median household size of 3.87 persons per household. non-family households (1,892 | 48.2%) represent the smallest median household size with 1.18 persons per household.
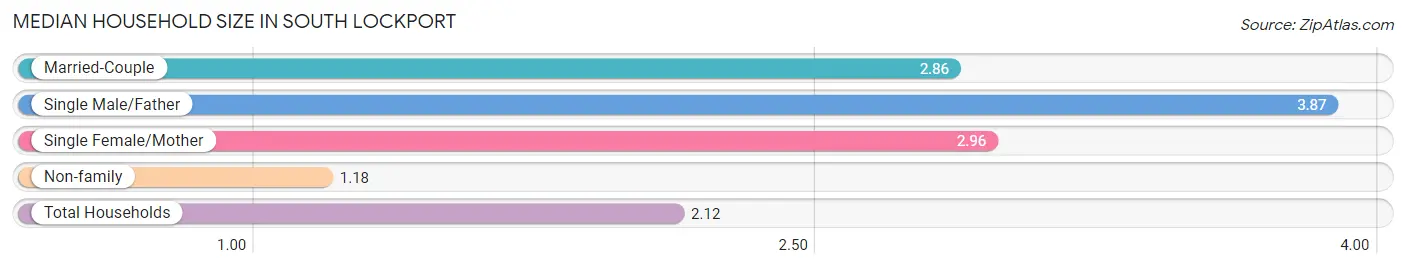
| Household Type | # Households | Household Size |
| Married-Couple | 1,417 (36.1%) | 2.86 |
| Single Male/Father | 214 (5.4%) | 3.87 |
| Single Female/Mother | 404 (10.3%) | 2.96 |
| Non-family | 1,892 (48.2%) | 1.18 |
| Total Households | 3,927 (100.0%) | 2.12 |
Household Size by Marriage Status in South Lockport
Out of a total of 3,927 households in South Lockport, 2,035 (51.8%) are family households, while 1,892 (48.2%) are nonfamily households. The most numerous type of family households are 2-person households, comprising 989, and the most common type of nonfamily households are 1-person households, comprising 1,563.
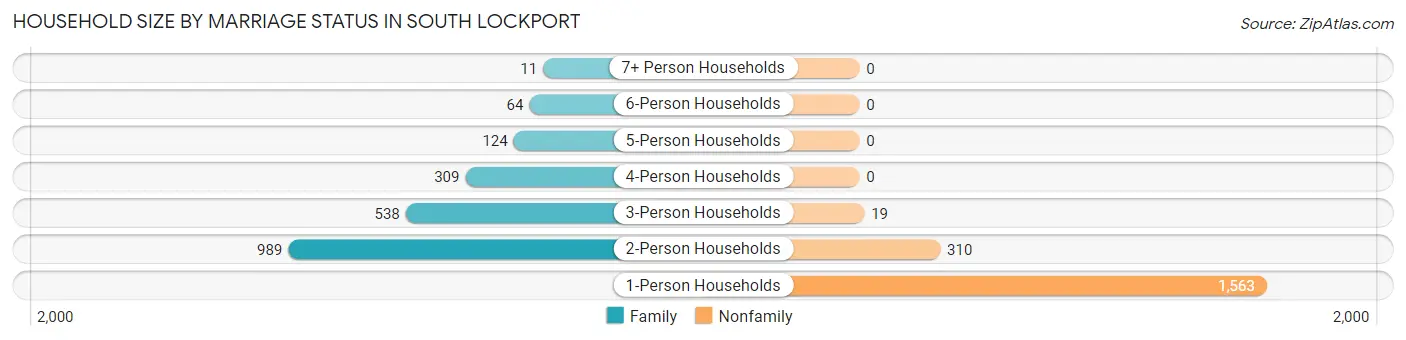
| Household Size | Family Households | Nonfamily Households |
| 1-Person Households | - | 1,563 (39.8%) |
| 2-Person Households | 989 (25.2%) | 310 (7.9%) |
| 3-Person Households | 538 (13.7%) | 19 (0.5%) |
| 4-Person Households | 309 (7.9%) | 0 (0.0%) |
| 5-Person Households | 124 (3.2%) | 0 (0.0%) |
| 6-Person Households | 64 (1.6%) | 0 (0.0%) |
| 7+ Person Households | 11 (0.3%) | 0 (0.0%) |
| Total | 2,035 (51.8%) | 1,892 (48.2%) |
Female Fertility in South Lockport
Fertility by Age in South Lockport
| Age Bracket | Women with Births | Births / 1,000 Women |
| 15 to 19 years | 0 (0.0%) | 0.0 |
| 20 to 34 years | 0 (0.0%) | 0.0 |
| 35 to 50 years | 0 (0.0%) | 0.0 |
| Total | 0 (0.0%) | 0.0 |
Fertility by Age by Marriage Status in South Lockport
| Age Bracket | Married | Unmarried |
| 15 to 19 years | 0 (0.0%) | 0 (0.0%) |
| 20 to 34 years | 0 (0.0%) | 0 (0.0%) |
| 35 to 50 years | 0 (0.0%) | 0 (0.0%) |
| Total | 0 (0.0%) | 0 (0.0%) |
Fertility by Education in South Lockport
| Educational Attainment | Women with Births | Births / 1,000 Women |
| Less than High School | 0 (0.0%) | 0.0 |
| High School Diploma | 0 (0.0%) | 0.0 |
| College or Associate's Degree | 0 (0.0%) | 0.0 |
| Bachelor's Degree | 0 (0.0%) | 0.0 |
| Graduate Degree | 0 (0.0%) | 0.0 |
| Total | 0 (0.0%) | 0.0 |
Fertility by Education by Marriage Status in South Lockport
| Educational Attainment | Married | Unmarried |
| Less than High School | 0 (0.0%) | 0 (0.0%) |
| High School Diploma | 0 (0.0%) | 0 (0.0%) |
| College or Associate's Degree | 0 (0.0%) | 0 (0.0%) |
| Bachelor's Degree | 0 (0.0%) | 0 (0.0%) |
| Graduate Degree | 0 (0.0%) | 0 (0.0%) |
| Total | 0 (0.0%) | 0 (0.0%) |
Employment Characteristics in South Lockport
Employment by Class of Employer in South Lockport
Among the 4,130 employed individuals in South Lockport, private company employees (2,902 | 70.3%), not-for-profit organizations (406 | 9.8%), and self-employed (not incorporated) (245 | 5.9%) make up the most common classes of employment.
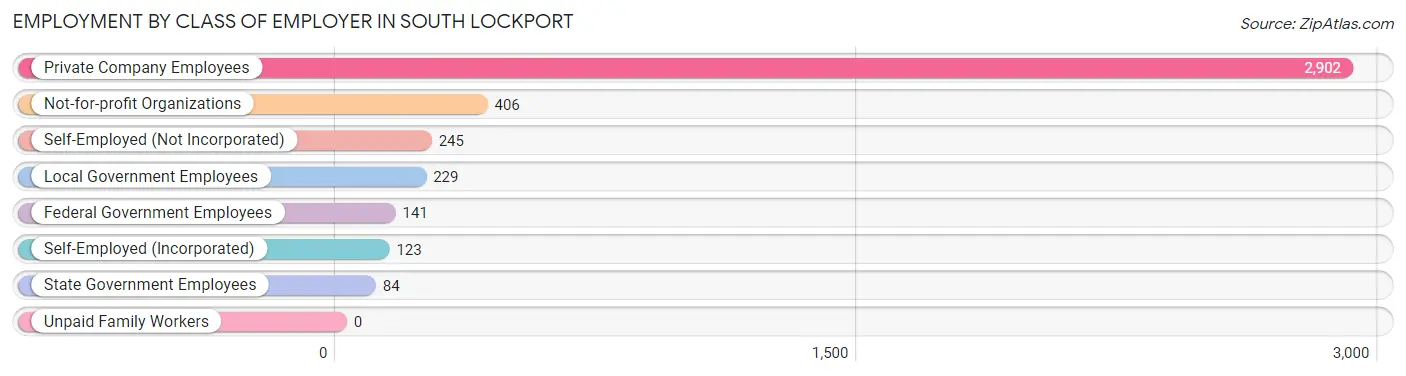
| Employer Class | # Employees | % Employees |
| Private Company Employees | 2,902 | 70.3% |
| Self-Employed (Incorporated) | 123 | 3.0% |
| Self-Employed (Not Incorporated) | 245 | 5.9% |
| Not-for-profit Organizations | 406 | 9.8% |
| Local Government Employees | 229 | 5.5% |
| State Government Employees | 84 | 2.0% |
| Federal Government Employees | 141 | 3.4% |
| Unpaid Family Workers | 0 | 0.0% |
| Total | 4,130 | 100.0% |
Employment Status by Age in South Lockport
According to the labor force statistics for South Lockport, out of the total population over 16 years of age (7,128), 63.3% or 4,512 individuals are in the labor force, with 7.2% or 325 of them unemployed. The age group with the highest labor force participation rate is 30 to 34 years, with 92.5% or 235 individuals in the labor force. Within the labor force, the 16 to 19 years age range has the highest percentage of unemployed individuals, with 32.5% or 67 of them being unemployed.
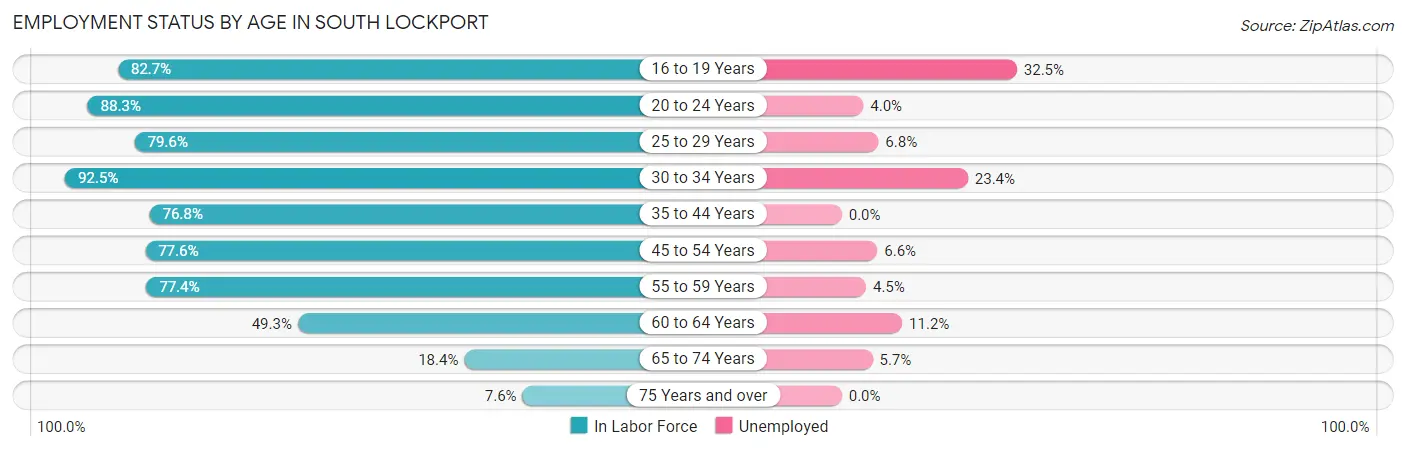
| Age Bracket | In Labor Force | Unemployed |
| 16 to 19 Years | 206 (82.7%) | 67 (32.5%) |
| 20 to 24 Years | 621 (88.3%) | 25 (4.0%) |
| 25 to 29 Years | 555 (79.6%) | 38 (6.8%) |
| 30 to 34 Years | 235 (92.5%) | 55 (23.4%) |
| 35 to 44 Years | 796 (76.8%) | 0 (0.0%) |
| 45 to 54 Years | 964 (77.6%) | 64 (6.6%) |
| 55 to 59 Years | 561 (77.4%) | 25 (4.5%) |
| 60 to 64 Years | 365 (49.3%) | 41 (11.2%) |
| 65 to 74 Years | 159 (18.4%) | 9 (5.7%) |
| 75 Years and over | 47 (7.6%) | 0 (0.0%) |
| Total | 4,512 (63.3%) | 325 (7.2%) |
Employment Status by Educational Attainment in South Lockport
According to labor force statistics for South Lockport, 74.0% of individuals (3,474) out of the total population between 25 and 64 years of age (4,695) are in the labor force, with 6.4% or 222 of them being unemployed. The group with the highest labor force participation rate are those with the educational attainment of college / associate degree, with 82.2% or 1,428 individuals in the labor force. Within the labor force, individuals with less than high school education have the highest percentage of unemployment, with 14.9% or 26 of them being unemployed.
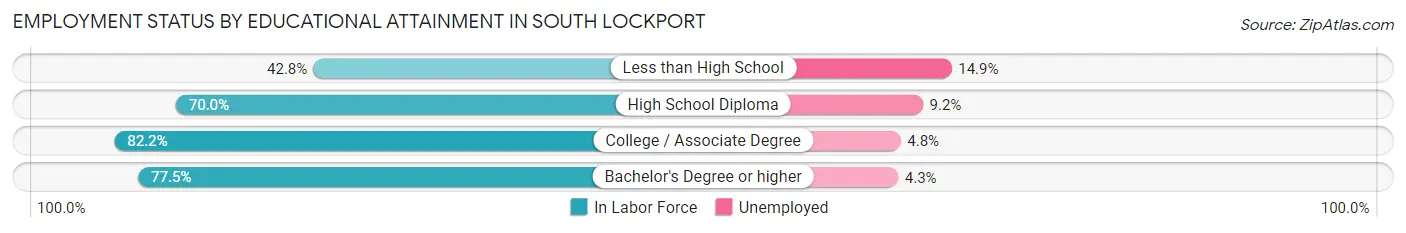
| Educational Attainment | In Labor Force | Unemployed |
| Less than High School | 174 (42.8%) | 61 (14.9%) |
| High School Diploma | 953 (70.0%) | 125 (9.2%) |
| College / Associate Degree | 1,428 (82.2%) | 83 (4.8%) |
| Bachelor's Degree or higher | 921 (77.5%) | 51 (4.3%) |
| Total | 3,474 (74.0%) | 300 (6.4%) |
Employment Occupations by Sex in South Lockport
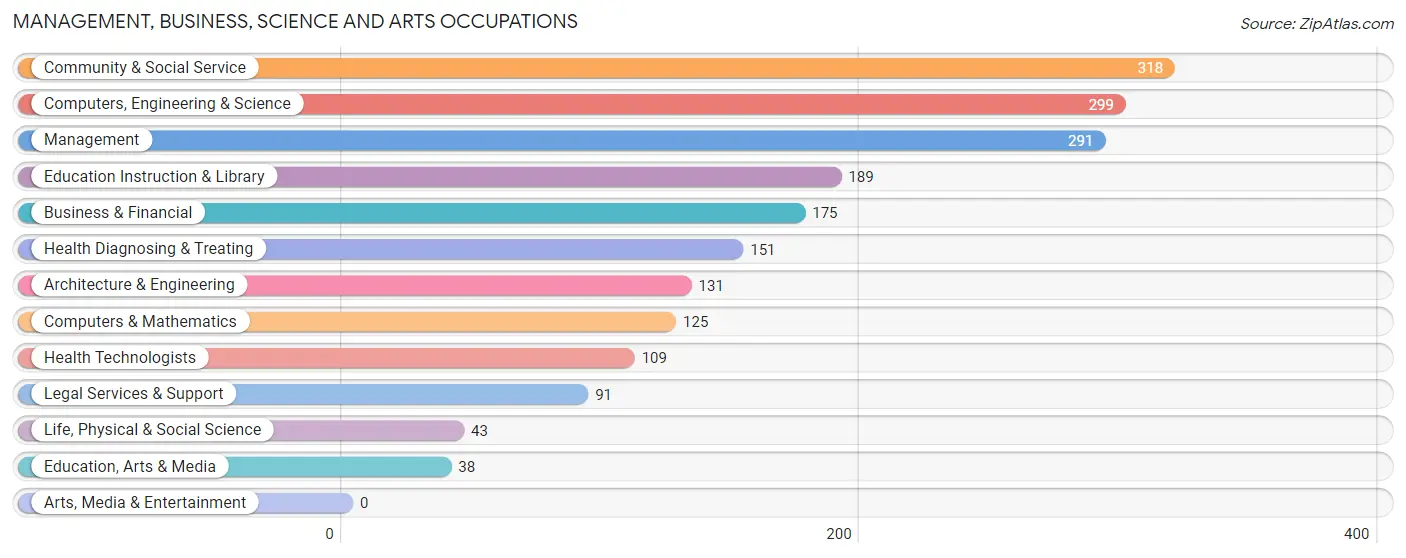
Management, Business, Science and Arts Occupations
The most common Management, Business, Science and Arts occupations in South Lockport are Community & Social Service (318 | 7.6%), Computers, Engineering & Science (299 | 7.2%), Management (291 | 7.0%), Education Instruction & Library (189 | 4.5%), and Business & Financial (175 | 4.2%).
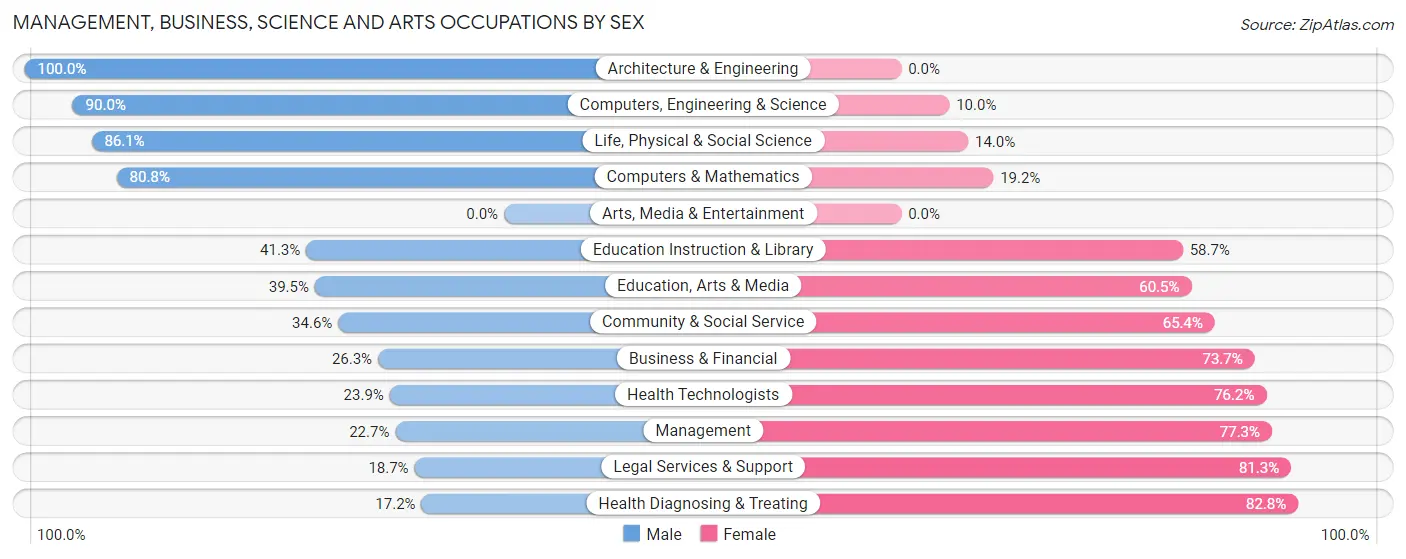
Management, Business, Science and Arts Occupations by Sex
Within the Management, Business, Science and Arts occupations in South Lockport, the most male-oriented occupations are Architecture & Engineering (100.0%), Computers, Engineering & Science (90.0%), and Life, Physical & Social Science (86.1%), while the most female-oriented occupations are Health Diagnosing & Treating (82.8%), Legal Services & Support (81.3%), and Management (77.3%).
| Occupation | Male | Female |
| Management | 66 (22.7%) | 225 (77.3%) |
| Business & Financial | 46 (26.3%) | 129 (73.7%) |
| Computers, Engineering & Science | 269 (90.0%) | 30 (10.0%) |
| Computers & Mathematics | 101 (80.8%) | 24 (19.2%) |
| Architecture & Engineering | 131 (100.0%) | 0 (0.0%) |
| Life, Physical & Social Science | 37 (86.1%) | 6 (14.0%) |
| Community & Social Service | 110 (34.6%) | 208 (65.4%) |
| Education, Arts & Media | 15 (39.5%) | 23 (60.5%) |
| Legal Services & Support | 17 (18.7%) | 74 (81.3%) |
| Education Instruction & Library | 78 (41.3%) | 111 (58.7%) |
| Arts, Media & Entertainment | 0 (0.0%) | 0 (0.0%) |
| Health Diagnosing & Treating | 26 (17.2%) | 125 (82.8%) |
| Health Technologists | 26 (23.8%) | 83 (76.1%) |
| Total (Category) | 517 (41.9%) | 717 (58.1%) |
| Total (Overall) | 1,948 (46.7%) | 2,222 (53.3%) |
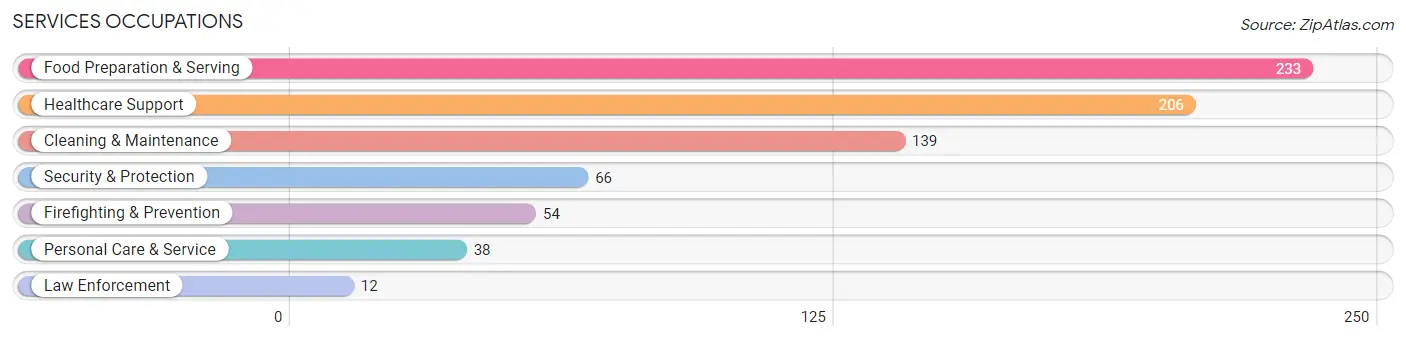
Services Occupations
The most common Services occupations in South Lockport are Food Preparation & Serving (233 | 5.6%), Healthcare Support (206 | 4.9%), Cleaning & Maintenance (139 | 3.3%), Security & Protection (66 | 1.6%), and Firefighting & Prevention (54 | 1.3%).
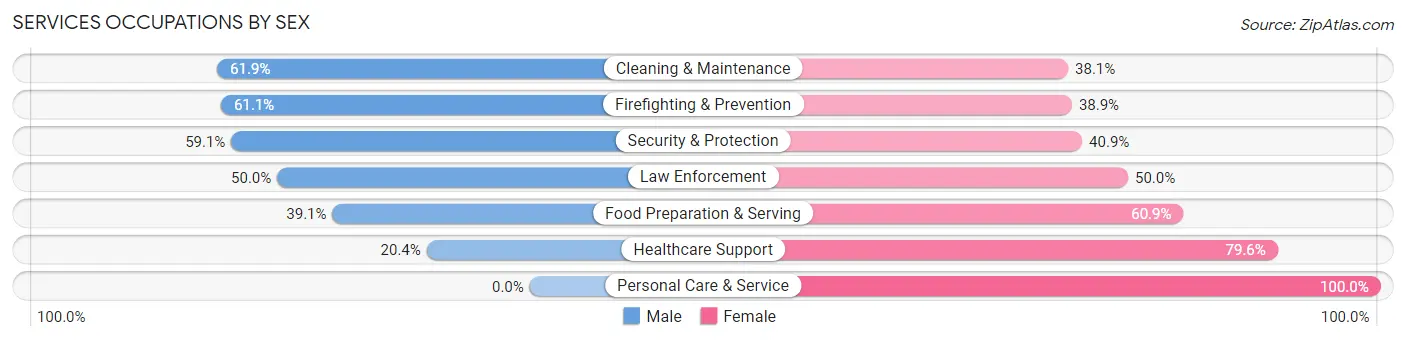
Services Occupations by Sex
Within the Services occupations in South Lockport, the most male-oriented occupations are Cleaning & Maintenance (61.9%), Firefighting & Prevention (61.1%), and Security & Protection (59.1%), while the most female-oriented occupations are Personal Care & Service (100.0%), Healthcare Support (79.6%), and Food Preparation & Serving (60.9%).
| Occupation | Male | Female |
| Healthcare Support | 42 (20.4%) | 164 (79.6%) |
| Security & Protection | 39 (59.1%) | 27 (40.9%) |
| Firefighting & Prevention | 33 (61.1%) | 21 (38.9%) |
| Law Enforcement | 6 (50.0%) | 6 (50.0%) |
| Food Preparation & Serving | 91 (39.1%) | 142 (60.9%) |
| Cleaning & Maintenance | 86 (61.9%) | 53 (38.1%) |
| Personal Care & Service | 0 (0.0%) | 38 (100.0%) |
| Total (Category) | 258 (37.8%) | 424 (62.2%) |
| Total (Overall) | 1,948 (46.7%) | 2,222 (53.3%) |
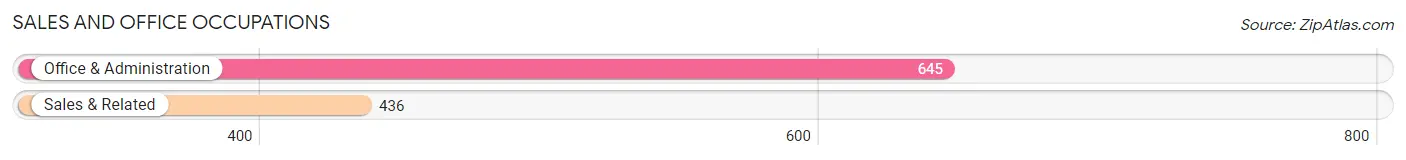
Sales and Office Occupations
The most common Sales and Office occupations in South Lockport are Office & Administration (645 | 15.5%), and Sales & Related (436 | 10.5%).
Sales and Office Occupations by Sex
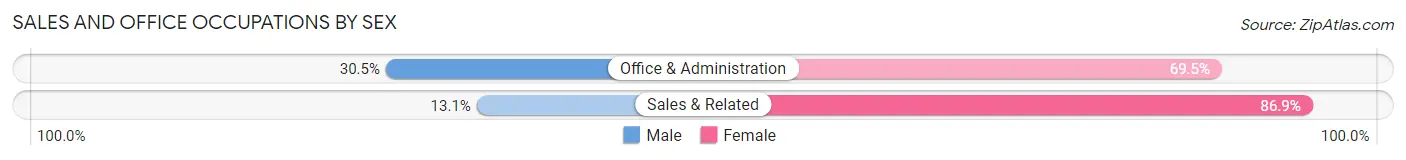
| Occupation | Male | Female |
| Sales & Related | 57 (13.1%) | 379 (86.9%) |
| Office & Administration | 197 (30.5%) | 448 (69.5%) |
| Total (Category) | 254 (23.5%) | 827 (76.5%) |
| Total (Overall) | 1,948 (46.7%) | 2,222 (53.3%) |
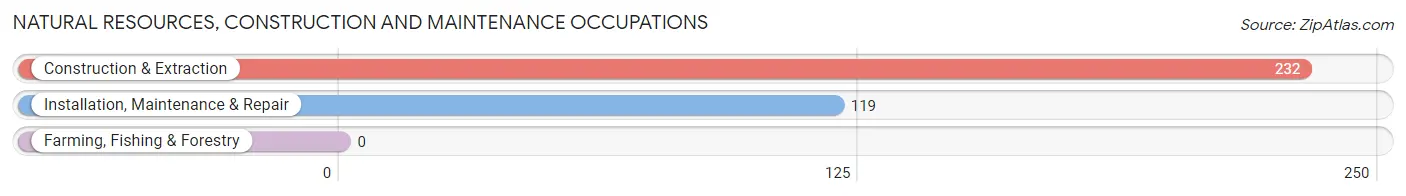
Natural Resources, Construction and Maintenance Occupations
The most common Natural Resources, Construction and Maintenance occupations in South Lockport are Construction & Extraction (232 | 5.6%), and Installation, Maintenance & Repair (119 | 2.9%).
Natural Resources, Construction and Maintenance Occupations by Sex
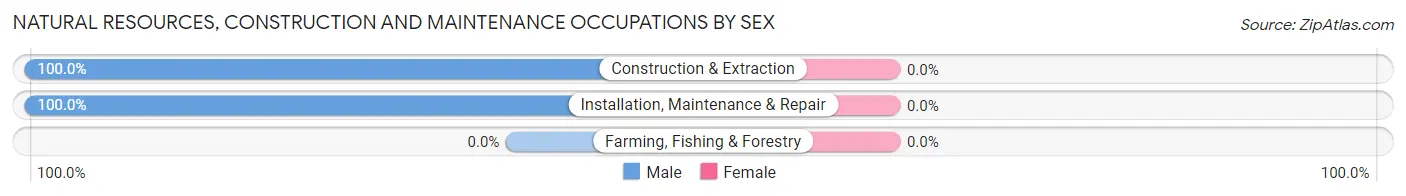
| Occupation | Male | Female |
| Farming, Fishing & Forestry | 0 (0.0%) | 0 (0.0%) |
| Construction & Extraction | 232 (100.0%) | 0 (0.0%) |
| Installation, Maintenance & Repair | 119 (100.0%) | 0 (0.0%) |
| Total (Category) | 351 (100.0%) | 0 (0.0%) |
| Total (Overall) | 1,948 (46.7%) | 2,222 (53.3%) |
Production, Transportation and Moving Occupations
The most common Production, Transportation and Moving occupations in South Lockport are Production (358 | 8.6%), Material Moving (265 | 6.4%), and Transportation (199 | 4.8%).
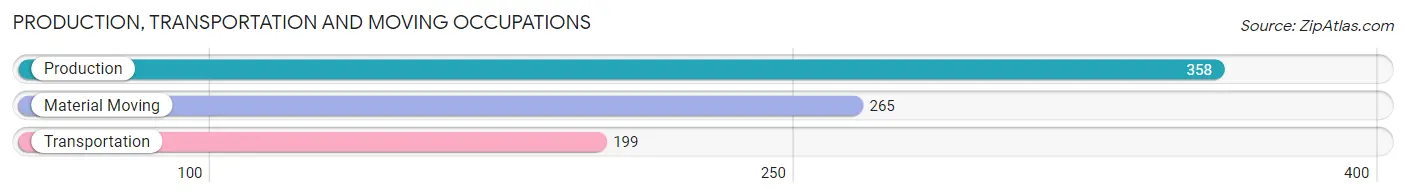
Production, Transportation and Moving Occupations by Sex
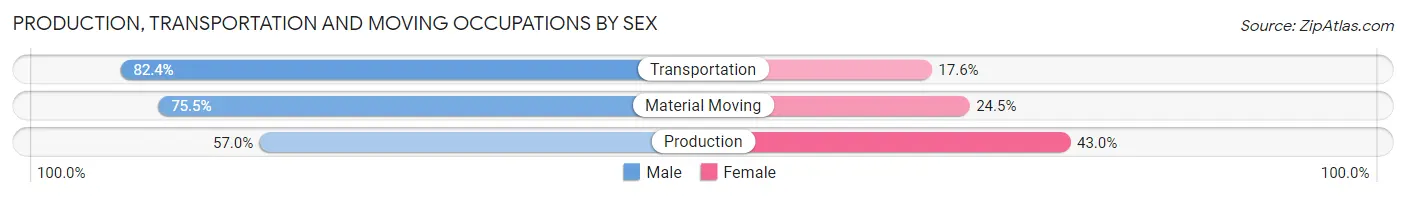
| Occupation | Male | Female |
| Production | 204 (57.0%) | 154 (43.0%) |
| Transportation | 164 (82.4%) | 35 (17.6%) |
| Material Moving | 200 (75.5%) | 65 (24.5%) |
| Total (Category) | 568 (69.1%) | 254 (30.9%) |
| Total (Overall) | 1,948 (46.7%) | 2,222 (53.3%) |
Employment Industries by Sex in South Lockport
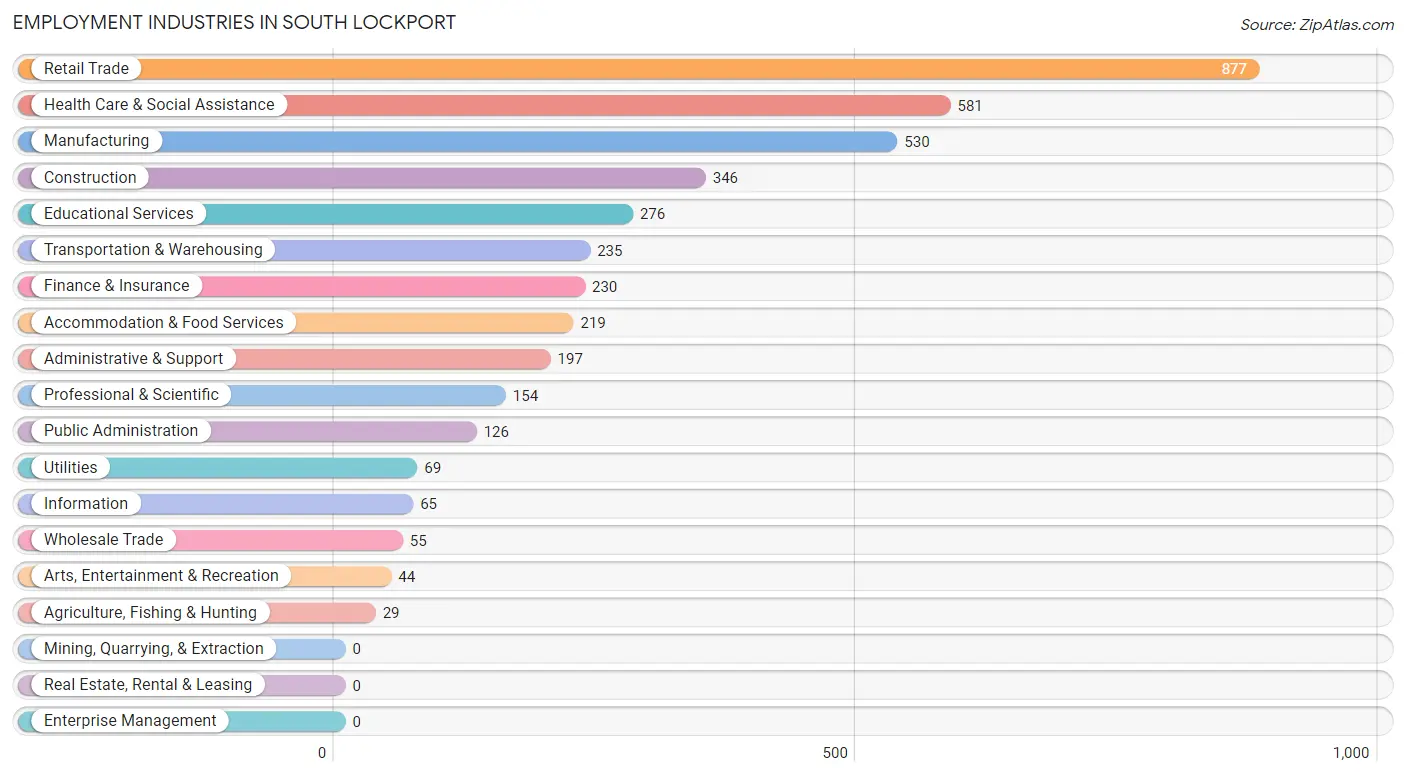
Employment Industries in South Lockport
The major employment industries in South Lockport include Retail Trade (877 | 21.0%), Health Care & Social Assistance (581 | 13.9%), Manufacturing (530 | 12.7%), Construction (346 | 8.3%), and Educational Services (276 | 6.6%).
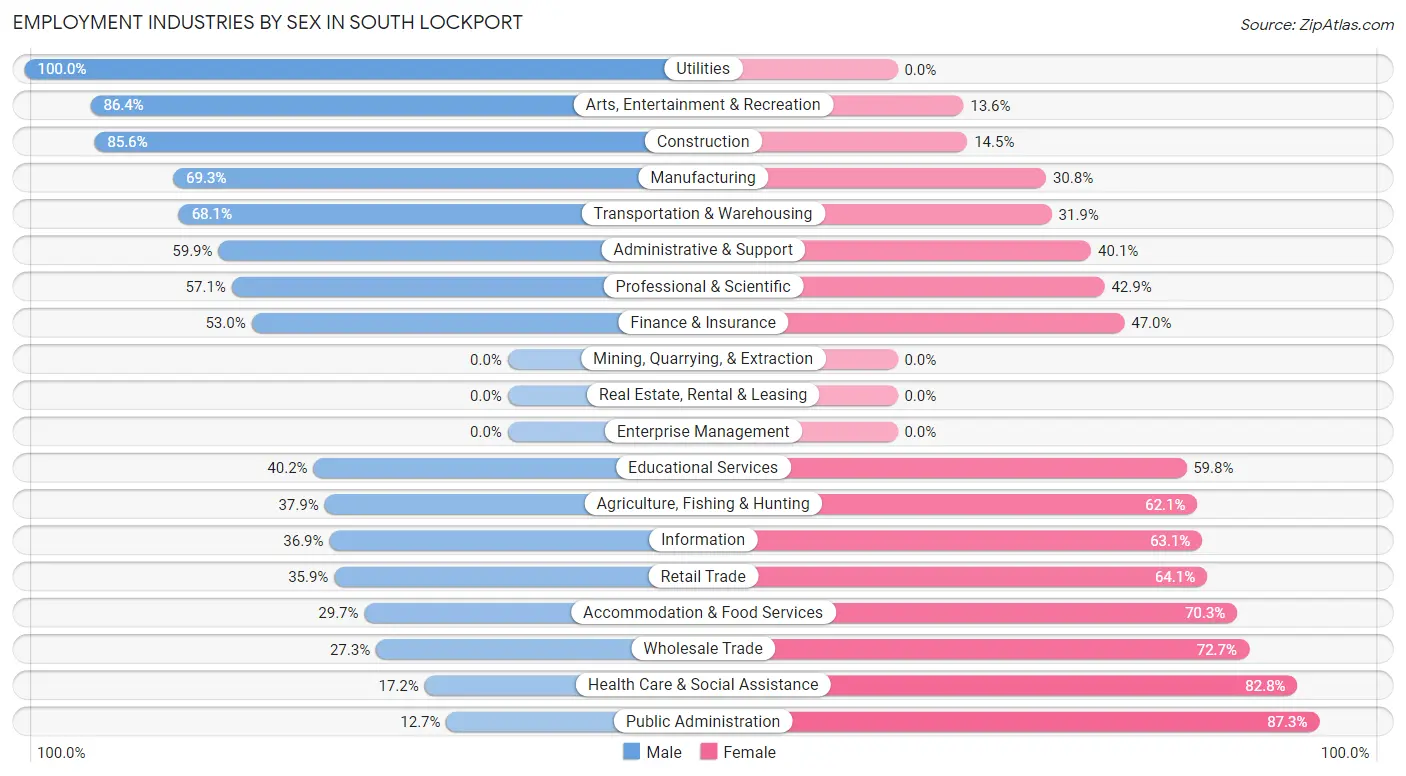
Employment Industries by Sex in South Lockport
The South Lockport industries that see more men than women are Utilities (100.0%), Arts, Entertainment & Recreation (86.4%), and Construction (85.6%), whereas the industries that tend to have a higher number of women are Public Administration (87.3%), Health Care & Social Assistance (82.8%), and Wholesale Trade (72.7%).
| Industry | Male | Female |
| Agriculture, Fishing & Hunting | 11 (37.9%) | 18 (62.1%) |
| Mining, Quarrying, & Extraction | 0 (0.0%) | 0 (0.0%) |
| Construction | 296 (85.6%) | 50 (14.4%) |
| Manufacturing | 367 (69.3%) | 163 (30.7%) |
| Wholesale Trade | 15 (27.3%) | 40 (72.7%) |
| Retail Trade | 315 (35.9%) | 562 (64.1%) |
| Transportation & Warehousing | 160 (68.1%) | 75 (31.9%) |
| Utilities | 69 (100.0%) | 0 (0.0%) |
| Information | 24 (36.9%) | 41 (63.1%) |
| Finance & Insurance | 122 (53.0%) | 108 (47.0%) |
| Real Estate, Rental & Leasing | 0 (0.0%) | 0 (0.0%) |
| Professional & Scientific | 88 (57.1%) | 66 (42.9%) |
| Enterprise Management | 0 (0.0%) | 0 (0.0%) |
| Administrative & Support | 118 (59.9%) | 79 (40.1%) |
| Educational Services | 111 (40.2%) | 165 (59.8%) |
| Health Care & Social Assistance | 100 (17.2%) | 481 (82.8%) |
| Arts, Entertainment & Recreation | 38 (86.4%) | 6 (13.6%) |
| Accommodation & Food Services | 65 (29.7%) | 154 (70.3%) |
| Public Administration | 16 (12.7%) | 110 (87.3%) |
| Total | 1,948 (46.7%) | 2,222 (53.3%) |
Education in South Lockport
School Enrollment in South Lockport
The most common levels of schooling among the 1,368 students in South Lockport are elementary school (335 | 24.5%), college / undergraduate (292 | 21.3%), and high school (282 | 20.6%).
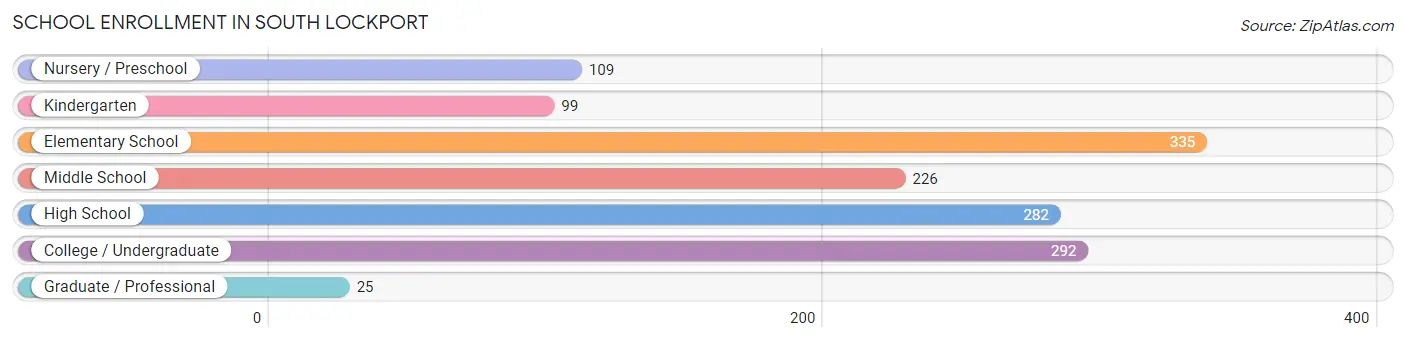
| School Level | # Students | % Students |
| Nursery / Preschool | 109 | 8.0% |
| Kindergarten | 99 | 7.2% |
| Elementary School | 335 | 24.5% |
| Middle School | 226 | 16.5% |
| High School | 282 | 20.6% |
| College / Undergraduate | 292 | 21.3% |
| Graduate / Professional | 25 | 1.8% |
| Total | 1,368 | 100.0% |
School Enrollment by Age by Funding Source in South Lockport
Out of a total of 1,368 students who are enrolled in schools in South Lockport, 179 (13.1%) attend a private institution, while the remaining 1,189 (86.9%) are enrolled in public schools. The age group of 35 years and over has the highest likelihood of being enrolled in private schools, with 47 (62.7% in the age bracket) enrolled. Conversely, the age group of 15 to 17 year olds has the lowest likelihood of being enrolled in a private school, with 127 (100.0% in the age bracket) attending a public institution.
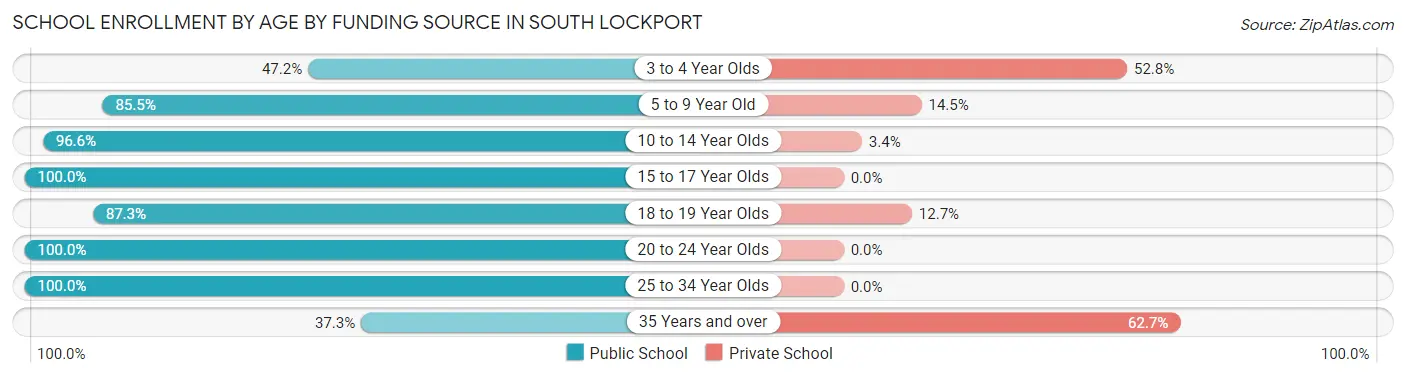
| Age Bracket | Public School | Private School |
| 3 to 4 Year Olds | 34 (47.2%) | 38 (52.8%) |
| 5 to 9 Year Old | 389 (85.5%) | 66 (14.5%) |
| 10 to 14 Year Olds | 369 (96.6%) | 13 (3.4%) |
| 15 to 17 Year Olds | 127 (100.0%) | 0 (0.0%) |
| 18 to 19 Year Olds | 103 (87.3%) | 15 (12.7%) |
| 20 to 24 Year Olds | 124 (100.0%) | 0 (0.0%) |
| 25 to 34 Year Olds | 15 (100.0%) | 0 (0.0%) |
| 35 Years and over | 28 (37.3%) | 47 (62.7%) |
| Total | 1,189 (86.9%) | 179 (13.1%) |
Educational Attainment by Field of Study in South Lockport
Business (267 | 18.7%), liberal arts & history (162 | 11.3%), science & technology (153 | 10.7%), education (140 | 9.8%), and psychology (137 | 9.6%) are the most common fields of study among 1,428 individuals in South Lockport who have obtained a bachelor's degree or higher.
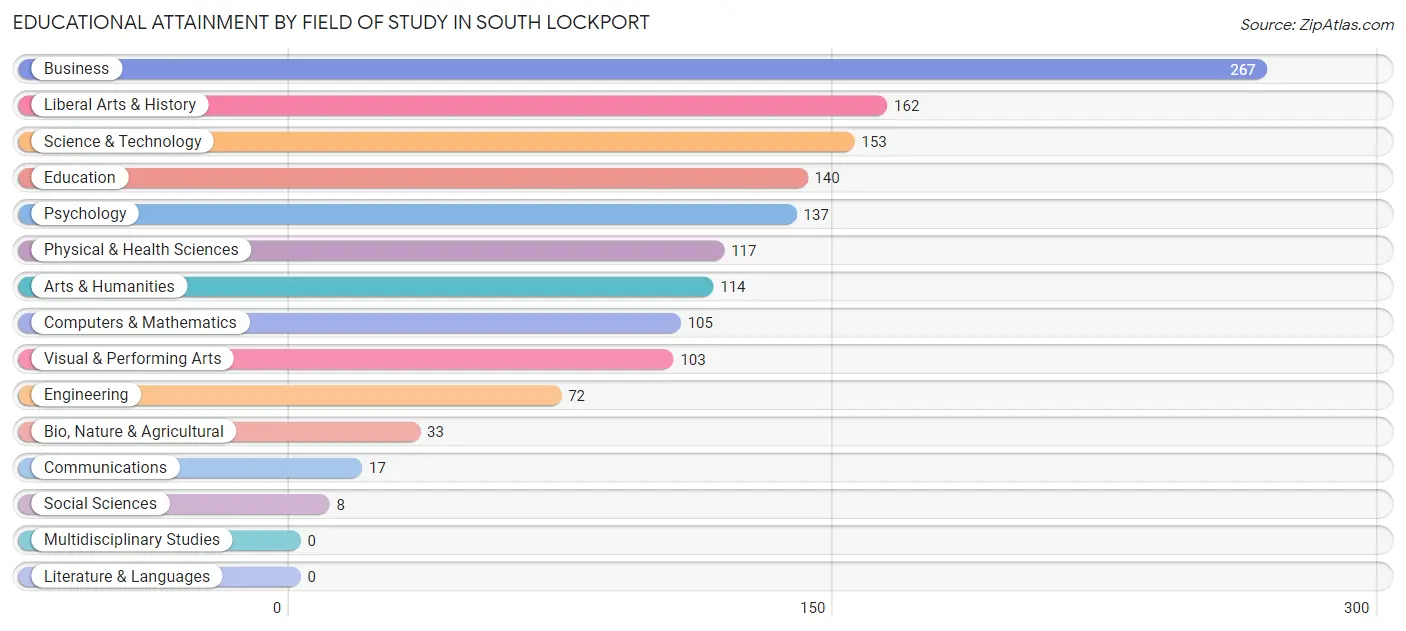
| Field of Study | # Graduates | % Graduates |
| Computers & Mathematics | 105 | 7.3% |
| Bio, Nature & Agricultural | 33 | 2.3% |
| Physical & Health Sciences | 117 | 8.2% |
| Psychology | 137 | 9.6% |
| Social Sciences | 8 | 0.6% |
| Engineering | 72 | 5.0% |
| Multidisciplinary Studies | 0 | 0.0% |
| Science & Technology | 153 | 10.7% |
| Business | 267 | 18.7% |
| Education | 140 | 9.8% |
| Literature & Languages | 0 | 0.0% |
| Liberal Arts & History | 162 | 11.3% |
| Visual & Performing Arts | 103 | 7.2% |
| Communications | 17 | 1.2% |
| Arts & Humanities | 114 | 8.0% |
| Total | 1,428 | 100.0% |
Transportation & Commute in South Lockport
Vehicle Availability by Sex in South Lockport
The most prevalent vehicle ownership categories in South Lockport are males with 2 vehicles (792, accounting for 41.3%) and females with 2 vehicles (818, making up 35.8%).
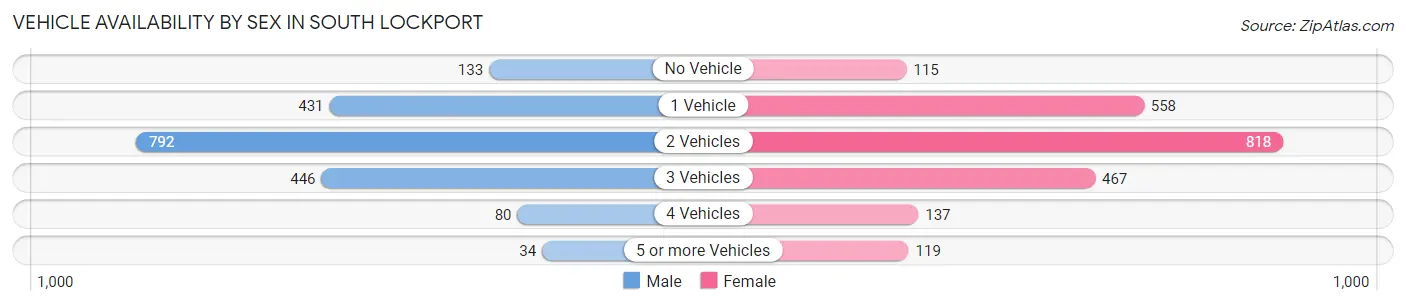
| Vehicles Available | Male | Female |
| No Vehicle | 133 (6.9%) | 115 (5.2%) |
| 1 Vehicle | 431 (22.5%) | 558 (25.2%) |
| 2 Vehicles | 792 (41.3%) | 818 (36.9%) |
| 3 Vehicles | 446 (23.3%) | 467 (21.1%) |
| 4 Vehicles | 80 (4.2%) | 137 (6.2%) |
| 5 or more Vehicles | 34 (1.8%) | 119 (5.4%) |
| Total | 1,916 (100.0%) | 2,214 (100.0%) |
Commute Time in South Lockport
The most frequently occuring commute durations in South Lockport are 20 to 24 minutes (848 commuters, 21.6%), 10 to 14 minutes (496 commuters, 12.6%), and 5 to 9 minutes (473 commuters, 12.0%).
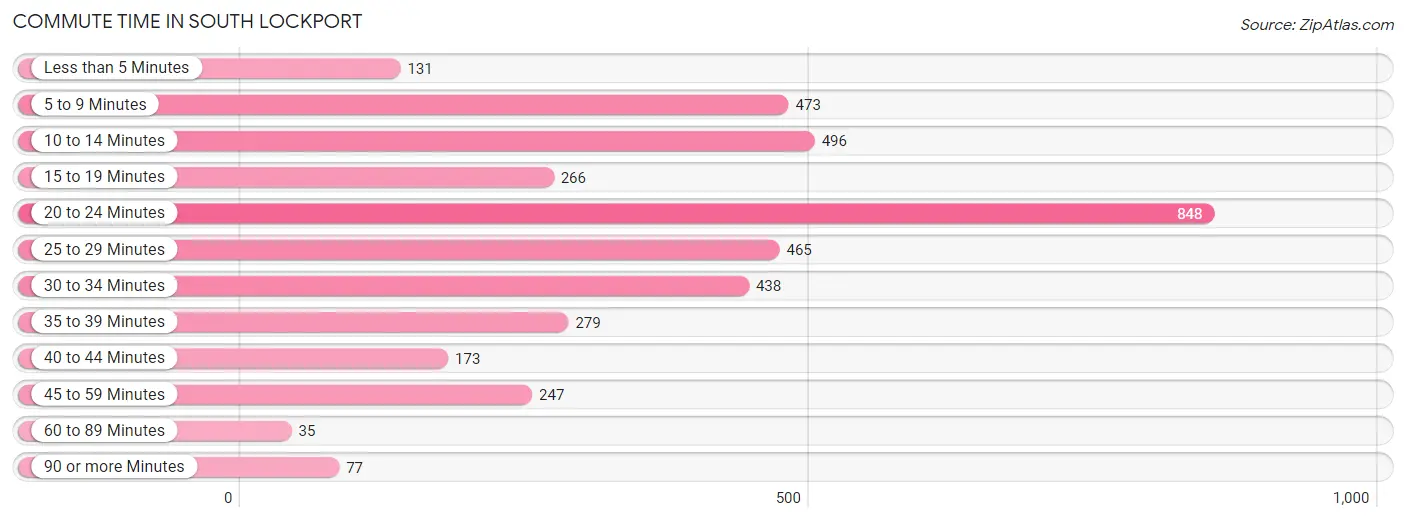
| Commute Time | # Commuters | % Commuters |
| Less than 5 Minutes | 131 | 3.3% |
| 5 to 9 Minutes | 473 | 12.0% |
| 10 to 14 Minutes | 496 | 12.6% |
| 15 to 19 Minutes | 266 | 6.8% |
| 20 to 24 Minutes | 848 | 21.6% |
| 25 to 29 Minutes | 465 | 11.8% |
| 30 to 34 Minutes | 438 | 11.2% |
| 35 to 39 Minutes | 279 | 7.1% |
| 40 to 44 Minutes | 173 | 4.4% |
| 45 to 59 Minutes | 247 | 6.3% |
| 60 to 89 Minutes | 35 | 0.9% |
| 90 or more Minutes | 77 | 2.0% |
Commute Time by Sex in South Lockport
The most common commute times in South Lockport are 20 to 24 minutes (427 commuters, 22.9%) for males and 20 to 24 minutes (421 commuters, 20.4%) for females.
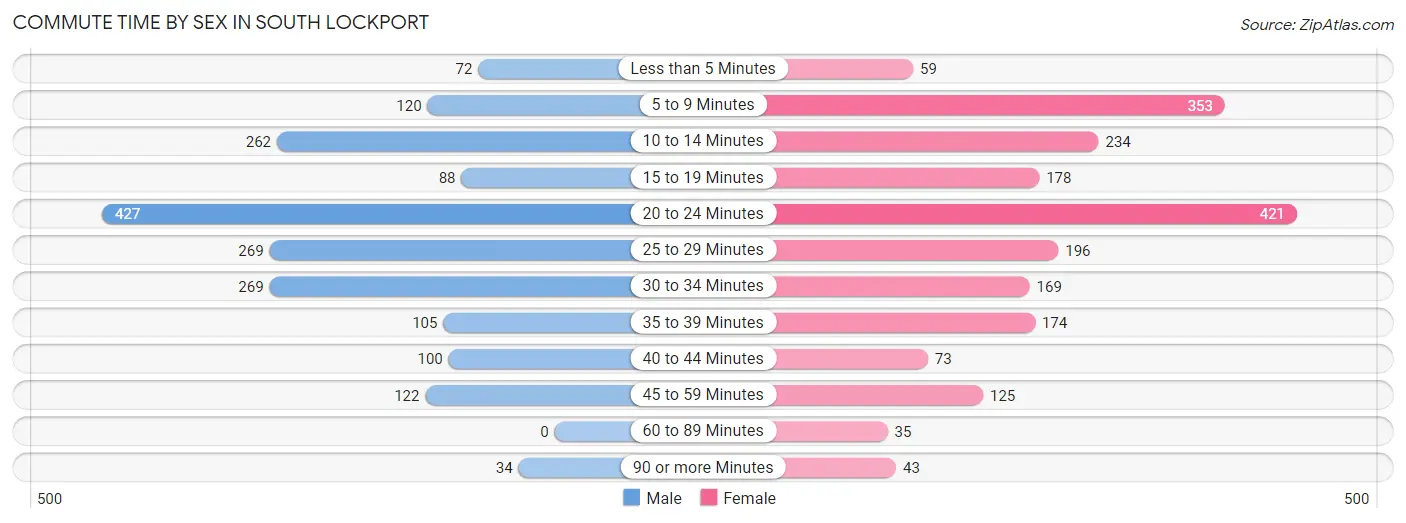
| Commute Time | Male | Female |
| Less than 5 Minutes | 72 (3.8%) | 59 (2.9%) |
| 5 to 9 Minutes | 120 (6.4%) | 353 (17.1%) |
| 10 to 14 Minutes | 262 (14.0%) | 234 (11.4%) |
| 15 to 19 Minutes | 88 (4.7%) | 178 (8.6%) |
| 20 to 24 Minutes | 427 (22.9%) | 421 (20.4%) |
| 25 to 29 Minutes | 269 (14.4%) | 196 (9.5%) |
| 30 to 34 Minutes | 269 (14.4%) | 169 (8.2%) |
| 35 to 39 Minutes | 105 (5.6%) | 174 (8.5%) |
| 40 to 44 Minutes | 100 (5.3%) | 73 (3.5%) |
| 45 to 59 Minutes | 122 (6.5%) | 125 (6.1%) |
| 60 to 89 Minutes | 0 (0.0%) | 35 (1.7%) |
| 90 or more Minutes | 34 (1.8%) | 43 (2.1%) |
Time of Departure to Work by Sex in South Lockport
The most frequent times of departure to work in South Lockport are 7:00 AM to 7:29 AM (276, 14.8%) for males and 7:00 AM to 7:29 AM (484, 23.5%) for females.
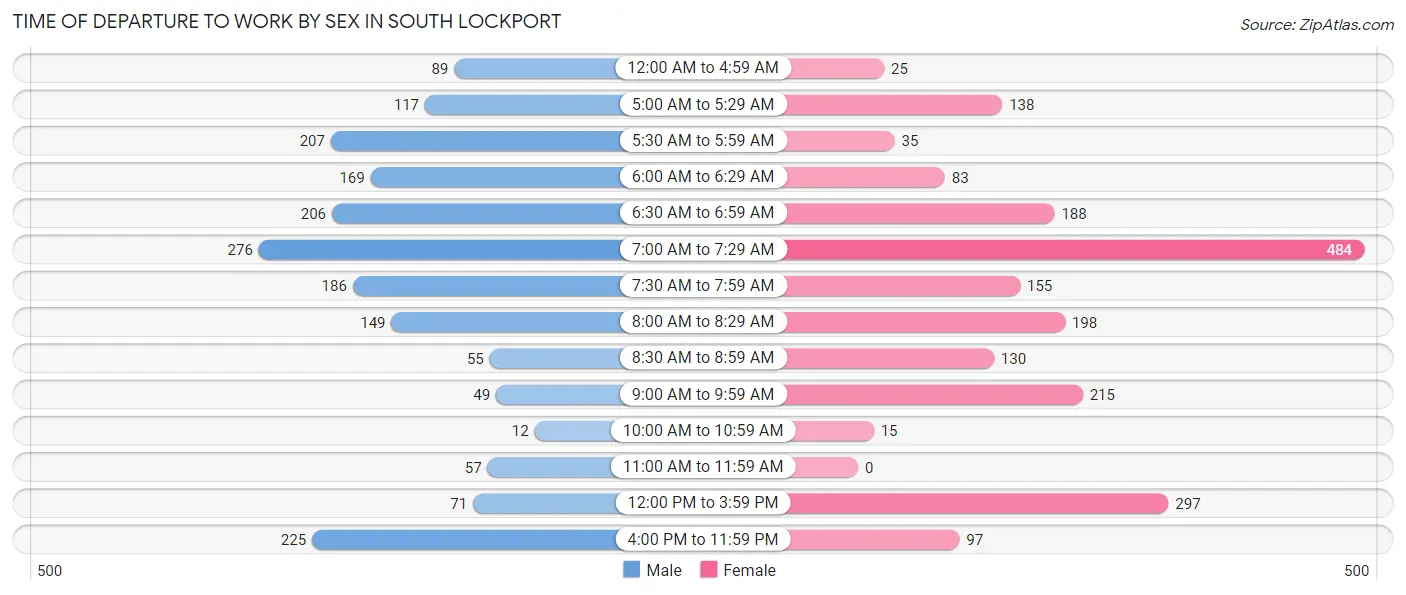
| Time of Departure | Male | Female |
| 12:00 AM to 4:59 AM | 89 (4.8%) | 25 (1.2%) |
| 5:00 AM to 5:29 AM | 117 (6.3%) | 138 (6.7%) |
| 5:30 AM to 5:59 AM | 207 (11.1%) | 35 (1.7%) |
| 6:00 AM to 6:29 AM | 169 (9.0%) | 83 (4.0%) |
| 6:30 AM to 6:59 AM | 206 (11.0%) | 188 (9.1%) |
| 7:00 AM to 7:29 AM | 276 (14.8%) | 484 (23.5%) |
| 7:30 AM to 7:59 AM | 186 (10.0%) | 155 (7.5%) |
| 8:00 AM to 8:29 AM | 149 (8.0%) | 198 (9.6%) |
| 8:30 AM to 8:59 AM | 55 (2.9%) | 130 (6.3%) |
| 9:00 AM to 9:59 AM | 49 (2.6%) | 215 (10.4%) |
| 10:00 AM to 10:59 AM | 12 (0.6%) | 15 (0.7%) |
| 11:00 AM to 11:59 AM | 57 (3.0%) | 0 (0.0%) |
| 12:00 PM to 3:59 PM | 71 (3.8%) | 297 (14.4%) |
| 4:00 PM to 11:59 PM | 225 (12.0%) | 97 (4.7%) |
| Total | 1,868 (100.0%) | 2,060 (100.0%) |
Housing Occupancy in South Lockport
Occupancy by Ownership in South Lockport
Of the total 3,927 dwellings in South Lockport, owner-occupied units account for 2,582 (65.7%), while renter-occupied units make up 1,345 (34.3%).
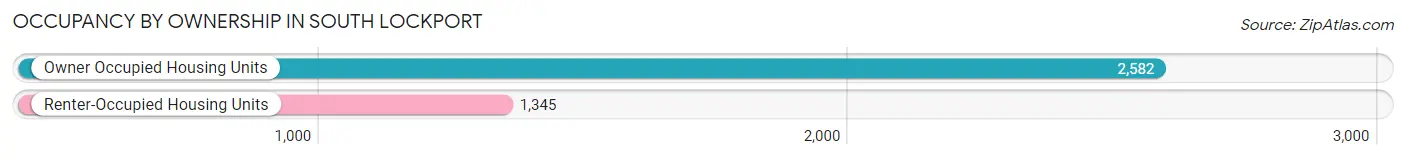
| Occupancy | # Housing Units | % Housing Units |
| Owner Occupied Housing Units | 2,582 | 65.7% |
| Renter-Occupied Housing Units | 1,345 | 34.3% |
| Total Occupied Housing Units | 3,927 | 100.0% |
Occupancy by Household Size in South Lockport
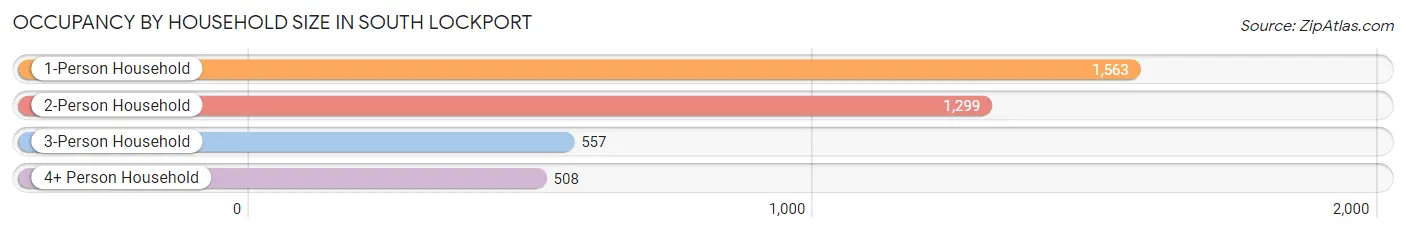
| Household Size | # Housing Units | % Housing Units |
| 1-Person Household | 1,563 | 39.8% |
| 2-Person Household | 1,299 | 33.1% |
| 3-Person Household | 557 | 14.2% |
| 4+ Person Household | 508 | 12.9% |
| Total Housing Units | 3,927 | 100.0% |
Occupancy by Ownership by Household Size in South Lockport
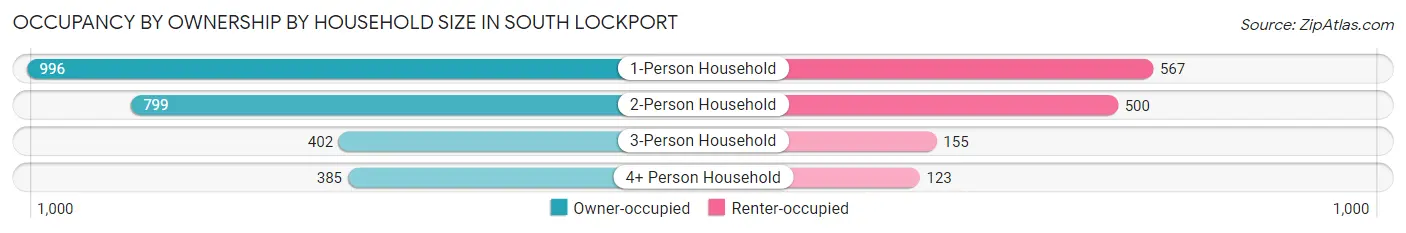
| Household Size | Owner-occupied | Renter-occupied |
| 1-Person Household | 996 (63.7%) | 567 (36.3%) |
| 2-Person Household | 799 (61.5%) | 500 (38.5%) |
| 3-Person Household | 402 (72.2%) | 155 (27.8%) |
| 4+ Person Household | 385 (75.8%) | 123 (24.2%) |
| Total Housing Units | 2,582 (65.7%) | 1,345 (34.3%) |
Occupancy by Educational Attainment in South Lockport
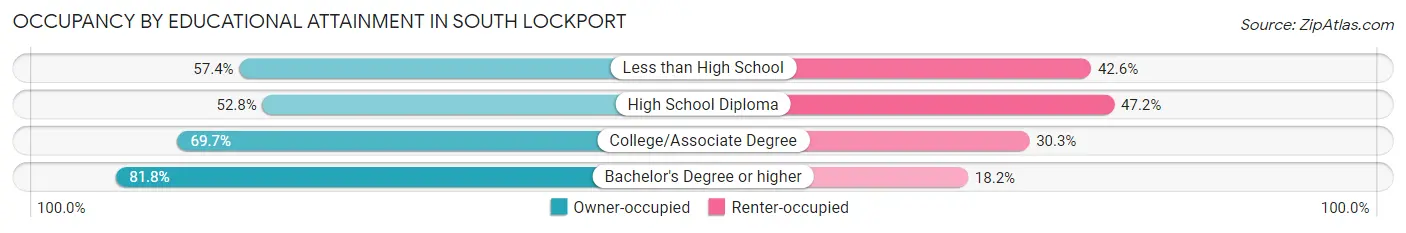
| Household Size | Owner-occupied | Renter-occupied |
| Less than High School | 124 (57.4%) | 92 (42.6%) |
| High School Diploma | 757 (52.8%) | 676 (47.2%) |
| College/Associate Degree | 932 (69.7%) | 406 (30.3%) |
| Bachelor's Degree or higher | 769 (81.8%) | 171 (18.2%) |
Occupancy by Age of Householder in South Lockport
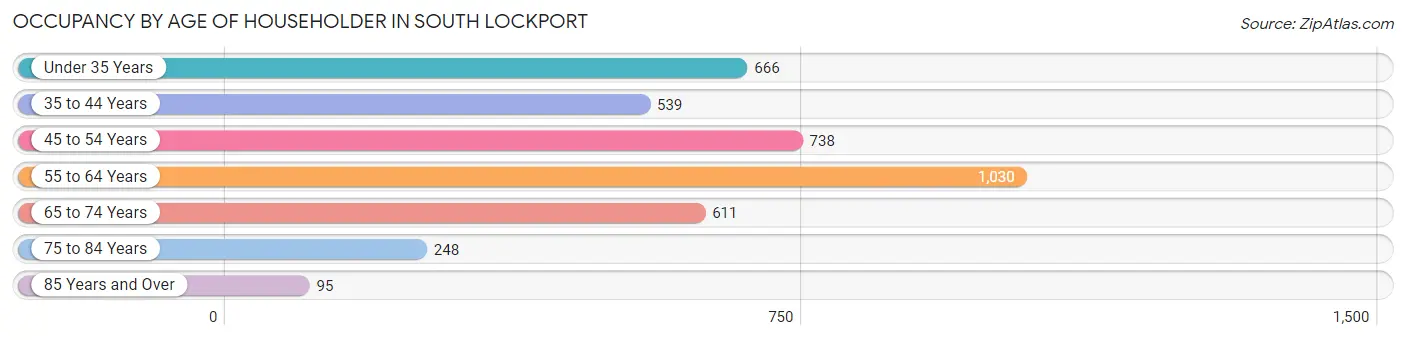
| Age Bracket | # Households | % Households |
| Under 35 Years | 666 | 17.0% |
| 35 to 44 Years | 539 | 13.7% |
| 45 to 54 Years | 738 | 18.8% |
| 55 to 64 Years | 1,030 | 26.2% |
| 65 to 74 Years | 611 | 15.6% |
| 75 to 84 Years | 248 | 6.3% |
| 85 Years and Over | 95 | 2.4% |
| Total | 3,927 | 100.0% |
Housing Finances in South Lockport
Median Income by Occupancy in South Lockport
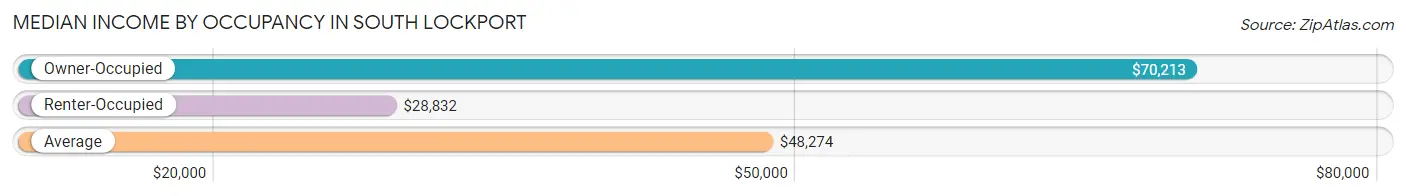
| Occupancy Type | # Households | Median Income |
| Owner-Occupied | 2,582 (65.7%) | $70,213 |
| Renter-Occupied | 1,345 (34.3%) | $28,832 |
| Average | 3,927 (100.0%) | $48,274 |
Occupancy by Householder Income Bracket in South Lockport
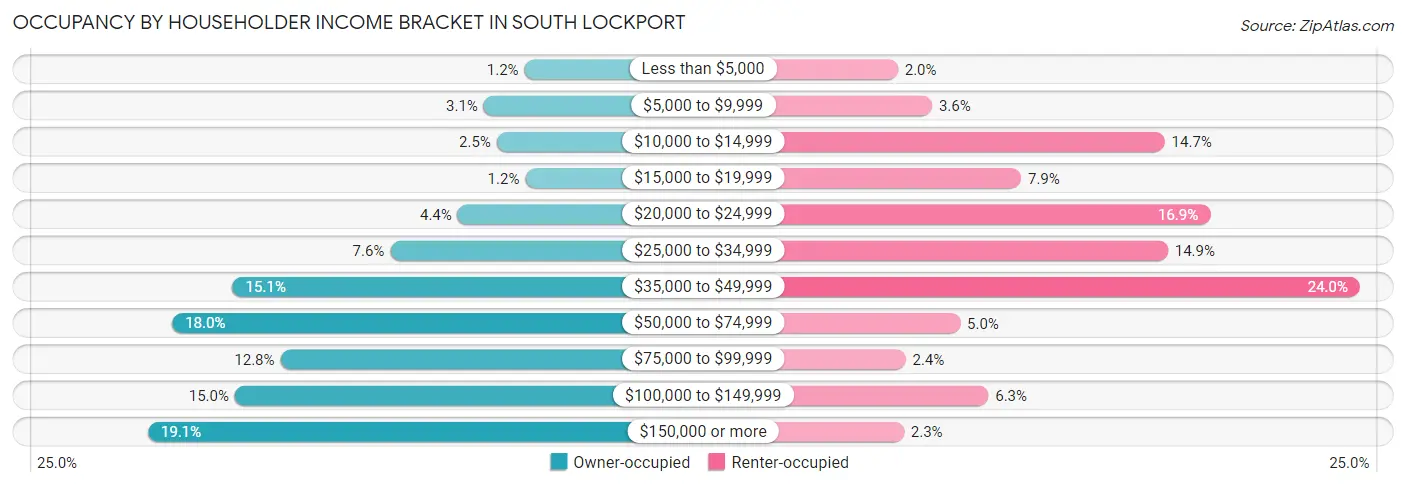
| Income Bracket | Owner-occupied | Renter-occupied |
| Less than $5,000 | 31 (1.2%) | 27 (2.0%) |
| $5,000 to $9,999 | 81 (3.1%) | 49 (3.6%) |
| $10,000 to $14,999 | 65 (2.5%) | 198 (14.7%) |
| $15,000 to $19,999 | 30 (1.2%) | 106 (7.9%) |
| $20,000 to $24,999 | 113 (4.4%) | 227 (16.9%) |
| $25,000 to $34,999 | 196 (7.6%) | 200 (14.9%) |
| $35,000 to $49,999 | 390 (15.1%) | 323 (24.0%) |
| $50,000 to $74,999 | 464 (18.0%) | 67 (5.0%) |
| $75,000 to $99,999 | 331 (12.8%) | 32 (2.4%) |
| $100,000 to $149,999 | 387 (15.0%) | 85 (6.3%) |
| $150,000 or more | 494 (19.1%) | 31 (2.3%) |
| Total | 2,582 (100.0%) | 1,345 (100.0%) |
Monthly Housing Cost Tiers in South Lockport
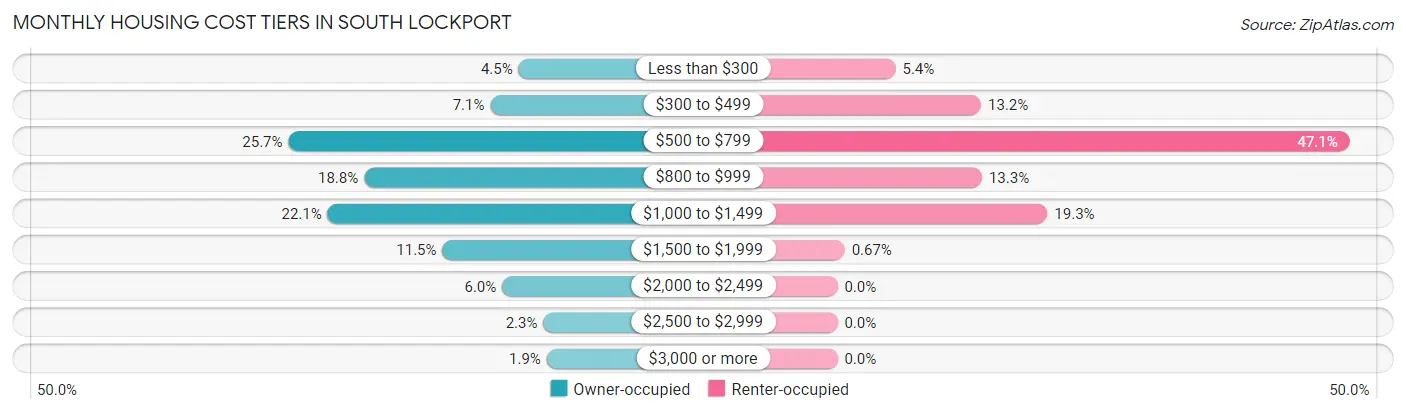
| Monthly Cost | Owner-occupied | Renter-occupied |
| Less than $300 | 117 (4.5%) | 72 (5.3%) |
| $300 to $499 | 184 (7.1%) | 178 (13.2%) |
| $500 to $799 | 664 (25.7%) | 634 (47.1%) |
| $800 to $999 | 484 (18.8%) | 179 (13.3%) |
| $1,000 to $1,499 | 571 (22.1%) | 260 (19.3%) |
| $1,500 to $1,999 | 298 (11.5%) | 9 (0.7%) |
| $2,000 to $2,499 | 156 (6.0%) | 0 (0.0%) |
| $2,500 to $2,999 | 58 (2.2%) | 0 (0.0%) |
| $3,000 or more | 50 (1.9%) | 0 (0.0%) |
| Total | 2,582 (100.0%) | 1,345 (100.0%) |
Physical Housing Characteristics in South Lockport
Housing Structures in South Lockport
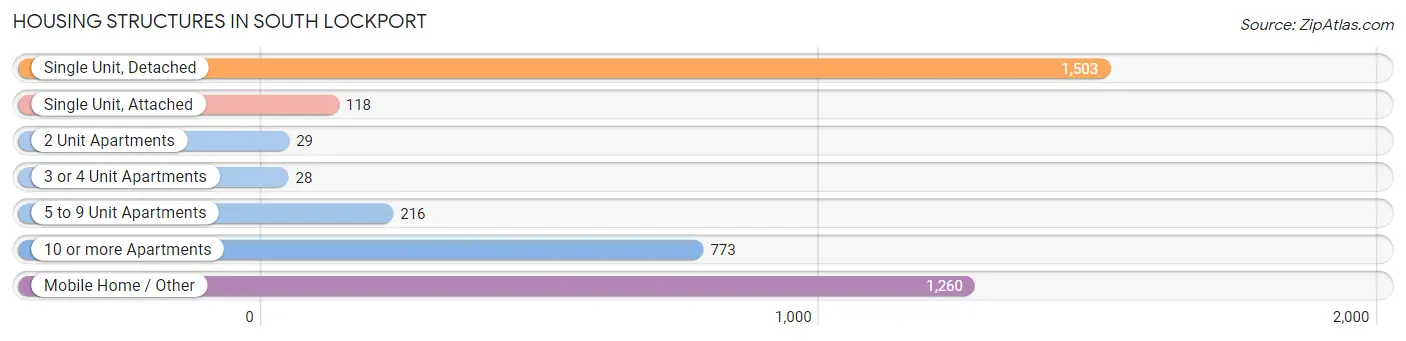
| Structure Type | # Housing Units | % Housing Units |
| Single Unit, Detached | 1,503 | 38.3% |
| Single Unit, Attached | 118 | 3.0% |
| 2 Unit Apartments | 29 | 0.7% |
| 3 or 4 Unit Apartments | 28 | 0.7% |
| 5 to 9 Unit Apartments | 216 | 5.5% |
| 10 or more Apartments | 773 | 19.7% |
| Mobile Home / Other | 1,260 | 32.1% |
| Total | 3,927 | 100.0% |
Housing Structures by Occupancy in South Lockport
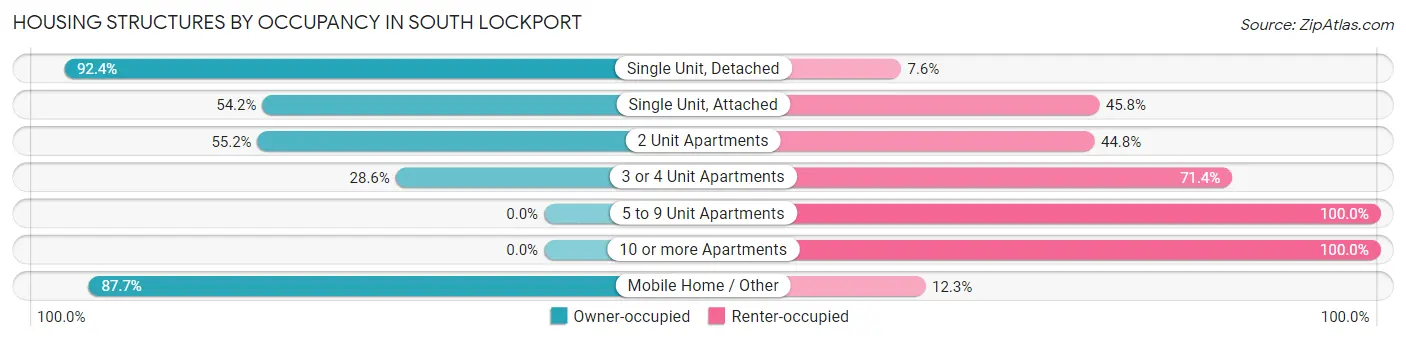
| Structure Type | Owner-occupied | Renter-occupied |
| Single Unit, Detached | 1,389 (92.4%) | 114 (7.6%) |
| Single Unit, Attached | 64 (54.2%) | 54 (45.8%) |
| 2 Unit Apartments | 16 (55.2%) | 13 (44.8%) |
| 3 or 4 Unit Apartments | 8 (28.6%) | 20 (71.4%) |
| 5 to 9 Unit Apartments | 0 (0.0%) | 216 (100.0%) |
| 10 or more Apartments | 0 (0.0%) | 773 (100.0%) |
| Mobile Home / Other | 1,105 (87.7%) | 155 (12.3%) |
| Total | 2,582 (65.7%) | 1,345 (34.3%) |
Housing Structures by Number of Rooms in South Lockport

| Number of Rooms | Owner-occupied | Renter-occupied |
| 1 Room | 0 (0.0%) | 52 (3.9%) |
| 2 or 3 Rooms | 93 (3.6%) | 565 (42.0%) |
| 4 or 5 Rooms | 829 (32.1%) | 461 (34.3%) |
| 6 or 7 Rooms | 1,078 (41.7%) | 144 (10.7%) |
| 8 or more Rooms | 582 (22.5%) | 123 (9.1%) |
| Total | 2,582 (100.0%) | 1,345 (100.0%) |
Housing Structure by Heating Type in South Lockport
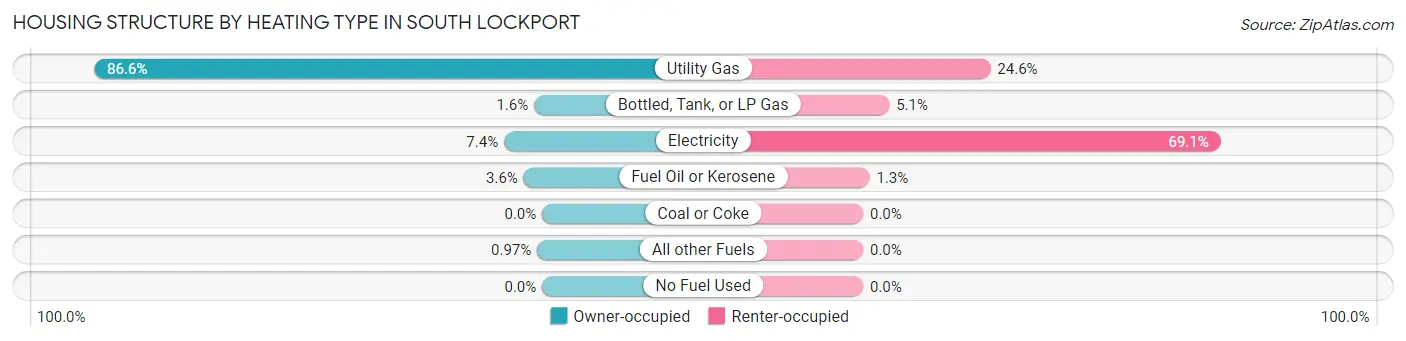
| Heating Type | Owner-occupied | Renter-occupied |
| Utility Gas | 2,235 (86.6%) | 331 (24.6%) |
| Bottled, Tank, or LP Gas | 40 (1.5%) | 68 (5.1%) |
| Electricity | 190 (7.4%) | 929 (69.1%) |
| Fuel Oil or Kerosene | 92 (3.6%) | 17 (1.3%) |
| Coal or Coke | 0 (0.0%) | 0 (0.0%) |
| All other Fuels | 25 (1.0%) | 0 (0.0%) |
| No Fuel Used | 0 (0.0%) | 0 (0.0%) |
| Total | 2,582 (100.0%) | 1,345 (100.0%) |
Household Vehicle Usage in South Lockport
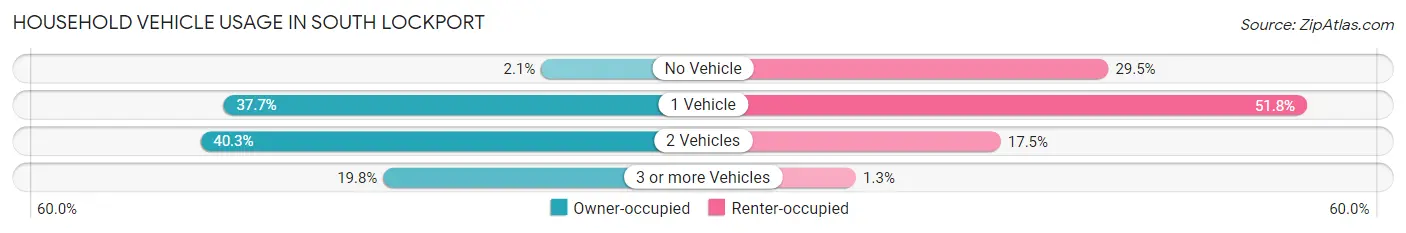
| Vehicles per Household | Owner-occupied | Renter-occupied |
| No Vehicle | 55 (2.1%) | 397 (29.5%) |
| 1 Vehicle | 974 (37.7%) | 696 (51.7%) |
| 2 Vehicles | 1,041 (40.3%) | 235 (17.5%) |
| 3 or more Vehicles | 512 (19.8%) | 17 (1.3%) |
| Total | 2,582 (100.0%) | 1,345 (100.0%) |
Real Estate & Mortgages in South Lockport
Real Estate and Mortgage Overview in South Lockport
| Characteristic | Without Mortgage | With Mortgage |
| Housing Units | 1,566 | 1,016 |
| Median Property Value | $42,300 | $202,300 |
| Median Household Income | $53,048 | $359 |
| Monthly Housing Costs | $776 | $50 |
| Real Estate Taxes | $3,631 | $89 |
Property Value by Mortgage Status in South Lockport
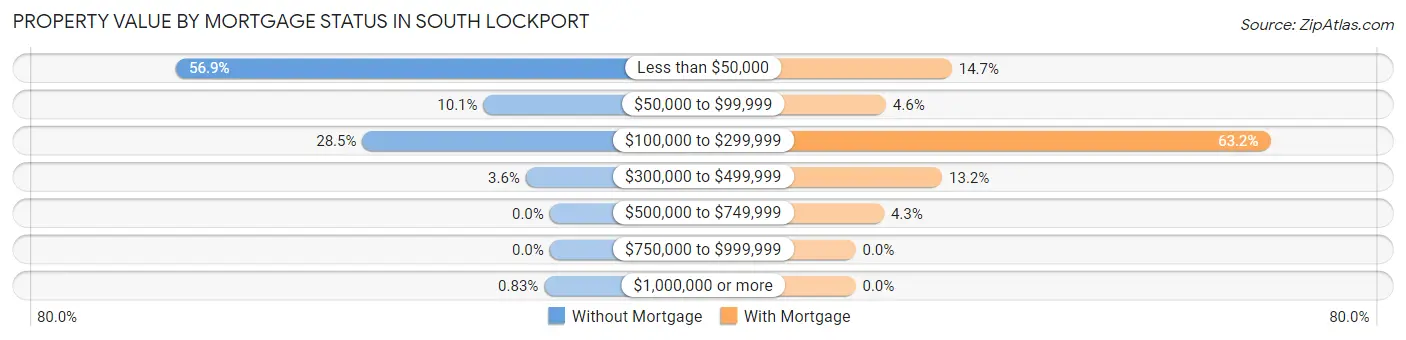
| Property Value | Without Mortgage | With Mortgage |
| Less than $50,000 | 891 (56.9%) | 149 (14.7%) |
| $50,000 to $99,999 | 158 (10.1%) | 47 (4.6%) |
| $100,000 to $299,999 | 447 (28.5%) | 642 (63.2%) |
| $300,000 to $499,999 | 57 (3.6%) | 134 (13.2%) |
| $500,000 to $749,999 | 0 (0.0%) | 44 (4.3%) |
| $750,000 to $999,999 | 0 (0.0%) | 0 (0.0%) |
| $1,000,000 or more | 13 (0.8%) | 0 (0.0%) |
| Total | 1,566 (100.0%) | 1,016 (100.0%) |
Household Income by Mortgage Status in South Lockport
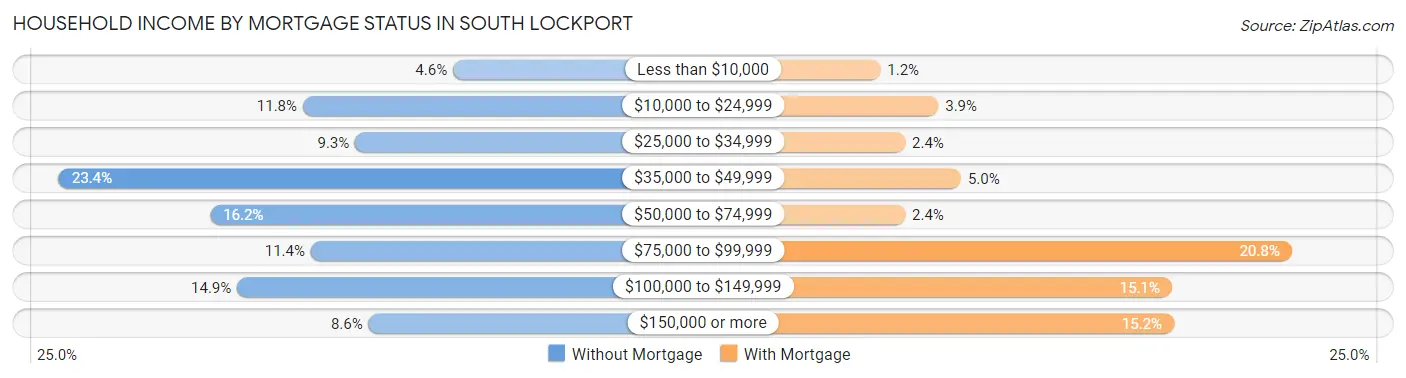
| Household Income | Without Mortgage | With Mortgage |
| Less than $10,000 | 72 (4.6%) | 12 (1.2%) |
| $10,000 to $24,999 | 184 (11.7%) | 40 (3.9%) |
| $25,000 to $34,999 | 145 (9.3%) | 24 (2.4%) |
| $35,000 to $49,999 | 366 (23.4%) | 51 (5.0%) |
| $50,000 to $74,999 | 253 (16.2%) | 24 (2.4%) |
| $75,000 to $99,999 | 178 (11.4%) | 211 (20.8%) |
| $100,000 to $149,999 | 233 (14.9%) | 153 (15.1%) |
| $150,000 or more | 135 (8.6%) | 154 (15.2%) |
| Total | 1,566 (100.0%) | 1,016 (100.0%) |
Property Value to Household Income Ratio in South Lockport
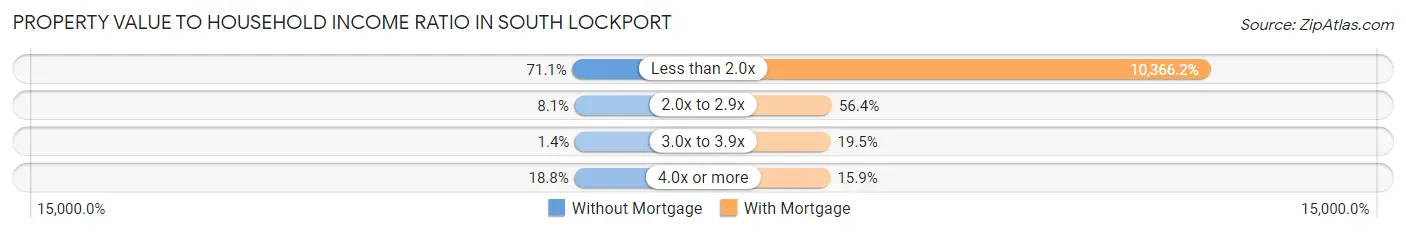
| Value-to-Income Ratio | Without Mortgage | With Mortgage |
| Less than 2.0x | 1,113 (71.1%) | 105,321 (10,366.2%) |
| 2.0x to 2.9x | 127 (8.1%) | 573 (56.4%) |
| 3.0x to 3.9x | 22 (1.4%) | 198 (19.5%) |
| 4.0x or more | 294 (18.8%) | 162 (15.9%) |
| Total | 1,566 (100.0%) | 1,016 (100.0%) |
Real Estate Taxes by Mortgage Status in South Lockport
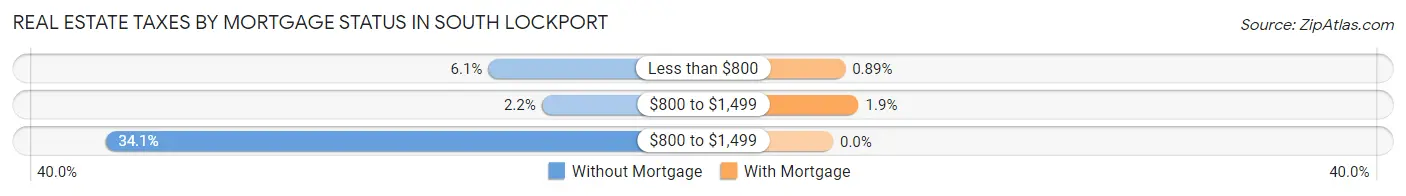
| Property Taxes | Without Mortgage | With Mortgage |
| Less than $800 | 96 (6.1%) | 9 (0.9%) |
| $800 to $1,499 | 35 (2.2%) | 19 (1.9%) |
| $800 to $1,499 | 534 (34.1%) | 0 (0.0%) |
| Total | 1,566 (100.0%) | 1,016 (100.0%) |
Health & Disability in South Lockport
Health Insurance Coverage by Age in South Lockport
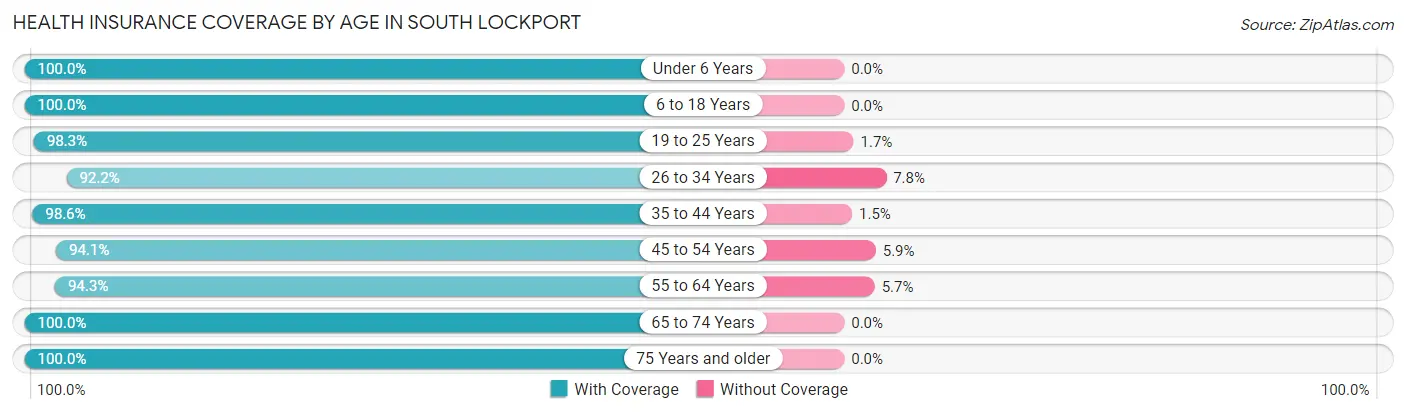
| Age Bracket | With Coverage | Without Coverage |
| Under 6 Years | 456 (100.0%) | 0 (0.0%) |
| 6 to 18 Years | 937 (100.0%) | 0 (0.0%) |
| 19 to 25 Years | 911 (98.3%) | 16 (1.7%) |
| 26 to 34 Years | 791 (92.2%) | 67 (7.8%) |
| 35 to 44 Years | 1,022 (98.6%) | 15 (1.5%) |
| 45 to 54 Years | 1,154 (94.1%) | 72 (5.9%) |
| 55 to 64 Years | 1,382 (94.3%) | 83 (5.7%) |
| 65 to 74 Years | 865 (100.0%) | 0 (0.0%) |
| 75 Years and older | 604 (100.0%) | 0 (0.0%) |
| Total | 8,122 (97.0%) | 253 (3.0%) |
Health Insurance Coverage by Citizenship Status in South Lockport
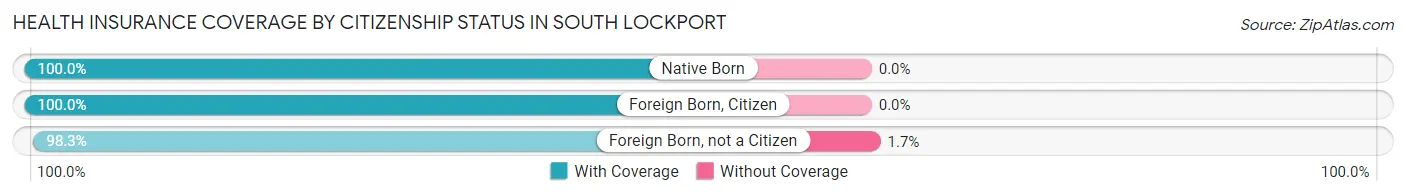
| Citizenship Status | With Coverage | Without Coverage |
| Native Born | 456 (100.0%) | 0 (0.0%) |
| Foreign Born, Citizen | 937 (100.0%) | 0 (0.0%) |
| Foreign Born, not a Citizen | 911 (98.3%) | 16 (1.7%) |
Health Insurance Coverage by Household Income in South Lockport
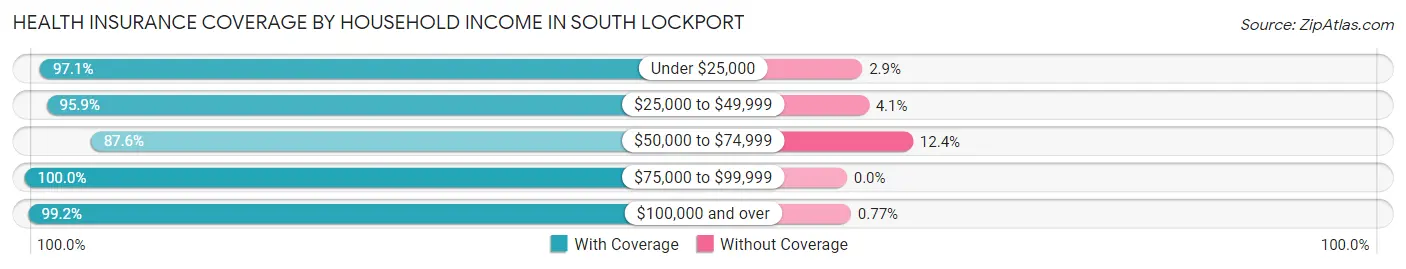
| Household Income | With Coverage | Without Coverage |
| Under $25,000 | 1,444 (97.1%) | 43 (2.9%) |
| $25,000 to $49,999 | 1,701 (95.9%) | 73 (4.1%) |
| $50,000 to $74,999 | 792 (87.6%) | 112 (12.4%) |
| $75,000 to $99,999 | 901 (100.0%) | 0 (0.0%) |
| $100,000 and over | 3,214 (99.2%) | 25 (0.8%) |
Public vs Private Health Insurance Coverage by Age in South Lockport
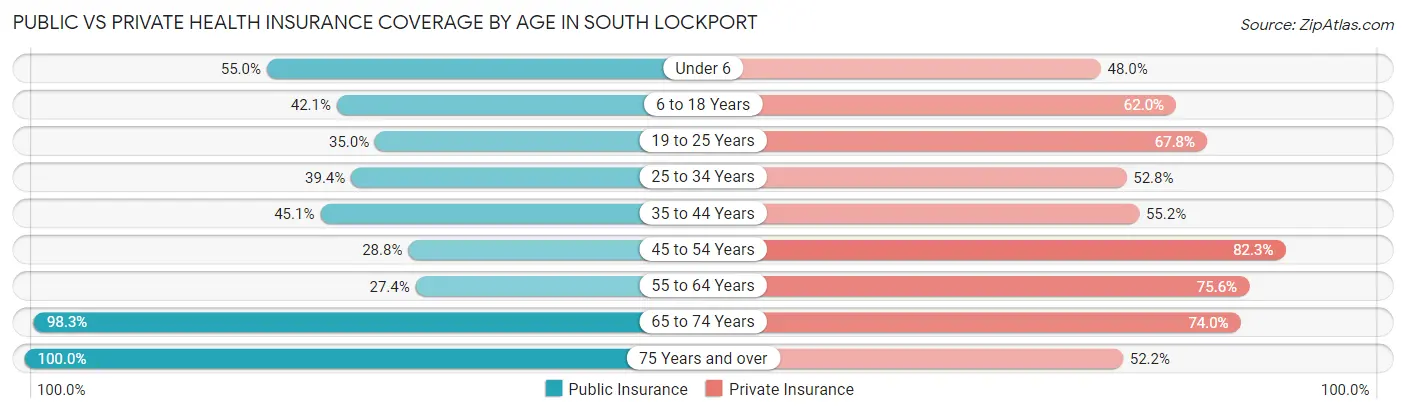
| Age Bracket | Public Insurance | Private Insurance |
| Under 6 | 251 (55.0%) | 219 (48.0%) |
| 6 to 18 Years | 394 (42.0%) | 581 (62.0%) |
| 19 to 25 Years | 324 (34.9%) | 628 (67.7%) |
| 25 to 34 Years | 338 (39.4%) | 453 (52.8%) |
| 35 to 44 Years | 468 (45.1%) | 572 (55.2%) |
| 45 to 54 Years | 353 (28.8%) | 1,009 (82.3%) |
| 55 to 64 Years | 402 (27.4%) | 1,107 (75.6%) |
| 65 to 74 Years | 850 (98.3%) | 640 (74.0%) |
| 75 Years and over | 604 (100.0%) | 315 (52.1%) |
| Total | 3,984 (47.6%) | 5,524 (66.0%) |
Disability Status by Sex by Age in South Lockport
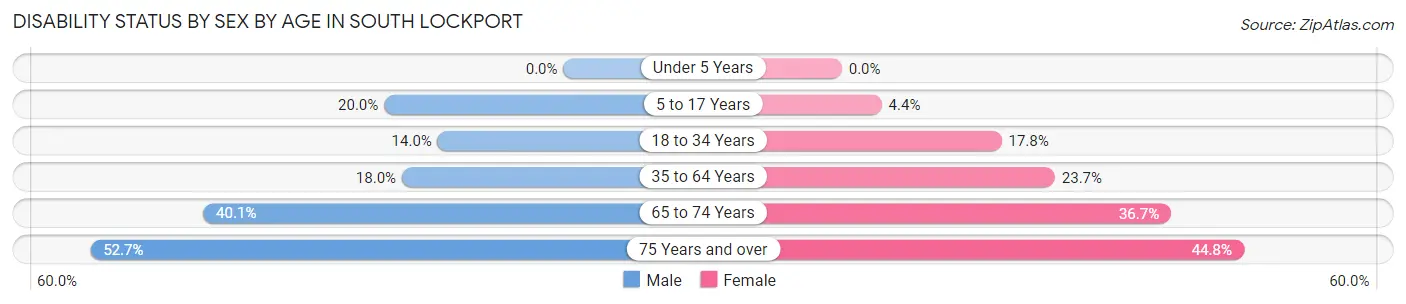
| Age Bracket | Male | Female |
| Under 5 Years | 0 (0.0%) | 0 (0.0%) |
| 5 to 17 Years | 98 (20.0%) | 23 (4.4%) |
| 18 to 34 Years | 120 (14.0%) | 174 (17.8%) |
| 35 to 64 Years | 346 (18.0%) | 428 (23.7%) |
| 65 to 74 Years | 150 (40.1%) | 180 (36.7%) |
| 75 Years and over | 137 (52.7%) | 154 (44.8%) |
Disability Class by Sex by Age in South Lockport
Disability Class: Hearing Difficulty
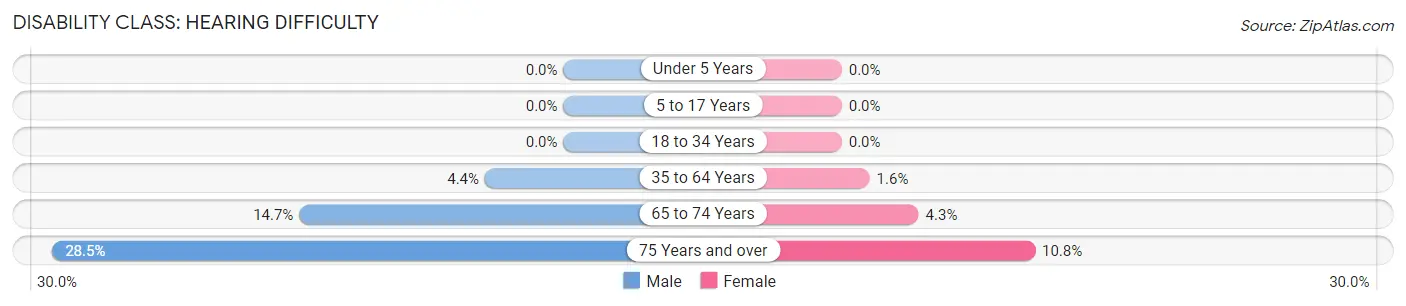
| Age Bracket | Male | Female |
| Under 5 Years | 0 (0.0%) | 0 (0.0%) |
| 5 to 17 Years | 0 (0.0%) | 0 (0.0%) |
| 18 to 34 Years | 0 (0.0%) | 0 (0.0%) |
| 35 to 64 Years | 84 (4.4%) | 28 (1.5%) |
| 65 to 74 Years | 55 (14.7%) | 21 (4.3%) |
| 75 Years and over | 74 (28.5%) | 37 (10.8%) |
Disability Class: Vision Difficulty
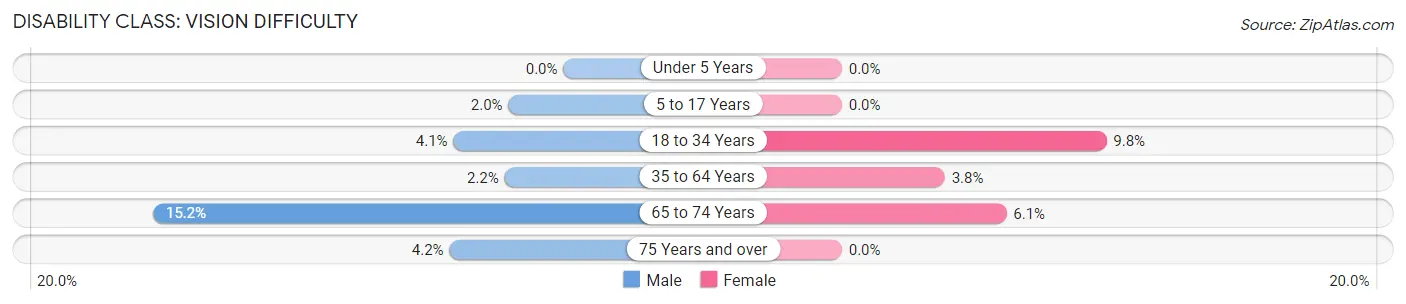
| Age Bracket | Male | Female |
| Under 5 Years | 0 (0.0%) | 0 (0.0%) |
| 5 to 17 Years | 10 (2.0%) | 0 (0.0%) |
| 18 to 34 Years | 35 (4.1%) | 96 (9.8%) |
| 35 to 64 Years | 42 (2.2%) | 69 (3.8%) |
| 65 to 74 Years | 57 (15.2%) | 30 (6.1%) |
| 75 Years and over | 11 (4.2%) | 0 (0.0%) |
Disability Class: Cognitive Difficulty
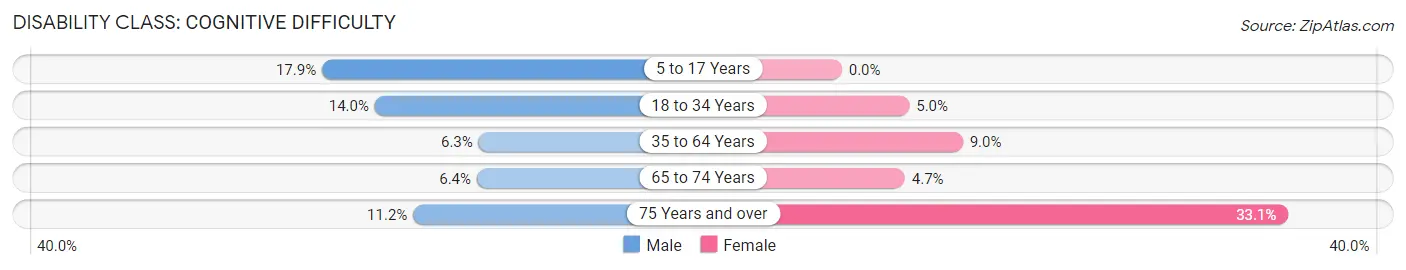
| Age Bracket | Male | Female |
| 5 to 17 Years | 88 (17.9%) | 0 (0.0%) |
| 18 to 34 Years | 120 (14.0%) | 49 (5.0%) |
| 35 to 64 Years | 121 (6.3%) | 162 (9.0%) |
| 65 to 74 Years | 24 (6.4%) | 23 (4.7%) |
| 75 Years and over | 29 (11.2%) | 114 (33.1%) |
Disability Class: Ambulatory Difficulty
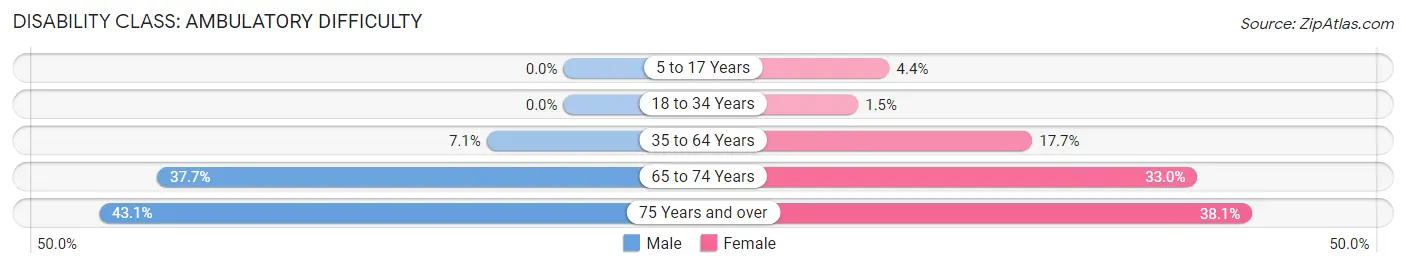
| Age Bracket | Male | Female |
| 5 to 17 Years | 0 (0.0%) | 23 (4.4%) |
| 18 to 34 Years | 0 (0.0%) | 15 (1.5%) |
| 35 to 64 Years | 137 (7.1%) | 319 (17.7%) |
| 65 to 74 Years | 141 (37.7%) | 162 (33.0%) |
| 75 Years and over | 112 (43.1%) | 131 (38.1%) |
Disability Class: Self-Care Difficulty
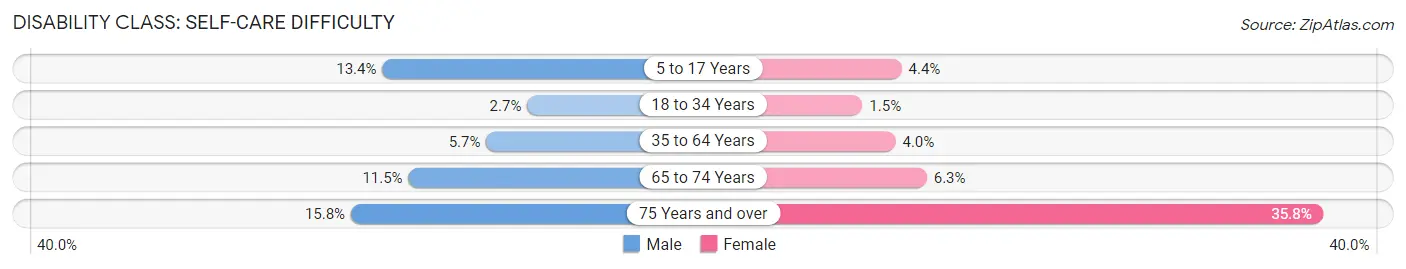
| Age Bracket | Male | Female |
| 5 to 17 Years | 66 (13.4%) | 23 (4.4%) |
| 18 to 34 Years | 23 (2.7%) | 15 (1.5%) |
| 35 to 64 Years | 110 (5.7%) | 72 (4.0%) |
| 65 to 74 Years | 43 (11.5%) | 31 (6.3%) |
| 75 Years and over | 41 (15.8%) | 123 (35.8%) |
Technology Access in South Lockport
Computing Device Access in South Lockport
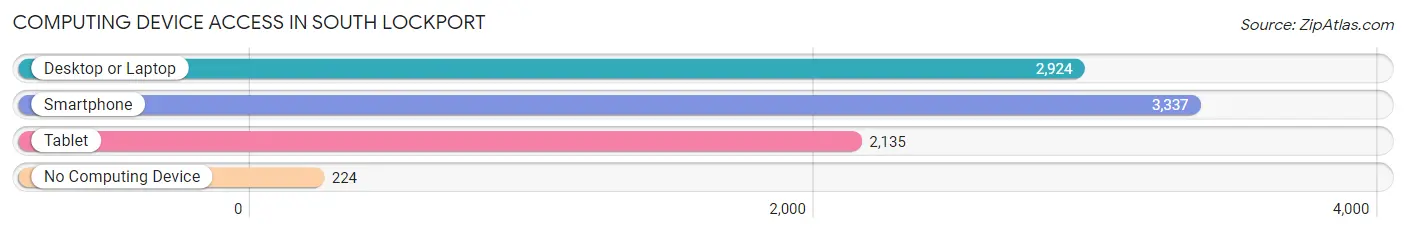
| Device Type | # Households | % Households |
| Desktop or Laptop | 2,924 | 74.5% |
| Smartphone | 3,337 | 85.0% |
| Tablet | 2,135 | 54.4% |
| No Computing Device | 224 | 5.7% |
| Total | 3,927 | 100.0% |
Internet Access in South Lockport
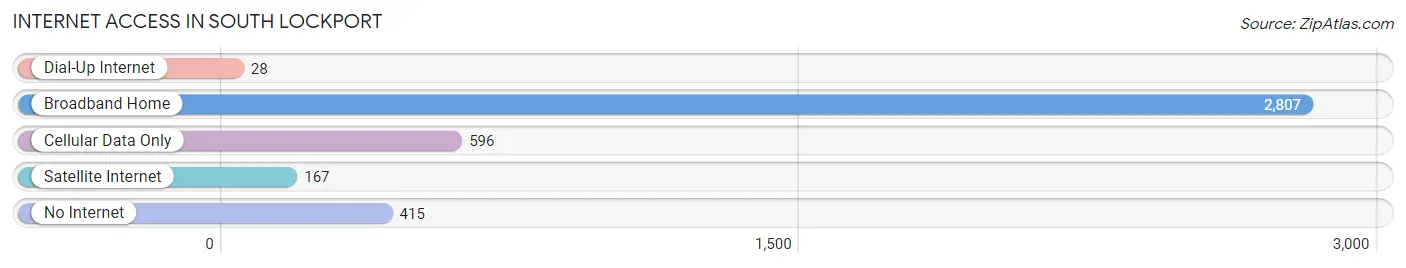
| Internet Type | # Households | % Households |
| Dial-Up Internet | 28 | 0.7% |
| Broadband Home | 2,807 | 71.5% |
| Cellular Data Only | 596 | 15.2% |
| Satellite Internet | 167 | 4.3% |
| No Internet | 415 | 10.6% |
| Total | 3,927 | 100.0% |
South Lockport Summary
Lockport, New York is a city located in Niagara County, New York, United States. The city is located on the Erie Canal and is part of the Buffalo-Niagara Falls metropolitan area. The city is divided into two sections, North Lockport and South Lockport. South Lockport is located south of the canal and is the smaller of the two sections.
History
The area that is now South Lockport was originally inhabited by the Iroquois Native Americans. The first European settlers arrived in the area in the late 1700s. The area was first known as “Lockport” in 1824 when the Erie Canal was built through the area. The canal was a major factor in the growth of the area and the city of Lockport. The city was officially incorporated in 1829.
In the late 1800s, the city of Lockport was divided into two sections, North Lockport and South Lockport. South Lockport was the smaller of the two sections and was primarily a residential area. The area was home to many of the city’s factories and mills.
Geography
South Lockport is located in Niagara County, New York, United States. The city is located on the Erie Canal and is part of the Buffalo-Niagara Falls metropolitan area. The city is divided into two sections, North Lockport and South Lockport. South Lockport is located south of the canal and is the smaller of the two sections.
The city of South Lockport is located in the Niagara River Valley. The city is bordered by the towns of Cambria, Lockport, and Royalton. The city is located approximately 25 miles north of Buffalo and 30 miles south of Niagara Falls.
Economy
The economy of South Lockport is largely based on manufacturing and industry. The city is home to several factories and mills, including the Lockport Manufacturing Company, which produces paper products. The city is also home to several small businesses, including restaurants, retail stores, and service providers.
The city is also home to several educational institutions, including Niagara County Community College and the University at Buffalo.
Demographics
As of the 2010 census, the population of South Lockport was 8,945. The population is primarily white (90.2%) and the median age is 40.7 years. The median household income is $45,945 and the median home value is $117,400.
The city is home to a diverse population, with a large Hispanic population (17.2%) and a small African American population (2.2%). The city is also home to a large number of immigrants, with a foreign-born population of 11.3%.
Conclusion
South Lockport is a city located in Niagara County, New York, United States. The city is located on the Erie Canal and is part of the Buffalo-Niagara Falls metropolitan area. The city is divided into two sections, North Lockport and South Lockport. South Lockport is located south of the canal and is the smaller of the two sections. The city has a long history and has been an important part of the region’s economy for many years. The city is home to many factories and mills, as well as small businesses and educational institutions. The population of South Lockport is primarily white and the median age is 40.7 years. The city is also home to a diverse population, with a large Hispanic population and a small African American population.
Common Questions
What is Per Capita Income in South Lockport?
Per Capita income in South Lockport is $33,610.
What is the Median Family Income in South Lockport?
Median Family Income in South Lockport is $81,545.
What is the Median Household income in South Lockport?
Median Household Income in South Lockport is $48,274.
What is Income or Wage Gap in South Lockport?
Income or Wage Gap in South Lockport is 26.3%.
Women in South Lockport earn 73.7 cents for every dollar earned by a man.
What is Inequality or Gini Index in South Lockport?
Inequality or Gini Index in South Lockport is 0.45.
What is the Total Population of South Lockport?
Total Population of South Lockport is 8,403.
What is the Total Male Population of South Lockport?
Total Male Population of South Lockport is 4,168.
What is the Total Female Population of South Lockport?
Total Female Population of South Lockport is 4,235.
What is the Ratio of Males per 100 Females in South Lockport?
There are 98.42 Males per 100 Females in South Lockport.
What is the Ratio of Females per 100 Males in South Lockport?
There are 101.61 Females per 100 Males in South Lockport.
What is the Median Population Age in South Lockport?
Median Population Age in South Lockport is 44.7 Years.
What is the Average Family Size in South Lockport
Average Family Size in South Lockport is 2.9 People.
What is the Average Household Size in South Lockport
Average Household Size in South Lockport is 2.1 People.
How Large is the Labor Force in South Lockport?
There are 4,512 People in the Labor Forcein in South Lockport.
What is the Percentage of People in the Labor Force in South Lockport?
63.3% of People are in the Labor Force in South Lockport.
What is the Unemployment Rate in South Lockport?
Unemployment Rate in South Lockport is 7.2%.