Cities with the Highest Percentage of West Indian Population in Maryland
RELATED REPORTS & OPTIONS
West Indian
Maryland
Compare Cities
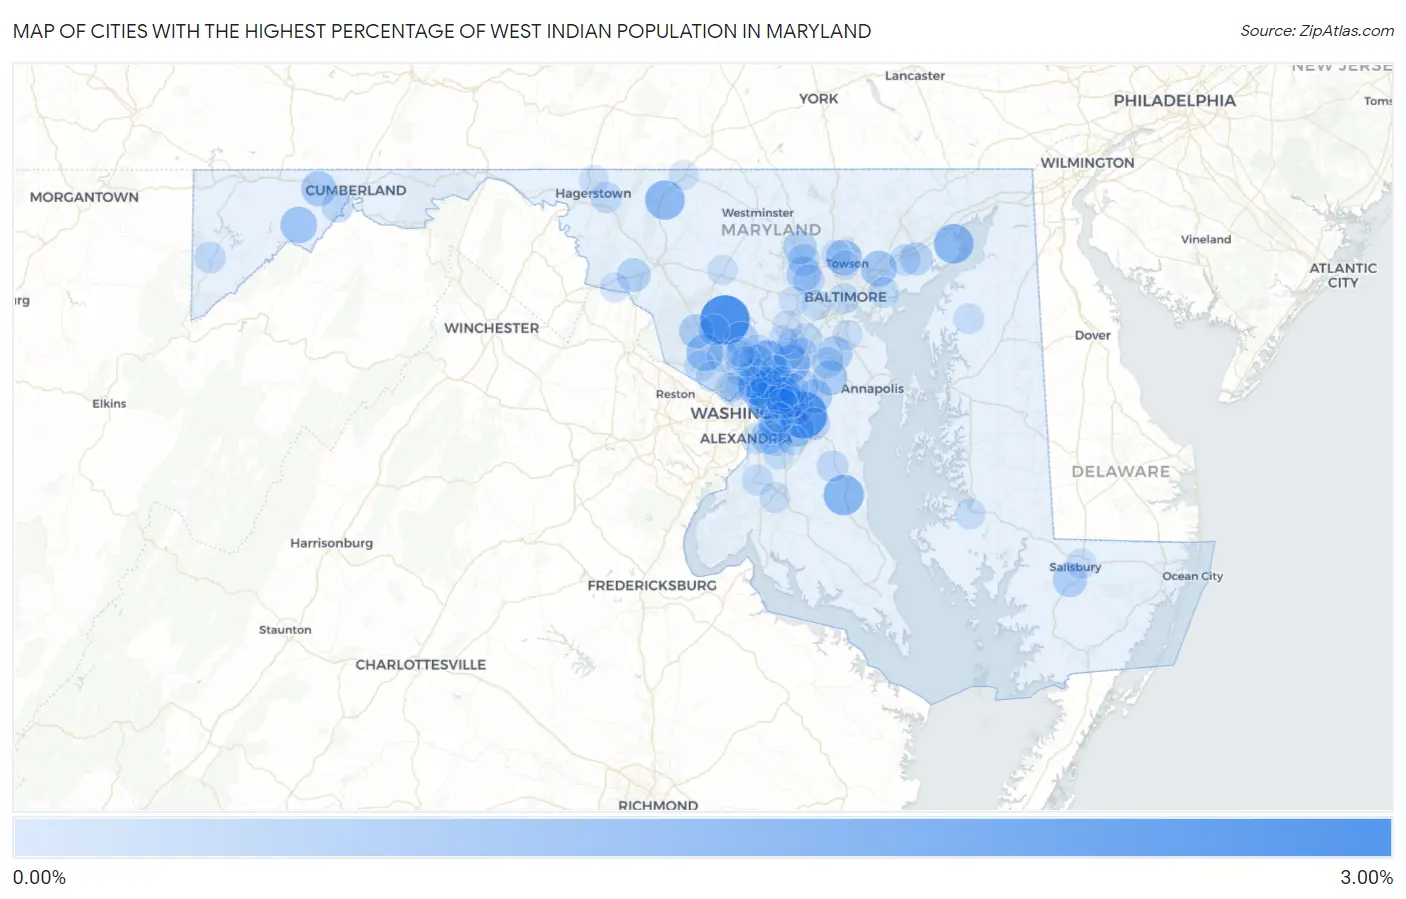
Map of Cities with the Highest Percentage of West Indian Population in Maryland
0.00%
3.00%
Cities with the Highest Percentage of West Indian Population in Maryland
| City | West Indian | vs State | vs National | |
| 1. | Laytonsville | 2.85% | 0.17%(+2.68)#1 | 0.081%(+2.77)#22 |
| 2. | Kettering | 2.45% | 0.17%(+2.28)#2 | 0.081%(+2.37)#32 |
| 3. | Brentwood | 1.85% | 0.17%(+1.68)#3 | 0.081%(+1.77)#53 |
| 4. | University Park | 1.53% | 0.17%(+1.36)#4 | 0.081%(+1.45)#73 |
| 5. | Huntingtown | 1.52% | 0.17%(+1.35)#5 | 0.081%(+1.44)#74 |
| 6. | Aberdeen Proving Ground | 1.41% | 0.17%(+1.23)#6 | 0.081%(+1.33)#78 |
| 7. | Thurmont | 1.39% | 0.17%(+1.22)#7 | 0.081%(+1.31)#80 |
| 8. | Fairland | 1.36% | 0.17%(+1.18)#8 | 0.081%(+1.28)#82 |
| 9. | South Laurel | 1.14% | 0.17%(+0.969)#9 | 0.081%(+1.06)#104 |
| 10. | North Potomac | 1.09% | 0.17%(+0.915)#10 | 0.081%(+1.01)#112 |
| 11. | Barton | 0.99% | 0.17%(+0.816)#11 | 0.081%(+0.909)#131 |
| 12. | Westphalia | 0.92% | 0.17%(+0.749)#12 | 0.081%(+0.843)#145 |
| 13. | Berwyn Heights | 0.91% | 0.17%(+0.731)#13 | 0.081%(+0.825)#154 |
| 14. | White Marsh | 0.90% | 0.17%(+0.725)#14 | 0.081%(+0.819)#156 |
| 15. | Takoma Park | 0.88% | 0.17%(+0.709)#15 | 0.081%(+0.803)#159 |
| 16. | Lutherville | 0.88% | 0.17%(+0.705)#16 | 0.081%(+0.799)#161 |
| 17. | Riverdale Park | 0.81% | 0.17%(+0.635)#17 | 0.081%(+0.729)#182 |
| 18. | Frostburg | 0.79% | 0.17%(+0.612)#18 | 0.081%(+0.706)#191 |
| 19. | Lake Arbor | 0.75% | 0.17%(+0.577)#19 | 0.081%(+0.671)#206 |
| 20. | Gambrills | 0.74% | 0.17%(+0.565)#20 | 0.081%(+0.659)#210 |
| 21. | Randallstown | 0.72% | 0.17%(+0.543)#21 | 0.081%(+0.637)#226 |
| 22. | Crofton | 0.71% | 0.17%(+0.537)#22 | 0.081%(+0.631)#231 |
| 23. | Coral Hills | 0.69% | 0.17%(+0.516)#23 | 0.081%(+0.610)#238 |
| 24. | Bowie | 0.67% | 0.17%(+0.497)#24 | 0.081%(+0.591)#244 |
| 25. | Germantown | 0.67% | 0.17%(+0.492)#25 | 0.081%(+0.585)#248 |
| 26. | Fruitland | 0.66% | 0.17%(+0.486)#26 | 0.081%(+0.580)#251 |
| 27. | Greenbelt | 0.64% | 0.17%(+0.462)#27 | 0.081%(+0.556)#262 |
| 28. | Olney | 0.63% | 0.17%(+0.456)#28 | 0.081%(+0.550)#267 |
| 29. | East Riverdale | 0.63% | 0.17%(+0.456)#29 | 0.081%(+0.550)#268 |
| 30. | Four Corners | 0.62% | 0.17%(+0.444)#30 | 0.081%(+0.537)#274 |
| 31. | Reisterstown | 0.60% | 0.17%(+0.427)#31 | 0.081%(+0.520)#282 |
| 32. | Jefferson | 0.58% | 0.17%(+0.409)#32 | 0.081%(+0.503)#293 |
| 33. | Colesville | 0.56% | 0.17%(+0.387)#33 | 0.081%(+0.481)#303 |
| 34. | Temple Hills | 0.55% | 0.17%(+0.379)#34 | 0.081%(+0.473)#310 |
| 35. | Edgewood | 0.52% | 0.17%(+0.347)#35 | 0.081%(+0.441)#325 |
| 36. | Mount Rainier | 0.48% | 0.17%(+0.310)#36 | 0.081%(+0.403)#358 |
| 37. | Glenn Dale | 0.45% | 0.17%(+0.272)#37 | 0.081%(+0.365)#389 |
| 38. | Glenarden | 0.44% | 0.17%(+0.267)#38 | 0.081%(+0.361)#395 |
| 39. | Brock Hall | 0.44% | 0.17%(+0.264)#39 | 0.081%(+0.358)#399 |
| 40. | Owings Mills | 0.41% | 0.17%(+0.237)#40 | 0.081%(+0.331)#425 |
| 41. | Maryland City | 0.41% | 0.17%(+0.234)#41 | 0.081%(+0.328)#430 |
| 42. | Cresaptown | 0.40% | 0.17%(+0.226)#42 | 0.081%(+0.320)#436 |
| 43. | Springdale | 0.38% | 0.17%(+0.209)#43 | 0.081%(+0.303)#452 |
| 44. | Camp Springs | 0.35% | 0.17%(+0.174)#44 | 0.081%(+0.267)#490 |
| 45. | Chillum | 0.34% | 0.17%(+0.162)#45 | 0.081%(+0.256)#507 |
| 46. | Rockville | 0.33% | 0.17%(+0.152)#46 | 0.081%(+0.245)#522 |
| 47. | Odenton | 0.32% | 0.17%(+0.141)#47 | 0.081%(+0.235)#539 |
| 48. | Jessup | 0.31% | 0.17%(+0.138)#48 | 0.081%(+0.232)#544 |
| 49. | Robinwood | 0.31% | 0.17%(+0.138)#49 | 0.081%(+0.232)#545 |
| 50. | Laurel | 0.31% | 0.17%(+0.136)#50 | 0.081%(+0.230)#547 |
| 51. | Dunkirk | 0.31% | 0.17%(+0.133)#51 | 0.081%(+0.227)#554 |
| 52. | Milford Mill | 0.30% | 0.17%(+0.130)#52 | 0.081%(+0.224)#559 |
| 53. | Oakland | 0.30% | 0.17%(+0.126)#53 | 0.081%(+0.220)#566 |
| 54. | Chevy Chase | 0.30% | 0.17%(+0.122)#54 | 0.081%(+0.216)#573 |
| 55. | Joppatowne | 0.29% | 0.17%(+0.117)#55 | 0.081%(+0.211)#588 |
| 56. | Seabrook | 0.29% | 0.17%(+0.115)#56 | 0.081%(+0.208)#593 |
| 57. | Brown Station | 0.27% | 0.17%(+0.100)#57 | 0.081%(+0.193)#617 |
| 58. | New Carrollton | 0.27% | 0.17%(+0.098)#58 | 0.081%(+0.192)#620 |
| 59. | North Kensington | 0.27% | 0.17%(+0.097)#59 | 0.081%(+0.191)#621 |
| 60. | Adelphi | 0.26% | 0.17%(+0.085)#60 | 0.081%(+0.179)#648 |
| 61. | Travilah | 0.25% | 0.17%(+0.074)#61 | 0.081%(+0.168)#664 |
| 62. | Baltimore | 0.24% | 0.17%(+0.063)#62 | 0.081%(+0.157)#689 |
| 63. | Essex | 0.24% | 0.17%(+0.063)#63 | 0.081%(+0.157)#691 |
| 64. | Montgomery Village | 0.24% | 0.17%(+0.061)#64 | 0.081%(+0.155)#693 |
| 65. | Accokeek | 0.24% | 0.17%(+0.061)#65 | 0.081%(+0.155)#695 |
| 66. | Clinton | 0.23% | 0.17%(+0.052)#66 | 0.081%(+0.145)#714 |
| 67. | Cloverly | 0.23% | 0.17%(+0.051)#67 | 0.081%(+0.144)#716 |
| 68. | Silver Spring | 0.22% | 0.17%(+0.049)#68 | 0.081%(+0.143)#722 |
| 69. | Suitland | 0.21% | 0.17%(+0.038)#69 | 0.081%(+0.132)#745 |
| 70. | Melwood | 0.20% | 0.17%(+0.029)#70 | 0.081%(+0.123)#773 |
| 71. | Somerset | 0.19% | 0.17%(+0.020)#71 | 0.081%(+0.114)#792 |
| 72. | Forest Heights | 0.19% | 0.17%(+0.015)#72 | 0.081%(+0.109)#806 |
| 73. | Landover Hills | 0.19% | 0.17%(+0.014)#73 | 0.081%(+0.108)#808 |
| 74. | Chestertown | 0.18% | 0.17%(+0.007)#74 | 0.081%(+0.100)#827 |
| 75. | Cambridge | 0.17% | 0.17%(-0.006)#75 | 0.081%(+0.088)#870 |
| 76. | Woodlawn Cdp Baltimore County | 0.17% | 0.17%(-0.006)#76 | 0.081%(+0.087)#871 |
| 77. | Aspen Hill | 0.17% | 0.17%(-0.007)#77 | 0.081%(+0.087)#872 |
| 78. | Waldorf | 0.17% | 0.17%(-0.009)#78 | 0.081%(+0.085)#883 |
| 79. | Landover | 0.16% | 0.17%(-0.011)#79 | 0.081%(+0.083)#893 |
| 80. | Catonsville | 0.16% | 0.17%(-0.011)#80 | 0.081%(+0.083)#894 |
| 81. | Glenmont | 0.16% | 0.17%(-0.012)#81 | 0.081%(+0.082)#899 |
| 82. | North Laurel | 0.16% | 0.17%(-0.019)#82 | 0.081%(+0.075)#923 |
| 83. | Mays Chapel | 0.15% | 0.17%(-0.025)#83 | 0.081%(+0.069)#954 |
| 84. | Flower Hill | 0.14% | 0.17%(-0.031)#84 | 0.081%(+0.063)#976 |
| 85. | Salisbury | 0.14% | 0.17%(-0.032)#85 | 0.081%(+0.062)#978 |
| 86. | Brunswick | 0.14% | 0.17%(-0.033)#86 | 0.081%(+0.061)#983 |
| 87. | Beltsville | 0.14% | 0.17%(-0.038)#87 | 0.081%(+0.056)#1,004 |
| 88. | Silver Hill | 0.13% | 0.17%(-0.046)#88 | 0.081%(+0.048)#1,030 |
| 89. | Capitol Heights | 0.12% | 0.17%(-0.051)#89 | 0.081%(+0.043)#1,046 |
| 90. | Glen Burnie | 0.12% | 0.17%(-0.058)#90 | 0.081%(+0.035)#1,089 |
| 91. | Mount Airy | 0.11% | 0.17%(-0.061)#91 | 0.081%(+0.033)#1,096 |
| 92. | Leisure World | 0.11% | 0.17%(-0.063)#92 | 0.081%(+0.031)#1,107 |
| 93. | Bethesda | 0.11% | 0.17%(-0.066)#93 | 0.081%(+0.028)#1,121 |
| 94. | Emmitsburg | 0.11% | 0.17%(-0.068)#94 | 0.081%(+0.026)#1,134 |
| 95. | Ellicott City | 0.10% | 0.17%(-0.074)#95 | 0.081%(+0.020)#1,156 |
| 96. | Fountainhead Orchard Hills | 0.097% | 0.17%(-0.078)#96 | 0.081%(+0.016)#1,184 |
| 97. | Towson | 0.095% | 0.17%(-0.079)#97 | 0.081%(+0.015)#1,192 |
| 98. | Columbia | 0.094% | 0.17%(-0.081)#98 | 0.081%(+0.013)#1,207 |
| 99. | Scaggsville | 0.093% | 0.17%(-0.082)#99 | 0.081%(+0.012)#1,218 |
| 100. | Potomac | 0.090% | 0.17%(-0.084)#100 | 0.081%(+0.010)#1,229 |
Common Questions
What are the Top 10 Cities with the Highest Percentage of West Indian Population in Maryland?
Top 10 Cities with the Highest Percentage of West Indian Population in Maryland are:
#1
2.85%
#2
2.45%
#3
1.85%
#4
1.53%
#5
1.52%
#6
1.41%
#7
1.39%
#8
1.36%
#9
1.14%
#10
1.09%
What city has the Highest Percentage of West Indian Population in Maryland?
Laytonsville has the Highest Percentage of West Indian Population in Maryland with 2.85%.
What is the Percentage of West Indian Population in the State of Maryland?
Percentage of West Indian Population in Maryland is 0.17%.
What is the Percentage of West Indian Population in the United States?
Percentage of West Indian Population in the United States is 0.081%.