Tillson, NY Map & Demographics
Tillson Map
Tillson Overview
$40,860
PER CAPITA INCOME
$106,635
AVG FAMILY INCOME
$86,276
AVG HOUSEHOLD INCOME
0.36
INEQUALITY / GINI INDEX
1,782
TOTAL POPULATION
915
MALE POPULATION
867
FEMALE POPULATION
105.54
MALES / 100 FEMALES
94.75
FEMALES / 100 MALES
52.7
MEDIAN AGE
4.0
AVG FAMILY SIZE
2.7
AVG HOUSEHOLD SIZE
1,195
LABOR FORCE [ PEOPLE ]
79.8%
PERCENT IN LABOR FORCE
1.0%
UNEMPLOYMENT RATE
Tillson Zip Codes
Tillson Area Codes
Income in Tillson
Income Overview in Tillson
Per Capita Income in Tillson is $40,860, while median incomes of families and households are $106,635 and $86,276 respectively.
| Characteristic | Number | Measure |
| Per Capita Income | 1,782 | $40,860 |
| Median Family Income | 351 | $106,635 |
| Mean Family Income | 351 | $119,125 |
| Median Household Income | 670 | $86,276 |
| Mean Household Income | 670 | $94,858 |
| Income Deficit | 351 | $0 |
| Wage / Income Gap (%) | 1,782 | 0.00% |
| Wage / Income Gap ($) | 1,782 | 100.00¢ per $1 |
| Gini / Inequality Index | 1,782 | 0.36 |
Earnings by Sex in Tillson
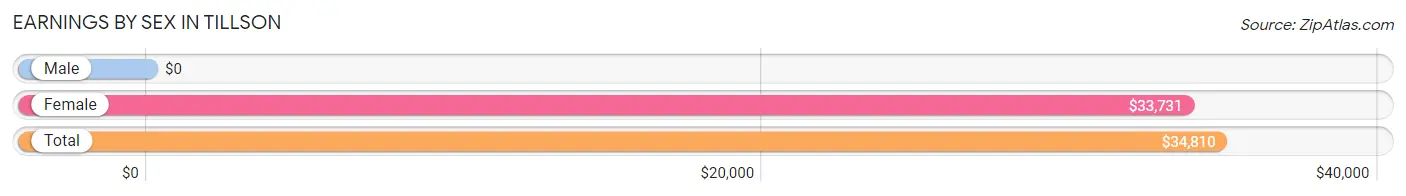
| Sex | Number | Average Earnings |
| Male | 606 (50.2%) | $0 |
| Female | 601 (49.8%) | $33,731 |
| Total | 1,207 (100.0%) | $34,810 |
Earnings by Sex by Income Bracket in Tillson
The most common earnings brackets in Tillson are $30,000 to $34,999 for men (270 | 44.6%) and $15,000 to $17,499 for women (226 | 37.6%).
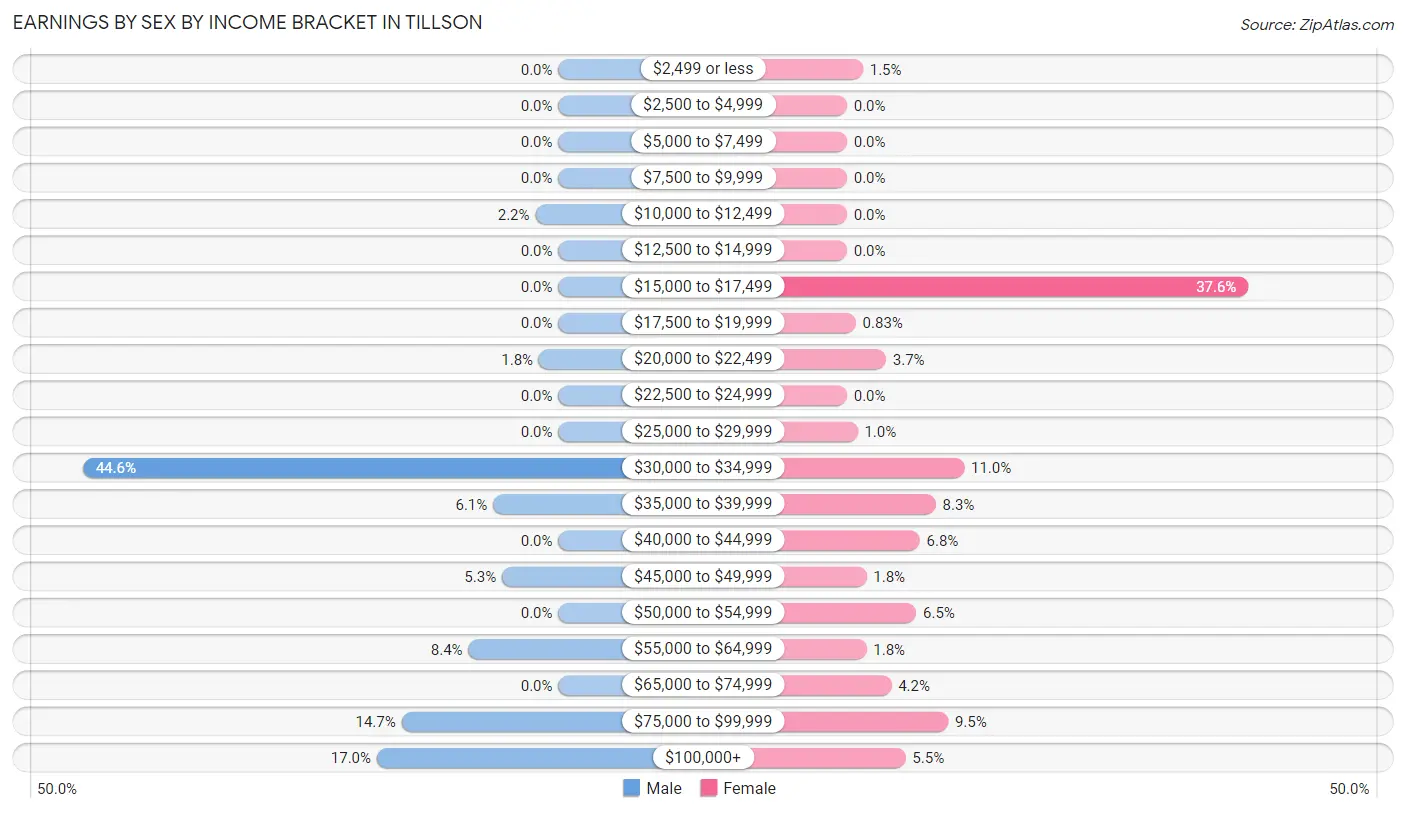
| Income | Male | Female |
| $2,499 or less | 0 (0.0%) | 9 (1.5%) |
| $2,500 to $4,999 | 0 (0.0%) | 0 (0.0%) |
| $5,000 to $7,499 | 0 (0.0%) | 0 (0.0%) |
| $7,500 to $9,999 | 0 (0.0%) | 0 (0.0%) |
| $10,000 to $12,499 | 13 (2.1%) | 0 (0.0%) |
| $12,500 to $14,999 | 0 (0.0%) | 0 (0.0%) |
| $15,000 to $17,499 | 0 (0.0%) | 226 (37.6%) |
| $17,500 to $19,999 | 0 (0.0%) | 5 (0.8%) |
| $20,000 to $22,499 | 11 (1.8%) | 22 (3.7%) |
| $22,500 to $24,999 | 0 (0.0%) | 0 (0.0%) |
| $25,000 to $29,999 | 0 (0.0%) | 6 (1.0%) |
| $30,000 to $34,999 | 270 (44.6%) | 66 (11.0%) |
| $35,000 to $39,999 | 37 (6.1%) | 50 (8.3%) |
| $40,000 to $44,999 | 0 (0.0%) | 41 (6.8%) |
| $45,000 to $49,999 | 32 (5.3%) | 11 (1.8%) |
| $50,000 to $54,999 | 0 (0.0%) | 39 (6.5%) |
| $55,000 to $64,999 | 51 (8.4%) | 11 (1.8%) |
| $65,000 to $74,999 | 0 (0.0%) | 25 (4.2%) |
| $75,000 to $99,999 | 89 (14.7%) | 57 (9.5%) |
| $100,000+ | 103 (17.0%) | 33 (5.5%) |
| Total | 606 (100.0%) | 601 (100.0%) |
Earnings by Sex by Educational Attainment in Tillson
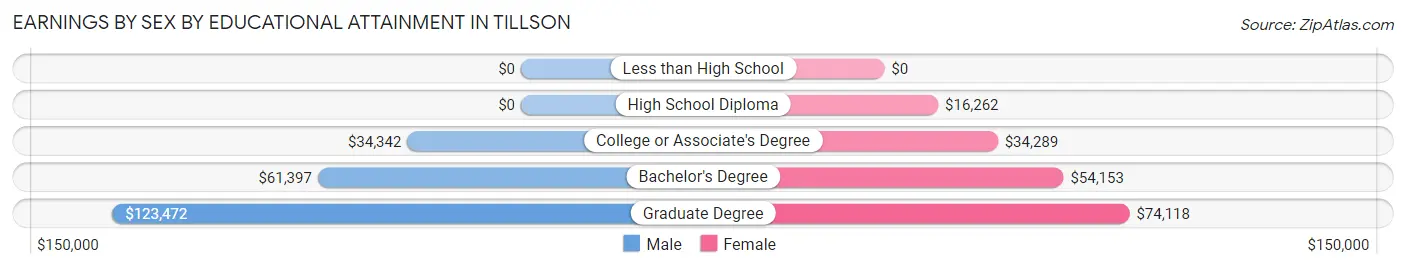
| Educational Attainment | Male Income | Female Income |
| Less than High School | - | - |
| High School Diploma | - | - |
| College or Associate's Degree | $34,342 | $34,289 |
| Bachelor's Degree | $61,397 | $54,153 |
| Graduate Degree | $123,472 | $74,118 |
| Total | - | - |
Family Income in Tillson
Family Income Brackets in Tillson
According to the Tillson family income data, there are 110 families falling into the $100,000 to $149,999 income range, which is the most common income bracket and makes up 31.3% of all families.
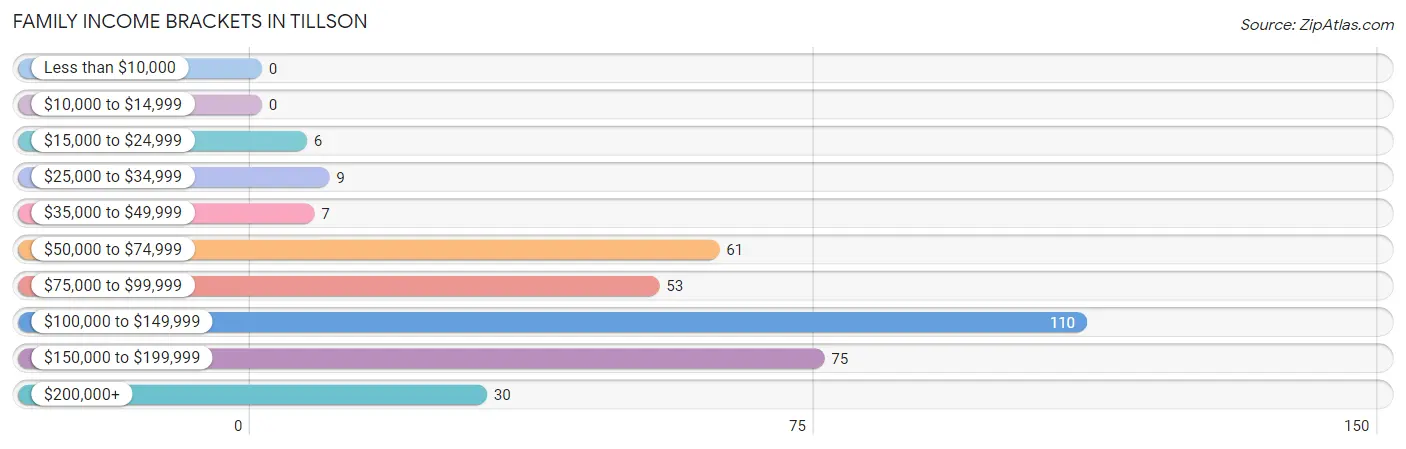
| Income Bracket | # Families | % Families |
| Less than $10,000 | 0 | 0.0% |
| $10,000 to $14,999 | 0 | 0.0% |
| $15,000 to $24,999 | 6 | 1.7% |
| $25,000 to $34,999 | 9 | 2.6% |
| $35,000 to $49,999 | 7 | 2.0% |
| $50,000 to $74,999 | 61 | 17.4% |
| $75,000 to $99,999 | 53 | 15.1% |
| $100,000 to $149,999 | 110 | 31.3% |
| $150,000 to $199,999 | 75 | 21.4% |
| $200,000+ | 30 | 8.5% |
Family Income by Famaliy Size in Tillson
4-person families (51 | 14.5%) account for the highest median family income in Tillson with $171,375 per family, while 2-person families (153 | 43.6%) have the highest median income of $53,606 per family member.
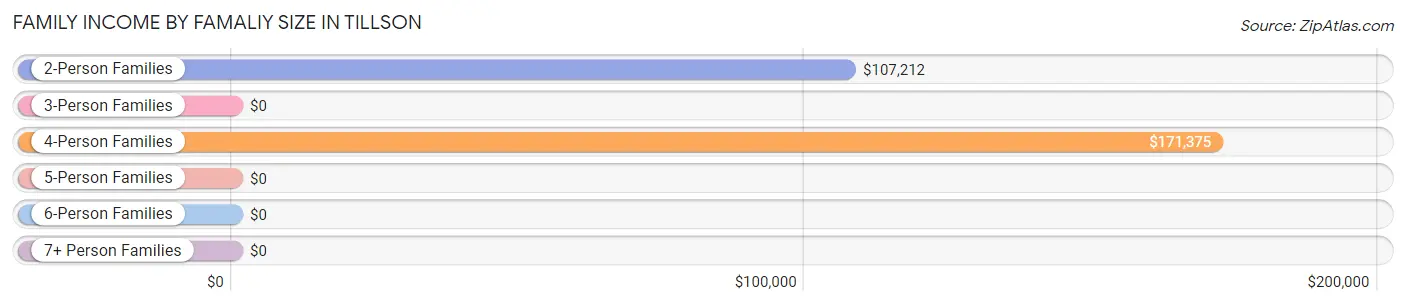
| Income Bracket | # Families | Median Income |
| 2-Person Families | 153 (43.6%) | $107,212 |
| 3-Person Families | 104 (29.6%) | $0 |
| 4-Person Families | 51 (14.5%) | $171,375 |
| 5-Person Families | 34 (9.7%) | $0 |
| 6-Person Families | 9 (2.6%) | $0 |
| 7+ Person Families | 0 (0.0%) | $0 |
| Total | 351 (100.0%) | $106,635 |
Family Income by Number of Earners in Tillson
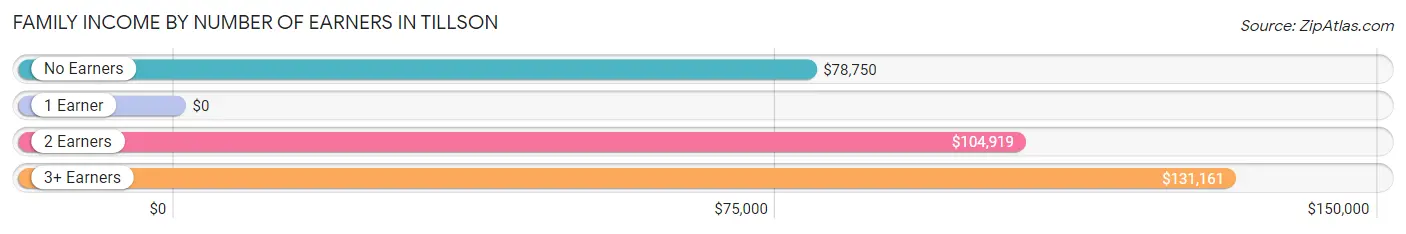
| Number of Earners | # Families | Median Income |
| No Earners | 34 (9.7%) | $78,750 |
| 1 Earner | 131 (37.3%) | $0 |
| 2 Earners | 136 (38.8%) | $104,919 |
| 3+ Earners | 50 (14.2%) | $131,161 |
| Total | 351 (100.0%) | $106,635 |
Household Income in Tillson
Household Income Brackets in Tillson
With 152 households falling in the category, the $100,000 to $149,999 income range is the most frequent in Tillson, accounting for 22.7% of all households.
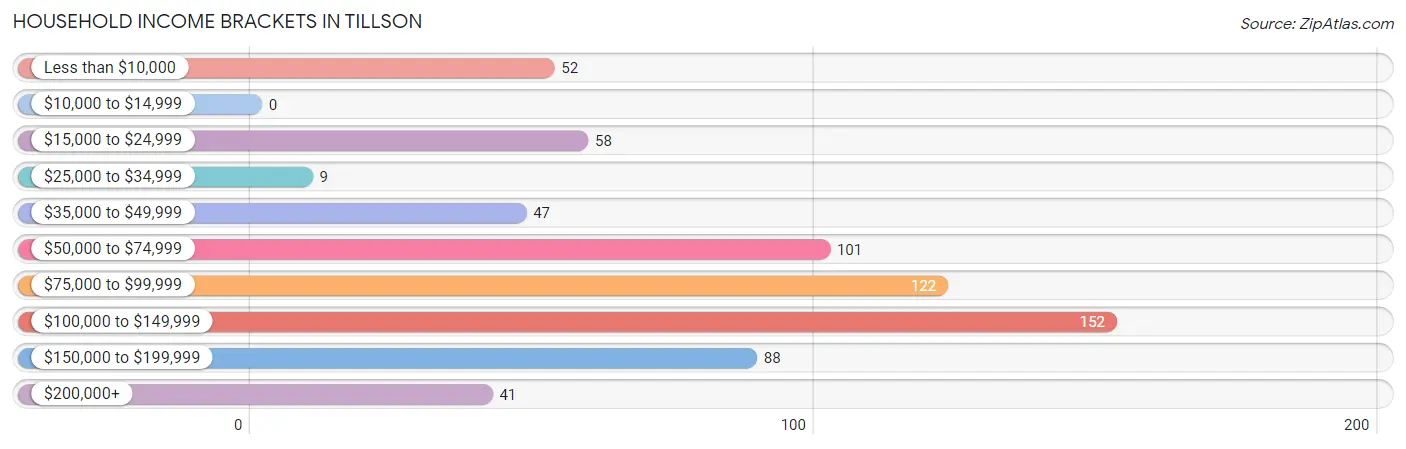
| Income Bracket | # Households | % Households |
| Less than $10,000 | 52 | 7.8% |
| $10,000 to $14,999 | 0 | 0.0% |
| $15,000 to $24,999 | 58 | 8.7% |
| $25,000 to $34,999 | 9 | 1.3% |
| $35,000 to $49,999 | 47 | 7.0% |
| $50,000 to $74,999 | 101 | 15.1% |
| $75,000 to $99,999 | 122 | 18.2% |
| $100,000 to $149,999 | 152 | 22.7% |
| $150,000 to $199,999 | 88 | 13.1% |
| $200,000+ | 41 | 6.1% |
Household Income by Householder Age in Tillson
The median household income in Tillson is $86,276, with the highest median household income of $105,938 found in the 25 to 44 years age bracket for the primary householder. A total of 261 households (39.0%) fall into this category. Meanwhile, the 15 to 24 years age bracket for the primary householder has the lowest median household income of $0, with 11 households (1.6%) in this group.
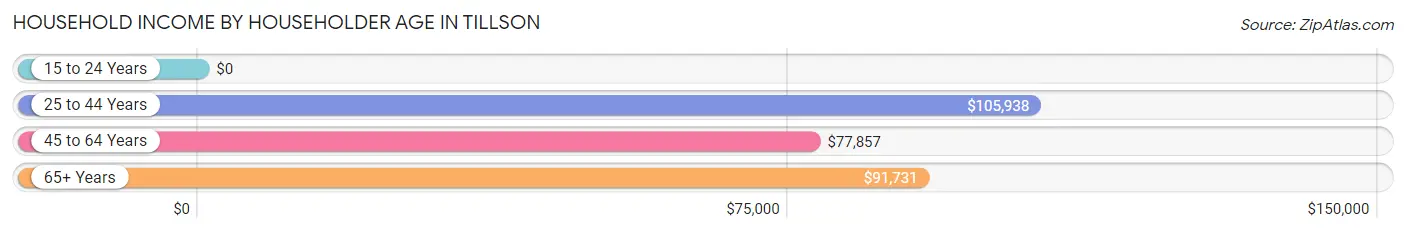
| Income Bracket | # Households | Median Income |
| 15 to 24 Years | 11 (1.6%) | $0 |
| 25 to 44 Years | 261 (39.0%) | $105,938 |
| 45 to 64 Years | 252 (37.6%) | $77,857 |
| 65+ Years | 146 (21.8%) | $91,731 |
| Total | 670 (100.0%) | $86,276 |
Poverty in Tillson
Income Below Poverty by Sex and Age in Tillson
With 5.6% poverty level for males and 9.9% for females among the residents of Tillson, 55 to 64 year old males and 12 to 14 year old females are the most vulnerable to poverty, with 28 males (39.4%) and 15 females (100.0%) in their respective age groups living below the poverty level.
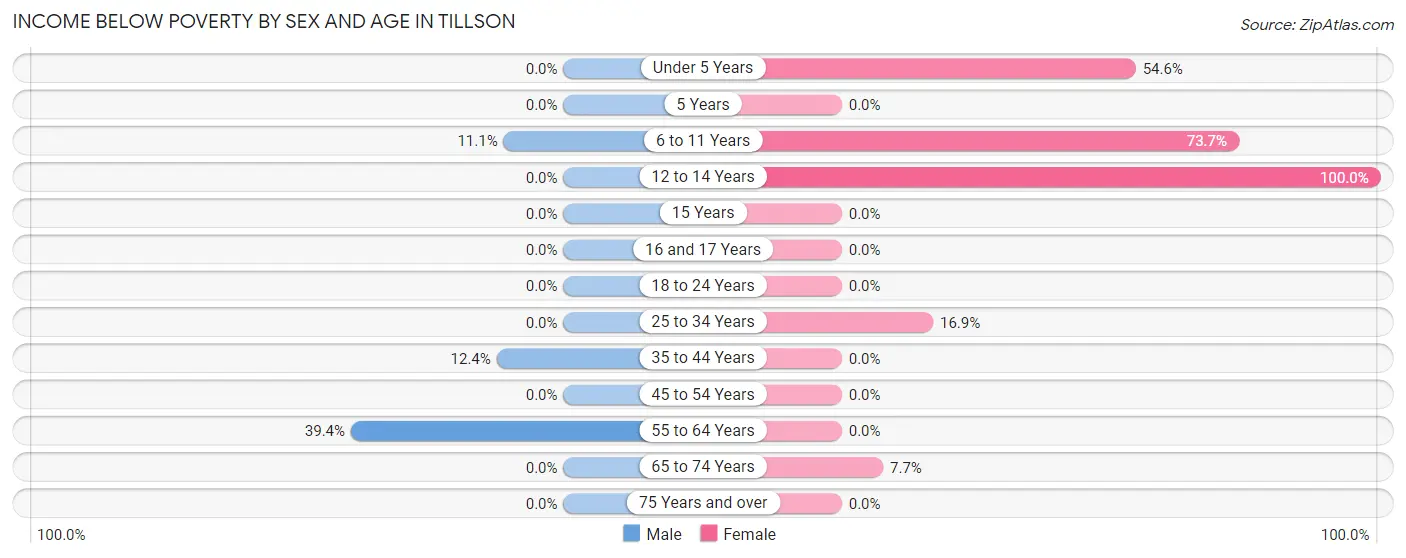
| Age Bracket | Male | Female |
| Under 5 Years | 0 (0.0%) | 12 (54.5%) |
| 5 Years | 0 (0.0%) | 0 (0.0%) |
| 6 to 11 Years | 9 (11.1%) | 14 (73.7%) |
| 12 to 14 Years | 0 (0.0%) | 15 (100.0%) |
| 15 Years | 0 (0.0%) | 0 (0.0%) |
| 16 and 17 Years | 0 (0.0%) | 0 (0.0%) |
| 18 to 24 Years | 0 (0.0%) | 0 (0.0%) |
| 25 to 34 Years | 0 (0.0%) | 21 (16.9%) |
| 35 to 44 Years | 14 (12.4%) | 0 (0.0%) |
| 45 to 54 Years | 0 (0.0%) | 0 (0.0%) |
| 55 to 64 Years | 28 (39.4%) | 0 (0.0%) |
| 65 to 74 Years | 0 (0.0%) | 24 (7.7%) |
| 75 Years and over | 0 (0.0%) | 0 (0.0%) |
| Total | 51 (5.6%) | 86 (9.9%) |
Income Above Poverty by Sex and Age in Tillson
According to the poverty statistics in Tillson, males aged under 5 years and females aged 5 years are the age groups that are most secure financially, with 100.0% of males and 100.0% of females in these age groups living above the poverty line.
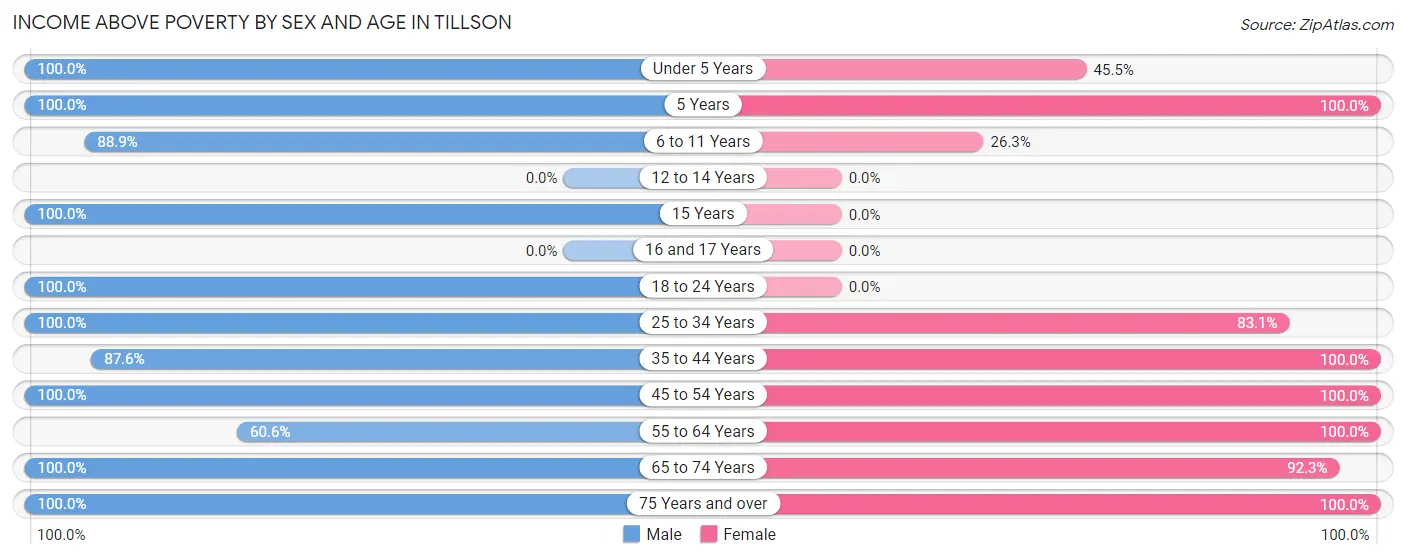
| Age Bracket | Male | Female |
| Under 5 Years | 23 (100.0%) | 10 (45.5%) |
| 5 Years | 59 (100.0%) | 48 (100.0%) |
| 6 to 11 Years | 72 (88.9%) | 5 (26.3%) |
| 12 to 14 Years | 0 (0.0%) | 0 (0.0%) |
| 15 Years | 18 (100.0%) | 0 (0.0%) |
| 16 and 17 Years | 0 (0.0%) | 0 (0.0%) |
| 18 to 24 Years | 11 (100.0%) | 0 (0.0%) |
| 25 to 34 Years | 95 (100.0%) | 103 (83.1%) |
| 35 to 44 Years | 99 (87.6%) | 110 (100.0%) |
| 45 to 54 Years | 127 (100.0%) | 134 (100.0%) |
| 55 to 64 Years | 43 (60.6%) | 48 (100.0%) |
| 65 to 74 Years | 291 (100.0%) | 289 (92.3%) |
| 75 Years and over | 26 (100.0%) | 34 (100.0%) |
| Total | 864 (94.4%) | 781 (90.1%) |
Income Below Poverty Among Married-Couple Families in Tillson
The poverty statistics for married-couple families in Tillson show that 3.7% or 9 of the total 241 families live below the poverty line. Families with 3 or 4 children have the highest poverty rate of 60.0%, comprising of 9 families. On the other hand, families with no children have the lowest poverty rate of 0.0%, which includes 0 families.
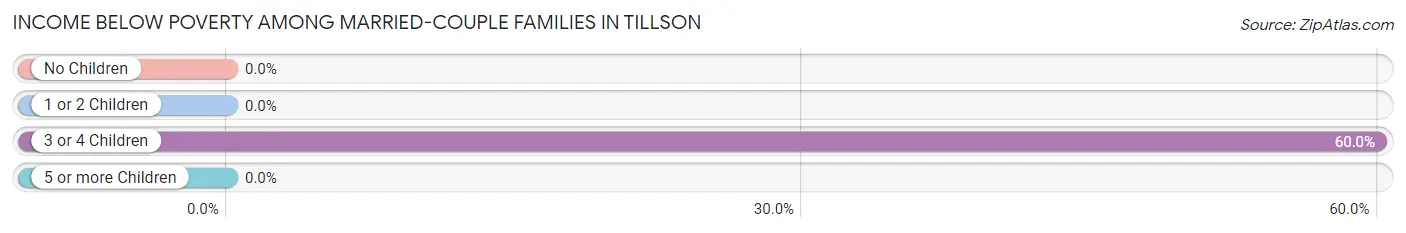
| Children | Above Poverty | Below Poverty |
| No Children | 126 (100.0%) | 0 (0.0%) |
| 1 or 2 Children | 100 (100.0%) | 0 (0.0%) |
| 3 or 4 Children | 6 (40.0%) | 9 (60.0%) |
| 5 or more Children | 0 (0.0%) | 0 (0.0%) |
| Total | 232 (96.3%) | 9 (3.7%) |
Income Below Poverty Among Single-Parent Households in Tillson
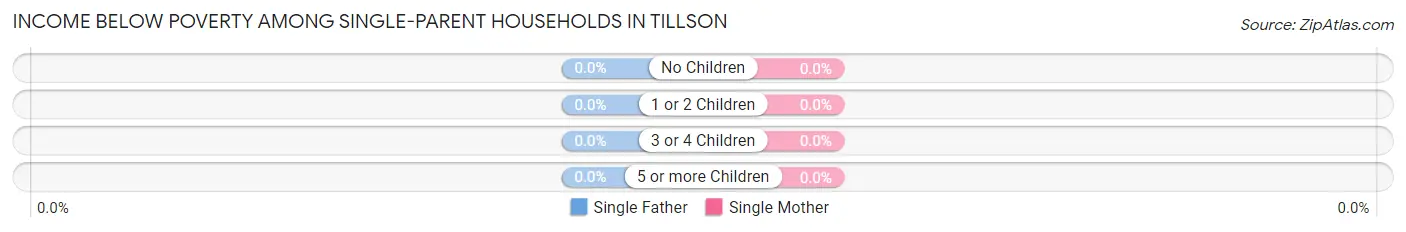
| Children | Single Father | Single Mother |
| No Children | 0 (0.0%) | 0 (0.0%) |
| 1 or 2 Children | 0 (0.0%) | 0 (0.0%) |
| 3 or 4 Children | 0 (0.0%) | 0 (0.0%) |
| 5 or more Children | 0 (0.0%) | 0 (0.0%) |
| Total | 0 (0.0%) | 0 (0.0%) |
Income Below Poverty Among Married-Couple vs Single-Parent Households in Tillson
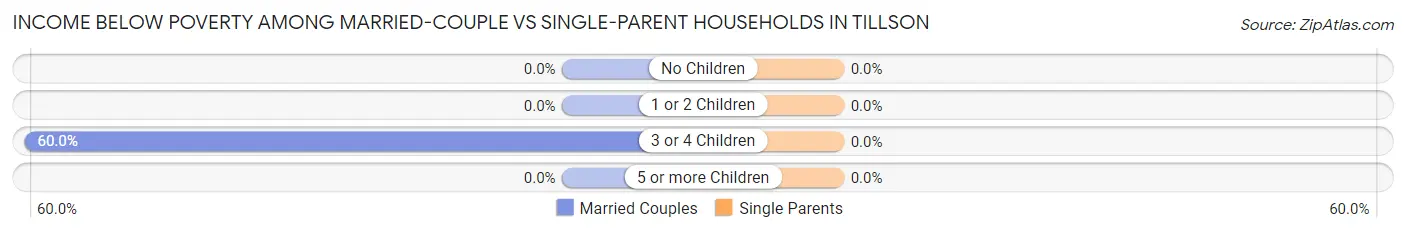
| Children | Married-Couple Families | Single-Parent Households |
| No Children | 0 (0.0%) | 0 (0.0%) |
| 1 or 2 Children | 0 (0.0%) | 0 (0.0%) |
| 3 or 4 Children | 9 (60.0%) | 0 (0.0%) |
| 5 or more Children | 0 (0.0%) | 0 (0.0%) |
| Total | 9 (3.7%) | 0 (0.0%) |
Race in Tillson
The most populous races in Tillson are White / Caucasian (1,074 | 60.3%), Some other Race (526 | 29.5%), and Hispanic or Latino (158 | 8.9%).
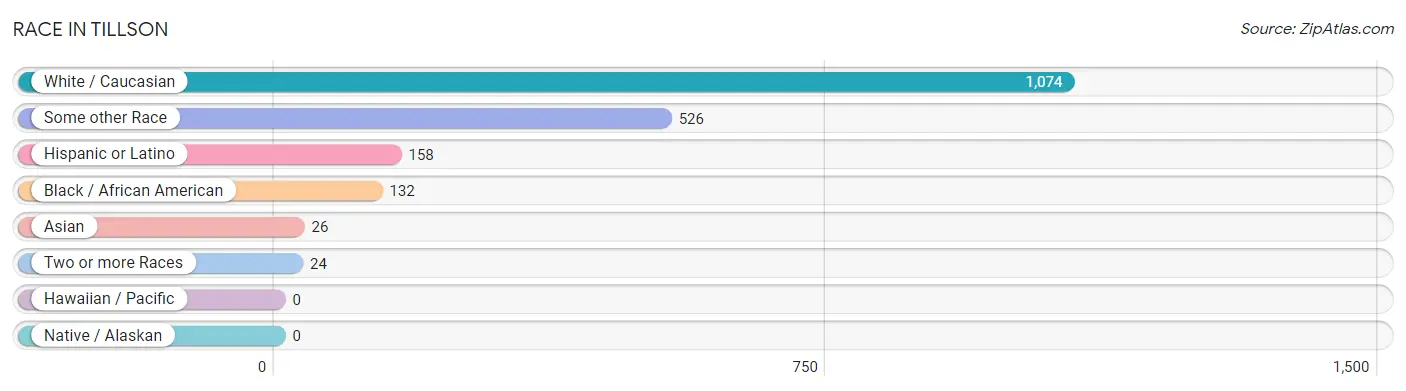
| Race | # Population | % Population |
| Asian | 26 | 1.5% |
| Black / African American | 132 | 7.4% |
| Hawaiian / Pacific | 0 | 0.0% |
| Hispanic or Latino | 158 | 8.9% |
| Native / Alaskan | 0 | 0.0% |
| White / Caucasian | 1,074 | 60.3% |
| Two or more Races | 24 | 1.3% |
| Some other Race | 526 | 29.5% |
| Total | 1,782 | 100.0% |
Ancestry in Tillson
The most populous ancestries reported in Tillson are West Indian (530 | 29.7%), Irish (426 | 23.9%), German (316 | 17.7%), English (277 | 15.5%), and Italian (273 | 15.3%), together accounting for 102.2% of all Tillson residents.
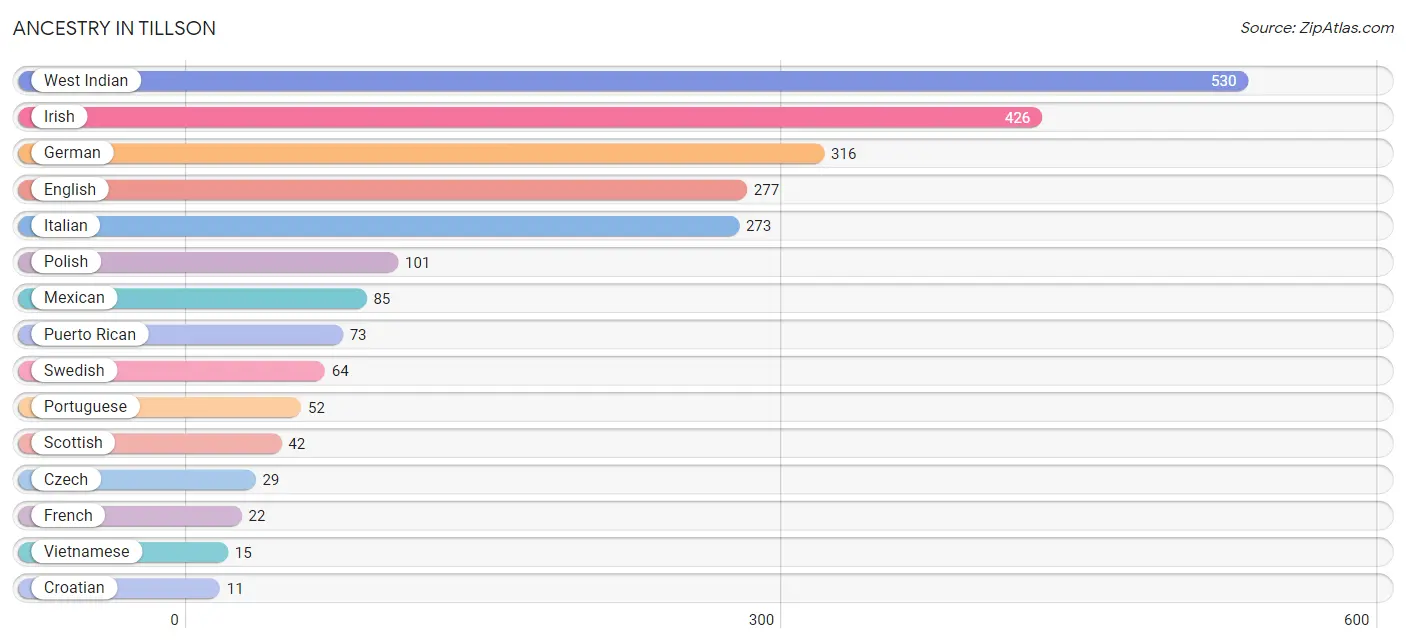
| Ancestry | # Population | % Population |
| American | 7 | 0.4% |
| Croatian | 11 | 0.6% |
| Czech | 29 | 1.6% |
| Eastern European | 2 | 0.1% |
| English | 277 | 15.5% |
| European | 3 | 0.2% |
| French | 22 | 1.2% |
| German | 316 | 17.7% |
| Hungarian | 8 | 0.4% |
| Irish | 426 | 23.9% |
| Italian | 273 | 15.3% |
| Mexican | 85 | 4.8% |
| Northern European | 9 | 0.5% |
| Polish | 101 | 5.7% |
| Portuguese | 52 | 2.9% |
| Puerto Rican | 73 | 4.1% |
| Scotch-Irish | 7 | 0.4% |
| Scottish | 42 | 2.4% |
| Swedish | 64 | 3.6% |
| Vietnamese | 15 | 0.8% |
| Welsh | 11 | 0.6% |
| West Indian | 530 | 29.7% | View All 22 Rows |
Immigrants in Tillson
The most numerous immigrant groups reported in Tillson came from Latin America (489 | 27.4%), Caribbean (441 | 24.7%), West Indies (441 | 24.7%), Central America (48 | 2.7%), and Mexico (48 | 2.7%), together accounting for 82.3% of all Tillson residents.
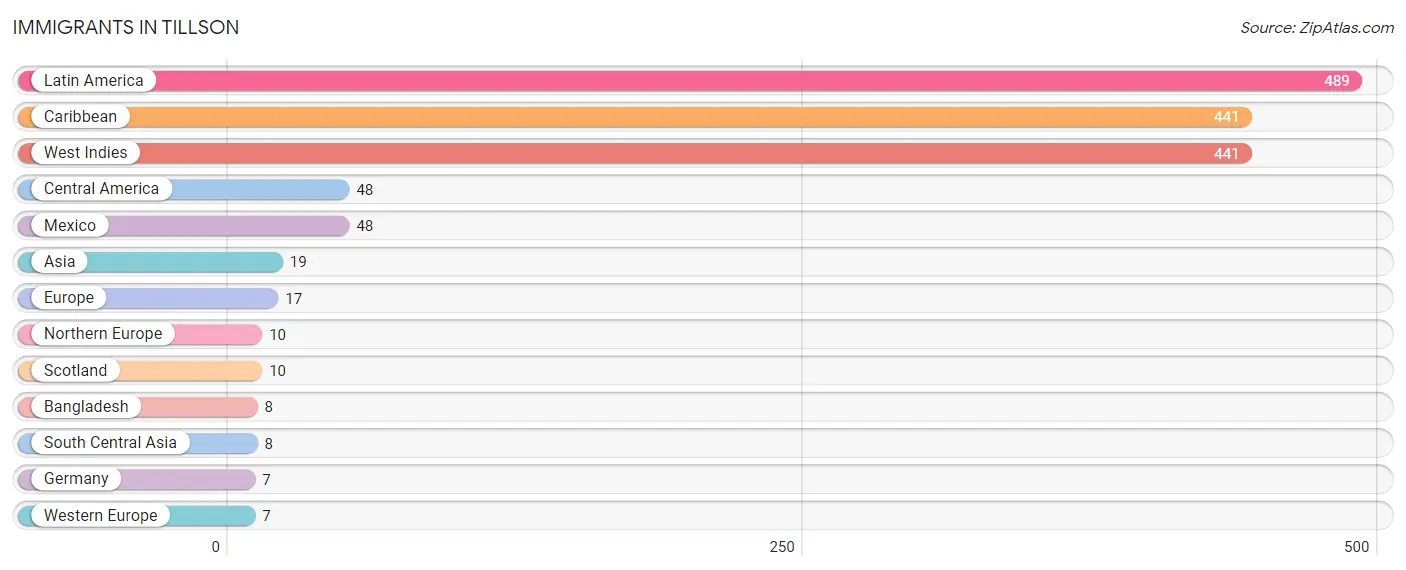
| Immigration Origin | # Population | % Population |
| Asia | 19 | 1.1% |
| Bangladesh | 8 | 0.4% |
| Caribbean | 441 | 24.7% |
| Central America | 48 | 2.7% |
| Europe | 17 | 0.9% |
| Germany | 7 | 0.4% |
| Latin America | 489 | 27.4% |
| Mexico | 48 | 2.7% |
| Northern Europe | 10 | 0.6% |
| Scotland | 10 | 0.6% |
| South Central Asia | 8 | 0.4% |
| West Indies | 441 | 24.7% |
| Western Europe | 7 | 0.4% | View All 13 Rows |
Sex and Age in Tillson
Sex and Age in Tillson
The most populous age groups in Tillson are 65 to 69 Years (276 | 30.2%) for men and 65 to 69 Years (261 | 30.1%) for women.
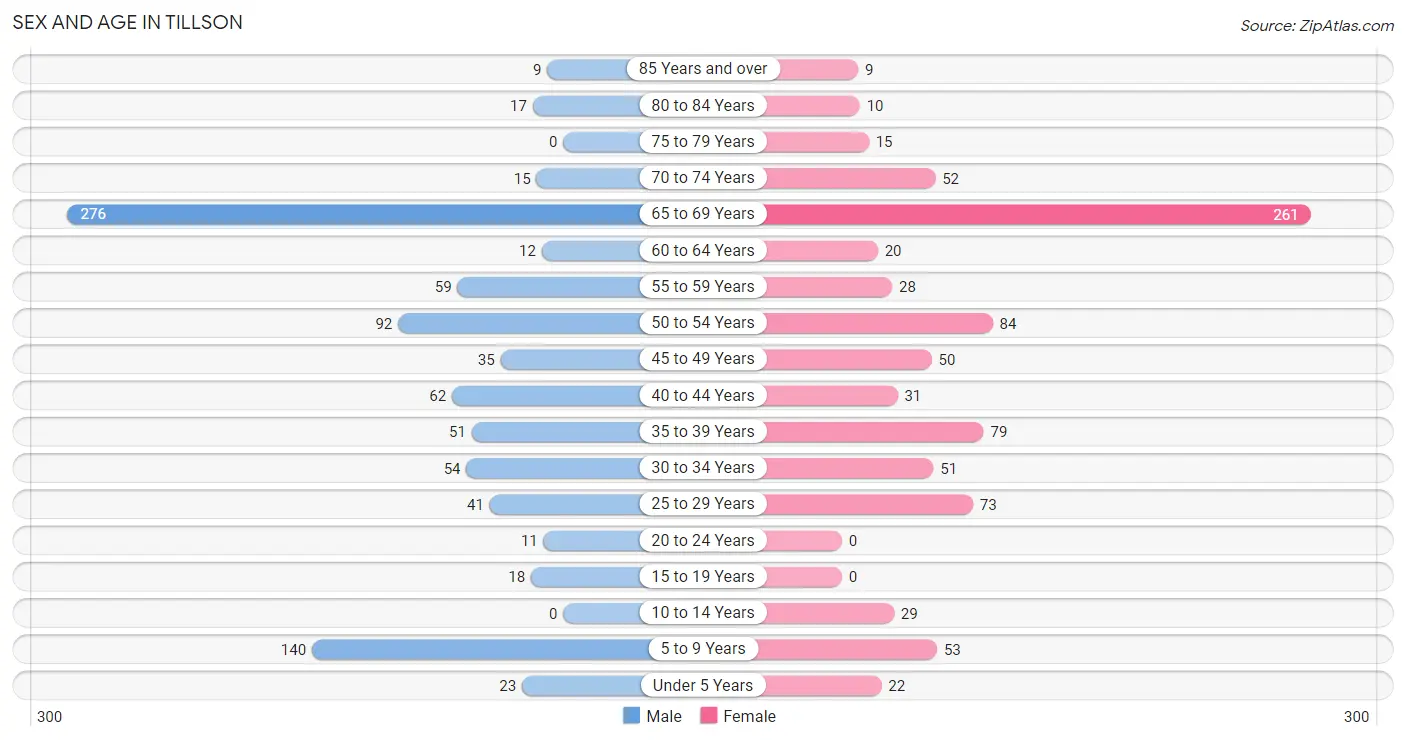
| Age Bracket | Male | Female |
| Under 5 Years | 23 (2.5%) | 22 (2.5%) |
| 5 to 9 Years | 140 (15.3%) | 53 (6.1%) |
| 10 to 14 Years | 0 (0.0%) | 29 (3.3%) |
| 15 to 19 Years | 18 (2.0%) | 0 (0.0%) |
| 20 to 24 Years | 11 (1.2%) | 0 (0.0%) |
| 25 to 29 Years | 41 (4.5%) | 73 (8.4%) |
| 30 to 34 Years | 54 (5.9%) | 51 (5.9%) |
| 35 to 39 Years | 51 (5.6%) | 79 (9.1%) |
| 40 to 44 Years | 62 (6.8%) | 31 (3.6%) |
| 45 to 49 Years | 35 (3.8%) | 50 (5.8%) |
| 50 to 54 Years | 92 (10.1%) | 84 (9.7%) |
| 55 to 59 Years | 59 (6.5%) | 28 (3.2%) |
| 60 to 64 Years | 12 (1.3%) | 20 (2.3%) |
| 65 to 69 Years | 276 (30.2%) | 261 (30.1%) |
| 70 to 74 Years | 15 (1.6%) | 52 (6.0%) |
| 75 to 79 Years | 0 (0.0%) | 15 (1.7%) |
| 80 to 84 Years | 17 (1.9%) | 10 (1.1%) |
| 85 Years and over | 9 (1.0%) | 9 (1.0%) |
| Total | 915 (100.0%) | 867 (100.0%) |
Families and Households in Tillson
Median Family Size in Tillson
The median family size in Tillson is 4.03 persons per family, with married-couple families (241 | 68.7%) accounting for the largest median family size of 4.71 persons per family. On the other hand, single male/father families (11 | 3.1%) represent the smallest median family size with 1.91 persons per family.
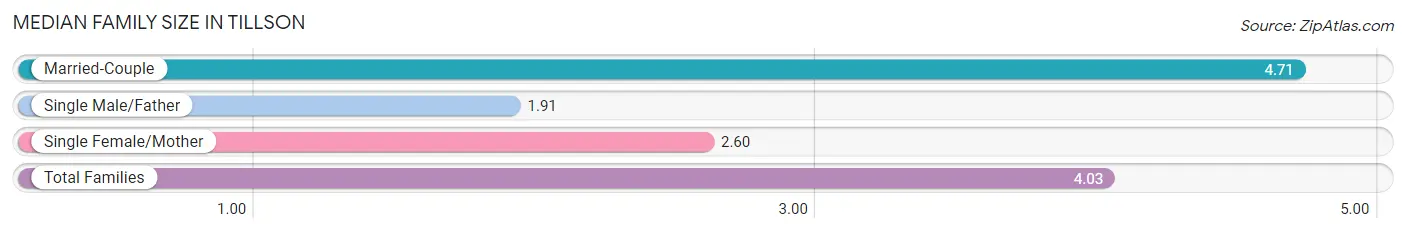
| Family Type | # Families | Family Size |
| Married-Couple | 241 (68.7%) | 4.71 |
| Single Male/Father | 11 (3.1%) | 1.91 |
| Single Female/Mother | 99 (28.2%) | 2.60 |
| Total Families | 351 (100.0%) | 4.03 |
Median Household Size in Tillson
The median household size in Tillson is 2.66 persons per household, with married-couple households (241 | 36.0%) accounting for the largest median household size of 4.71 persons per household. non-family households (319 | 47.6%) represent the smallest median household size with 1.12 persons per household.
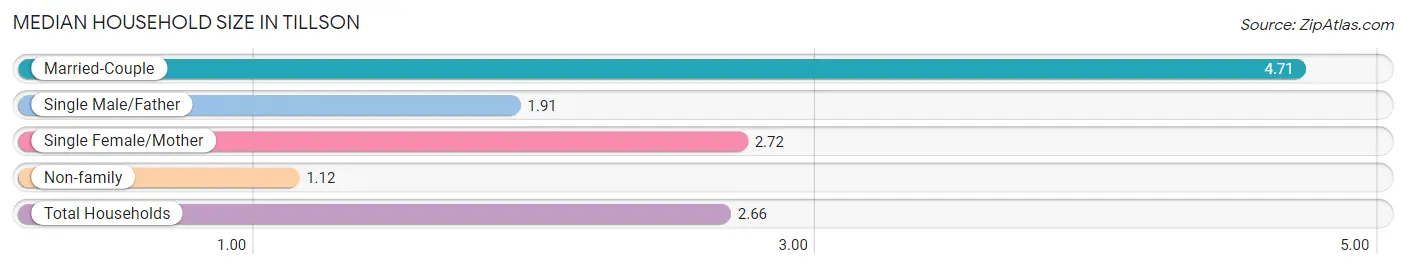
| Household Type | # Households | Household Size |
| Married-Couple | 241 (36.0%) | 4.71 |
| Single Male/Father | 11 (1.6%) | 1.91 |
| Single Female/Mother | 99 (14.8%) | 2.72 |
| Non-family | 319 (47.6%) | 1.12 |
| Total Households | 670 (100.0%) | 2.66 |
Household Size by Marriage Status in Tillson
Out of a total of 670 households in Tillson, 351 (52.4%) are family households, while 319 (47.6%) are nonfamily households. The most numerous type of family households are 2-person households, comprising 140, and the most common type of nonfamily households are 1-person households, comprising 282.
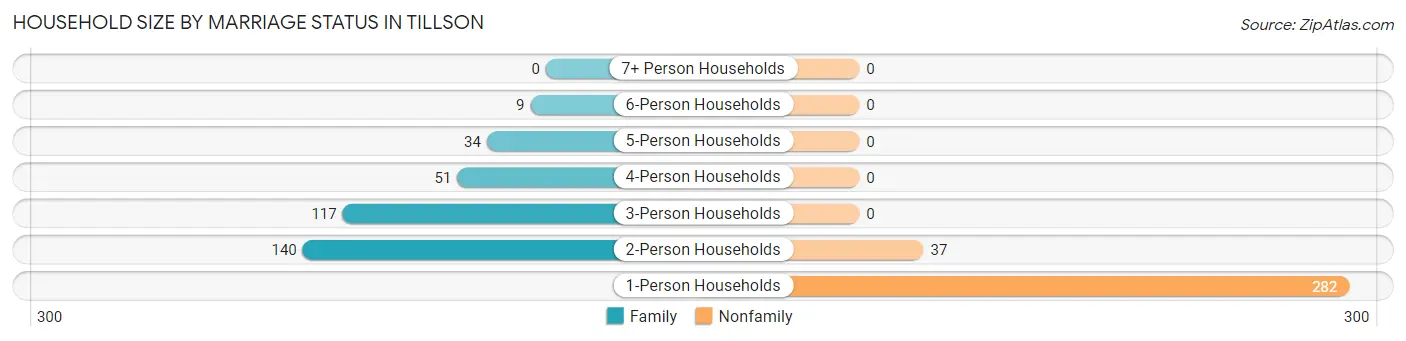
| Household Size | Family Households | Nonfamily Households |
| 1-Person Households | - | 282 (42.1%) |
| 2-Person Households | 140 (20.9%) | 37 (5.5%) |
| 3-Person Households | 117 (17.5%) | 0 (0.0%) |
| 4-Person Households | 51 (7.6%) | 0 (0.0%) |
| 5-Person Households | 34 (5.1%) | 0 (0.0%) |
| 6-Person Households | 9 (1.3%) | 0 (0.0%) |
| 7+ Person Households | 0 (0.0%) | 0 (0.0%) |
| Total | 351 (52.4%) | 319 (47.6%) |
Female Fertility in Tillson
Fertility by Age in Tillson
Average fertility rate in Tillson is 18.0 births per 1,000 women. Women in the age bracket of 20 to 34 years have the highest fertility rate with 40.0 births per 1,000 women. Women in the age bracket of 20 to 34 years acount for 100.0% of all women with births.
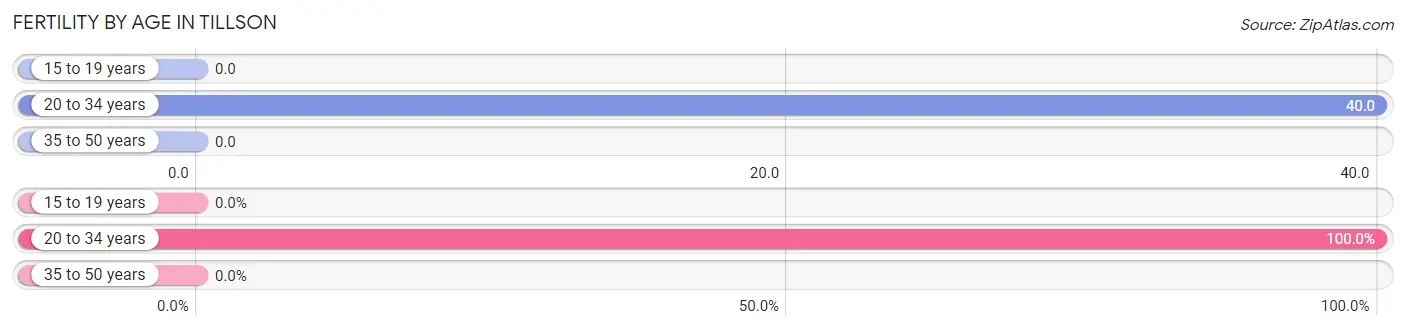
| Age Bracket | Women with Births | Births / 1,000 Women |
| 15 to 19 years | 0 (0.0%) | 0.0 |
| 20 to 34 years | 5 (100.0%) | 40.0 |
| 35 to 50 years | 0 (0.0%) | 0.0 |
| Total | 5 (100.0%) | 18.0 |
Fertility by Age by Marriage Status in Tillson
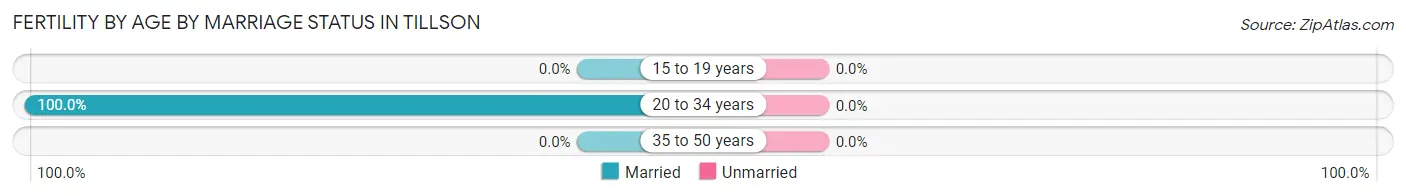
| Age Bracket | Married | Unmarried |
| 15 to 19 years | 0 (0.0%) | 0 (0.0%) |
| 20 to 34 years | 5 (100.0%) | 0 (0.0%) |
| 35 to 50 years | 0 (0.0%) | 0 (0.0%) |
| Total | 5 (100.0%) | 0 (0.0%) |
Fertility by Education in Tillson
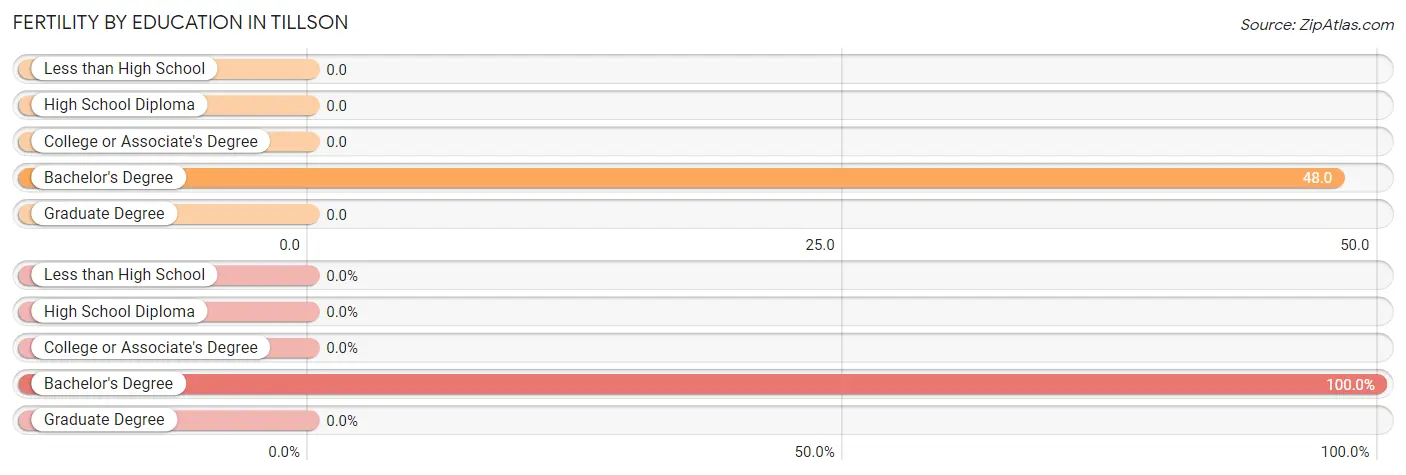
| Educational Attainment | Women with Births | Births / 1,000 Women |
| Less than High School | 0 (0.0%) | 0.0 |
| High School Diploma | 0 (0.0%) | 0.0 |
| College or Associate's Degree | 0 (0.0%) | 0.0 |
| Bachelor's Degree | 5 (100.0%) | 48.0 |
| Graduate Degree | 0 (0.0%) | 0.0 |
| Total | 5 (100.0%) | 18.0 |
Fertility by Education by Marriage Status in Tillson
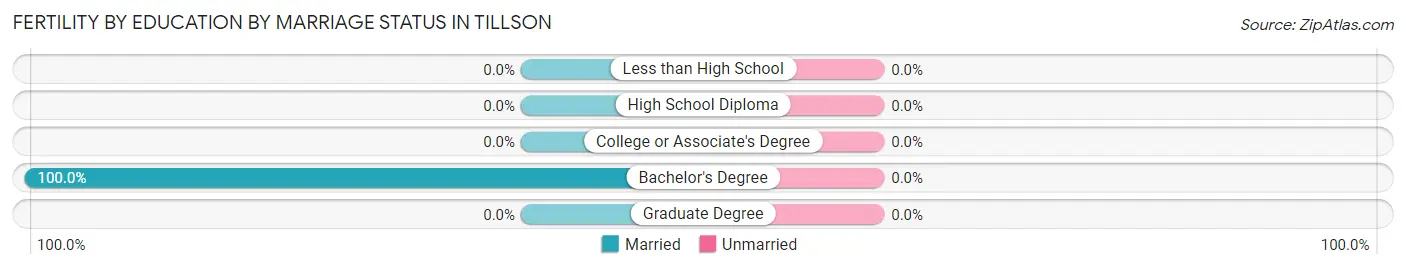
| Educational Attainment | Married | Unmarried |
| Less than High School | 0 (0.0%) | 0 (0.0%) |
| High School Diploma | 0 (0.0%) | 0 (0.0%) |
| College or Associate's Degree | 0 (0.0%) | 0 (0.0%) |
| Bachelor's Degree | 5 (100.0%) | 0 (0.0%) |
| Graduate Degree | 0 (0.0%) | 0 (0.0%) |
| Total | 5 (100.0%) | 0 (0.0%) |
Employment Characteristics in Tillson
Employment by Class of Employer in Tillson
Among the 1,161 employed individuals in Tillson, private company employees (790 | 68.0%), not-for-profit organizations (102 | 8.8%), and local government employees (87 | 7.5%) make up the most common classes of employment.
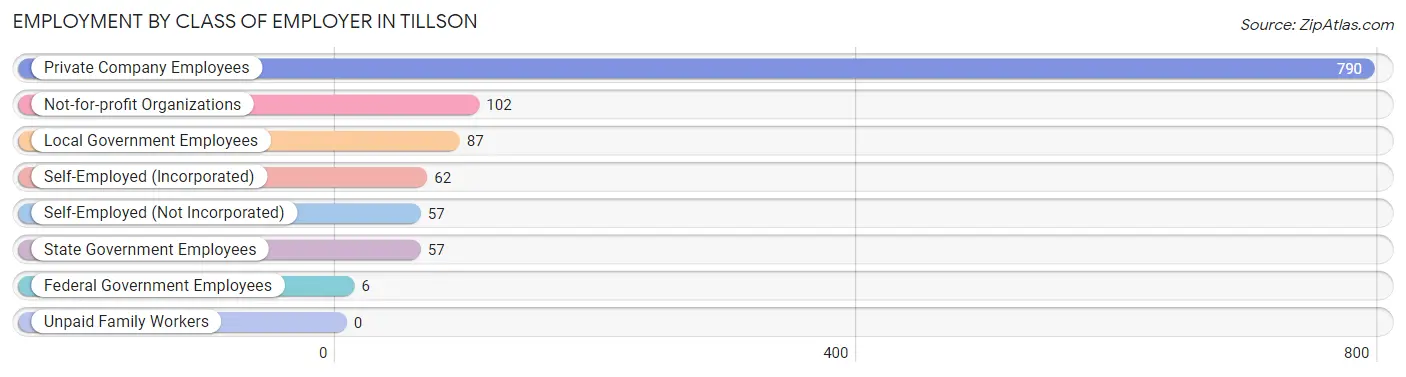
| Employer Class | # Employees | % Employees |
| Private Company Employees | 790 | 68.0% |
| Self-Employed (Incorporated) | 62 | 5.3% |
| Self-Employed (Not Incorporated) | 57 | 4.9% |
| Not-for-profit Organizations | 102 | 8.8% |
| Local Government Employees | 87 | 7.5% |
| State Government Employees | 57 | 4.9% |
| Federal Government Employees | 6 | 0.5% |
| Unpaid Family Workers | 0 | 0.0% |
| Total | 1,161 | 100.0% |
Employment Status by Age in Tillson
According to the labor force statistics for Tillson, out of the total population over 16 years of age (1,497), 79.8% or 1,195 individuals are in the labor force, with 1.0% or 12 of them unemployed. The age group with the highest labor force participation rate is 20 to 24 years, with 100.0% or 11 individuals in the labor force. Within the labor force, the 25 to 29 years age range has the highest percentage of unemployed individuals, with 10.5% or 12 of them being unemployed.
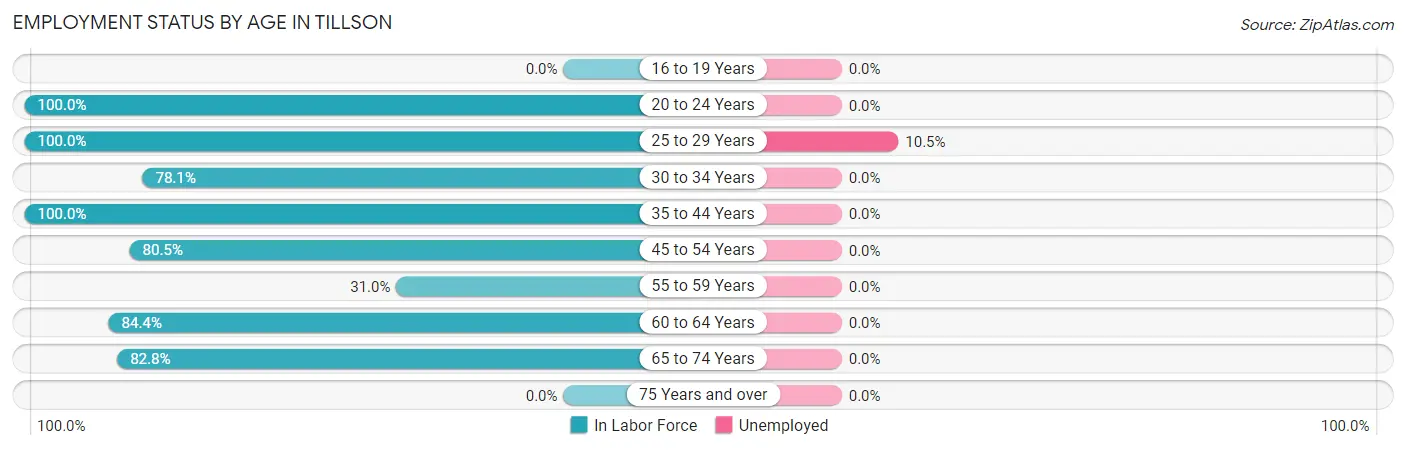
| Age Bracket | In Labor Force | Unemployed |
| 16 to 19 Years | 0 (0.0%) | 0 (0.0%) |
| 20 to 24 Years | 11 (100.0%) | 0 (0.0%) |
| 25 to 29 Years | 114 (100.0%) | 12 (10.5%) |
| 30 to 34 Years | 82 (78.1%) | 0 (0.0%) |
| 35 to 44 Years | 223 (100.0%) | 0 (0.0%) |
| 45 to 54 Years | 210 (80.5%) | 0 (0.0%) |
| 55 to 59 Years | 27 (31.0%) | 0 (0.0%) |
| 60 to 64 Years | 27 (84.4%) | 0 (0.0%) |
| 65 to 74 Years | 500 (82.8%) | 0 (0.0%) |
| 75 Years and over | 0 (0.0%) | 0 (0.0%) |
| Total | 1,195 (79.8%) | 12 (1.0%) |
Employment Status by Educational Attainment in Tillson
According to labor force statistics for Tillson, 83.1% of individuals (683) out of the total population between 25 and 64 years of age (822) are in the labor force, with 1.8% or 12 of them being unemployed. The group with the highest labor force participation rate are those with the educational attainment of high school diploma, with 91.4% or 96 individuals in the labor force. Within the labor force, individuals with bachelor's degree or higher education have the highest percentage of unemployment, with 3.8% or 12 of them being unemployed.
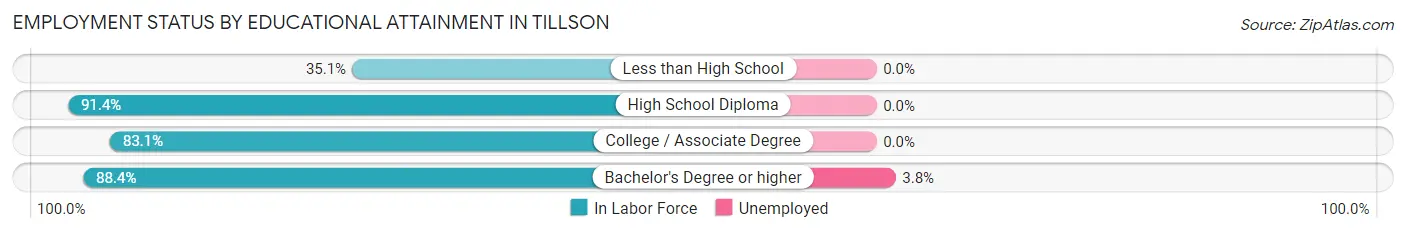
| Educational Attainment | In Labor Force | Unemployed |
| Less than High School | 20 (35.1%) | 0 (0.0%) |
| High School Diploma | 96 (91.4%) | 0 (0.0%) |
| College / Associate Degree | 255 (83.1%) | 0 (0.0%) |
| Bachelor's Degree or higher | 312 (88.4%) | 13 (3.8%) |
| Total | 683 (83.1%) | 15 (1.8%) |
Employment Occupations by Sex in Tillson
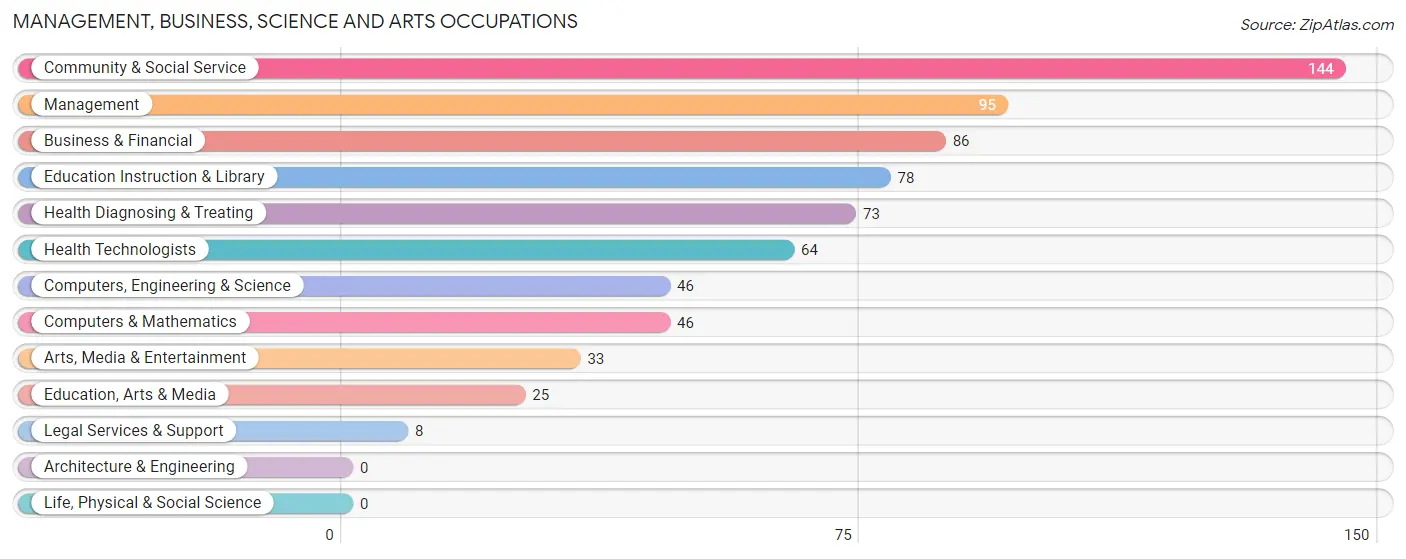
Management, Business, Science and Arts Occupations
The most common Management, Business, Science and Arts occupations in Tillson are Community & Social Service (144 | 12.2%), Management (95 | 8.1%), Business & Financial (86 | 7.3%), Education Instruction & Library (78 | 6.6%), and Health Diagnosing & Treating (73 | 6.2%).
Management, Business, Science and Arts Occupations by Sex
Within the Management, Business, Science and Arts occupations in Tillson, the most male-oriented occupations are Computers, Engineering & Science (100.0%), Computers & Mathematics (100.0%), and Management (77.9%), while the most female-oriented occupations are Education, Arts & Media (100.0%), Legal Services & Support (100.0%), and Health Diagnosing & Treating (100.0%).
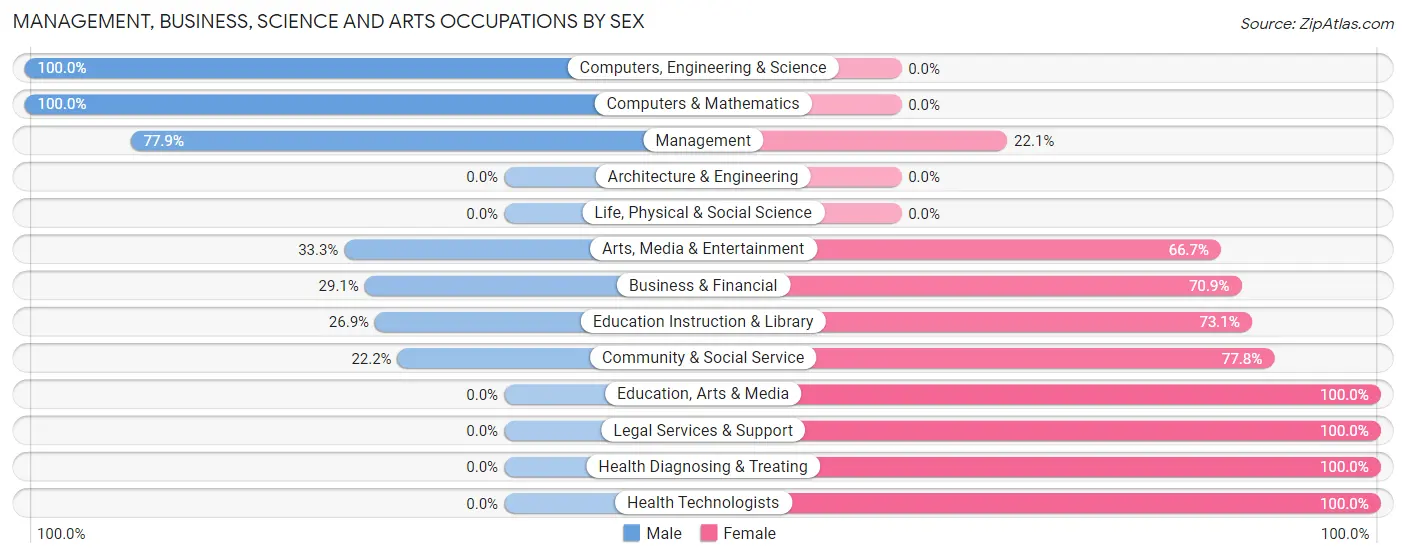
| Occupation | Male | Female |
| Management | 74 (77.9%) | 21 (22.1%) |
| Business & Financial | 25 (29.1%) | 61 (70.9%) |
| Computers, Engineering & Science | 46 (100.0%) | 0 (0.0%) |
| Computers & Mathematics | 46 (100.0%) | 0 (0.0%) |
| Architecture & Engineering | 0 (0.0%) | 0 (0.0%) |
| Life, Physical & Social Science | 0 (0.0%) | 0 (0.0%) |
| Community & Social Service | 32 (22.2%) | 112 (77.8%) |
| Education, Arts & Media | 0 (0.0%) | 25 (100.0%) |
| Legal Services & Support | 0 (0.0%) | 8 (100.0%) |
| Education Instruction & Library | 21 (26.9%) | 57 (73.1%) |
| Arts, Media & Entertainment | 11 (33.3%) | 22 (66.7%) |
| Health Diagnosing & Treating | 0 (0.0%) | 73 (100.0%) |
| Health Technologists | 0 (0.0%) | 64 (100.0%) |
| Total (Category) | 177 (39.9%) | 267 (60.1%) |
| Total (Overall) | 600 (51.0%) | 576 (49.0%) |
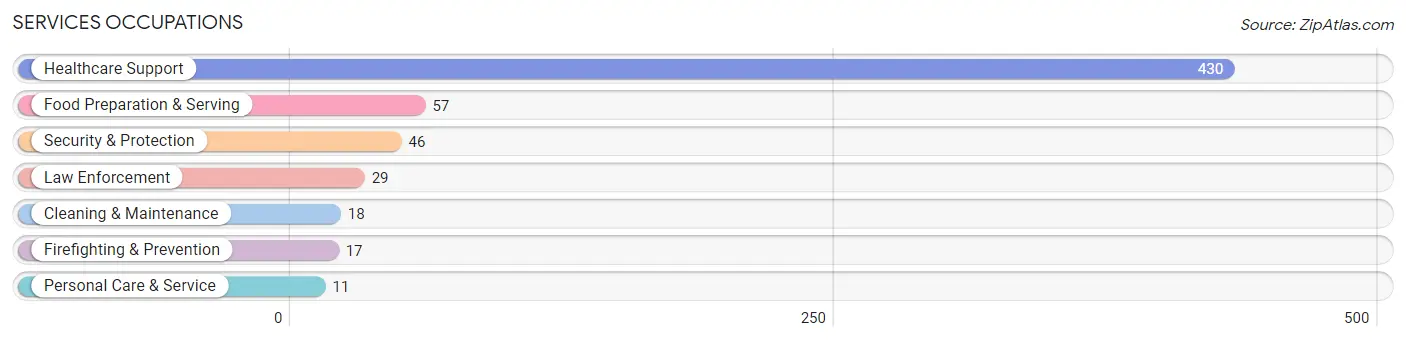
Services Occupations
The most common Services occupations in Tillson are Healthcare Support (430 | 36.6%), Food Preparation & Serving (57 | 4.9%), Security & Protection (46 | 3.9%), Law Enforcement (29 | 2.5%), and Cleaning & Maintenance (18 | 1.5%).
Services Occupations by Sex
Within the Services occupations in Tillson, the most male-oriented occupations are Cleaning & Maintenance (100.0%), Personal Care & Service (100.0%), and Food Preparation & Serving (66.7%), while the most female-oriented occupations are Firefighting & Prevention (100.0%), Security & Protection (58.7%), and Healthcare Support (50.0%).
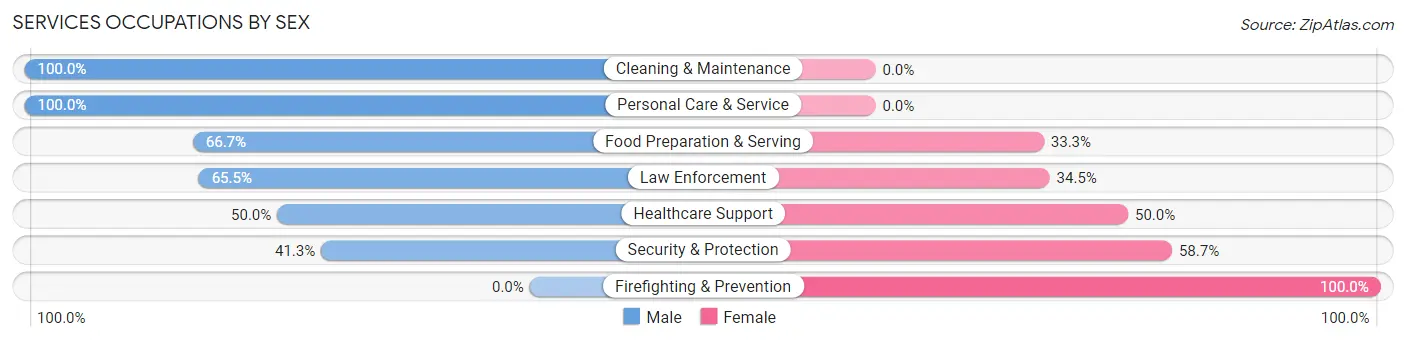
| Occupation | Male | Female |
| Healthcare Support | 215 (50.0%) | 215 (50.0%) |
| Security & Protection | 19 (41.3%) | 27 (58.7%) |
| Firefighting & Prevention | 0 (0.0%) | 17 (100.0%) |
| Law Enforcement | 19 (65.5%) | 10 (34.5%) |
| Food Preparation & Serving | 38 (66.7%) | 19 (33.3%) |
| Cleaning & Maintenance | 18 (100.0%) | 0 (0.0%) |
| Personal Care & Service | 11 (100.0%) | 0 (0.0%) |
| Total (Category) | 301 (53.6%) | 261 (46.4%) |
| Total (Overall) | 600 (51.0%) | 576 (49.0%) |
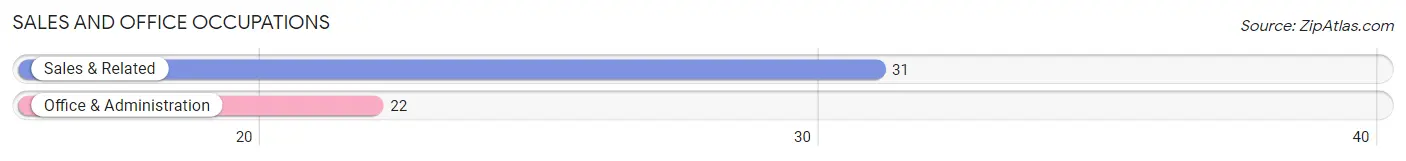
Sales and Office Occupations
The most common Sales and Office occupations in Tillson are Sales & Related (31 | 2.6%), and Office & Administration (22 | 1.9%).
Sales and Office Occupations by Sex
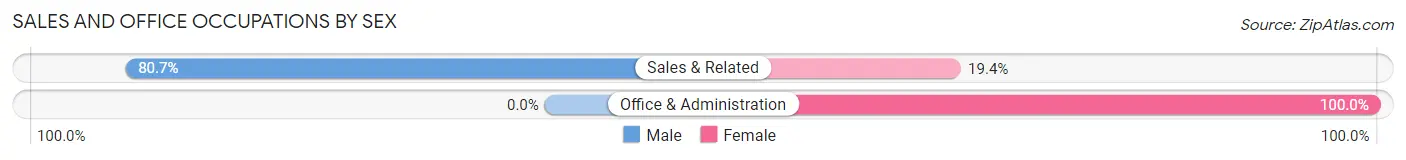
| Occupation | Male | Female |
| Sales & Related | 25 (80.6%) | 6 (19.4%) |
| Office & Administration | 0 (0.0%) | 22 (100.0%) |
| Total (Category) | 25 (47.2%) | 28 (52.8%) |
| Total (Overall) | 600 (51.0%) | 576 (49.0%) |
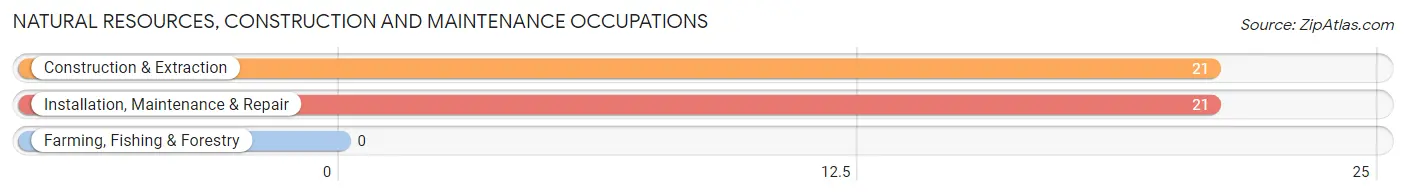
Natural Resources, Construction and Maintenance Occupations
The most common Natural Resources, Construction and Maintenance occupations in Tillson are Construction & Extraction (21 | 1.8%), and Installation, Maintenance & Repair (21 | 1.8%).
Natural Resources, Construction and Maintenance Occupations by Sex
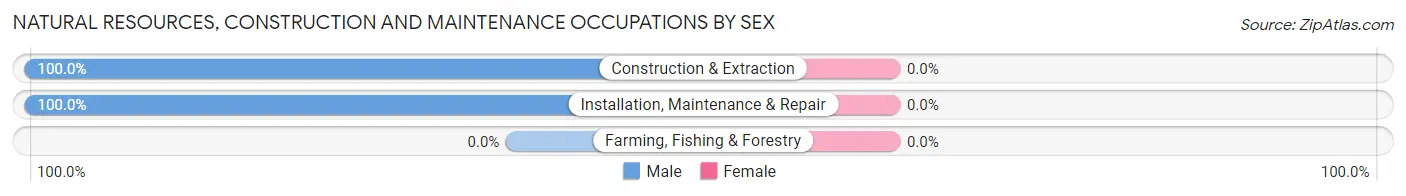
| Occupation | Male | Female |
| Farming, Fishing & Forestry | 0 (0.0%) | 0 (0.0%) |
| Construction & Extraction | 21 (100.0%) | 0 (0.0%) |
| Installation, Maintenance & Repair | 21 (100.0%) | 0 (0.0%) |
| Total (Category) | 42 (100.0%) | 0 (0.0%) |
| Total (Overall) | 600 (51.0%) | 576 (49.0%) |
Production, Transportation and Moving Occupations
The most common Production, Transportation and Moving occupations in Tillson are Transportation (46 | 3.9%), and Production (29 | 2.5%).
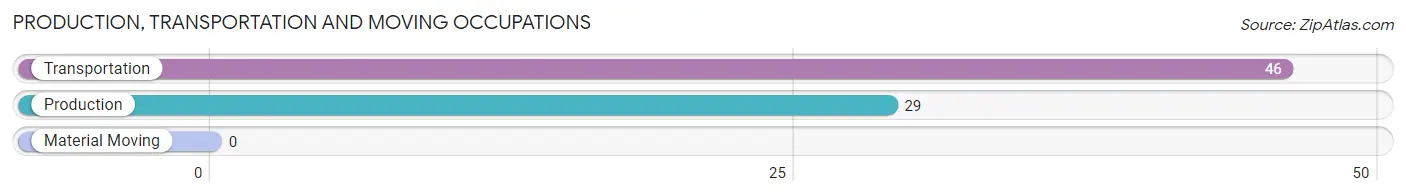
Production, Transportation and Moving Occupations by Sex
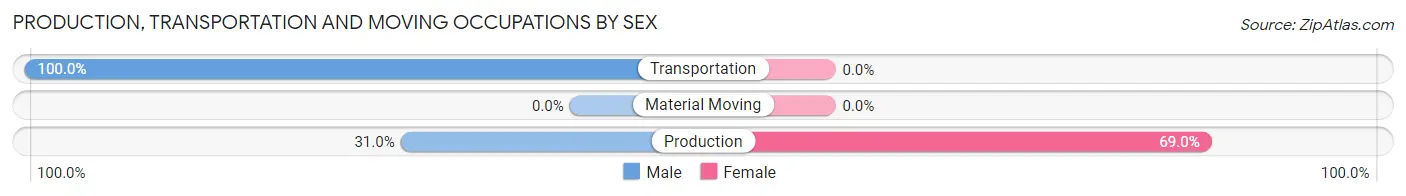
| Occupation | Male | Female |
| Production | 9 (31.0%) | 20 (69.0%) |
| Transportation | 46 (100.0%) | 0 (0.0%) |
| Material Moving | 0 (0.0%) | 0 (0.0%) |
| Total (Category) | 55 (73.3%) | 20 (26.7%) |
| Total (Overall) | 600 (51.0%) | 576 (49.0%) |
Employment Industries by Sex in Tillson
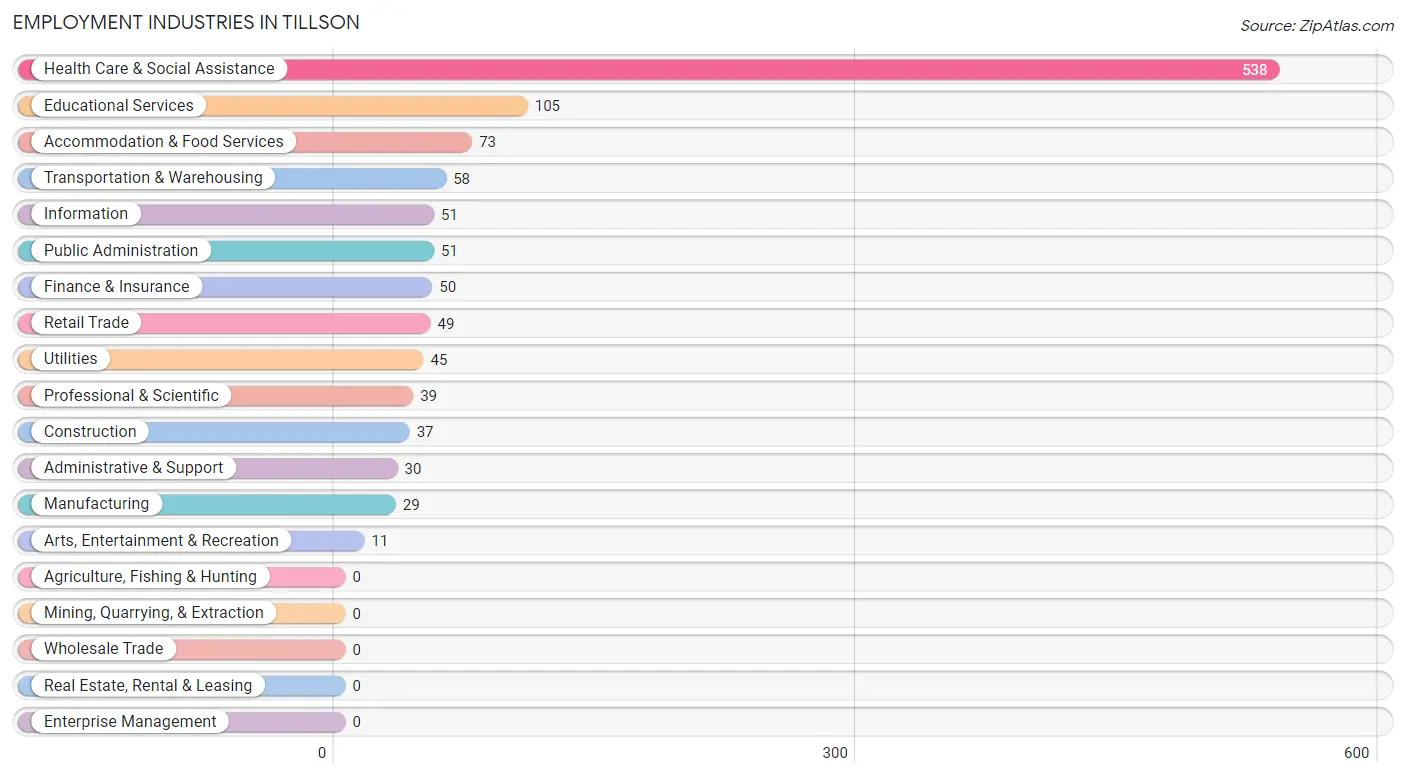
Employment Industries in Tillson
The major employment industries in Tillson include Health Care & Social Assistance (538 | 45.8%), Educational Services (105 | 8.9%), Accommodation & Food Services (73 | 6.2%), Transportation & Warehousing (58 | 4.9%), and Information (51 | 4.3%).
Employment Industries by Sex in Tillson
The Tillson industries that see more men than women are Construction (100.0%), Utilities (100.0%), and Arts, Entertainment & Recreation (100.0%), whereas the industries that tend to have a higher number of women are Finance & Insurance (100.0%), Educational Services (80.0%), and Manufacturing (69.0%).
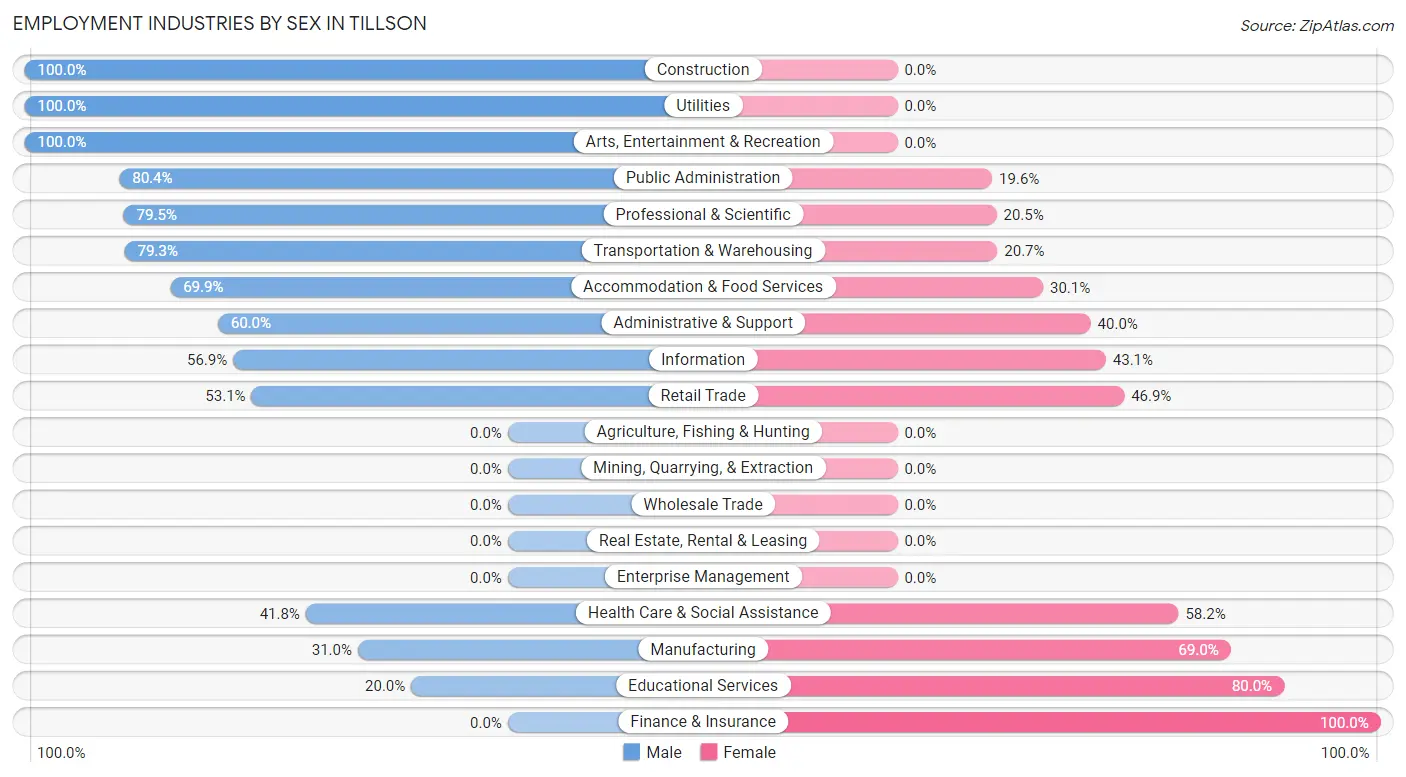
| Industry | Male | Female |
| Agriculture, Fishing & Hunting | 0 (0.0%) | 0 (0.0%) |
| Mining, Quarrying, & Extraction | 0 (0.0%) | 0 (0.0%) |
| Construction | 37 (100.0%) | 0 (0.0%) |
| Manufacturing | 9 (31.0%) | 20 (69.0%) |
| Wholesale Trade | 0 (0.0%) | 0 (0.0%) |
| Retail Trade | 26 (53.1%) | 23 (46.9%) |
| Transportation & Warehousing | 46 (79.3%) | 12 (20.7%) |
| Utilities | 45 (100.0%) | 0 (0.0%) |
| Information | 29 (56.9%) | 22 (43.1%) |
| Finance & Insurance | 0 (0.0%) | 50 (100.0%) |
| Real Estate, Rental & Leasing | 0 (0.0%) | 0 (0.0%) |
| Professional & Scientific | 31 (79.5%) | 8 (20.5%) |
| Enterprise Management | 0 (0.0%) | 0 (0.0%) |
| Administrative & Support | 18 (60.0%) | 12 (40.0%) |
| Educational Services | 21 (20.0%) | 84 (80.0%) |
| Health Care & Social Assistance | 225 (41.8%) | 313 (58.2%) |
| Arts, Entertainment & Recreation | 11 (100.0%) | 0 (0.0%) |
| Accommodation & Food Services | 51 (69.9%) | 22 (30.1%) |
| Public Administration | 41 (80.4%) | 10 (19.6%) |
| Total | 600 (51.0%) | 576 (49.0%) |
Education in Tillson
School Enrollment in Tillson
The most common levels of schooling among the 228 students in Tillson are kindergarten (80 | 35.1%), elementary school (67 | 29.4%), and middle school (29 | 12.7%).
| School Level | # Students | % Students |
| Nursery / Preschool | 0 | 0.0% |
| Kindergarten | 80 | 35.1% |
| Elementary School | 67 | 29.4% |
| Middle School | 29 | 12.7% |
| High School | 18 | 7.9% |
| College / Undergraduate | 13 | 5.7% |
| Graduate / Professional | 21 | 9.2% |
| Total | 228 | 100.0% |
School Enrollment by Age by Funding Source in Tillson
Out of a total of 228 students who are enrolled in schools in Tillson, 60 (26.3%) attend a private institution, while the remaining 168 (73.7%) are enrolled in public schools. The age group of 35 years and over has the highest likelihood of being enrolled in private schools, with 34 (100.0% in the age bracket) enrolled. Conversely, the age group of 10 to 14 year olds has the lowest likelihood of being enrolled in a private school, with 29 (100.0% in the age bracket) attending a public institution.
| Age Bracket | Public School | Private School |
| 3 to 4 Year Olds | 0 (0.0%) | 0 (0.0%) |
| 5 to 9 Year Old | 121 (82.3%) | 26 (17.7%) |
| 10 to 14 Year Olds | 29 (100.0%) | 0 (0.0%) |
| 15 to 17 Year Olds | 18 (100.0%) | 0 (0.0%) |
| 18 to 19 Year Olds | 0 (0.0%) | 0 (0.0%) |
| 20 to 24 Year Olds | 0 (0.0%) | 0 (0.0%) |
| 25 to 34 Year Olds | 0 (0.0%) | 0 (0.0%) |
| 35 Years and over | 0 (0.0%) | 34 (100.0%) |
| Total | 168 (73.7%) | 60 (26.3%) |
Educational Attainment by Field of Study in Tillson
Education (115 | 23.7%), social sciences (78 | 16.1%), science & technology (52 | 10.7%), computers & mathematics (37 | 7.6%), and business (35 | 7.2%) are the most common fields of study among 486 individuals in Tillson who have obtained a bachelor's degree or higher.
| Field of Study | # Graduates | % Graduates |
| Computers & Mathematics | 37 | 7.6% |
| Bio, Nature & Agricultural | 10 | 2.1% |
| Physical & Health Sciences | 5 | 1.0% |
| Psychology | 21 | 4.3% |
| Social Sciences | 78 | 16.1% |
| Engineering | 32 | 6.6% |
| Multidisciplinary Studies | 5 | 1.0% |
| Science & Technology | 52 | 10.7% |
| Business | 35 | 7.2% |
| Education | 115 | 23.7% |
| Literature & Languages | 9 | 1.8% |
| Liberal Arts & History | 13 | 2.7% |
| Visual & Performing Arts | 34 | 7.0% |
| Communications | 29 | 6.0% |
| Arts & Humanities | 11 | 2.3% |
| Total | 486 | 100.0% |
Transportation & Commute in Tillson
Vehicle Availability by Sex in Tillson
The most prevalent vehicle ownership categories in Tillson are males with 3 vehicles (329, accounting for 54.3%) and females with 3 vehicles (279, making up 59.3%).
| Vehicles Available | Male | Female |
| No Vehicle | 0 (0.0%) | 8 (1.4%) |
| 1 Vehicle | 81 (13.4%) | 145 (26.1%) |
| 2 Vehicles | 161 (26.6%) | 123 (22.2%) |
| 3 Vehicles | 329 (54.3%) | 279 (50.3%) |
| 4 Vehicles | 35 (5.8%) | 0 (0.0%) |
| 5 or more Vehicles | 0 (0.0%) | 0 (0.0%) |
| Total | 606 (100.0%) | 555 (100.0%) |
Commute Time in Tillson
The most frequently occuring commute durations in Tillson are 15 to 19 minutes (313 commuters, 29.1%), 10 to 14 minutes (279 commuters, 26.0%), and 20 to 24 minutes (124 commuters, 11.5%).
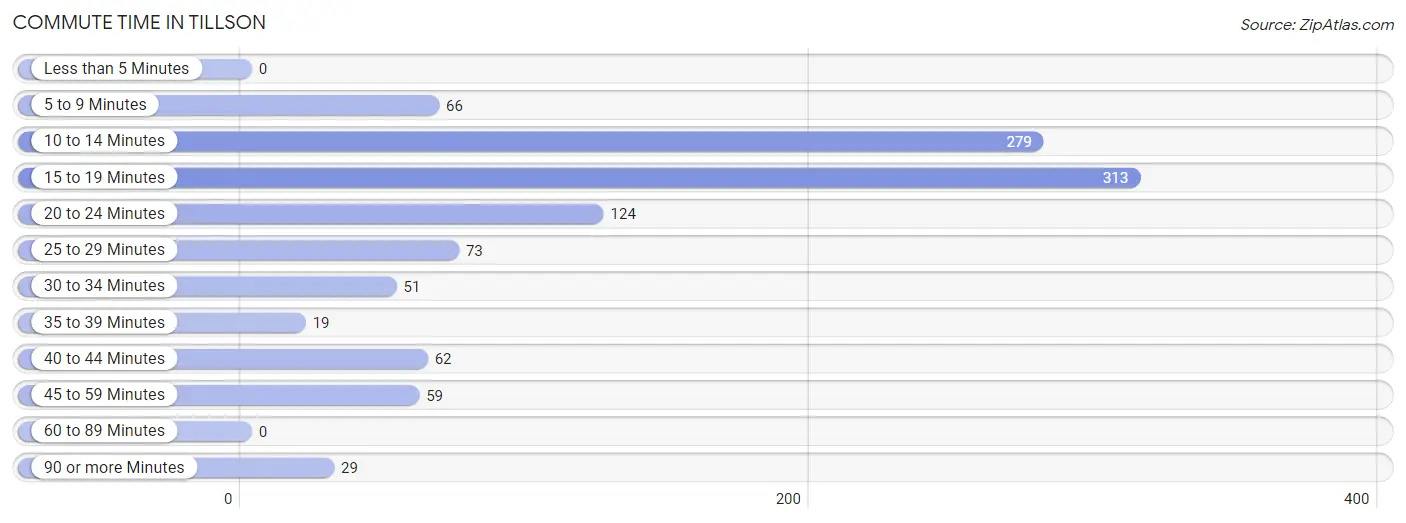
| Commute Time | # Commuters | % Commuters |
| Less than 5 Minutes | 0 | 0.0% |
| 5 to 9 Minutes | 66 | 6.1% |
| 10 to 14 Minutes | 279 | 26.0% |
| 15 to 19 Minutes | 313 | 29.1% |
| 20 to 24 Minutes | 124 | 11.5% |
| 25 to 29 Minutes | 73 | 6.8% |
| 30 to 34 Minutes | 51 | 4.7% |
| 35 to 39 Minutes | 19 | 1.8% |
| 40 to 44 Minutes | 62 | 5.8% |
| 45 to 59 Minutes | 59 | 5.5% |
| 60 to 89 Minutes | 0 | 0.0% |
| 90 or more Minutes | 29 | 2.7% |
Commute Time by Sex in Tillson
The most common commute times in Tillson are 15 to 19 minutes (280 commuters, 50.5%) for males and 10 to 14 minutes (244 commuters, 46.8%) for females.
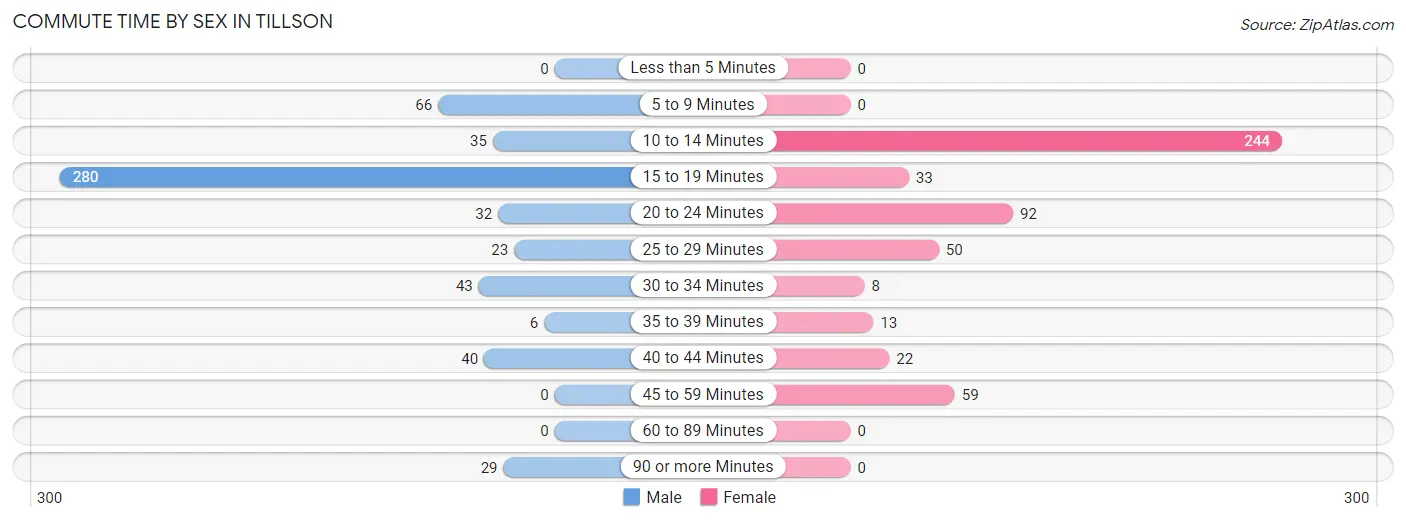
| Commute Time | Male | Female |
| Less than 5 Minutes | 0 (0.0%) | 0 (0.0%) |
| 5 to 9 Minutes | 66 (11.9%) | 0 (0.0%) |
| 10 to 14 Minutes | 35 (6.3%) | 244 (46.8%) |
| 15 to 19 Minutes | 280 (50.5%) | 33 (6.3%) |
| 20 to 24 Minutes | 32 (5.8%) | 92 (17.7%) |
| 25 to 29 Minutes | 23 (4.2%) | 50 (9.6%) |
| 30 to 34 Minutes | 43 (7.8%) | 8 (1.5%) |
| 35 to 39 Minutes | 6 (1.1%) | 13 (2.5%) |
| 40 to 44 Minutes | 40 (7.2%) | 22 (4.2%) |
| 45 to 59 Minutes | 0 (0.0%) | 59 (11.3%) |
| 60 to 89 Minutes | 0 (0.0%) | 0 (0.0%) |
| 90 or more Minutes | 29 (5.2%) | 0 (0.0%) |
Time of Departure to Work by Sex in Tillson
The most frequent times of departure to work in Tillson are 8:30 AM to 8:59 AM (243, 43.9%) for males and 8:30 AM to 8:59 AM (260, 49.9%) for females.
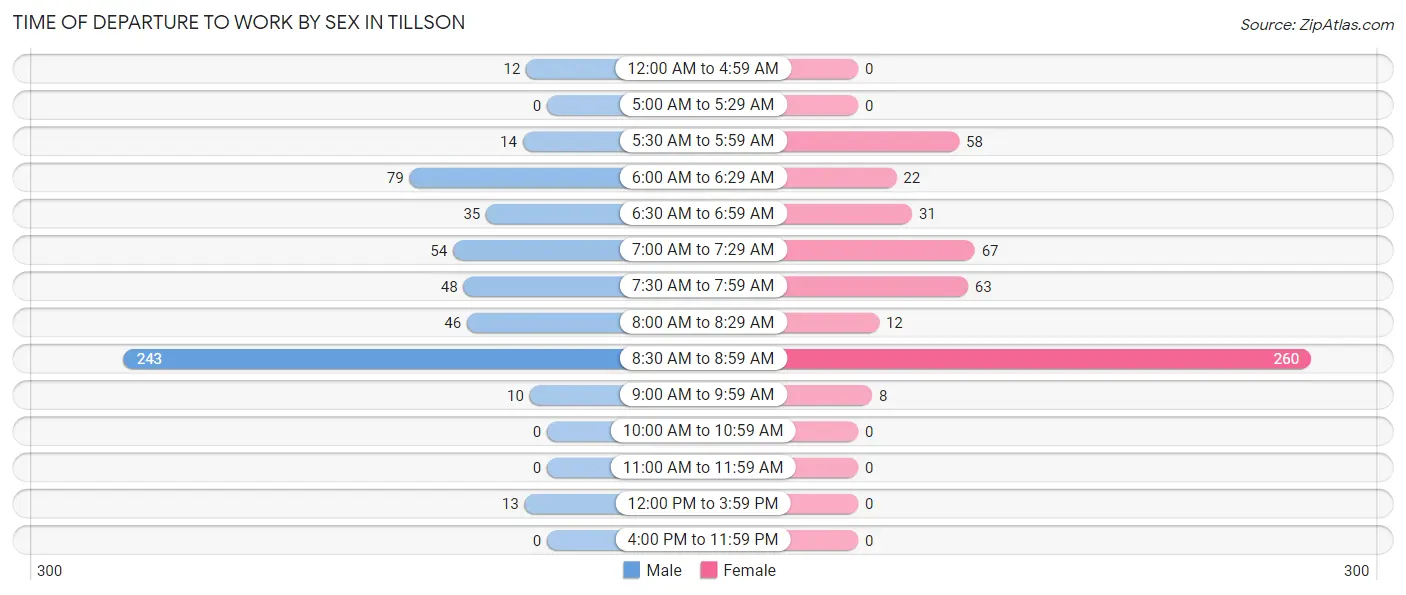
| Time of Departure | Male | Female |
| 12:00 AM to 4:59 AM | 12 (2.2%) | 0 (0.0%) |
| 5:00 AM to 5:29 AM | 0 (0.0%) | 0 (0.0%) |
| 5:30 AM to 5:59 AM | 14 (2.5%) | 58 (11.1%) |
| 6:00 AM to 6:29 AM | 79 (14.3%) | 22 (4.2%) |
| 6:30 AM to 6:59 AM | 35 (6.3%) | 31 (5.9%) |
| 7:00 AM to 7:29 AM | 54 (9.8%) | 67 (12.9%) |
| 7:30 AM to 7:59 AM | 48 (8.7%) | 63 (12.1%) |
| 8:00 AM to 8:29 AM | 46 (8.3%) | 12 (2.3%) |
| 8:30 AM to 8:59 AM | 243 (43.9%) | 260 (49.9%) |
| 9:00 AM to 9:59 AM | 10 (1.8%) | 8 (1.5%) |
| 10:00 AM to 10:59 AM | 0 (0.0%) | 0 (0.0%) |
| 11:00 AM to 11:59 AM | 0 (0.0%) | 0 (0.0%) |
| 12:00 PM to 3:59 PM | 13 (2.4%) | 0 (0.0%) |
| 4:00 PM to 11:59 PM | 0 (0.0%) | 0 (0.0%) |
| Total | 554 (100.0%) | 521 (100.0%) |
Housing Occupancy in Tillson
Occupancy by Ownership in Tillson
Of the total 670 dwellings in Tillson, owner-occupied units account for 540 (80.6%), while renter-occupied units make up 130 (19.4%).
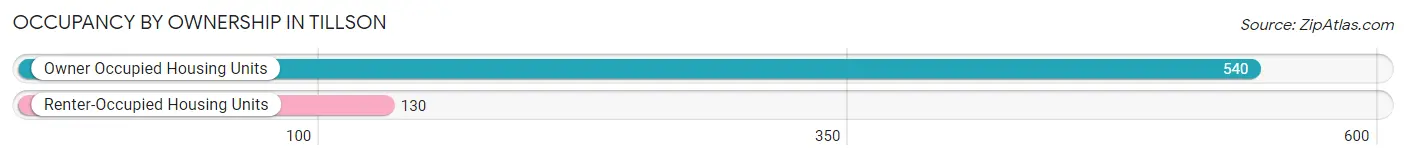
| Occupancy | # Housing Units | % Housing Units |
| Owner Occupied Housing Units | 540 | 80.6% |
| Renter-Occupied Housing Units | 130 | 19.4% |
| Total Occupied Housing Units | 670 | 100.0% |
Occupancy by Household Size in Tillson
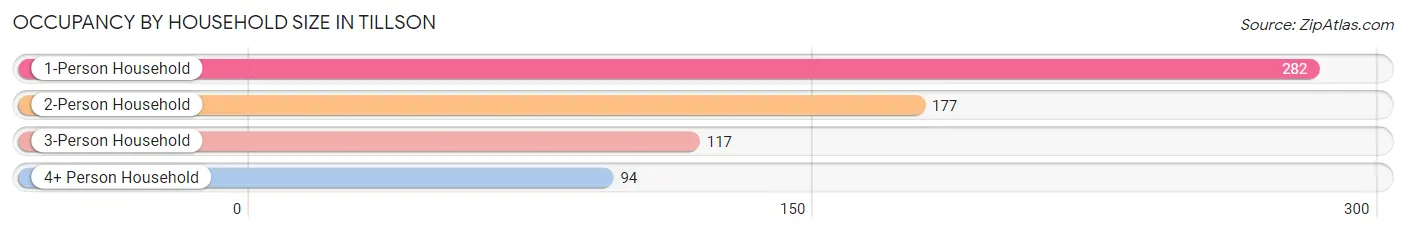
| Household Size | # Housing Units | % Housing Units |
| 1-Person Household | 282 | 42.1% |
| 2-Person Household | 177 | 26.4% |
| 3-Person Household | 117 | 17.5% |
| 4+ Person Household | 94 | 14.0% |
| Total Housing Units | 670 | 100.0% |
Occupancy by Ownership by Household Size in Tillson
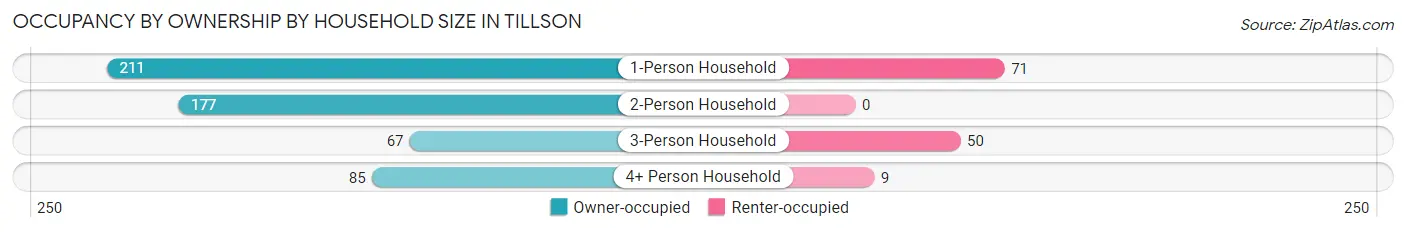
| Household Size | Owner-occupied | Renter-occupied |
| 1-Person Household | 211 (74.8%) | 71 (25.2%) |
| 2-Person Household | 177 (100.0%) | 0 (0.0%) |
| 3-Person Household | 67 (57.3%) | 50 (42.7%) |
| 4+ Person Household | 85 (90.4%) | 9 (9.6%) |
| Total Housing Units | 540 (80.6%) | 130 (19.4%) |
Occupancy by Educational Attainment in Tillson
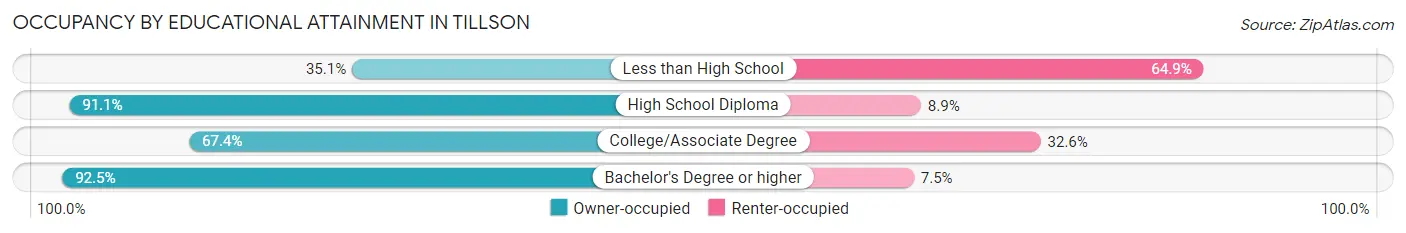
| Household Size | Owner-occupied | Renter-occupied |
| Less than High School | 20 (35.1%) | 37 (64.9%) |
| High School Diploma | 113 (91.1%) | 11 (8.9%) |
| College/Associate Degree | 122 (67.4%) | 59 (32.6%) |
| Bachelor's Degree or higher | 285 (92.5%) | 23 (7.5%) |
Occupancy by Age of Householder in Tillson
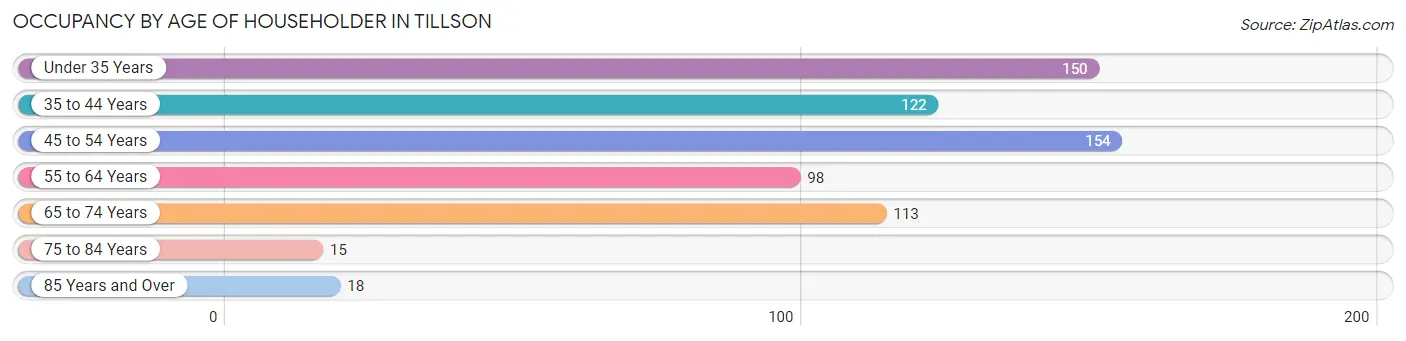
| Age Bracket | # Households | % Households |
| Under 35 Years | 150 | 22.4% |
| 35 to 44 Years | 122 | 18.2% |
| 45 to 54 Years | 154 | 23.0% |
| 55 to 64 Years | 98 | 14.6% |
| 65 to 74 Years | 113 | 16.9% |
| 75 to 84 Years | 15 | 2.2% |
| 85 Years and Over | 18 | 2.7% |
| Total | 670 | 100.0% |
Housing Finances in Tillson
Median Income by Occupancy in Tillson
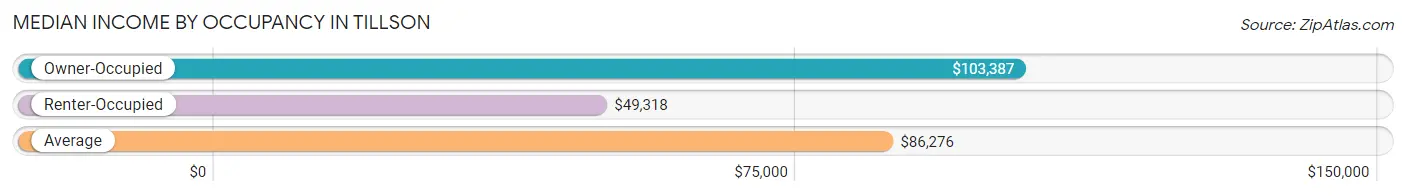
| Occupancy Type | # Households | Median Income |
| Owner-Occupied | 540 (80.6%) | $103,387 |
| Renter-Occupied | 130 (19.4%) | $49,318 |
| Average | 670 (100.0%) | $86,276 |
Occupancy by Householder Income Bracket in Tillson
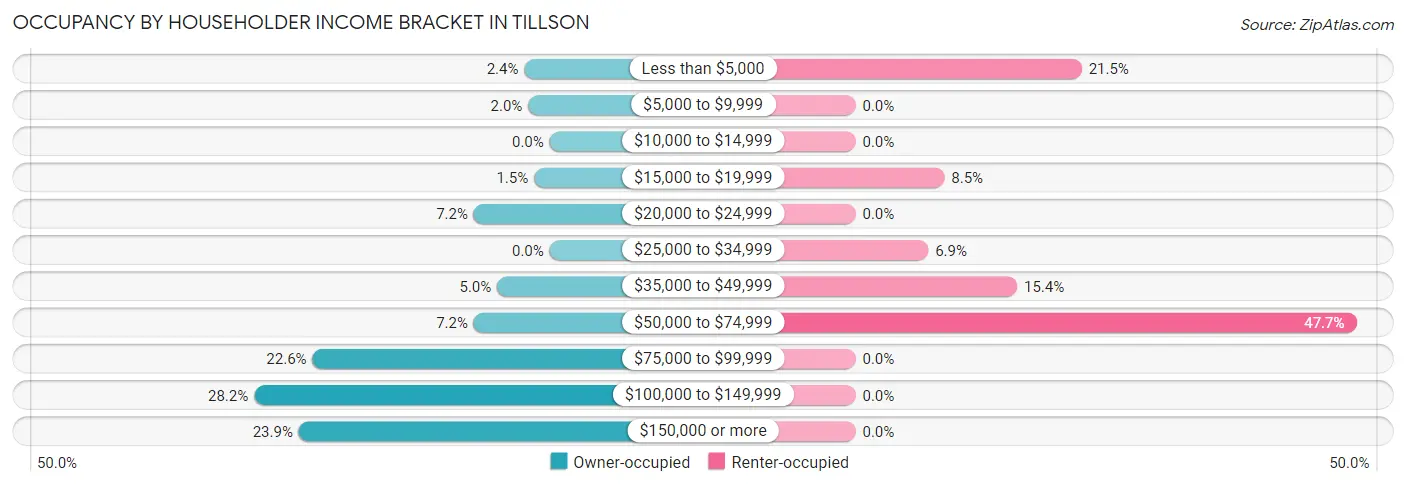
| Income Bracket | Owner-occupied | Renter-occupied |
| Less than $5,000 | 13 (2.4%) | 28 (21.5%) |
| $5,000 to $9,999 | 11 (2.0%) | 0 (0.0%) |
| $10,000 to $14,999 | 0 (0.0%) | 0 (0.0%) |
| $15,000 to $19,999 | 8 (1.5%) | 11 (8.5%) |
| $20,000 to $24,999 | 39 (7.2%) | 0 (0.0%) |
| $25,000 to $34,999 | 0 (0.0%) | 9 (6.9%) |
| $35,000 to $49,999 | 27 (5.0%) | 20 (15.4%) |
| $50,000 to $74,999 | 39 (7.2%) | 62 (47.7%) |
| $75,000 to $99,999 | 122 (22.6%) | 0 (0.0%) |
| $100,000 to $149,999 | 152 (28.1%) | 0 (0.0%) |
| $150,000 or more | 129 (23.9%) | 0 (0.0%) |
| Total | 540 (100.0%) | 130 (100.0%) |
Monthly Housing Cost Tiers in Tillson
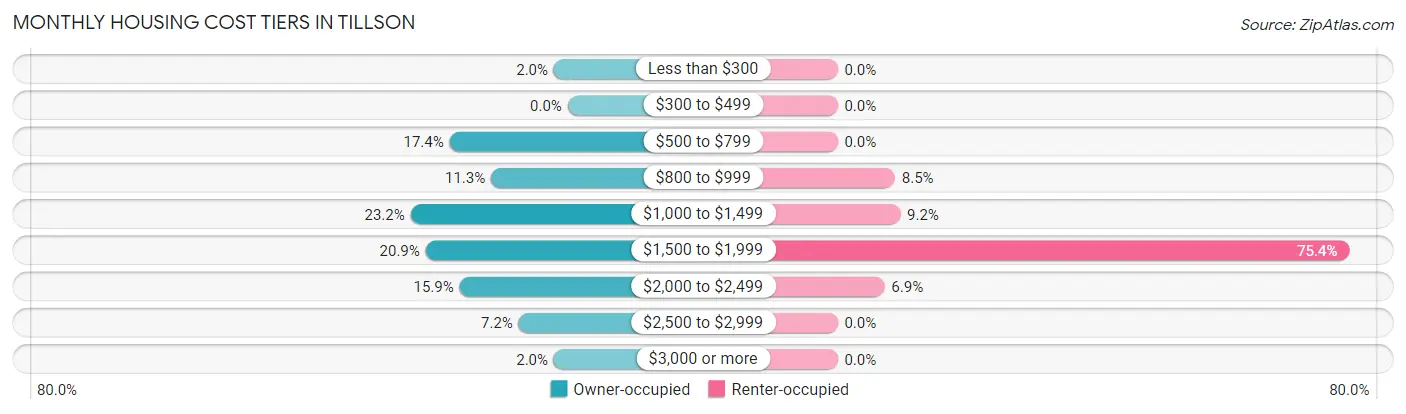
| Monthly Cost | Owner-occupied | Renter-occupied |
| Less than $300 | 11 (2.0%) | 0 (0.0%) |
| $300 to $499 | 0 (0.0%) | 0 (0.0%) |
| $500 to $799 | 94 (17.4%) | 0 (0.0%) |
| $800 to $999 | 61 (11.3%) | 11 (8.5%) |
| $1,000 to $1,499 | 125 (23.2%) | 12 (9.2%) |
| $1,500 to $1,999 | 113 (20.9%) | 98 (75.4%) |
| $2,000 to $2,499 | 86 (15.9%) | 9 (6.9%) |
| $2,500 to $2,999 | 39 (7.2%) | 0 (0.0%) |
| $3,000 or more | 11 (2.0%) | 0 (0.0%) |
| Total | 540 (100.0%) | 130 (100.0%) |
Physical Housing Characteristics in Tillson
Housing Structures in Tillson
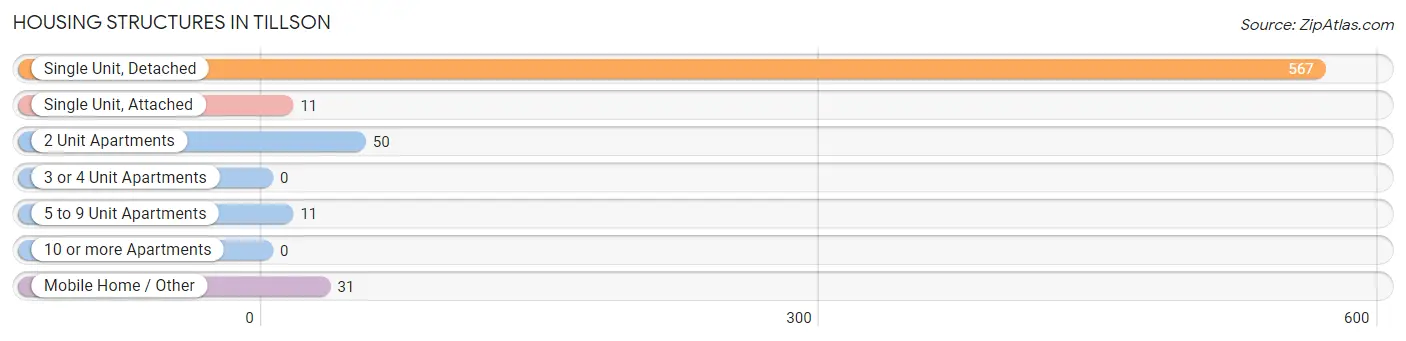
| Structure Type | # Housing Units | % Housing Units |
| Single Unit, Detached | 567 | 84.6% |
| Single Unit, Attached | 11 | 1.6% |
| 2 Unit Apartments | 50 | 7.5% |
| 3 or 4 Unit Apartments | 0 | 0.0% |
| 5 to 9 Unit Apartments | 11 | 1.6% |
| 10 or more Apartments | 0 | 0.0% |
| Mobile Home / Other | 31 | 4.6% |
| Total | 670 | 100.0% |
Housing Structures by Occupancy in Tillson
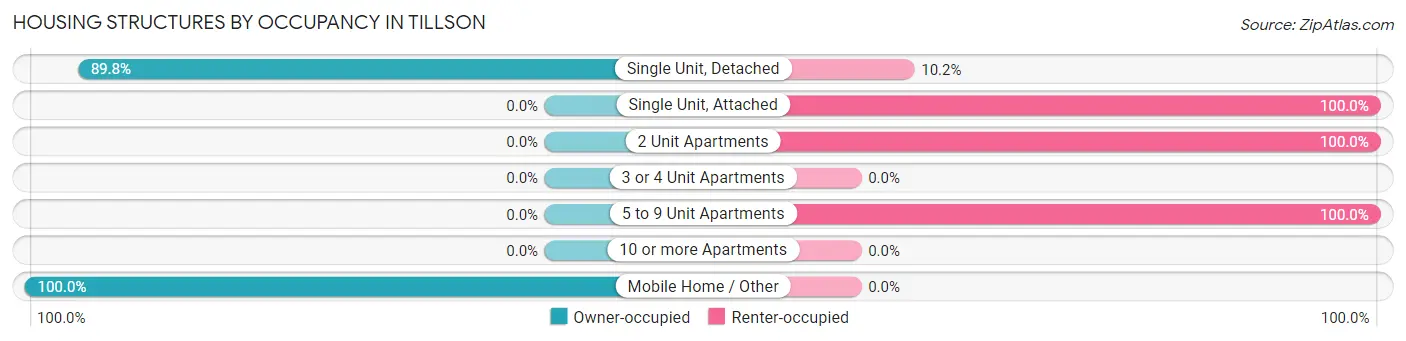
| Structure Type | Owner-occupied | Renter-occupied |
| Single Unit, Detached | 509 (89.8%) | 58 (10.2%) |
| Single Unit, Attached | 0 (0.0%) | 11 (100.0%) |
| 2 Unit Apartments | 0 (0.0%) | 50 (100.0%) |
| 3 or 4 Unit Apartments | 0 (0.0%) | 0 (0.0%) |
| 5 to 9 Unit Apartments | 0 (0.0%) | 11 (100.0%) |
| 10 or more Apartments | 0 (0.0%) | 0 (0.0%) |
| Mobile Home / Other | 31 (100.0%) | 0 (0.0%) |
| Total | 540 (80.6%) | 130 (19.4%) |
Housing Structures by Number of Rooms in Tillson
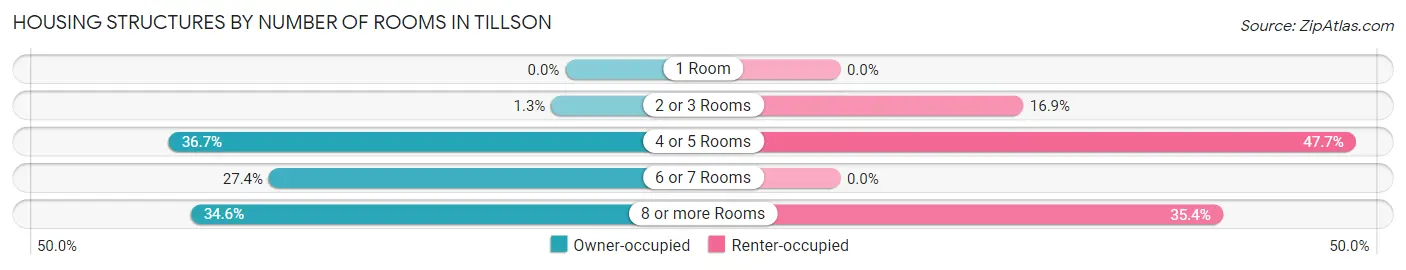
| Number of Rooms | Owner-occupied | Renter-occupied |
| 1 Room | 0 (0.0%) | 0 (0.0%) |
| 2 or 3 Rooms | 7 (1.3%) | 22 (16.9%) |
| 4 or 5 Rooms | 198 (36.7%) | 62 (47.7%) |
| 6 or 7 Rooms | 148 (27.4%) | 0 (0.0%) |
| 8 or more Rooms | 187 (34.6%) | 46 (35.4%) |
| Total | 540 (100.0%) | 130 (100.0%) |
Housing Structure by Heating Type in Tillson
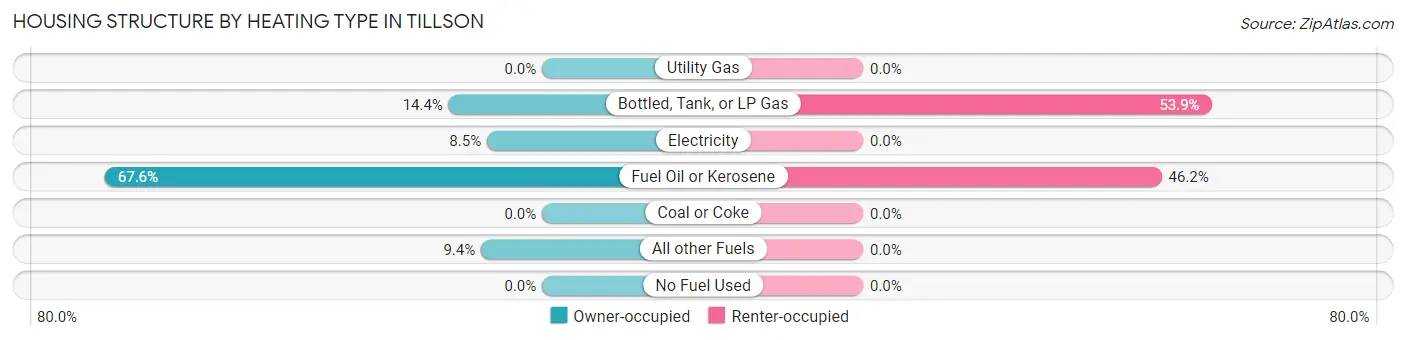
| Heating Type | Owner-occupied | Renter-occupied |
| Utility Gas | 0 (0.0%) | 0 (0.0%) |
| Bottled, Tank, or LP Gas | 78 (14.4%) | 70 (53.8%) |
| Electricity | 46 (8.5%) | 0 (0.0%) |
| Fuel Oil or Kerosene | 365 (67.6%) | 60 (46.2%) |
| Coal or Coke | 0 (0.0%) | 0 (0.0%) |
| All other Fuels | 51 (9.4%) | 0 (0.0%) |
| No Fuel Used | 0 (0.0%) | 0 (0.0%) |
| Total | 540 (100.0%) | 130 (100.0%) |
Household Vehicle Usage in Tillson
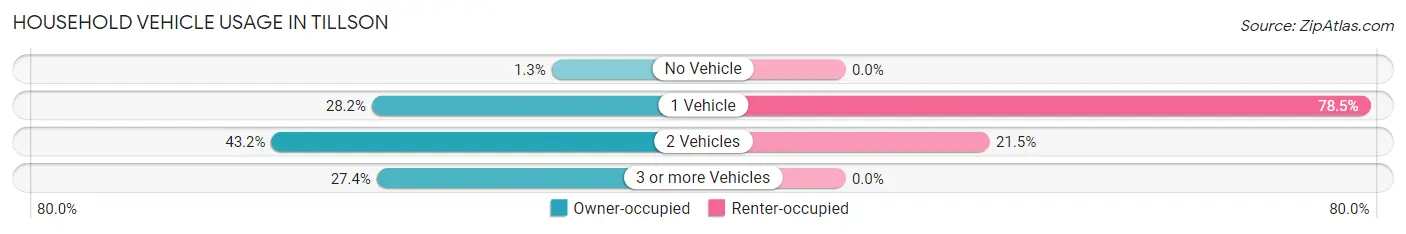
| Vehicles per Household | Owner-occupied | Renter-occupied |
| No Vehicle | 7 (1.3%) | 0 (0.0%) |
| 1 Vehicle | 152 (28.1%) | 102 (78.5%) |
| 2 Vehicles | 233 (43.1%) | 28 (21.5%) |
| 3 or more Vehicles | 148 (27.4%) | 0 (0.0%) |
| Total | 540 (100.0%) | 130 (100.0%) |
Real Estate & Mortgages in Tillson
Real Estate and Mortgage Overview in Tillson
| Characteristic | Without Mortgage | With Mortgage |
| Housing Units | 219 | 321 |
| Median Property Value | $233,500 | $261,500 |
| Median Household Income | $79,306 | $120 |
| Monthly Housing Costs | $832 | $11 |
| Real Estate Taxes | $5,828 | $11 |
Property Value by Mortgage Status in Tillson
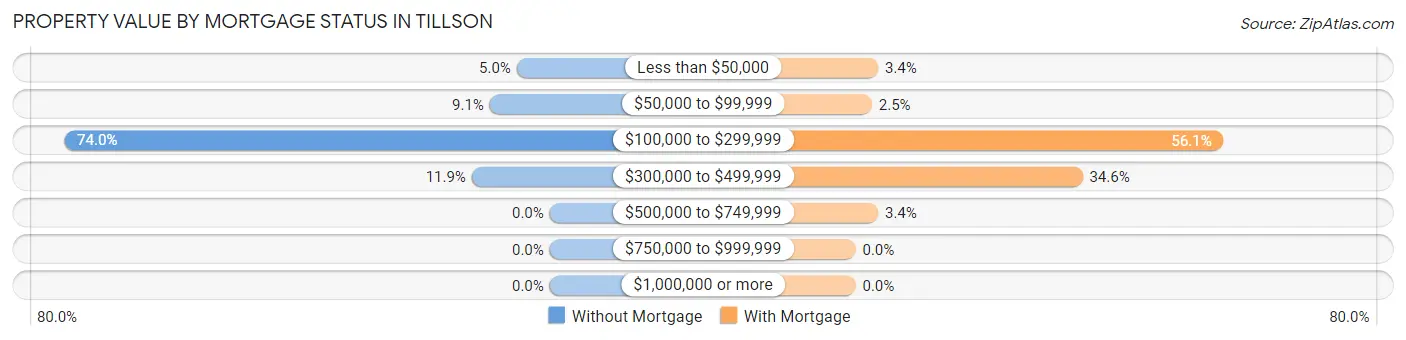
| Property Value | Without Mortgage | With Mortgage |
| Less than $50,000 | 11 (5.0%) | 11 (3.4%) |
| $50,000 to $99,999 | 20 (9.1%) | 8 (2.5%) |
| $100,000 to $299,999 | 162 (74.0%) | 180 (56.1%) |
| $300,000 to $499,999 | 26 (11.9%) | 111 (34.6%) |
| $500,000 to $749,999 | 0 (0.0%) | 11 (3.4%) |
| $750,000 to $999,999 | 0 (0.0%) | 0 (0.0%) |
| $1,000,000 or more | 0 (0.0%) | 0 (0.0%) |
| Total | 219 (100.0%) | 321 (100.0%) |
Household Income by Mortgage Status in Tillson
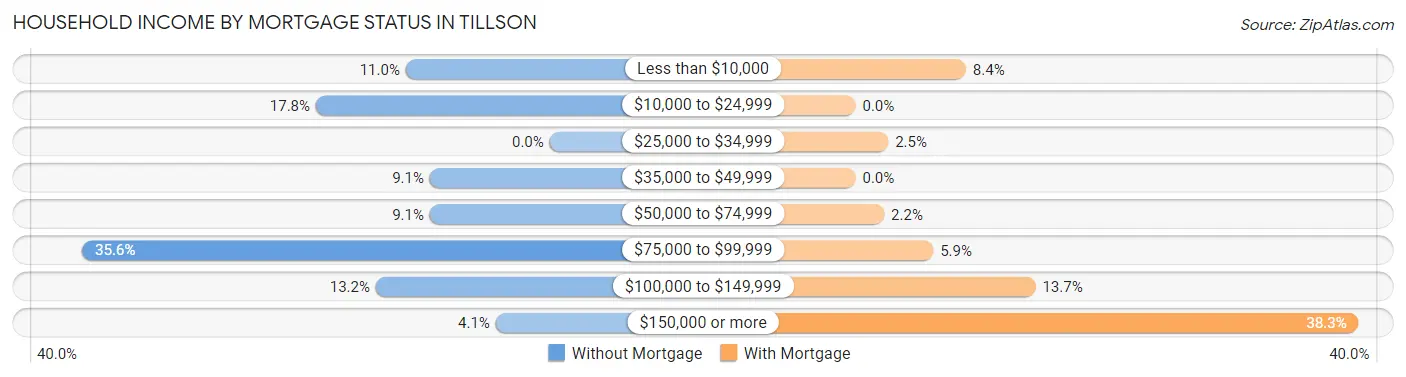
| Household Income | Without Mortgage | With Mortgage |
| Less than $10,000 | 24 (11.0%) | 27 (8.4%) |
| $10,000 to $24,999 | 39 (17.8%) | 0 (0.0%) |
| $25,000 to $34,999 | 0 (0.0%) | 8 (2.5%) |
| $35,000 to $49,999 | 20 (9.1%) | 0 (0.0%) |
| $50,000 to $74,999 | 20 (9.1%) | 7 (2.2%) |
| $75,000 to $99,999 | 78 (35.6%) | 19 (5.9%) |
| $100,000 to $149,999 | 29 (13.2%) | 44 (13.7%) |
| $150,000 or more | 9 (4.1%) | 123 (38.3%) |
| Total | 219 (100.0%) | 321 (100.0%) |
Property Value to Household Income Ratio in Tillson
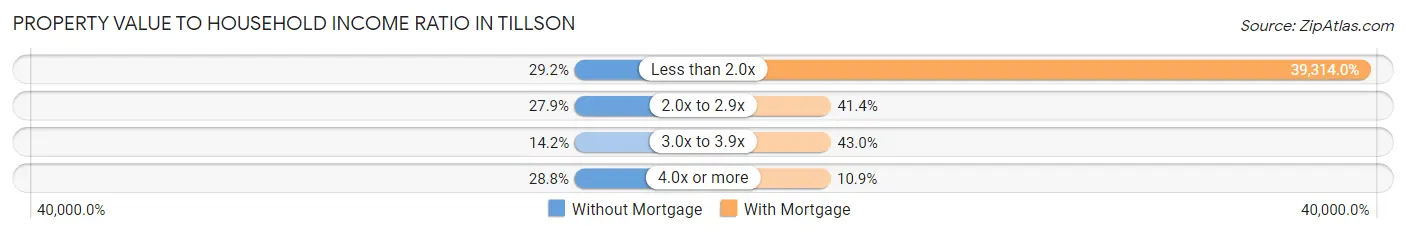
| Value-to-Income Ratio | Without Mortgage | With Mortgage |
| Less than 2.0x | 64 (29.2%) | 126,198 (39,314.0%) |
| 2.0x to 2.9x | 61 (27.9%) | 133 (41.4%) |
| 3.0x to 3.9x | 31 (14.2%) | 138 (43.0%) |
| 4.0x or more | 63 (28.8%) | 35 (10.9%) |
| Total | 219 (100.0%) | 321 (100.0%) |
Real Estate Taxes by Mortgage Status in Tillson
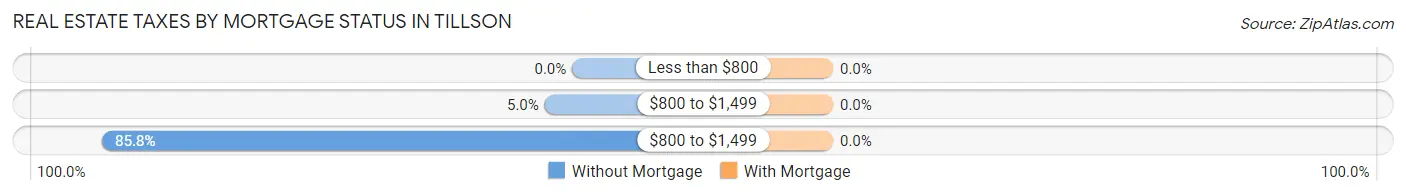
| Property Taxes | Without Mortgage | With Mortgage |
| Less than $800 | 0 (0.0%) | 0 (0.0%) |
| $800 to $1,499 | 11 (5.0%) | 0 (0.0%) |
| $800 to $1,499 | 188 (85.8%) | 0 (0.0%) |
| Total | 219 (100.0%) | 321 (100.0%) |
Health & Disability in Tillson
Health Insurance Coverage by Age in Tillson
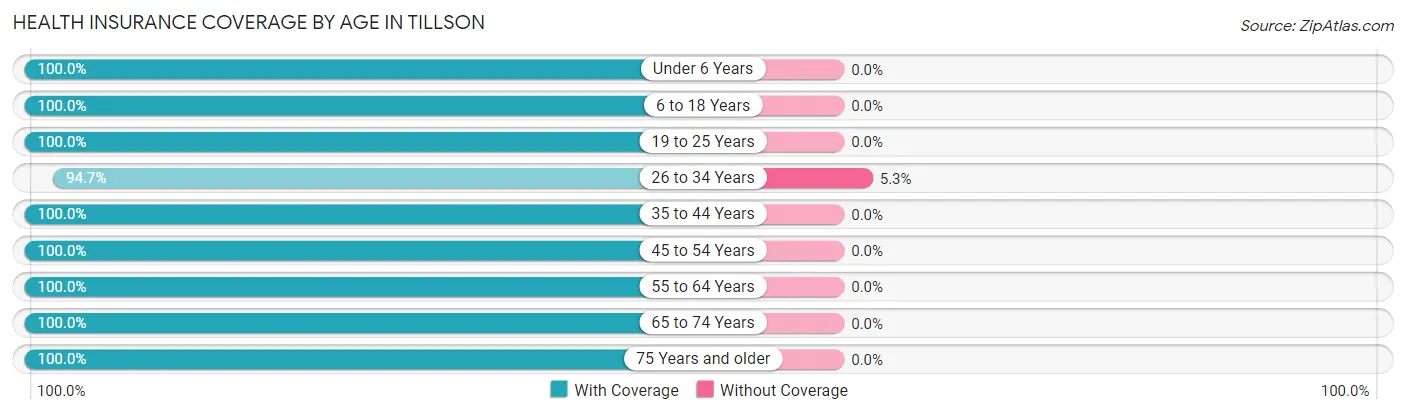
| Age Bracket | With Coverage | Without Coverage |
| Under 6 Years | 152 (100.0%) | 0 (0.0%) |
| 6 to 18 Years | 133 (100.0%) | 0 (0.0%) |
| 19 to 25 Years | 23 (100.0%) | 0 (0.0%) |
| 26 to 34 Years | 196 (94.7%) | 11 (5.3%) |
| 35 to 44 Years | 217 (100.0%) | 0 (0.0%) |
| 45 to 54 Years | 261 (100.0%) | 0 (0.0%) |
| 55 to 64 Years | 119 (100.0%) | 0 (0.0%) |
| 65 to 74 Years | 604 (100.0%) | 0 (0.0%) |
| 75 Years and older | 60 (100.0%) | 0 (0.0%) |
| Total | 1,765 (99.4%) | 11 (0.6%) |
Health Insurance Coverage by Citizenship Status in Tillson
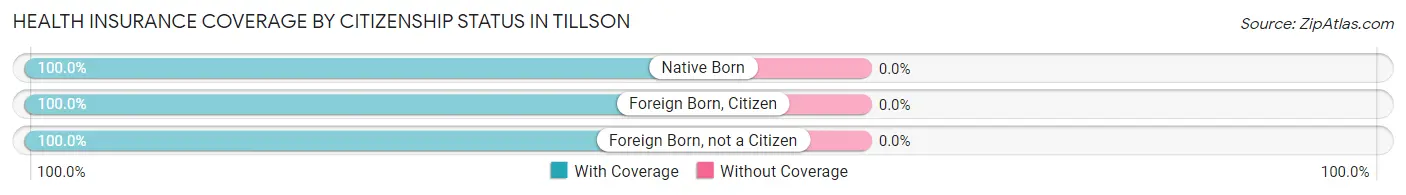
| Citizenship Status | With Coverage | Without Coverage |
| Native Born | 152 (100.0%) | 0 (0.0%) |
| Foreign Born, Citizen | 133 (100.0%) | 0 (0.0%) |
| Foreign Born, not a Citizen | 23 (100.0%) | 0 (0.0%) |
Health Insurance Coverage by Household Income in Tillson
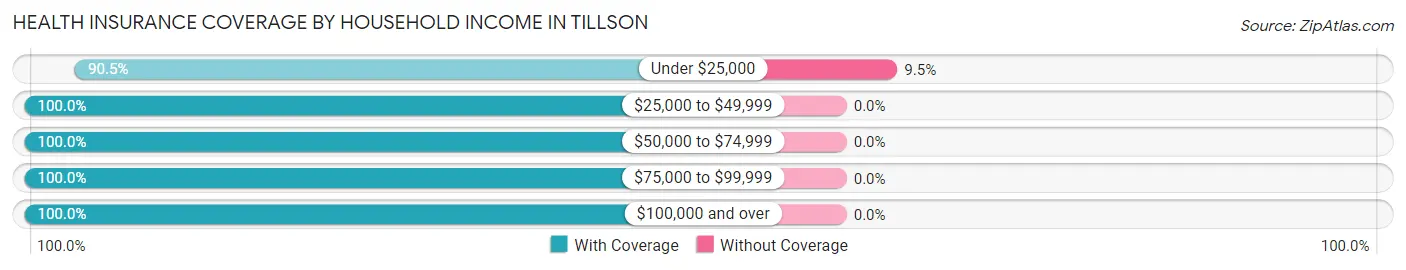
| Household Income | With Coverage | Without Coverage |
| Under $25,000 | 105 (90.5%) | 11 (9.5%) |
| $25,000 to $49,999 | 148 (100.0%) | 0 (0.0%) |
| $50,000 to $74,999 | 201 (100.0%) | 0 (0.0%) |
| $75,000 to $99,999 | 175 (100.0%) | 0 (0.0%) |
| $100,000 and over | 1,136 (100.0%) | 0 (0.0%) |
Public vs Private Health Insurance Coverage by Age in Tillson
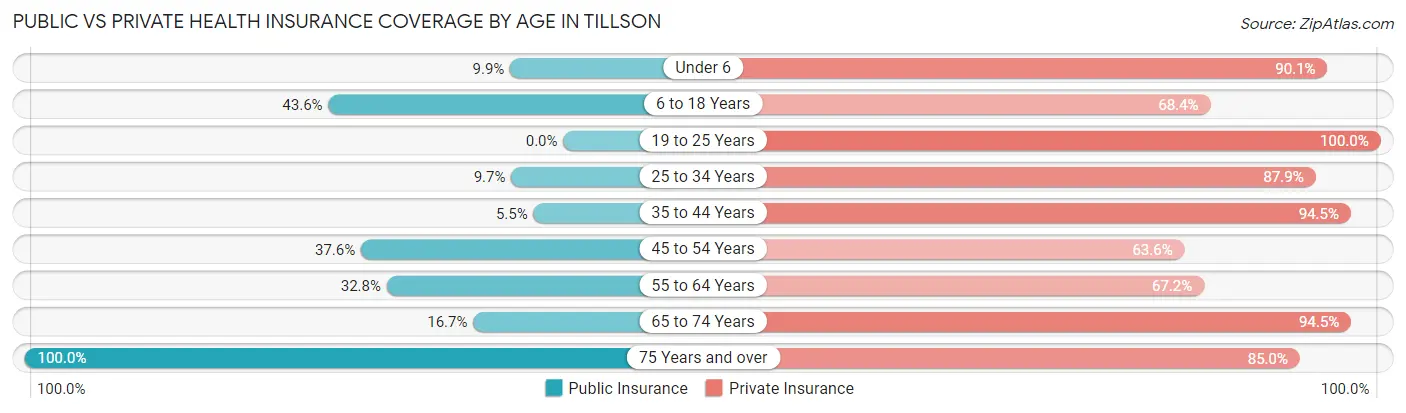
| Age Bracket | Public Insurance | Private Insurance |
| Under 6 | 15 (9.9%) | 137 (90.1%) |
| 6 to 18 Years | 58 (43.6%) | 91 (68.4%) |
| 19 to 25 Years | 0 (0.0%) | 23 (100.0%) |
| 25 to 34 Years | 20 (9.7%) | 182 (87.9%) |
| 35 to 44 Years | 12 (5.5%) | 205 (94.5%) |
| 45 to 54 Years | 98 (37.6%) | 166 (63.6%) |
| 55 to 64 Years | 39 (32.8%) | 80 (67.2%) |
| 65 to 74 Years | 101 (16.7%) | 571 (94.5%) |
| 75 Years and over | 60 (100.0%) | 51 (85.0%) |
| Total | 403 (22.7%) | 1,506 (84.8%) |
Disability Status by Sex by Age in Tillson
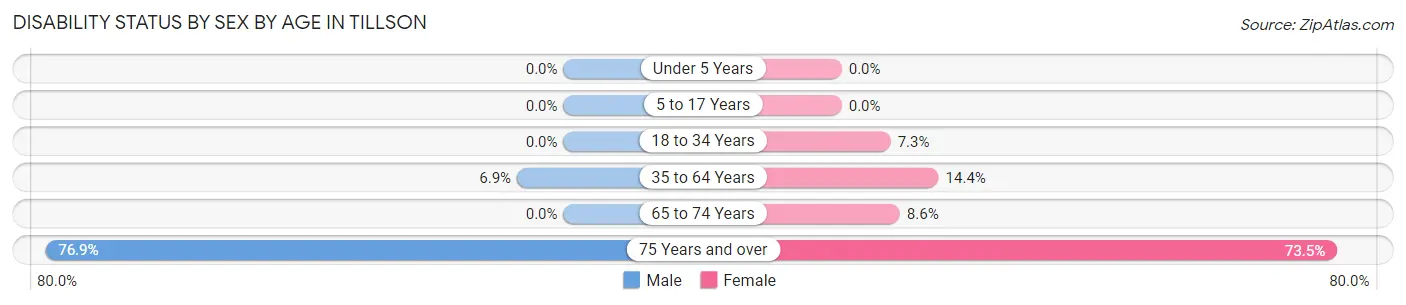
| Age Bracket | Male | Female |
| Under 5 Years | 0 (0.0%) | 0 (0.0%) |
| 5 to 17 Years | 0 (0.0%) | 0 (0.0%) |
| 18 to 34 Years | 0 (0.0%) | 9 (7.3%) |
| 35 to 64 Years | 21 (6.9%) | 42 (14.4%) |
| 65 to 74 Years | 0 (0.0%) | 27 (8.6%) |
| 75 Years and over | 20 (76.9%) | 25 (73.5%) |
Disability Class by Sex by Age in Tillson
Disability Class: Hearing Difficulty
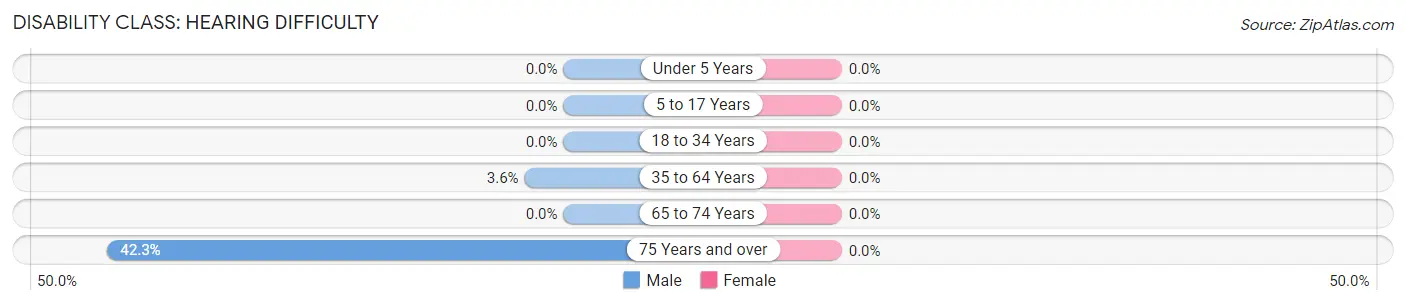
| Age Bracket | Male | Female |
| Under 5 Years | 0 (0.0%) | 0 (0.0%) |
| 5 to 17 Years | 0 (0.0%) | 0 (0.0%) |
| 18 to 34 Years | 0 (0.0%) | 0 (0.0%) |
| 35 to 64 Years | 11 (3.6%) | 0 (0.0%) |
| 65 to 74 Years | 0 (0.0%) | 0 (0.0%) |
| 75 Years and over | 11 (42.3%) | 0 (0.0%) |
Disability Class: Vision Difficulty
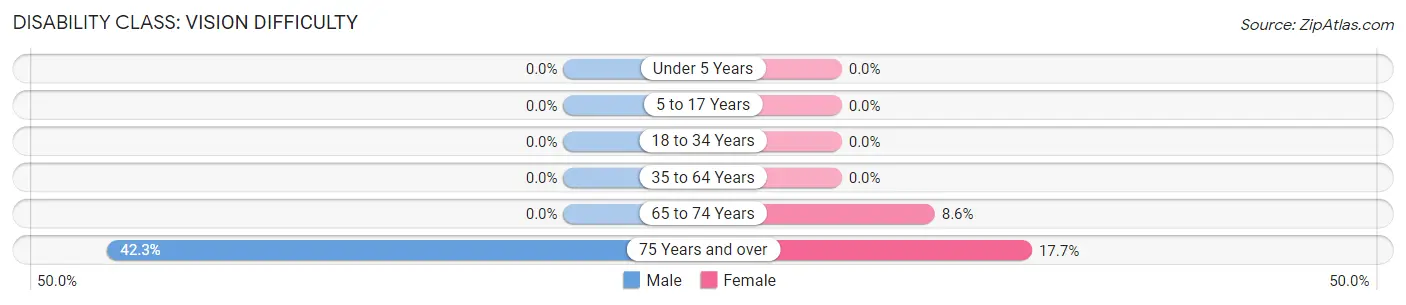
| Age Bracket | Male | Female |
| Under 5 Years | 0 (0.0%) | 0 (0.0%) |
| 5 to 17 Years | 0 (0.0%) | 0 (0.0%) |
| 18 to 34 Years | 0 (0.0%) | 0 (0.0%) |
| 35 to 64 Years | 0 (0.0%) | 0 (0.0%) |
| 65 to 74 Years | 0 (0.0%) | 27 (8.6%) |
| 75 Years and over | 11 (42.3%) | 6 (17.6%) |
Disability Class: Cognitive Difficulty
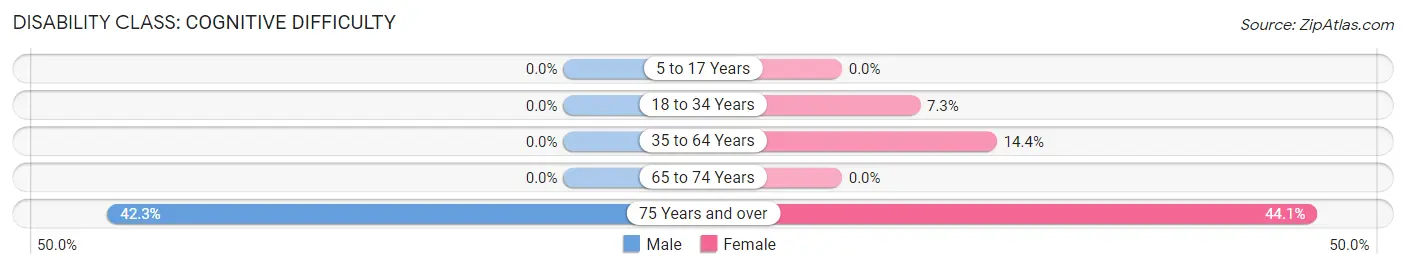
| Age Bracket | Male | Female |
| 5 to 17 Years | 0 (0.0%) | 0 (0.0%) |
| 18 to 34 Years | 0 (0.0%) | 9 (7.3%) |
| 35 to 64 Years | 0 (0.0%) | 42 (14.4%) |
| 65 to 74 Years | 0 (0.0%) | 0 (0.0%) |
| 75 Years and over | 11 (42.3%) | 15 (44.1%) |
Disability Class: Ambulatory Difficulty
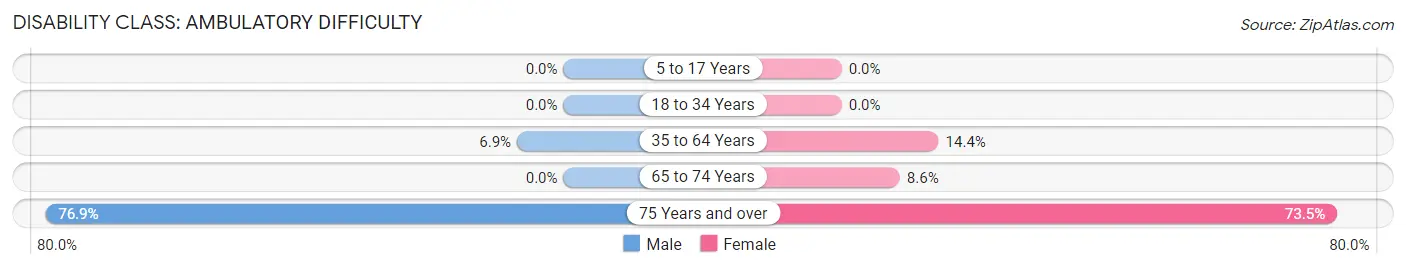
| Age Bracket | Male | Female |
| 5 to 17 Years | 0 (0.0%) | 0 (0.0%) |
| 18 to 34 Years | 0 (0.0%) | 0 (0.0%) |
| 35 to 64 Years | 21 (6.9%) | 42 (14.4%) |
| 65 to 74 Years | 0 (0.0%) | 27 (8.6%) |
| 75 Years and over | 20 (76.9%) | 25 (73.5%) |
Disability Class: Self-Care Difficulty
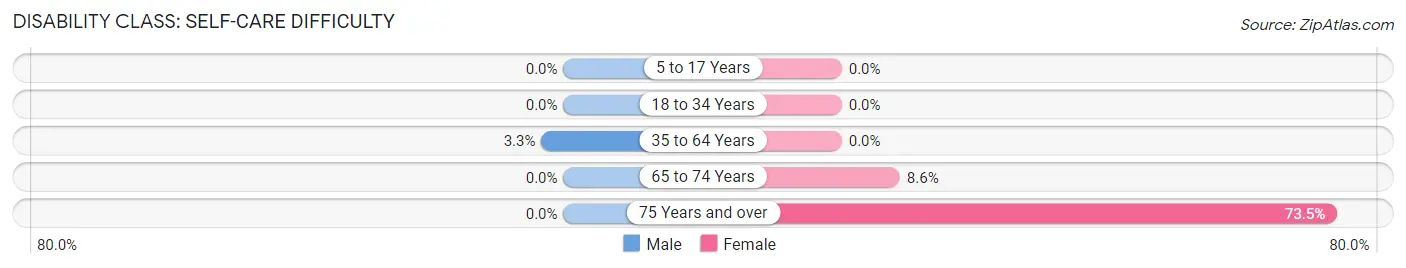
| Age Bracket | Male | Female |
| 5 to 17 Years | 0 (0.0%) | 0 (0.0%) |
| 18 to 34 Years | 0 (0.0%) | 0 (0.0%) |
| 35 to 64 Years | 10 (3.3%) | 0 (0.0%) |
| 65 to 74 Years | 0 (0.0%) | 27 (8.6%) |
| 75 Years and over | 0 (0.0%) | 25 (73.5%) |
Technology Access in Tillson
Computing Device Access in Tillson
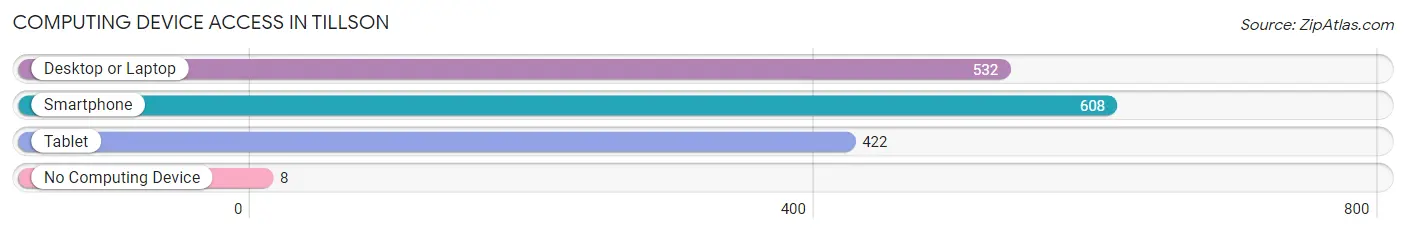
| Device Type | # Households | % Households |
| Desktop or Laptop | 532 | 79.4% |
| Smartphone | 608 | 90.7% |
| Tablet | 422 | 63.0% |
| No Computing Device | 8 | 1.2% |
| Total | 670 | 100.0% |
Internet Access in Tillson
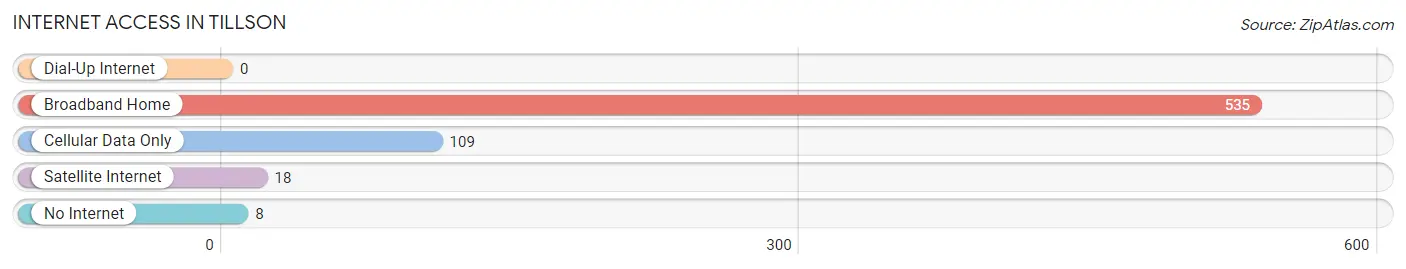
| Internet Type | # Households | % Households |
| Dial-Up Internet | 0 | 0.0% |
| Broadband Home | 535 | 79.8% |
| Cellular Data Only | 109 | 16.3% |
| Satellite Internet | 18 | 2.7% |
| No Internet | 8 | 1.2% |
| Total | 670 | 100.0% |
Tillson Summary
Tillson is a hamlet located in the town of Rosendale in Ulster County, New York. It is situated on the Rondout Creek, a tributary of the Hudson River, and is located about halfway between the cities of Kingston and New Paltz. The hamlet is home to a variety of businesses, including a post office, a general store, a gas station, a restaurant, and a few other small businesses.
History
Tillson was first settled in the late 1700s by the Tillson family, who were among the first settlers in the area. The hamlet was originally known as Tillsontown, and was later shortened to Tillson. The hamlet was officially incorporated in 1845.
In the late 1800s, Tillson was a thriving community with a variety of businesses, including a grist mill, a saw mill, a blacksmith shop, a general store, and a post office. The hamlet was also home to a number of churches, including the Methodist Episcopal Church, the Presbyterian Church, and the Reformed Church.
In the early 1900s, the hamlet began to decline as the population shifted away from rural areas and towards larger cities. By the mid-1900s, many of the businesses had closed and the population had dwindled.
Geography
Tillson is located in the town of Rosendale in Ulster County, New York. It is situated on the Rondout Creek, a tributary of the Hudson River, and is located about halfway between the cities of Kingston and New Paltz. The hamlet is located in the foothills of the Shawangunk Mountains, and is surrounded by rolling hills and forests.
Economy
Tillson is home to a variety of businesses, including a post office, a general store, a gas station, a restaurant, and a few other small businesses. The hamlet is also home to a number of farms, which produce a variety of fruits and vegetables.
Demographics
As of the 2010 census, the population of Tillson was 1,092. The median age was 44.7 years, and the median household income was $50,972. The racial makeup of the hamlet was 94.2% White, 1.7% African American, 0.7% Native American, 0.7% Asian, and 2.7% from other races.
Tillson is a small, rural community with a close-knit population. The hamlet is home to a variety of businesses, farms, and churches, and is a popular destination for outdoor recreation.
Common Questions
What is Per Capita Income in Tillson?
Per Capita income in Tillson is $40,860.
What is the Median Family Income in Tillson?
Median Family Income in Tillson is $106,635.
What is the Median Household income in Tillson?
Median Household Income in Tillson is $86,276.
What is Inequality or Gini Index in Tillson?
Inequality or Gini Index in Tillson is 0.36.
What is the Total Population of Tillson?
Total Population of Tillson is 1,782.
What is the Total Male Population of Tillson?
Total Male Population of Tillson is 915.
What is the Total Female Population of Tillson?
Total Female Population of Tillson is 867.
What is the Ratio of Males per 100 Females in Tillson?
There are 105.54 Males per 100 Females in Tillson.
What is the Ratio of Females per 100 Males in Tillson?
There are 94.75 Females per 100 Males in Tillson.
What is the Median Population Age in Tillson?
Median Population Age in Tillson is 52.7 Years.
What is the Average Family Size in Tillson
Average Family Size in Tillson is 4.0 People.
What is the Average Household Size in Tillson
Average Household Size in Tillson is 2.7 People.
How Large is the Labor Force in Tillson?
There are 1,195 People in the Labor Forcein in Tillson.
What is the Percentage of People in the Labor Force in Tillson?
79.8% of People are in the Labor Force in Tillson.
What is the Unemployment Rate in Tillson?
Unemployment Rate in Tillson is 1.0%.