Cities with the Largest Indian (Asian) Community in Michigan
RELATED REPORTS & OPTIONS
Indian (Asian)
Michigan
Compare Cities
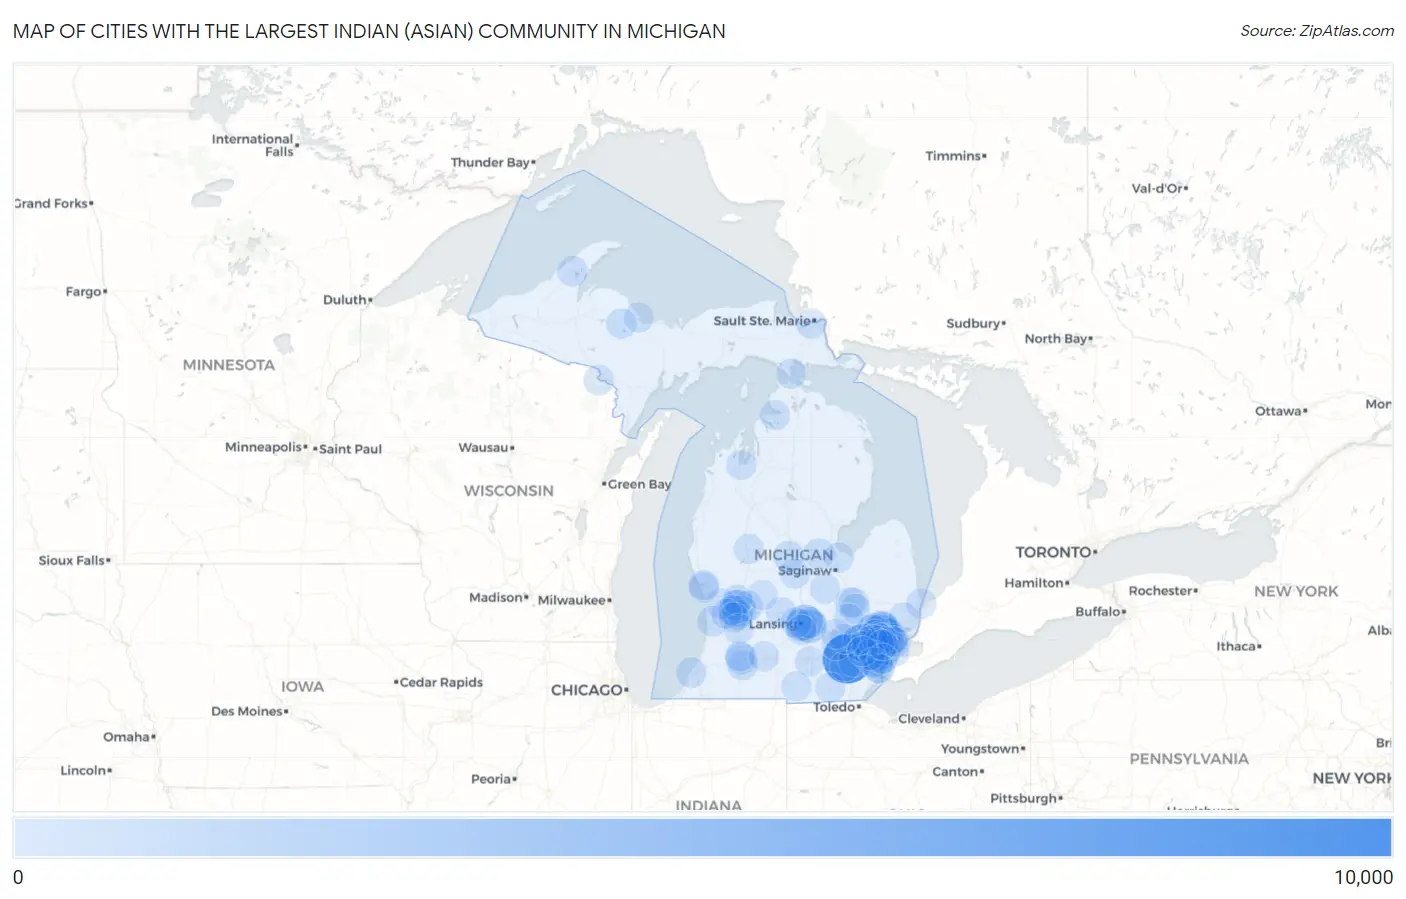
Map of Cities with the Largest Indian (Asian) Community in Michigan
0
10,000
Cities with the Largest Indian (Asian) Community in Michigan
| City | Indian (Asian) | vs State | vs National | |
| 1. | Ann Arbor | 8,877 | 68,398(12.98%)#1 | 5,326,595(0.17%)#72 |
| 2. | Troy | 4,348 | 68,398(6.36%)#2 | 5,326,595(0.08%)#153 |
| 3. | Novi | 3,059 | 68,398(4.47%)#3 | 5,326,595(0.06%)#218 |
| 4. | Rochester Hills | 2,623 | 68,398(3.83%)#4 | 5,326,595(0.05%)#274 |
| 5. | East Lansing | 2,353 | 68,398(3.44%)#5 | 5,326,595(0.04%)#307 |
| 6. | Okemos | 1,689 | 68,398(2.47%)#6 | 5,326,595(0.03%)#409 |
| 7. | Sterling Heights | 1,506 | 68,398(2.20%)#7 | 5,326,595(0.03%)#446 |
| 8. | Grand Rapids | 1,228 | 68,398(1.80%)#8 | 5,326,595(0.02%)#549 |
| 9. | Detroit | 1,040 | 68,398(1.52%)#9 | 5,326,595(0.02%)#631 |
| 10. | Lansing | 928 | 68,398(1.36%)#10 | 5,326,595(0.02%)#682 |
| 11. | Madison Heights | 896 | 68,398(1.31%)#11 | 5,326,595(0.02%)#697 |
| 12. | Farmington Hills | 747 | 68,398(1.09%)#12 | 5,326,595(0.01%)#789 |
| 13. | Livonia | 641 | 68,398(0.94%)#13 | 5,326,595(0.01%)#883 |
| 14. | Royal Oak | 632 | 68,398(0.92%)#14 | 5,326,595(0.01%)#887 |
| 15. | Kalamazoo | 629 | 68,398(0.92%)#15 | 5,326,595(0.01%)#894 |
| 16. | Dearborn | 625 | 68,398(0.91%)#16 | 5,326,595(0.01%)#903 |
| 17. | Warren | 597 | 68,398(0.87%)#17 | 5,326,595(0.01%)#954 |
| 18. | Haslett | 577 | 68,398(0.84%)#18 | 5,326,595(0.01%)#983 |
| 19. | Allen Park | 514 | 68,398(0.75%)#19 | 5,326,595(0.01%)#1,076 |
| 20. | Kentwood | 488 | 68,398(0.71%)#20 | 5,326,595(0.01%)#1,130 |
| 21. | Auburn Hills | 450 | 68,398(0.66%)#21 | 5,326,595(0.01%)#1,198 |
| 22. | Wyoming | 405 | 68,398(0.59%)#22 | 5,326,595(0.01%)#1,294 |
| 23. | Rochester | 392 | 68,398(0.57%)#23 | 5,326,595(0.01%)#1,327 |
| 24. | Grosse Pointe Park | 324 | 68,398(0.47%)#24 | 5,326,595(0.01%)#1,535 |
| 25. | Westland | 323 | 68,398(0.47%)#25 | 5,326,595(0.01%)#1,537 |
| 26. | Midland | 306 | 68,398(0.45%)#26 | 5,326,595(0.01%)#1,595 |
| 27. | Forest Hills | 299 | 68,398(0.44%)#27 | 5,326,595(0.01%)#1,620 |
| 28. | Mount Pleasant | 278 | 68,398(0.41%)#28 | 5,326,595(0.01%)#1,717 |
| 29. | Southfield | 267 | 68,398(0.39%)#29 | 5,326,595(0.01%)#1,757 |
| 30. | Ypsilanti | 263 | 68,398(0.38%)#30 | 5,326,595(0.00%)#1,782 |
| 31. | Pontiac | 253 | 68,398(0.37%)#31 | 5,326,595(0.00%)#1,832 |
| 32. | Houghton | 250 | 68,398(0.37%)#32 | 5,326,595(0.00%)#1,847 |
| 33. | Allendale | 248 | 68,398(0.36%)#33 | 5,326,595(0.00%)#1,857 |
| 34. | Beverly Hills | 239 | 68,398(0.35%)#34 | 5,326,595(0.00%)#1,911 |
| 35. | Holland | 227 | 68,398(0.33%)#35 | 5,326,595(0.00%)#1,967 |
| 36. | Portage | 222 | 68,398(0.32%)#36 | 5,326,595(0.00%)#1,996 |
| 37. | Waverly | 211 | 68,398(0.31%)#37 | 5,326,595(0.00%)#2,058 |
| 38. | Southgate | 207 | 68,398(0.30%)#38 | 5,326,595(0.00%)#2,085 |
| 39. | Berkley | 193 | 68,398(0.28%)#39 | 5,326,595(0.00%)#2,172 |
| 40. | Hamtramck | 169 | 68,398(0.25%)#40 | 5,326,595(0.00%)#2,363 |
| 41. | Hazel Park | 168 | 68,398(0.25%)#41 | 5,326,595(0.00%)#2,376 |
| 42. | Bloomfield Hills | 163 | 68,398(0.24%)#42 | 5,326,595(0.00%)#2,431 |
| 43. | Cutlerville | 157 | 68,398(0.23%)#43 | 5,326,595(0.00%)#2,490 |
| 44. | Birmingham | 156 | 68,398(0.23%)#44 | 5,326,595(0.00%)#2,497 |
| 45. | Fraser | 155 | 68,398(0.23%)#45 | 5,326,595(0.00%)#2,509 |
| 46. | St Joseph | 154 | 68,398(0.23%)#46 | 5,326,595(0.00%)#2,528 |
| 47. | Flint | 136 | 68,398(0.20%)#47 | 5,326,595(0.00%)#2,690 |
| 48. | St Clair Shores | 134 | 68,398(0.20%)#48 | 5,326,595(0.00%)#2,712 |
| 49. | Farmington | 132 | 68,398(0.19%)#49 | 5,326,595(0.00%)#2,735 |
| 50. | Portland | 131 | 68,398(0.19%)#50 | 5,326,595(0.00%)#2,754 |
| 51. | Holt | 125 | 68,398(0.18%)#51 | 5,326,595(0.00%)#2,819 |
| 52. | Northville | 121 | 68,398(0.18%)#52 | 5,326,595(0.00%)#2,881 |
| 53. | West Ishpeming | 114 | 68,398(0.17%)#53 | 5,326,595(0.00%)#2,967 |
| 54. | Westwood | 108 | 68,398(0.16%)#54 | 5,326,595(0.00%)#3,046 |
| 55. | Sault Ste Marie | 106 | 68,398(0.15%)#55 | 5,326,595(0.00%)#3,073 |
| 56. | Walker | 100 | 68,398(0.15%)#56 | 5,326,595(0.00%)#3,191 |
| 57. | Dearborn Heights | 98 | 68,398(0.14%)#57 | 5,326,595(0.00%)#3,218 |
| 58. | Roosevelt Park | 96 | 68,398(0.14%)#58 | 5,326,595(0.00%)#3,271 |
| 59. | Battle Creek | 93 | 68,398(0.14%)#59 | 5,326,595(0.00%)#3,304 |
| 60. | Grandville | 92 | 68,398(0.13%)#60 | 5,326,595(0.00%)#3,329 |
| 61. | Riverview | 92 | 68,398(0.13%)#61 | 5,326,595(0.00%)#3,331 |
| 62. | Port Huron | 91 | 68,398(0.13%)#62 | 5,326,595(0.00%)#3,343 |
| 63. | Muskegon | 90 | 68,398(0.13%)#63 | 5,326,595(0.00%)#3,360 |
| 64. | Jackson | 90 | 68,398(0.13%)#64 | 5,326,595(0.00%)#3,362 |
| 65. | Kingsford | 84 | 68,398(0.12%)#65 | 5,326,595(0.00%)#3,473 |
| 66. | Clawson | 81 | 68,398(0.12%)#66 | 5,326,595(0.00%)#3,523 |
| 67. | Oak Park | 80 | 68,398(0.12%)#67 | 5,326,595(0.00%)#3,541 |
| 68. | Bay City | 78 | 68,398(0.11%)#68 | 5,326,595(0.00%)#3,576 |
| 69. | Adrian | 78 | 68,398(0.11%)#69 | 5,326,595(0.00%)#3,579 |
| 70. | Hillsdale | 73 | 68,398(0.11%)#70 | 5,326,595(0.00%)#3,693 |
| 71. | Trenton | 72 | 68,398(0.11%)#71 | 5,326,595(0.00%)#3,709 |
| 72. | Big Rapids | 69 | 68,398(0.10%)#72 | 5,326,595(0.00%)#3,778 |
| 73. | Burton | 65 | 68,398(0.10%)#73 | 5,326,595(0.00%)#3,856 |
| 74. | Garden City | 65 | 68,398(0.10%)#74 | 5,326,595(0.00%)#3,858 |
| 75. | Wixom | 65 | 68,398(0.10%)#75 | 5,326,595(0.00%)#3,860 |
| 76. | Belding | 65 | 68,398(0.10%)#76 | 5,326,595(0.00%)#3,873 |
| 77. | Richmond | 65 | 68,398(0.10%)#77 | 5,326,595(0.00%)#3,874 |
| 78. | Grand Blanc | 63 | 68,398(0.09%)#78 | 5,326,595(0.00%)#3,918 |
| 79. | Franklin | 63 | 68,398(0.09%)#79 | 5,326,595(0.00%)#3,923 |
| 80. | Saline | 62 | 68,398(0.09%)#80 | 5,326,595(0.00%)#3,940 |
| 81. | Walled Lake | 61 | 68,398(0.09%)#81 | 5,326,595(0.00%)#3,975 |
| 82. | Chesaning | 60 | 68,398(0.09%)#82 | 5,326,595(0.00%)#4,006 |
| 83. | Comstock Park | 59 | 68,398(0.09%)#83 | 5,326,595(0.00%)#4,015 |
| 84. | Wayland | 57 | 68,398(0.08%)#84 | 5,326,595(0.00%)#4,082 |
| 85. | Pinckney | 56 | 68,398(0.08%)#85 | 5,326,595(0.00%)#4,115 |
| 86. | Roseville | 54 | 68,398(0.08%)#86 | 5,326,595(0.00%)#4,147 |
| 87. | Brighton | 54 | 68,398(0.08%)#87 | 5,326,595(0.00%)#4,154 |
| 88. | Taylor | 50 | 68,398(0.07%)#88 | 5,326,595(0.00%)#4,265 |
| 89. | Ferndale | 50 | 68,398(0.07%)#89 | 5,326,595(0.00%)#4,274 |
| 90. | Plymouth | 49 | 68,398(0.07%)#90 | 5,326,595(0.00%)#4,318 |
| 91. | St Ignace | 49 | 68,398(0.07%)#91 | 5,326,595(0.00%)#4,327 |
| 92. | Howell | 44 | 68,398(0.06%)#92 | 5,326,595(0.00%)#4,484 |
| 93. | Petoskey | 40 | 68,398(0.06%)#93 | 5,326,595(0.00%)#4,657 |
| 94. | Hudsonville | 38 | 68,398(0.06%)#94 | 5,326,595(0.00%)#4,743 |
| 95. | Traverse City | 37 | 68,398(0.05%)#95 | 5,326,595(0.00%)#4,774 |
| 96. | Fenton | 37 | 68,398(0.05%)#96 | 5,326,595(0.00%)#4,777 |
| 97. | Marquette | 35 | 68,398(0.05%)#97 | 5,326,595(0.00%)#4,864 |
| 98. | Alma | 35 | 68,398(0.05%)#98 | 5,326,595(0.00%)#4,875 |
| 99. | River Rouge | 35 | 68,398(0.05%)#99 | 5,326,595(0.00%)#4,879 |
| 100. | Byron Center | 33 | 68,398(0.05%)#100 | 5,326,595(0.00%)#5,001 |
Common Questions
What are the Top 10 Cities with the Largest Indian (Asian) Community in Michigan?
Top 10 Cities with the Largest Indian (Asian) Community in Michigan are:
#1
8,877
#2
4,348
#3
3,059
#4
2,623
#5
2,353
#6
1,689
#7
1,506
#8
1,228
#9
1,040
#10
928
What city has the Largest Indian (Asian) Community in Michigan?
Ann Arbor has the Largest Indian (Asian) Community in Michigan with 8,877.
What is the Total Indian (Asian) Population in the State of Michigan?
Total Indian (Asian) Population in Michigan is 68,398.
What is the Total Indian (Asian) Population in the United States?
Total Indian (Asian) Population in the United States is 5,326,595.