Cities with the Largest Indian (Asian) Community in Missouri
RELATED REPORTS & OPTIONS
Indian (Asian)
Missouri
Compare Cities
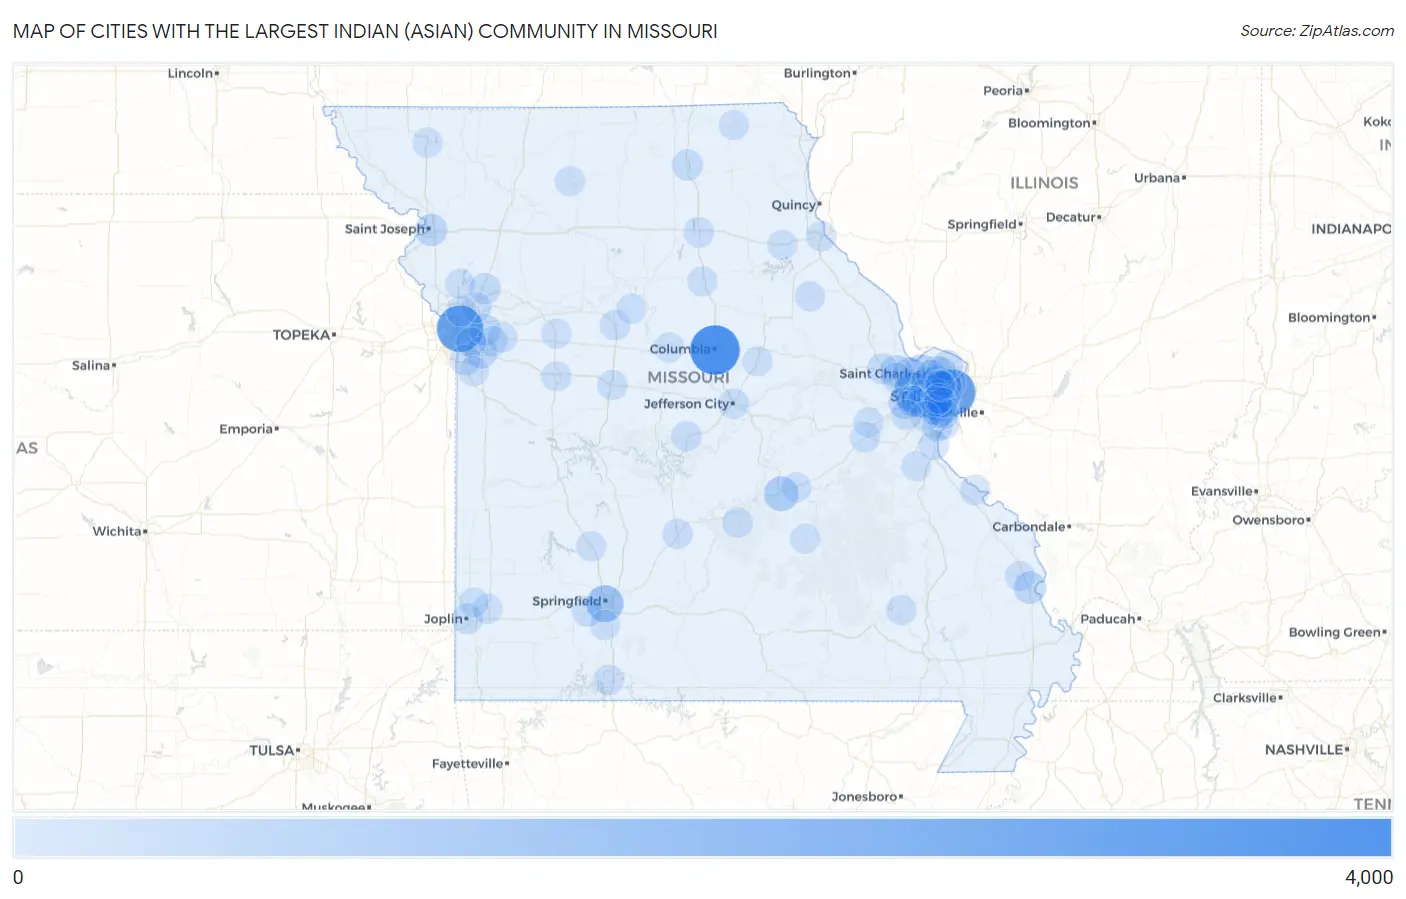
Map of Cities with the Largest Indian (Asian) Community in Missouri
0
4,000
Cities with the Largest Indian (Asian) Community in Missouri
| City | Indian (Asian) | vs State | vs National | |
| 1. | Columbia | 3,426 | 33,796(10.14%)#1 | 5,326,595(0.06%)#196 |
| 2. | Kansas City | 2,854 | 33,796(8.44%)#2 | 5,326,595(0.05%)#240 |
| 3. | St Louis | 2,791 | 33,796(8.26%)#3 | 5,326,595(0.05%)#248 |
| 4. | Chesterfield | 1,779 | 33,796(5.26%)#4 | 5,326,595(0.03%)#390 |
| 5. | University City | 1,704 | 33,796(5.04%)#5 | 5,326,595(0.03%)#407 |
| 6. | Springfield | 1,187 | 33,796(3.51%)#6 | 5,326,595(0.02%)#561 |
| 7. | Clayton | 989 | 33,796(2.93%)#7 | 5,326,595(0.02%)#657 |
| 8. | Olivette | 955 | 33,796(2.83%)#8 | 5,326,595(0.02%)#669 |
| 9. | Creve Coeur | 827 | 33,796(2.45%)#9 | 5,326,595(0.02%)#734 |
| 10. | Rolla | 781 | 33,796(2.31%)#10 | 5,326,595(0.01%)#764 |
| 11. | St Charles | 597 | 33,796(1.77%)#11 | 5,326,595(0.01%)#955 |
| 12. | Wildwood | 495 | 33,796(1.46%)#12 | 5,326,595(0.01%)#1,116 |
| 13. | St Peters | 492 | 33,796(1.46%)#13 | 5,326,595(0.01%)#1,124 |
| 14. | Cape Girardeau | 428 | 33,796(1.27%)#14 | 5,326,595(0.01%)#1,241 |
| 15. | O Fallon | 406 | 33,796(1.20%)#15 | 5,326,595(0.01%)#1,290 |
| 16. | St Joseph | 378 | 33,796(1.12%)#16 | 5,326,595(0.01%)#1,370 |
| 17. | Lee S Summit | 369 | 33,796(1.09%)#17 | 5,326,595(0.01%)#1,395 |
| 18. | Ballwin | 367 | 33,796(1.09%)#18 | 5,326,595(0.01%)#1,407 |
| 19. | Town And Country | 294 | 33,796(0.87%)#19 | 5,326,595(0.01%)#1,642 |
| 20. | Kirkwood | 286 | 33,796(0.85%)#20 | 5,326,595(0.01%)#1,683 |
| 21. | Manchester | 264 | 33,796(0.78%)#21 | 5,326,595(0.00%)#1,775 |
| 22. | Frontenac | 252 | 33,796(0.75%)#22 | 5,326,595(0.00%)#1,842 |
| 23. | Independence | 249 | 33,796(0.74%)#23 | 5,326,595(0.00%)#1,849 |
| 24. | Kearney | 225 | 33,796(0.67%)#24 | 5,326,595(0.00%)#1,981 |
| 25. | Maryland Heights | 222 | 33,796(0.66%)#25 | 5,326,595(0.00%)#1,997 |
| 26. | Richmond Heights | 204 | 33,796(0.60%)#26 | 5,326,595(0.00%)#2,106 |
| 27. | Overland | 197 | 33,796(0.58%)#27 | 5,326,595(0.00%)#2,147 |
| 28. | Oakville | 194 | 33,796(0.57%)#28 | 5,326,595(0.00%)#2,156 |
| 29. | Kirksville | 185 | 33,796(0.55%)#29 | 5,326,595(0.00%)#2,230 |
| 30. | Affton | 182 | 33,796(0.54%)#30 | 5,326,595(0.00%)#2,256 |
| 31. | Ellisville | 182 | 33,796(0.54%)#31 | 5,326,595(0.00%)#2,260 |
| 32. | Jennings | 169 | 33,796(0.50%)#32 | 5,326,595(0.00%)#2,368 |
| 33. | Grandview | 166 | 33,796(0.49%)#33 | 5,326,595(0.00%)#2,398 |
| 34. | Maplewood | 161 | 33,796(0.48%)#34 | 5,326,595(0.00%)#2,452 |
| 35. | Wentzville | 160 | 33,796(0.47%)#35 | 5,326,595(0.00%)#2,459 |
| 36. | St Ann | 155 | 33,796(0.46%)#36 | 5,326,595(0.00%)#2,510 |
| 37. | Brentwood | 153 | 33,796(0.45%)#37 | 5,326,595(0.00%)#2,536 |
| 38. | Hazelwood | 134 | 33,796(0.40%)#38 | 5,326,595(0.00%)#2,716 |
| 39. | Ladue | 134 | 33,796(0.40%)#39 | 5,326,595(0.00%)#2,722 |
| 40. | Webster Groves | 130 | 33,796(0.38%)#40 | 5,326,595(0.00%)#2,760 |
| 41. | Joplin | 124 | 33,796(0.37%)#41 | 5,326,595(0.00%)#2,831 |
| 42. | Republic | 122 | 33,796(0.36%)#42 | 5,326,595(0.00%)#2,862 |
| 43. | Arnold | 106 | 33,796(0.31%)#43 | 5,326,595(0.00%)#3,071 |
| 44. | Liberty | 104 | 33,796(0.31%)#44 | 5,326,595(0.00%)#3,108 |
| 45. | Concord | 104 | 33,796(0.31%)#45 | 5,326,595(0.00%)#3,114 |
| 46. | Marshall | 102 | 33,796(0.30%)#46 | 5,326,595(0.00%)#3,157 |
| 47. | Branson | 98 | 33,796(0.29%)#47 | 5,326,595(0.00%)#3,225 |
| 48. | Crestwood | 93 | 33,796(0.28%)#48 | 5,326,595(0.00%)#3,310 |
| 49. | Macon | 93 | 33,796(0.28%)#49 | 5,326,595(0.00%)#3,317 |
| 50. | Ste Genevieve | 93 | 33,796(0.28%)#50 | 5,326,595(0.00%)#3,318 |
| 51. | Fort Leonard Wood | 87 | 33,796(0.26%)#51 | 5,326,595(0.00%)#3,409 |
| 52. | Pevely | 82 | 33,796(0.24%)#52 | 5,326,595(0.00%)#3,512 |
| 53. | Blue Springs | 79 | 33,796(0.23%)#53 | 5,326,595(0.00%)#3,556 |
| 54. | Lebanon | 78 | 33,796(0.23%)#54 | 5,326,595(0.00%)#3,584 |
| 55. | Bridgeton | 75 | 33,796(0.22%)#55 | 5,326,595(0.00%)#3,638 |
| 56. | Eldon | 71 | 33,796(0.21%)#56 | 5,326,595(0.00%)#3,739 |
| 57. | Green Park | 69 | 33,796(0.20%)#57 | 5,326,595(0.00%)#3,790 |
| 58. | Old Jamestown | 68 | 33,796(0.20%)#58 | 5,326,595(0.00%)#3,795 |
| 59. | Sunset Hills | 67 | 33,796(0.20%)#59 | 5,326,595(0.00%)#3,817 |
| 60. | Mehlville | 66 | 33,796(0.20%)#60 | 5,326,595(0.00%)#3,829 |
| 61. | Raytown | 64 | 33,796(0.19%)#61 | 5,326,595(0.00%)#3,886 |
| 62. | Jefferson City | 58 | 33,796(0.17%)#62 | 5,326,595(0.00%)#4,033 |
| 63. | Hannibal | 57 | 33,796(0.17%)#63 | 5,326,595(0.00%)#4,065 |
| 64. | Shrewsbury | 54 | 33,796(0.16%)#64 | 5,326,595(0.00%)#4,156 |
| 65. | Gladstone | 52 | 33,796(0.15%)#65 | 5,326,595(0.00%)#4,191 |
| 66. | Sedalia | 52 | 33,796(0.15%)#66 | 5,326,595(0.00%)#4,194 |
| 67. | Normandy | 52 | 33,796(0.15%)#67 | 5,326,595(0.00%)#4,213 |
| 68. | Glendale | 51 | 33,796(0.15%)#68 | 5,326,595(0.00%)#4,254 |
| 69. | Vandalia | 50 | 33,796(0.15%)#69 | 5,326,595(0.00%)#4,287 |
| 70. | Slater | 47 | 33,796(0.14%)#70 | 5,326,595(0.00%)#4,395 |
| 71. | Dardenne Prairie | 45 | 33,796(0.13%)#71 | 5,326,595(0.00%)#4,435 |
| 72. | Moberly | 44 | 33,796(0.13%)#72 | 5,326,595(0.00%)#4,477 |
| 73. | St Clair | 44 | 33,796(0.13%)#73 | 5,326,595(0.00%)#4,493 |
| 74. | Trenton | 43 | 33,796(0.13%)#74 | 5,326,595(0.00%)#4,529 |
| 75. | Piedmont | 43 | 33,796(0.13%)#75 | 5,326,595(0.00%)#4,538 |
| 76. | Warrensburg | 40 | 33,796(0.12%)#76 | 5,326,595(0.00%)#4,638 |
| 77. | Jackson | 40 | 33,796(0.12%)#77 | 5,326,595(0.00%)#4,644 |
| 78. | Monroe City | 40 | 33,796(0.12%)#78 | 5,326,595(0.00%)#4,663 |
| 79. | Grain Valley | 39 | 33,796(0.12%)#79 | 5,326,595(0.00%)#4,689 |
| 80. | St James | 39 | 33,796(0.12%)#80 | 5,326,595(0.00%)#4,712 |
| 81. | Florissant | 38 | 33,796(0.11%)#81 | 5,326,595(0.00%)#4,728 |
| 82. | Nixa | 38 | 33,796(0.11%)#82 | 5,326,595(0.00%)#4,734 |
| 83. | Eureka | 36 | 33,796(0.11%)#83 | 5,326,595(0.00%)#4,829 |
| 84. | Murphy | 36 | 33,796(0.11%)#84 | 5,326,595(0.00%)#4,839 |
| 85. | Fulton | 34 | 33,796(0.10%)#85 | 5,326,595(0.00%)#4,932 |
| 86. | Vinita Park | 32 | 33,796(0.09%)#86 | 5,326,595(0.00%)#5,084 |
| 87. | Carthage | 31 | 33,796(0.09%)#87 | 5,326,595(0.00%)#5,095 |
| 88. | Union | 30 | 33,796(0.09%)#88 | 5,326,595(0.00%)#5,171 |
| 89. | Boonville | 28 | 33,796(0.08%)#89 | 5,326,595(0.00%)#5,304 |
| 90. | Memphis | 28 | 33,796(0.08%)#90 | 5,326,595(0.00%)#5,332 |
| 91. | Maryville | 27 | 33,796(0.08%)#91 | 5,326,595(0.00%)#5,354 |
| 92. | Salem | 25 | 33,796(0.07%)#92 | 5,326,595(0.00%)#5,482 |
| 93. | Oronogo | 25 | 33,796(0.07%)#93 | 5,326,595(0.00%)#5,507 |
| 94. | Sycamore Hills | 24 | 33,796(0.07%)#94 | 5,326,595(0.00%)#5,593 |
| 95. | De Soto | 23 | 33,796(0.07%)#95 | 5,326,595(0.00%)#5,623 |
| 96. | Bolivar | 22 | 33,796(0.07%)#96 | 5,326,595(0.00%)#5,673 |
| 97. | Smithville | 20 | 33,796(0.06%)#97 | 5,326,595(0.00%)#5,788 |
| 98. | Rock Hill | 20 | 33,796(0.06%)#98 | 5,326,595(0.00%)#5,799 |
| 99. | Raymore | 19 | 33,796(0.06%)#99 | 5,326,595(0.00%)#5,844 |
| 100. | Higginsville | 19 | 33,796(0.06%)#100 | 5,326,595(0.00%)#5,885 |
Common Questions
What are the Top 10 Cities with the Largest Indian (Asian) Community in Missouri?
Top 10 Cities with the Largest Indian (Asian) Community in Missouri are:
#1
3,426
#2
2,854
#3
2,791
#4
1,779
#5
1,704
#6
1,187
#7
989
#8
955
#9
827
#10
781
What city has the Largest Indian (Asian) Community in Missouri?
Columbia has the Largest Indian (Asian) Community in Missouri with 3,426.
What is the Total Indian (Asian) Population in the State of Missouri?
Total Indian (Asian) Population in Missouri is 33,796.
What is the Total Indian (Asian) Population in the United States?
Total Indian (Asian) Population in the United States is 5,326,595.