Cities with the Largest Indian (Asian) Community in the United States
RELATED REPORTS & OPTIONS
Indian (Asian)
United States
Compare Cities
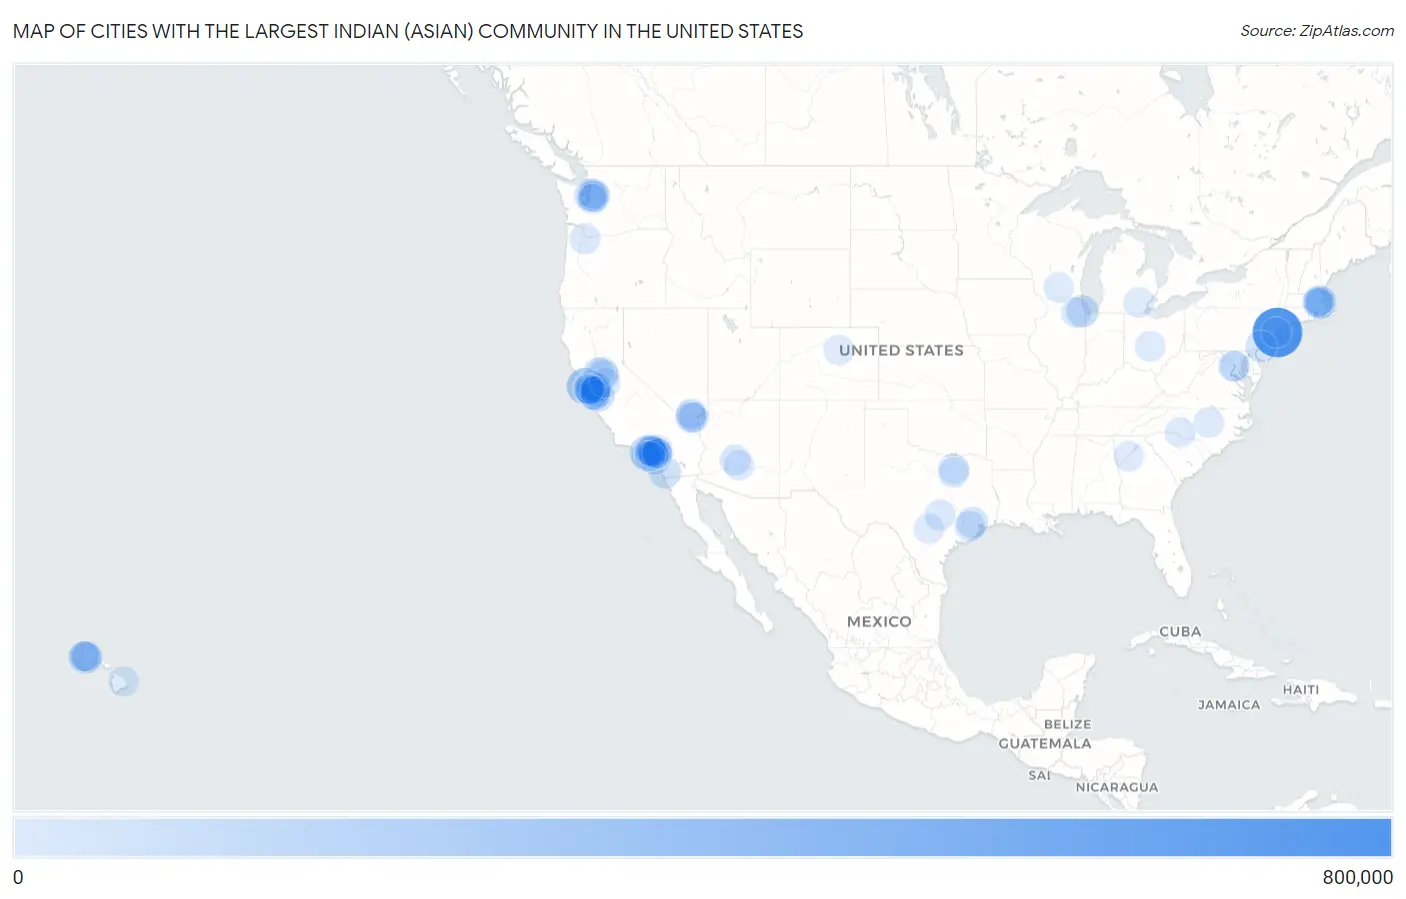
Map of Cities with the Largest Indian (Asian) Community in the United States
0
800,000
Cities with the Largest Indian (Asian) Community in the United States
| City | Indian (Asian) | vs State | vs National | |
| 1. | New York | 627,035 | 780,450(80.34%)#1 | 5,326,595(11.77%)#1 |
| 2. | San Francisco | 198,779 | 1,868,782(10.64%)#1 | 5,326,595(3.73%)#2 |
| 3. | San Jose | 100,490 | 1,868,782(5.38%)#2 | 5,326,595(1.89%)#3 |
| 4. | Los Angeles | 99,832 | 1,868,782(5.34%)#3 | 5,326,595(1.87%)#4 |
| 5. | Urban Honolulu | 70,036 | 220,416(31.77%)#1 | 5,326,595(1.31%)#5 |
| 6. | Chicago | 67,951 | 156,207(43.50%)#1 | 5,326,595(1.28%)#6 |
| 7. | San Diego | 56,616 | 1,868,782(3.03%)#4 | 5,326,595(1.06%)#7 |
| 8. | Irvine | 54,634 | 1,868,782(2.92%)#5 | 5,326,595(1.03%)#8 |
| 9. | Seattle | 52,457 | 203,902(25.73%)#1 | 5,326,595(0.98%)#9 |
| 10. | Philadelphia | 45,497 | 133,991(33.96%)#1 | 5,326,595(0.85%)#10 |
| 11. | Fremont | 42,142 | 1,868,782(2.26%)#6 | 5,326,595(0.79%)#11 |
| 12. | Houston | 39,858 | 270,337(14.74%)#1 | 5,326,595(0.75%)#12 |
| 13. | Oakland | 37,962 | 1,868,782(2.03%)#7 | 5,326,595(0.71%)#13 |
| 14. | Boston | 33,865 | 198,039(17.10%)#1 | 5,326,595(0.64%)#14 |
| 15. | Alhambra | 31,279 | 1,868,782(1.67%)#8 | 5,326,595(0.59%)#15 |
| 16. | Monterey Park | 28,830 | 1,868,782(1.54%)#9 | 5,326,595(0.54%)#16 |
| 17. | Sunnyvale | 28,597 | 1,868,782(1.53%)#10 | 5,326,595(0.54%)#17 |
| 18. | Sacramento | 27,925 | 1,868,782(1.49%)#11 | 5,326,595(0.52%)#18 |
| 19. | Daly City | 23,904 | 1,868,782(1.28%)#12 | 5,326,595(0.45%)#19 |
| 20. | Bellevue | 23,073 | 203,902(11.32%)#2 | 5,326,595(0.43%)#20 |
| 21. | Rosemead | 22,325 | 1,868,782(1.19%)#13 | 5,326,595(0.42%)#21 |
| 22. | Arcadia | 21,723 | 1,868,782(1.16%)#14 | 5,326,595(0.41%)#22 |
| 23. | Portland | 19,752 | 61,573(32.08%)#1 | 5,326,595(0.37%)#23 |
| 24. | Santa Clara | 19,445 | 1,868,782(1.04%)#15 | 5,326,595(0.37%)#24 |
| 25. | Austin | 19,263 | 270,337(7.13%)#2 | 5,326,595(0.36%)#25 |
| 26. | Quincy | 19,120 | 198,039(9.65%)#2 | 5,326,595(0.36%)#26 |
| 27. | El Monte | 19,033 | 1,868,782(1.02%)#16 | 5,326,595(0.36%)#27 |
| 28. | Rowland Heights | 18,070 | 1,868,782(0.97%)#17 | 5,326,595(0.34%)#28 |
| 29. | Cupertino | 17,859 | 1,868,782(0.96%)#18 | 5,326,595(0.34%)#29 |
| 30. | Diamond Bar | 17,686 | 1,868,782(0.95%)#19 | 5,326,595(0.33%)#30 |
| 31. | Temple City | 17,091 | 1,868,782(0.91%)#20 | 5,326,595(0.32%)#31 |
| 32. | San Gabriel | 17,020 | 1,868,782(0.91%)#21 | 5,326,595(0.32%)#32 |
| 33. | San Leandro | 16,197 | 1,868,782(0.87%)#22 | 5,326,595(0.30%)#33 |
| 34. | Hacienda Heights | 15,475 | 1,868,782(0.83%)#23 | 5,326,595(0.29%)#34 |
| 35. | Chino Hills | 15,221 | 1,868,782(0.81%)#24 | 5,326,595(0.29%)#35 |
| 36. | Elk Grove | 15,185 | 1,868,782(0.81%)#25 | 5,326,595(0.29%)#36 |
| 37. | Spring Valley | 15,128 | 58,942(25.67%)#1 | 5,326,595(0.28%)#37 |
| 38. | West Covina | 15,110 | 1,868,782(0.81%)#26 | 5,326,595(0.28%)#38 |
| 39. | Palo Alto | 14,573 | 1,868,782(0.78%)#27 | 5,326,595(0.27%)#39 |
| 40. | San Mateo | 14,566 | 1,868,782(0.78%)#28 | 5,326,595(0.27%)#40 |
| 41. | Plano | 13,684 | 270,337(5.06%)#3 | 5,326,595(0.26%)#41 |
| 42. | Milpitas | 13,456 | 1,868,782(0.72%)#29 | 5,326,595(0.25%)#42 |
| 43. | Mountain View | 13,425 | 1,868,782(0.72%)#30 | 5,326,595(0.25%)#43 |
| 44. | Berkeley | 13,293 | 1,868,782(0.71%)#31 | 5,326,595(0.25%)#44 |
| 45. | Castro Valley | 13,090 | 1,868,782(0.70%)#32 | 5,326,595(0.25%)#45 |
| 46. | San Ramon | 13,076 | 1,868,782(0.70%)#33 | 5,326,595(0.25%)#46 |
| 47. | Alameda | 12,817 | 1,868,782(0.69%)#34 | 5,326,595(0.24%)#47 |
| 48. | Hayward | 12,767 | 1,868,782(0.68%)#35 | 5,326,595(0.24%)#48 |
| 49. | Sugar Land | 12,352 | 270,337(4.57%)#4 | 5,326,595(0.23%)#49 |
| 50. | Phoenix | 12,250 | 62,390(19.63%)#1 | 5,326,595(0.23%)#50 |
| 51. | Jersey City | 11,967 | 178,489(6.70%)#1 | 5,326,595(0.22%)#51 |
| 52. | South San Francisco | 11,735 | 1,868,782(0.63%)#36 | 5,326,595(0.22%)#52 |
| 53. | Pasadena | 11,605 | 1,868,782(0.62%)#37 | 5,326,595(0.22%)#53 |
| 54. | Enterprise | 11,604 | 58,942(19.69%)#2 | 5,326,595(0.22%)#54 |
| 55. | Walnut | 11,461 | 1,868,782(0.61%)#38 | 5,326,595(0.22%)#55 |
| 56. | Columbus | 11,368 | 68,853(16.51%)#1 | 5,326,595(0.21%)#56 |
| 57. | East Honolulu | 11,300 | 220,416(5.13%)#2 | 5,326,595(0.21%)#57 |
| 58. | Dublin | 10,850 | 1,868,782(0.58%)#39 | 5,326,595(0.20%)#58 |
| 59. | Rancho Cucamonga | 10,727 | 1,868,782(0.57%)#40 | 5,326,595(0.20%)#59 |
| 60. | Malden | 10,703 | 198,039(5.40%)#3 | 5,326,595(0.20%)#60 |
| 61. | Cambridge | 10,399 | 198,039(5.25%)#4 | 5,326,595(0.20%)#61 |
| 62. | Union City | 10,356 | 1,868,782(0.55%)#41 | 5,326,595(0.19%)#62 |
| 63. | Dallas | 10,224 | 270,337(3.78%)#5 | 5,326,595(0.19%)#63 |
| 64. | Davis | 9,441 | 1,868,782(0.51%)#42 | 5,326,595(0.18%)#64 |
| 65. | Washington | 9,401 | 9,401(100.00%)#1 | 5,326,595(0.18%)#65 |
| 66. | Saratoga | 9,289 | 1,868,782(0.50%)#43 | 5,326,595(0.17%)#66 |
| 67. | Pleasanton | 9,246 | 1,868,782(0.49%)#44 | 5,326,595(0.17%)#67 |
| 68. | Las Vegas | 9,116 | 58,942(15.47%)#3 | 5,326,595(0.17%)#68 |
| 69. | East San Gabriel | 9,115 | 1,868,782(0.49%)#45 | 5,326,595(0.17%)#69 |
| 70. | Charlotte | 9,010 | 62,079(14.51%)#1 | 5,326,595(0.17%)#70 |
| 71. | Foster City | 8,903 | 1,868,782(0.48%)#46 | 5,326,595(0.17%)#71 |
| 72. | Ann Arbor | 8,877 | 68,398(12.98%)#1 | 5,326,595(0.17%)#72 |
| 73. | Hilo | 8,856 | 220,416(4.02%)#3 | 5,326,595(0.17%)#73 |
| 74. | Baldwin Park | 8,799 | 1,868,782(0.47%)#47 | 5,326,595(0.17%)#74 |
| 75. | Torrance | 8,776 | 1,868,782(0.47%)#48 | 5,326,595(0.16%)#75 |
| 76. | Sammamish | 8,679 | 203,902(4.26%)#3 | 5,326,595(0.16%)#76 |
| 77. | Redmond | 8,555 | 203,902(4.20%)#4 | 5,326,595(0.16%)#77 |
| 78. | Madison | 8,437 | 32,058(26.32%)#1 | 5,326,595(0.16%)#78 |
| 79. | Millbrae | 8,270 | 1,868,782(0.44%)#49 | 5,326,595(0.16%)#79 |
| 80. | San Antonio | 8,252 | 270,337(3.05%)#6 | 5,326,595(0.15%)#80 |
| 81. | Eastvale | 8,250 | 1,868,782(0.44%)#50 | 5,326,595(0.15%)#81 |
| 82. | Chandler | 8,190 | 62,390(13.13%)#2 | 5,326,595(0.15%)#82 |
| 83. | Newton | 8,103 | 198,039(4.09%)#5 | 5,326,595(0.15%)#83 |
| 84. | Renton | 7,999 | 203,902(3.92%)#5 | 5,326,595(0.15%)#84 |
| 85. | Chino | 7,925 | 1,868,782(0.42%)#51 | 5,326,595(0.15%)#85 |
| 86. | Denver | 7,826 | 49,363(15.85%)#1 | 5,326,595(0.15%)#86 |
| 87. | Stockton | 7,815 | 1,868,782(0.42%)#52 | 5,326,595(0.15%)#87 |
| 88. | Kaneohe | 7,759 | 220,416(3.52%)#4 | 5,326,595(0.15%)#88 |
| 89. | Atlanta | 7,479 | 80,468(9.29%)#1 | 5,326,595(0.14%)#89 |
| 90. | Cary | 7,432 | 62,079(11.97%)#2 | 5,326,595(0.14%)#90 |
| 91. | Anaheim | 7,409 | 1,868,782(0.40%)#53 | 5,326,595(0.14%)#91 |
| 92. | Pearl City | 7,404 | 220,416(3.36%)#5 | 5,326,595(0.14%)#92 |
| 93. | Long Beach | 7,359 | 1,868,782(0.39%)#54 | 5,326,595(0.14%)#93 |
| 94. | Redwood City | 7,118 | 1,868,782(0.38%)#55 | 5,326,595(0.13%)#94 |
| 95. | Henderson | 7,095 | 58,942(12.04%)#4 | 5,326,595(0.13%)#95 |
| 96. | San Bruno | 6,961 | 1,868,782(0.37%)#56 | 5,326,595(0.13%)#96 |
| 97. | Naperville | 6,932 | 156,207(4.44%)#2 | 5,326,595(0.13%)#97 |
| 98. | Newark | 6,932 | 1,868,782(0.37%)#57 | 5,326,595(0.13%)#98 |
| 99. | Kailua Cdp Honolulu County | 6,921 | 220,416(3.14%)#6 | 5,326,595(0.13%)#99 |
| 100. | Arlington | 6,858 | 96,879(7.08%)#1 | 5,326,595(0.13%)#100 |
Common Questions
What are the Top 10 Cities with the Largest Indian (Asian) Community in the United States?
Top 10 Cities with the Largest Indian (Asian) Community in the United States are:
#1
627,035
#2
198,779
#3
100,490
#4
99,832
#5
70,036
#6
67,951
#7
56,616
#8
54,634
#9
52,457
#10
45,497
What city has the Largest Indian (Asian) Community in the United States?
New York has the Largest Indian (Asian) Community in the United States with 627,035.
What is the Total Indian (Asian) Population in the United States?
Total Indian (Asian) Population in the United States is 5,326,595.