Cities with the Largest Indian (Asian) Community in South Carolina
RELATED REPORTS & OPTIONS
Indian (Asian)
South Carolina
Compare Cities
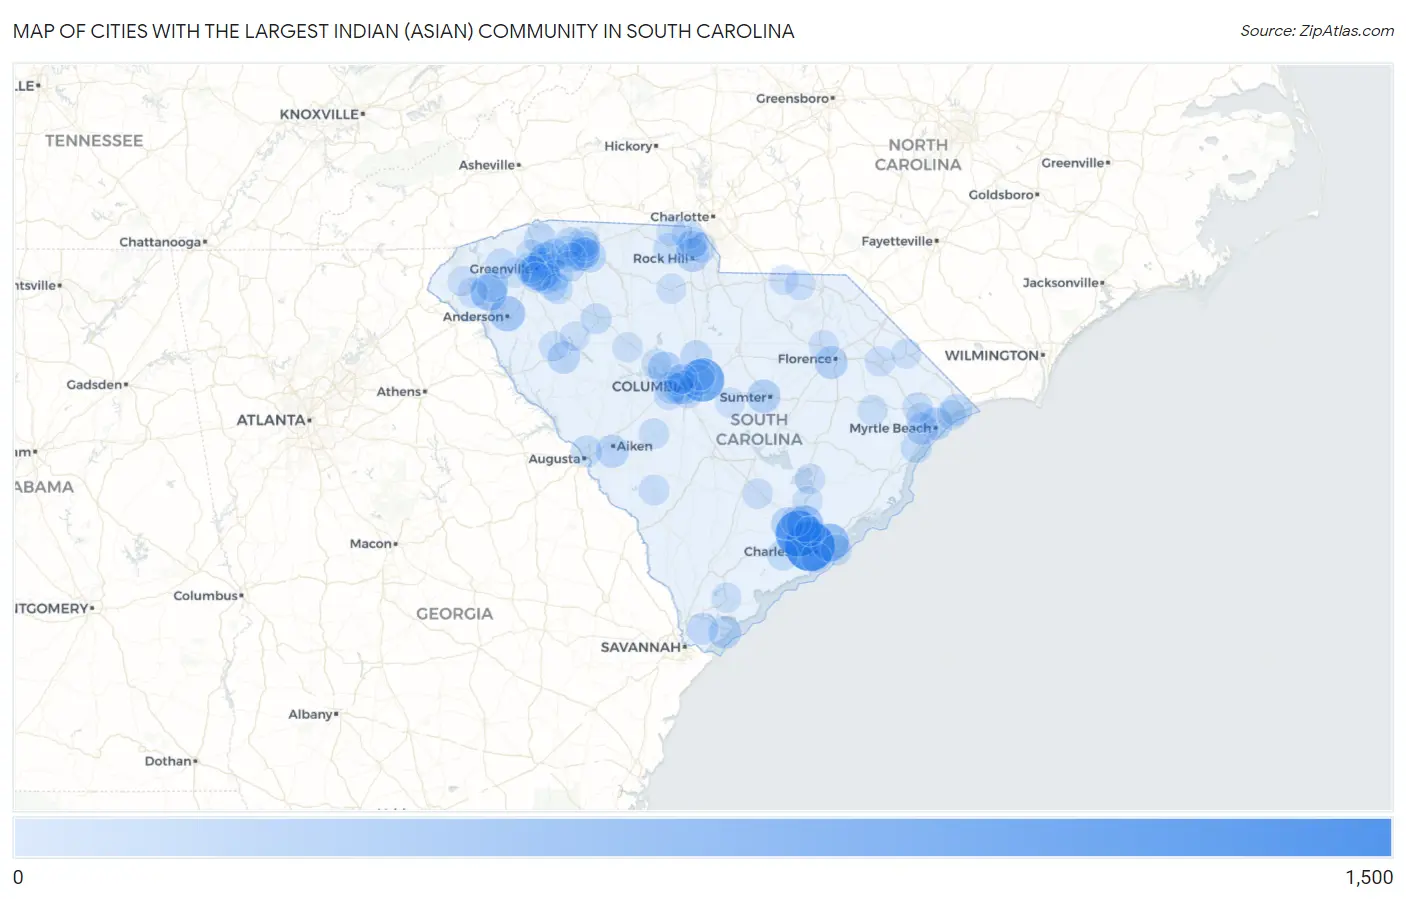
Map of Cities with the Largest Indian (Asian) Community in South Carolina
0
1,500
Cities with the Largest Indian (Asian) Community in South Carolina
| City | Indian (Asian) | vs State | vs National | |
| 1. | Charleston | 1,297 | 18,586(6.98%)#1 | 5,326,595(0.02%)#523 |
| 2. | North Charleston | 1,065 | 18,586(5.73%)#2 | 5,326,595(0.02%)#622 |
| 3. | Columbia | 886 | 18,586(4.77%)#3 | 5,326,595(0.02%)#700 |
| 4. | Greenville | 573 | 18,586(3.08%)#4 | 5,326,595(0.01%)#987 |
| 5. | Mount Pleasant | 512 | 18,586(2.75%)#5 | 5,326,595(0.01%)#1,081 |
| 6. | Goose Creek | 429 | 18,586(2.31%)#6 | 5,326,595(0.01%)#1,240 |
| 7. | Clemson | 402 | 18,586(2.16%)#7 | 5,326,595(0.01%)#1,303 |
| 8. | Anderson | 340 | 18,586(1.83%)#8 | 5,326,595(0.01%)#1,480 |
| 9. | Taylors | 328 | 18,586(1.76%)#9 | 5,326,595(0.01%)#1,516 |
| 10. | Lake Murray Of Richland | 264 | 18,586(1.42%)#10 | 5,326,595(0.00%)#1,777 |
| 11. | Arcadia | 230 | 18,586(1.24%)#11 | 5,326,595(0.00%)#1,956 |
| 12. | Rock Hill | 222 | 18,586(1.19%)#12 | 5,326,595(0.00%)#1,995 |
| 13. | West Columbia | 215 | 18,586(1.16%)#13 | 5,326,595(0.00%)#2,036 |
| 14. | Sumter | 208 | 18,586(1.12%)#14 | 5,326,595(0.00%)#2,075 |
| 15. | Florence | 187 | 18,586(1.01%)#15 | 5,326,595(0.00%)#2,215 |
| 16. | Summerville | 181 | 18,586(0.97%)#16 | 5,326,595(0.00%)#2,267 |
| 17. | Aiken | 173 | 18,586(0.93%)#17 | 5,326,595(0.00%)#2,333 |
| 18. | Lexington | 153 | 18,586(0.82%)#18 | 5,326,595(0.00%)#2,532 |
| 19. | Myrtle Beach | 152 | 18,586(0.82%)#19 | 5,326,595(0.00%)#2,542 |
| 20. | Wade Hampton | 152 | 18,586(0.82%)#20 | 5,326,595(0.00%)#2,543 |
| 21. | Hilton Head Island | 150 | 18,586(0.81%)#21 | 5,326,595(0.00%)#2,556 |
| 22. | Spartanburg | 145 | 18,586(0.78%)#22 | 5,326,595(0.00%)#2,607 |
| 23. | Greenwood | 143 | 18,586(0.77%)#23 | 5,326,595(0.00%)#2,626 |
| 24. | Greer | 142 | 18,586(0.76%)#24 | 5,326,595(0.00%)#2,631 |
| 25. | Socastee | 141 | 18,586(0.76%)#25 | 5,326,595(0.00%)#2,645 |
| 26. | Central | 123 | 18,586(0.66%)#26 | 5,326,595(0.00%)#2,852 |
| 27. | North Myrtle Beach | 119 | 18,586(0.64%)#27 | 5,326,595(0.00%)#2,895 |
| 28. | Fairforest | 119 | 18,586(0.64%)#28 | 5,326,595(0.00%)#2,907 |
| 29. | Tigerville | 113 | 18,586(0.61%)#29 | 5,326,595(0.00%)#2,983 |
| 30. | Blythewood | 110 | 18,586(0.59%)#30 | 5,326,595(0.00%)#3,024 |
| 31. | Cayce | 105 | 18,586(0.56%)#31 | 5,326,595(0.00%)#3,092 |
| 32. | Arthurtown | 105 | 18,586(0.56%)#32 | 5,326,595(0.00%)#3,104 |
| 33. | Bluffton | 104 | 18,586(0.56%)#33 | 5,326,595(0.00%)#3,109 |
| 34. | North Augusta | 88 | 18,586(0.47%)#34 | 5,326,595(0.00%)#3,389 |
| 35. | Lake Wylie | 87 | 18,586(0.47%)#35 | 5,326,595(0.00%)#3,411 |
| 36. | Boiling Springs | 87 | 18,586(0.47%)#36 | 5,326,595(0.00%)#3,412 |
| 37. | Five Forks | 78 | 18,586(0.42%)#37 | 5,326,595(0.00%)#3,580 |
| 38. | Forest Acres | 77 | 18,586(0.41%)#38 | 5,326,595(0.00%)#3,604 |
| 39. | Travelers Rest | 73 | 18,586(0.39%)#39 | 5,326,595(0.00%)#3,694 |
| 40. | Murrells Inlet | 72 | 18,586(0.39%)#40 | 5,326,595(0.00%)#3,717 |
| 41. | Dentsville | 69 | 18,586(0.37%)#41 | 5,326,595(0.00%)#3,769 |
| 42. | Clinton | 63 | 18,586(0.34%)#42 | 5,326,595(0.00%)#3,919 |
| 43. | York | 62 | 18,586(0.33%)#43 | 5,326,595(0.00%)#3,941 |
| 44. | Isle Of Palms | 61 | 18,586(0.33%)#44 | 5,326,595(0.00%)#3,981 |
| 45. | Simpsonville | 58 | 18,586(0.31%)#45 | 5,326,595(0.00%)#4,034 |
| 46. | Pickens | 58 | 18,586(0.31%)#46 | 5,326,595(0.00%)#4,046 |
| 47. | Mauldin | 56 | 18,586(0.30%)#47 | 5,326,595(0.00%)#4,094 |
| 48. | Oak Grove | 56 | 18,586(0.30%)#48 | 5,326,595(0.00%)#4,099 |
| 49. | Lyman | 56 | 18,586(0.30%)#49 | 5,326,595(0.00%)#4,103 |
| 50. | Inman Mills | 56 | 18,586(0.30%)#50 | 5,326,595(0.00%)#4,117 |
| 51. | Hollywood | 55 | 18,586(0.30%)#51 | 5,326,595(0.00%)#4,132 |
| 52. | Wagener | 54 | 18,586(0.29%)#52 | 5,326,595(0.00%)#4,166 |
| 53. | Fountain Inn | 45 | 18,586(0.24%)#53 | 5,326,595(0.00%)#4,437 |
| 54. | Barnwell | 45 | 18,586(0.24%)#54 | 5,326,595(0.00%)#4,451 |
| 55. | Parker | 41 | 18,586(0.22%)#55 | 5,326,595(0.00%)#4,604 |
| 56. | India Hook | 39 | 18,586(0.21%)#56 | 5,326,595(0.00%)#4,711 |
| 57. | Judson | 38 | 18,586(0.20%)#57 | 5,326,595(0.00%)#4,762 |
| 58. | Baxter | 35 | 18,586(0.19%)#58 | 5,326,595(0.00%)#4,888 |
| 59. | Carolina Forest | 34 | 18,586(0.18%)#59 | 5,326,595(0.00%)#4,924 |
| 60. | Reidville | 34 | 18,586(0.18%)#60 | 5,326,595(0.00%)#4,963 |
| 61. | Seven Oaks | 32 | 18,586(0.17%)#61 | 5,326,595(0.00%)#5,038 |
| 62. | Seneca | 30 | 18,586(0.16%)#62 | 5,326,595(0.00%)#5,173 |
| 63. | Saxon | 29 | 18,586(0.16%)#63 | 5,326,595(0.00%)#5,257 |
| 64. | Harleyville | 28 | 18,586(0.15%)#64 | 5,326,595(0.00%)#5,340 |
| 65. | Valley Falls | 27 | 18,586(0.15%)#65 | 5,326,595(0.00%)#5,365 |
| 66. | Johnsonville | 26 | 18,586(0.14%)#66 | 5,326,595(0.00%)#5,446 |
| 67. | James Island | 25 | 18,586(0.13%)#67 | 5,326,595(0.00%)#5,462 |
| 68. | Red Bank | 23 | 18,586(0.12%)#68 | 5,326,595(0.00%)#5,609 |
| 69. | Marion | 23 | 18,586(0.12%)#69 | 5,326,595(0.00%)#5,625 |
| 70. | Bonneau Beach | 21 | 18,586(0.11%)#70 | 5,326,595(0.00%)#5,762 |
| 71. | Conway | 20 | 18,586(0.11%)#71 | 5,326,595(0.00%)#5,778 |
| 72. | St Andrews | 20 | 18,586(0.11%)#72 | 5,326,595(0.00%)#5,779 |
| 73. | Fort Mill | 19 | 18,586(0.10%)#73 | 5,326,595(0.00%)#5,842 |
| 74. | Capitol View | 18 | 18,586(0.10%)#74 | 5,326,595(0.00%)#5,977 |
| 75. | Red Hill | 16 | 18,586(0.09%)#75 | 5,326,595(0.00%)#6,116 |
| 76. | Ladson | 16 | 18,586(0.09%)#76 | 5,326,595(0.00%)#6,118 |
| 77. | Gantt | 14 | 18,586(0.08%)#77 | 5,326,595(0.00%)#6,313 |
| 78. | Tega Cay | 14 | 18,586(0.08%)#78 | 5,326,595(0.00%)#6,317 |
| 79. | Chesterfield | 13 | 18,586(0.07%)#79 | 5,326,595(0.00%)#6,511 |
| 80. | Clover | 11 | 18,586(0.06%)#80 | 5,326,595(0.00%)#6,655 |
| 81. | Darlington | 11 | 18,586(0.06%)#81 | 5,326,595(0.00%)#6,660 |
| 82. | Keowee Key | 11 | 18,586(0.06%)#82 | 5,326,595(0.00%)#6,687 |
| 83. | Unity | 11 | 18,586(0.06%)#83 | 5,326,595(0.00%)#6,733 |
| 84. | Startex | 11 | 18,586(0.06%)#84 | 5,326,595(0.00%)#6,736 |
| 85. | West Union | 11 | 18,586(0.06%)#85 | 5,326,595(0.00%)#6,739 |
| 86. | Chapin | 10 | 18,586(0.05%)#86 | 5,326,595(0.00%)#6,851 |
| 87. | Beaufort | 8 | 18,586(0.04%)#87 | 5,326,595(0.00%)#7,044 |
| 88. | Moncks Corner | 8 | 18,586(0.04%)#88 | 5,326,595(0.00%)#7,045 |
| 89. | Newberry | 8 | 18,586(0.04%)#89 | 5,326,595(0.00%)#7,047 |
| 90. | Chester | 8 | 18,586(0.04%)#90 | 5,326,595(0.00%)#7,064 |
| 91. | Sandy Springs | 8 | 18,586(0.04%)#91 | 5,326,595(0.00%)#7,141 |
| 92. | Eastover | 6 | 18,586(0.03%)#92 | 5,326,595(0.00%)#7,486 |
| 93. | Briarcliffe Acres | 6 | 18,586(0.03%)#93 | 5,326,595(0.00%)#7,489 |
| 94. | Fripp Island | 5 | 18,586(0.03%)#94 | 5,326,595(0.00%)#7,642 |
| 95. | Easley | 4 | 18,586(0.02%)#95 | 5,326,595(0.00%)#7,687 |
| 96. | Waterloo | 4 | 18,586(0.02%)#96 | 5,326,595(0.00%)#7,855 |
| 97. | Nichols | 4 | 18,586(0.02%)#97 | 5,326,595(0.00%)#7,868 |
| 98. | Hodges | 3 | 18,586(0.02%)#98 | 5,326,595(0.00%)#8,077 |
| 99. | Mount Croghan | 2 | 18,586(0.01%)#99 | 5,326,595(0.00%)#8,291 |
| 100. | Hanahan | 1 | 18,586(0.01%)#100 | 5,326,595(0.00%)#8,312 |
Common Questions
What are the Top 10 Cities with the Largest Indian (Asian) Community in South Carolina?
Top 10 Cities with the Largest Indian (Asian) Community in South Carolina are:
#1
1,297
#2
1,065
#3
886
#4
573
#5
512
#6
429
#7
402
#8
340
#9
328
#10
264
What city has the Largest Indian (Asian) Community in South Carolina?
Charleston has the Largest Indian (Asian) Community in South Carolina with 1,297.
What is the Total Indian (Asian) Population in the State of South Carolina?
Total Indian (Asian) Population in South Carolina is 18,586.
What is the Total Indian (Asian) Population in the United States?
Total Indian (Asian) Population in the United States is 5,326,595.