Zip Codes with the Highest Percentage of Population Employed in Arts, Media & Entertainment in Plainfield, IL
RELATED REPORTS & OPTIONS
Arts, Media & Entertainment
Plainfield
Compare Zip Codes
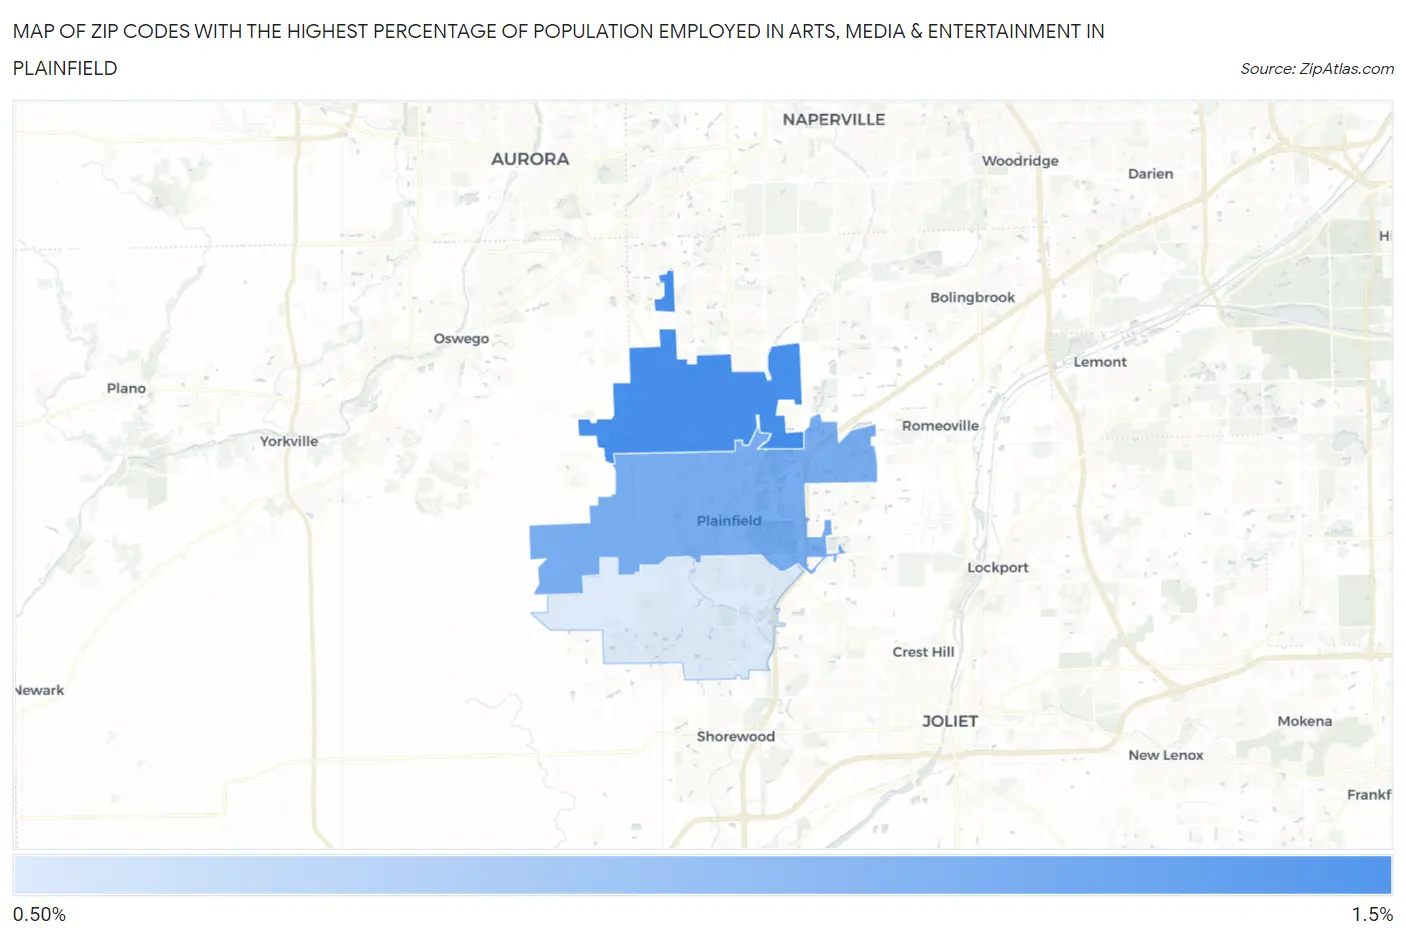
Map of Zip Codes with the Highest Percentage of Population Employed in Arts, Media & Entertainment in Plainfield
1.1%
1.4%
Zip Codes with the Highest Percentage of Population Employed in Arts, Media & Entertainment in Plainfield, IL
| Zip Code | % Employed | vs State | vs National | |
| 1. | 60585 | 1.4% | 1.9%(-0.490)#416 | 2.1%(-0.632)#11,500 |
| 2. | 60544 | 1.3% | 1.9%(-0.612)#458 | 2.1%(-0.754)#12,403 |
| 3. | 60586 | 1.1% | 1.9%(-0.866)#554 | 2.1%(-1.01)#14,380 |
1
Common Questions
What are the Top Zip Codes with the Highest Percentage of Population Employed in Arts, Media & Entertainment in Plainfield, IL?
Top Zip Codes with the Highest Percentage of Population Employed in Arts, Media & Entertainment in Plainfield, IL are:
What zip code has the Highest Percentage of Population Employed in Arts, Media & Entertainment in Plainfield, IL?
60585 has the Highest Percentage of Population Employed in Arts, Media & Entertainment in Plainfield, IL with 1.4%.
What is the Percentage of Population Employed in Arts, Media & Entertainment in Plainfield, IL?
Percentage of Population Employed in Arts, Media & Entertainment in Plainfield is 1.4%.
What is the Percentage of Population Employed in Arts, Media & Entertainment in Illinois?
Percentage of Population Employed in Arts, Media & Entertainment in Illinois is 1.9%.
What is the Percentage of Population Employed in Arts, Media & Entertainment in the United States?
Percentage of Population Employed in Arts, Media & Entertainment in the United States is 2.1%.