Zip Codes with the Highest Percentage of Population Employed in Arts, Media & Entertainment in Bolingbrook, IL
RELATED REPORTS & OPTIONS
Arts, Media & Entertainment
Bolingbrook
Compare Zip Codes
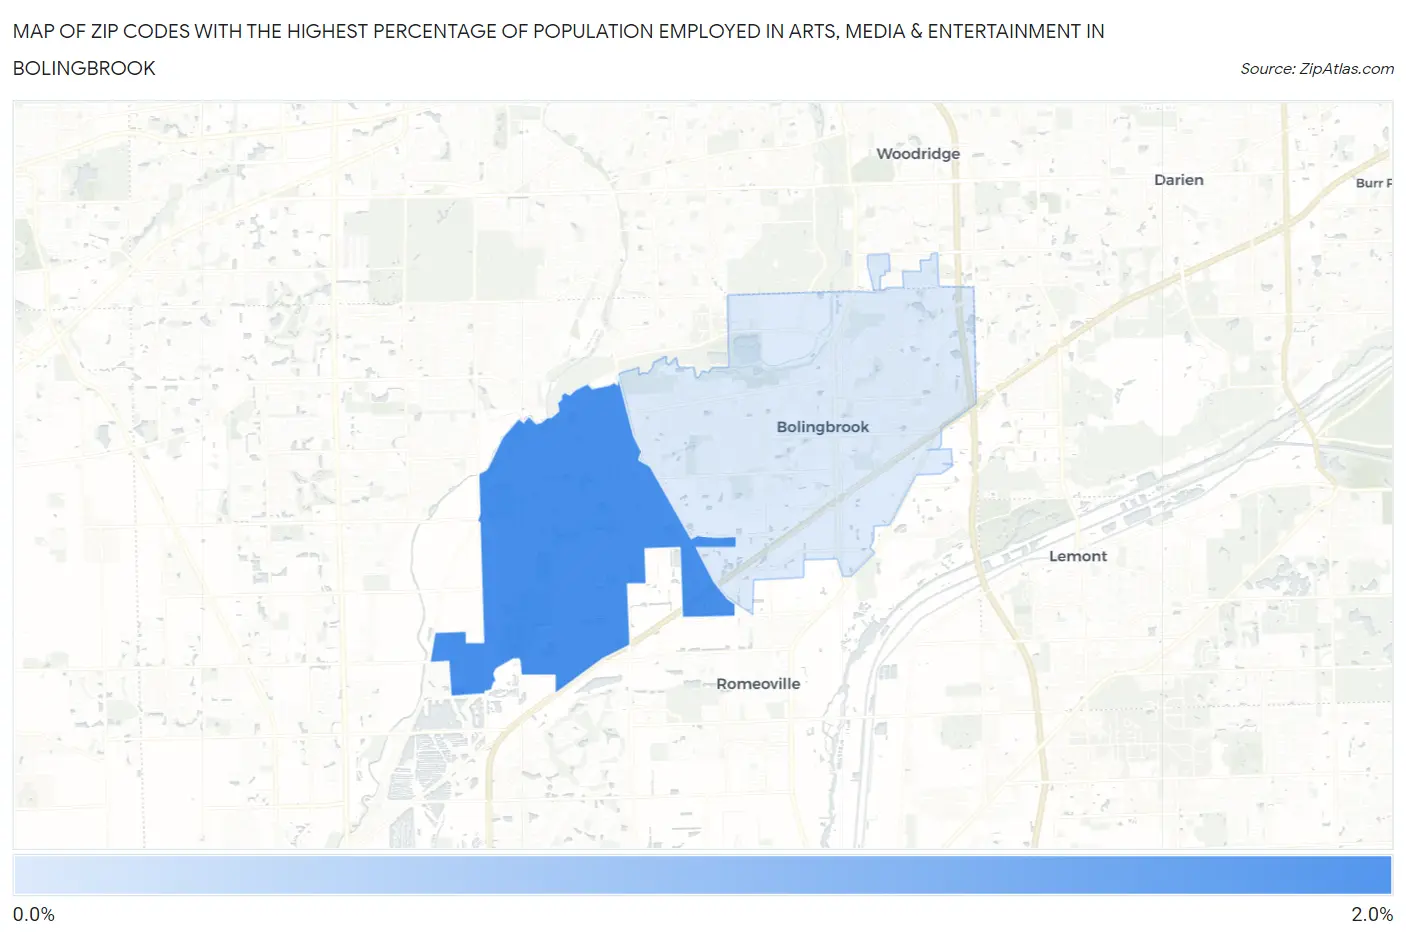
Map of Zip Codes with the Highest Percentage of Population Employed in Arts, Media & Entertainment in Bolingbrook
0.80%
1.5%
Zip Codes with the Highest Percentage of Population Employed in Arts, Media & Entertainment in Bolingbrook, IL
| Zip Code | % Employed | vs State | vs National | |
| 1. | 60490 | 1.5% | 1.9%(-0.418)#398 | 2.1%(-0.560)#10,978 |
| 2. | 60440 | 0.80% | 1.9%(-1.12)#646 | 2.1%(-1.26)#16,404 |
1
Common Questions
What are the Top Zip Codes with the Highest Percentage of Population Employed in Arts, Media & Entertainment in Bolingbrook, IL?
Top Zip Codes with the Highest Percentage of Population Employed in Arts, Media & Entertainment in Bolingbrook, IL are:
What zip code has the Highest Percentage of Population Employed in Arts, Media & Entertainment in Bolingbrook, IL?
60490 has the Highest Percentage of Population Employed in Arts, Media & Entertainment in Bolingbrook, IL with 1.5%.
What is the Percentage of Population Employed in Arts, Media & Entertainment in Bolingbrook, IL?
Percentage of Population Employed in Arts, Media & Entertainment in Bolingbrook is 1.0%.
What is the Percentage of Population Employed in Arts, Media & Entertainment in Illinois?
Percentage of Population Employed in Arts, Media & Entertainment in Illinois is 1.9%.
What is the Percentage of Population Employed in Arts, Media & Entertainment in the United States?
Percentage of Population Employed in Arts, Media & Entertainment in the United States is 2.1%.