Zip Codes with the Highest Percentage of Population Employed in Arts, Media & Entertainment in Arlington Heights, IL
RELATED REPORTS & OPTIONS
Arts, Media & Entertainment
Arlington Heights
Compare Zip Codes
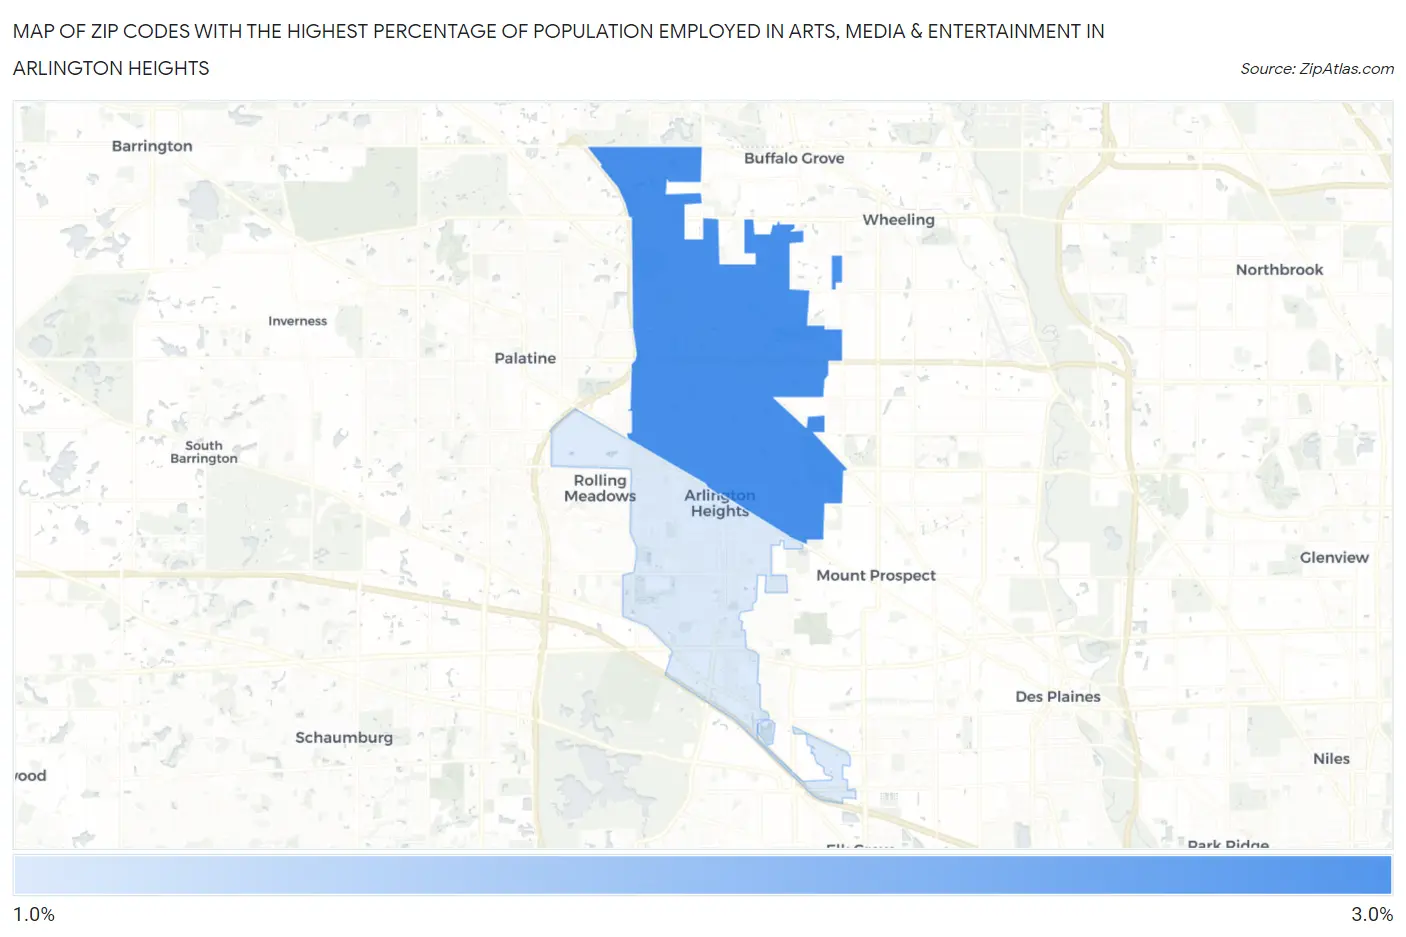
Map of Zip Codes with the Highest Percentage of Population Employed in Arts, Media & Entertainment in Arlington Heights
2.0%
2.5%
Zip Codes with the Highest Percentage of Population Employed in Arts, Media & Entertainment in Arlington Heights, IL
| Zip Code | % Employed | vs State | vs National | |
| 1. | 60004 | 2.5% | 1.9%(+0.604)#164 | 2.1%(+0.462)#5,481 |
| 2. | 60005 | 2.0% | 1.9%(+0.046)#269 | 2.1%(-0.096)#8,001 |
1
Common Questions
What are the Top Zip Codes with the Highest Percentage of Population Employed in Arts, Media & Entertainment in Arlington Heights, IL?
Top Zip Codes with the Highest Percentage of Population Employed in Arts, Media & Entertainment in Arlington Heights, IL are:
What zip code has the Highest Percentage of Population Employed in Arts, Media & Entertainment in Arlington Heights, IL?
60004 has the Highest Percentage of Population Employed in Arts, Media & Entertainment in Arlington Heights, IL with 2.5%.
What is the Percentage of Population Employed in Arts, Media & Entertainment in Arlington Heights, IL?
Percentage of Population Employed in Arts, Media & Entertainment in Arlington Heights is 2.5%.
What is the Percentage of Population Employed in Arts, Media & Entertainment in Illinois?
Percentage of Population Employed in Arts, Media & Entertainment in Illinois is 1.9%.
What is the Percentage of Population Employed in Arts, Media & Entertainment in the United States?
Percentage of Population Employed in Arts, Media & Entertainment in the United States is 2.1%.