Zip Codes with the Highest Percentage of Population Employed in Arts, Media & Entertainment in Wheaton, IL
RELATED REPORTS & OPTIONS
Arts, Media & Entertainment
Wheaton
Compare Zip Codes
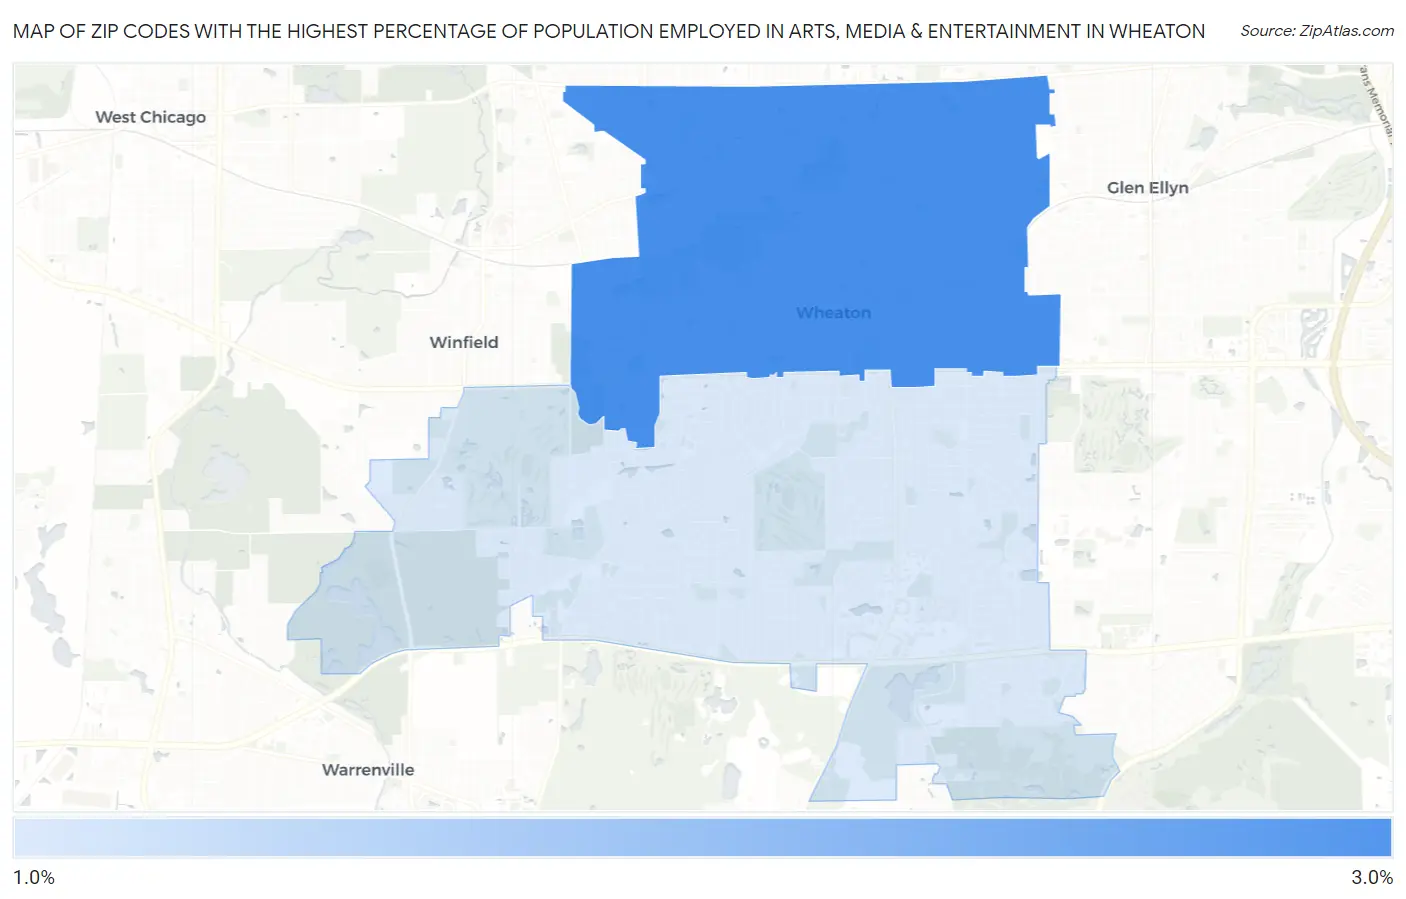
Map of Zip Codes with the Highest Percentage of Population Employed in Arts, Media & Entertainment in Wheaton
1.3%
2.7%
Zip Codes with the Highest Percentage of Population Employed in Arts, Media & Entertainment in Wheaton, IL
| Zip Code | % Employed | vs State | vs National | |
| 1. | 60187 | 2.7% | 1.9%(+0.785)#146 | 2.1%(+0.643)#4,890 |
| 2. | 60189 | 1.3% | 1.9%(-0.654)#473 | 2.1%(-0.796)#12,721 |
1
Common Questions
What are the Top Zip Codes with the Highest Percentage of Population Employed in Arts, Media & Entertainment in Wheaton, IL?
Top Zip Codes with the Highest Percentage of Population Employed in Arts, Media & Entertainment in Wheaton, IL are:
What zip code has the Highest Percentage of Population Employed in Arts, Media & Entertainment in Wheaton, IL?
60187 has the Highest Percentage of Population Employed in Arts, Media & Entertainment in Wheaton, IL with 2.7%.
What is the Percentage of Population Employed in Arts, Media & Entertainment in Wheaton, IL?
Percentage of Population Employed in Arts, Media & Entertainment in Wheaton is 1.9%.
What is the Percentage of Population Employed in Arts, Media & Entertainment in Illinois?
Percentage of Population Employed in Arts, Media & Entertainment in Illinois is 1.9%.
What is the Percentage of Population Employed in Arts, Media & Entertainment in the United States?
Percentage of Population Employed in Arts, Media & Entertainment in the United States is 2.1%.