Zip Codes with the Highest Percentage of Population Employed in Arts, Media & Entertainment in Peoria, IL
RELATED REPORTS & OPTIONS
Arts, Media & Entertainment
Peoria
Compare Zip Codes
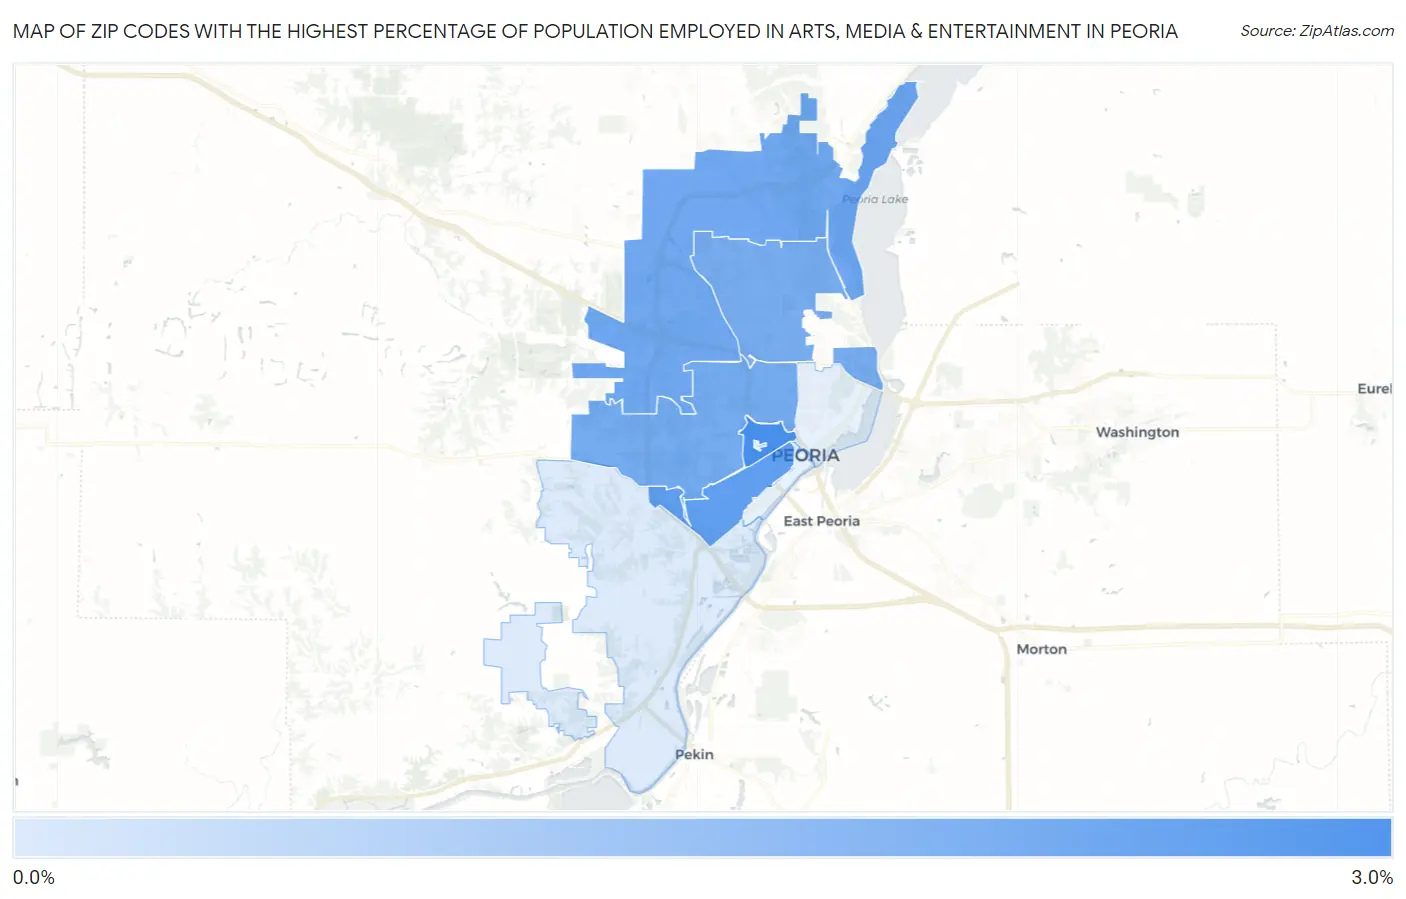
Map of Zip Codes with the Highest Percentage of Population Employed in Arts, Media & Entertainment in Peoria
0.52%
2.8%
Zip Codes with the Highest Percentage of Population Employed in Arts, Media & Entertainment in Peoria, IL
| Zip Code | % Employed | vs State | vs National | |
| 1. | 61606 | 2.8% | 1.9%(+0.914)#132 | 2.1%(+0.772)#4,522 |
| 2. | 61605 | 2.4% | 1.9%(+0.520)#177 | 2.1%(+0.378)#5,784 |
| 3. | 61615 | 2.2% | 1.9%(+0.256)#221 | 2.1%(+0.114)#6,934 |
| 4. | 61604 | 2.1% | 1.9%(+0.204)#228 | 2.1%(+0.062)#7,158 |
| 5. | 61614 | 2.1% | 1.9%(+0.153)#244 | 2.1%(+0.011)#7,428 |
| 6. | 61607 | 0.52% | 1.9%(-1.40)#765 | 2.1%(-1.54)#18,723 |
1
Common Questions
What are the Top 5 Zip Codes with the Highest Percentage of Population Employed in Arts, Media & Entertainment in Peoria, IL?
Top 5 Zip Codes with the Highest Percentage of Population Employed in Arts, Media & Entertainment in Peoria, IL are:
What zip code has the Highest Percentage of Population Employed in Arts, Media & Entertainment in Peoria, IL?
61606 has the Highest Percentage of Population Employed in Arts, Media & Entertainment in Peoria, IL with 2.8%.
What is the Percentage of Population Employed in Arts, Media & Entertainment in Peoria, IL?
Percentage of Population Employed in Arts, Media & Entertainment in Peoria is 1.9%.
What is the Percentage of Population Employed in Arts, Media & Entertainment in Illinois?
Percentage of Population Employed in Arts, Media & Entertainment in Illinois is 1.9%.
What is the Percentage of Population Employed in Arts, Media & Entertainment in the United States?
Percentage of Population Employed in Arts, Media & Entertainment in the United States is 2.1%.