Zip Codes with the Highest Percentage of Population Employed in Arts, Media & Entertainment in Downers Grove, IL
RELATED REPORTS & OPTIONS
Arts, Media & Entertainment
Downers Grove
Compare Zip Codes
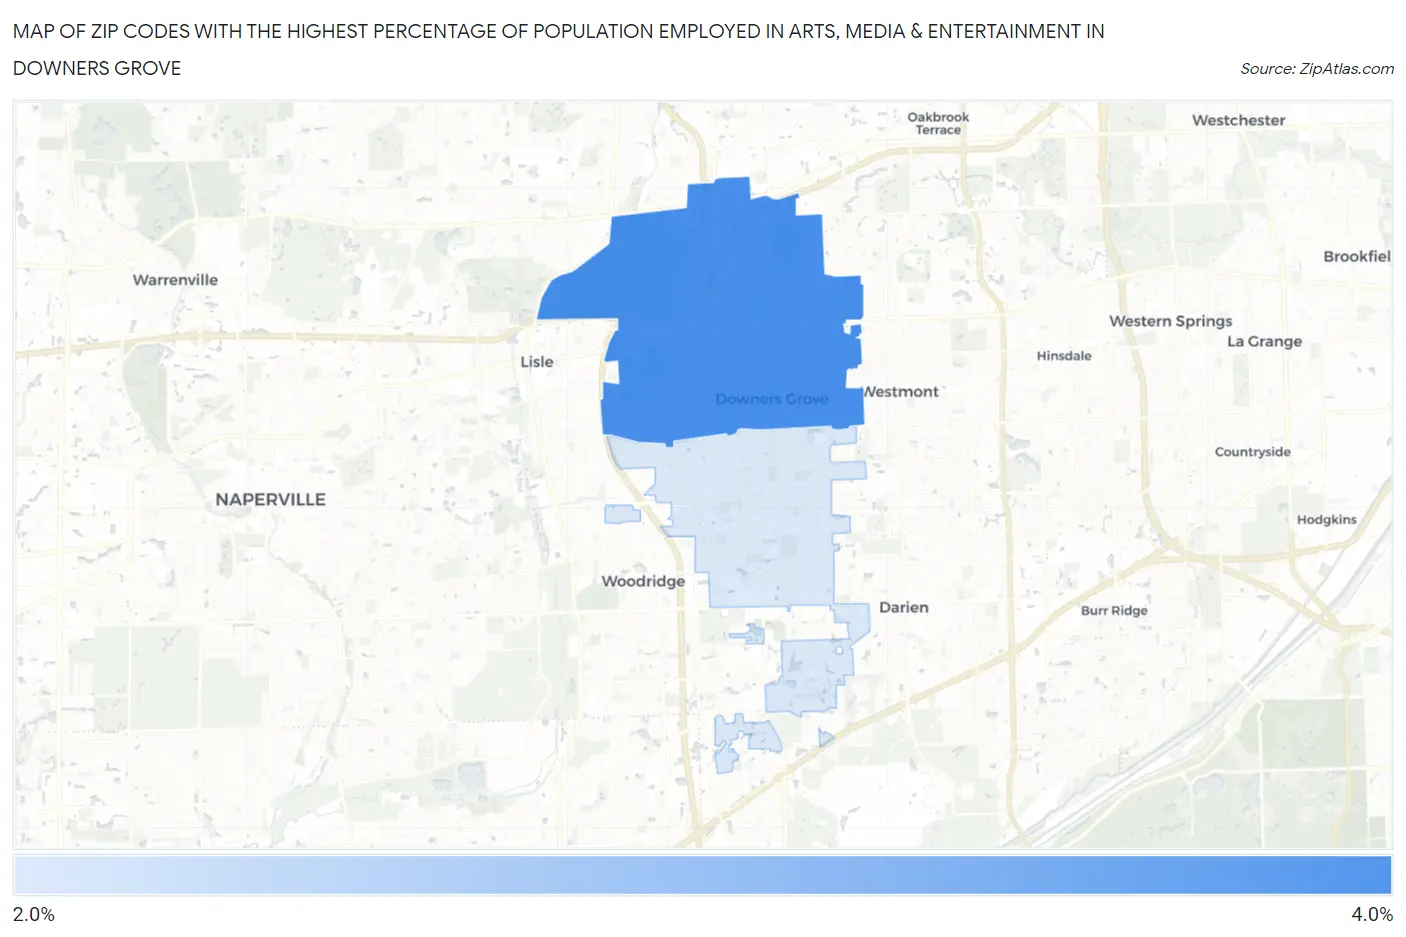
Map of Zip Codes with the Highest Percentage of Population Employed in Arts, Media & Entertainment in Downers Grove
2.1%
3.8%
Zip Codes with the Highest Percentage of Population Employed in Arts, Media & Entertainment in Downers Grove, IL
| Zip Code | % Employed | vs State | vs National | |
| 1. | 60515 | 3.8% | 1.9%(+1.92)#73 | 2.1%(+1.78)#2,579 |
| 2. | 60516 | 2.1% | 1.9%(+0.202)#229 | 2.1%(+0.060)#7,168 |
1
Common Questions
What are the Top Zip Codes with the Highest Percentage of Population Employed in Arts, Media & Entertainment in Downers Grove, IL?
Top Zip Codes with the Highest Percentage of Population Employed in Arts, Media & Entertainment in Downers Grove, IL are:
What zip code has the Highest Percentage of Population Employed in Arts, Media & Entertainment in Downers Grove, IL?
60515 has the Highest Percentage of Population Employed in Arts, Media & Entertainment in Downers Grove, IL with 3.8%.
What is the Percentage of Population Employed in Arts, Media & Entertainment in Downers Grove, IL?
Percentage of Population Employed in Arts, Media & Entertainment in Downers Grove is 3.1%.
What is the Percentage of Population Employed in Arts, Media & Entertainment in Illinois?
Percentage of Population Employed in Arts, Media & Entertainment in Illinois is 1.9%.
What is the Percentage of Population Employed in Arts, Media & Entertainment in the United States?
Percentage of Population Employed in Arts, Media & Entertainment in the United States is 2.1%.