Biggsville, IL Map & Demographics
Biggsville Map
Biggsville Overview
$40,991
PER CAPITA INCOME
$88,750
AVG FAMILY INCOME
$83,750
AVG HOUSEHOLD INCOME
51.9%
WAGE / INCOME GAP [ % ]
48.1¢/ $1
WAGE / INCOME GAP [ $ ]
0.34
INEQUALITY / GINI INDEX
311
TOTAL POPULATION
155
MALE POPULATION
156
FEMALE POPULATION
99.36
MALES / 100 FEMALES
100.65
FEMALES / 100 MALES
45.4
MEDIAN AGE
2.8
AVG FAMILY SIZE
2.1
AVG HOUSEHOLD SIZE
187
LABOR FORCE [ PEOPLE ]
70.3%
PERCENT IN LABOR FORCE
3.2%
UNEMPLOYMENT RATE
Biggsville Zip Codes
Biggsville Area Codes
Income in Biggsville
Income Overview in Biggsville
Per Capita Income in Biggsville is $40,991, while median incomes of families and households are $88,750 and $83,750 respectively.
| Characteristic | Number | Measure |
| Per Capita Income | 311 | $40,991 |
| Median Family Income | 81 | $88,750 |
| Mean Family Income | 81 | $82,890 |
| Median Household Income | 146 | $83,750 |
| Mean Household Income | 146 | $83,827 |
| Income Deficit | 81 | $0 |
| Wage / Income Gap (%) | 311 | 51.87% |
| Wage / Income Gap ($) | 311 | 48.13¢ per $1 |
| Gini / Inequality Index | 311 | 0.34 |
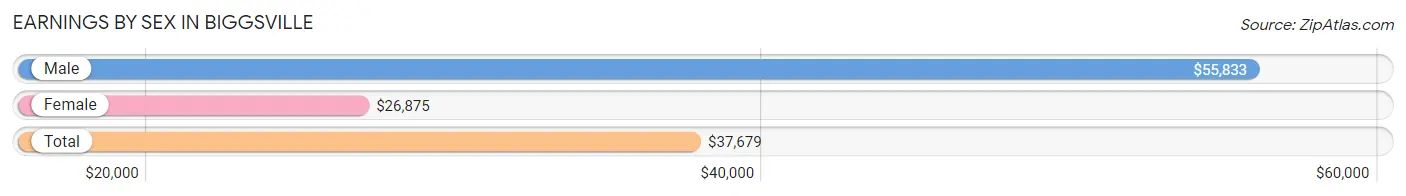
Earnings by Sex in Biggsville
Average Earnings in Biggsville are $37,679, $55,833 for men and $26,875 for women, a difference of 51.9%.
| Sex | Number | Average Earnings |
| Male | 110 (56.4%) | $55,833 |
| Female | 85 (43.6%) | $26,875 |
| Total | 195 (100.0%) | $37,679 |
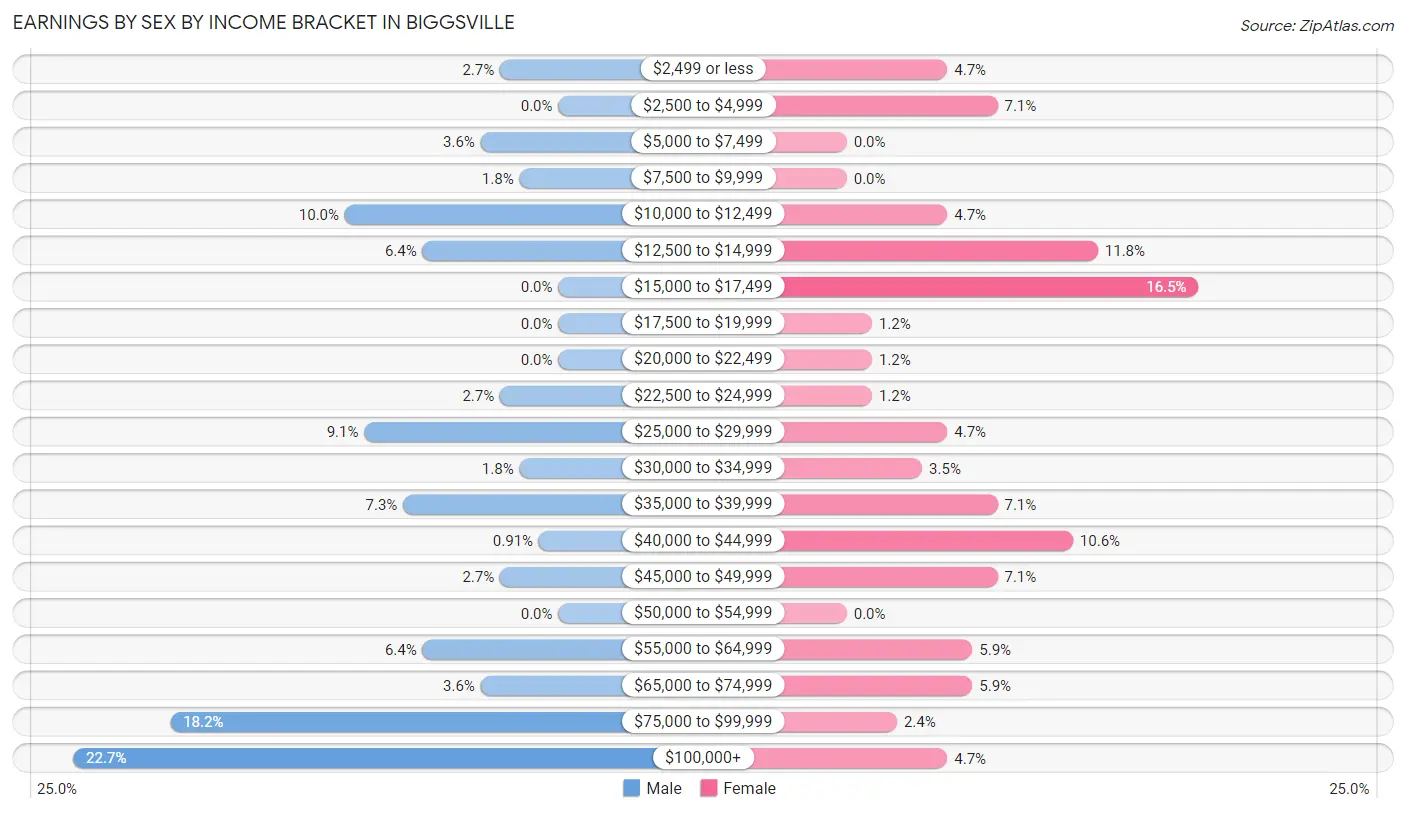
Earnings by Sex by Income Bracket in Biggsville
The most common earnings brackets in Biggsville are $100,000+ for men (25 | 22.7%) and $15,000 to $17,499 for women (14 | 16.5%).
| Income | Male | Female |
| $2,499 or less | 3 (2.7%) | 4 (4.7%) |
| $2,500 to $4,999 | 0 (0.0%) | 6 (7.1%) |
| $5,000 to $7,499 | 4 (3.6%) | 0 (0.0%) |
| $7,500 to $9,999 | 2 (1.8%) | 0 (0.0%) |
| $10,000 to $12,499 | 11 (10.0%) | 4 (4.7%) |
| $12,500 to $14,999 | 7 (6.4%) | 10 (11.8%) |
| $15,000 to $17,499 | 0 (0.0%) | 14 (16.5%) |
| $17,500 to $19,999 | 0 (0.0%) | 1 (1.2%) |
| $20,000 to $22,499 | 0 (0.0%) | 1 (1.2%) |
| $22,500 to $24,999 | 3 (2.7%) | 1 (1.2%) |
| $25,000 to $29,999 | 10 (9.1%) | 4 (4.7%) |
| $30,000 to $34,999 | 2 (1.8%) | 3 (3.5%) |
| $35,000 to $39,999 | 8 (7.3%) | 6 (7.1%) |
| $40,000 to $44,999 | 1 (0.9%) | 9 (10.6%) |
| $45,000 to $49,999 | 3 (2.7%) | 6 (7.1%) |
| $50,000 to $54,999 | 0 (0.0%) | 0 (0.0%) |
| $55,000 to $64,999 | 7 (6.4%) | 5 (5.9%) |
| $65,000 to $74,999 | 4 (3.6%) | 5 (5.9%) |
| $75,000 to $99,999 | 20 (18.2%) | 2 (2.4%) |
| $100,000+ | 25 (22.7%) | 4 (4.7%) |
| Total | 110 (100.0%) | 85 (100.0%) |
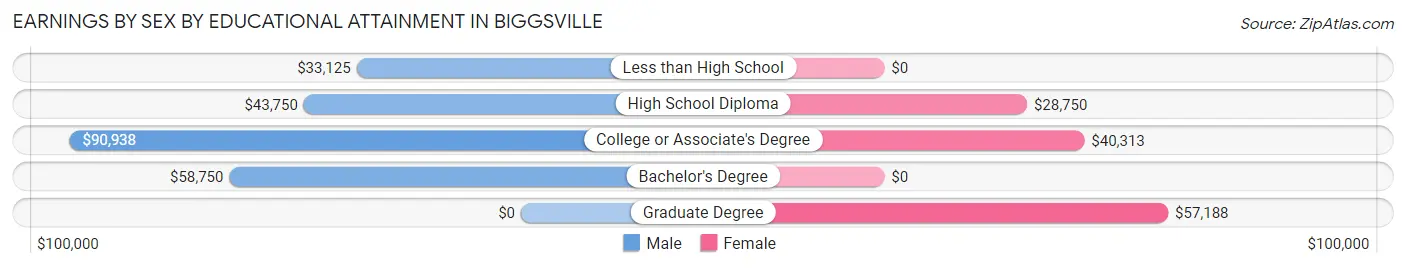
Earnings by Sex by Educational Attainment in Biggsville
Average earnings in Biggsville are $75,417 for men and $33,750 for women, a difference of 55.2%. Men with an educational attainment of college or associate's degree enjoy the highest average annual earnings of $90,938, while those with less than high school education earn the least with $33,125. Women with an educational attainment of graduate degree earn the most with the average annual earnings of $57,188, while those with high school diploma education have the smallest earnings of $28,750.
| Educational Attainment | Male Income | Female Income |
| Less than High School | $33,125 | $0 |
| High School Diploma | $43,750 | $28,750 |
| College or Associate's Degree | $90,938 | $40,313 |
| Bachelor's Degree | $58,750 | $0 |
| Graduate Degree | - | - |
| Total | $75,417 | $33,750 |
Family Income in Biggsville
Family Income Brackets in Biggsville
According to the Biggsville family income data, there are 22 families falling into the $100,000 to $149,999 income range, which is the most common income bracket and makes up 27.2% of all families.
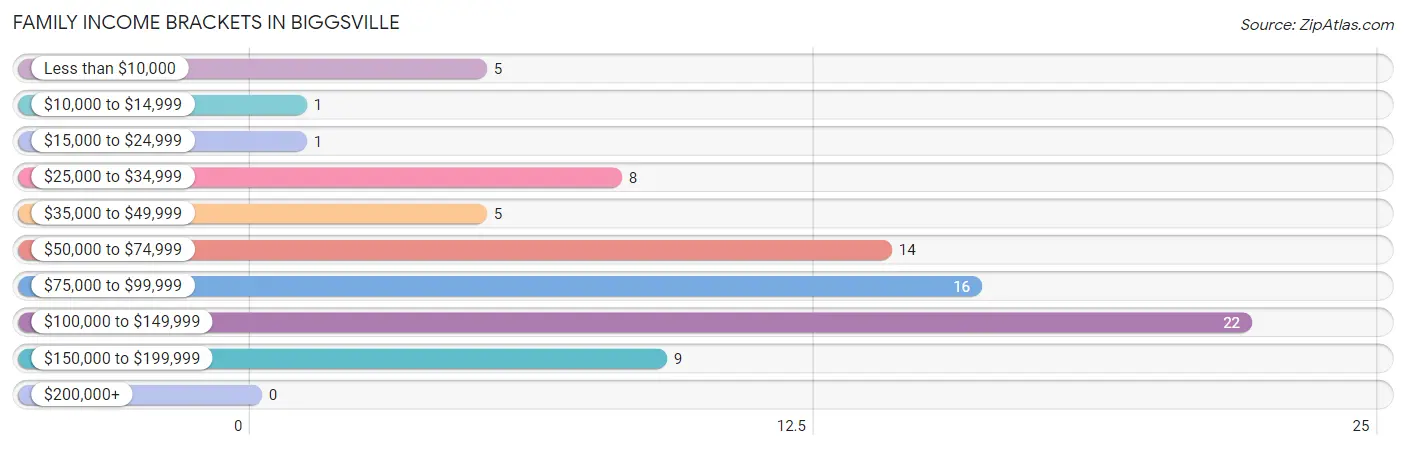
| Income Bracket | # Families | % Families |
| Less than $10,000 | 5 | 6.2% |
| $10,000 to $14,999 | 1 | 1.2% |
| $15,000 to $24,999 | 1 | 1.2% |
| $25,000 to $34,999 | 8 | 9.9% |
| $35,000 to $49,999 | 5 | 6.2% |
| $50,000 to $74,999 | 14 | 17.3% |
| $75,000 to $99,999 | 16 | 19.8% |
| $100,000 to $149,999 | 22 | 27.2% |
| $150,000 to $199,999 | 9 | 11.1% |
| $200,000+ | 0 | 0.0% |
Family Income by Famaliy Size in Biggsville
3-person families (15 | 18.5%) account for the highest median family income in Biggsville with $138,750 per family, while 3-person families (15 | 18.5%) have the highest median income of $46,250 per family member.
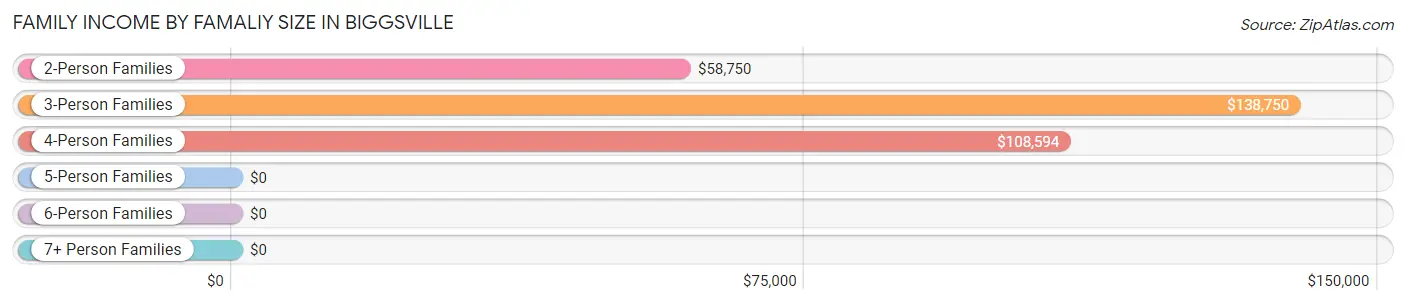
| Income Bracket | # Families | Median Income |
| 2-Person Families | 47 (58.0%) | $58,750 |
| 3-Person Families | 15 (18.5%) | $138,750 |
| 4-Person Families | 17 (21.0%) | $108,594 |
| 5-Person Families | 2 (2.5%) | $0 |
| 6-Person Families | 0 (0.0%) | $0 |
| 7+ Person Families | 0 (0.0%) | $0 |
| Total | 81 (100.0%) | $88,750 |
Family Income by Number of Earners in Biggsville
The median family income in Biggsville is $88,750, with families comprising 3+ earners (9) having the highest median family income of $151,042, while families with no earners (21) have the lowest median family income of $48,750, accounting for 11.1% and 25.9% of families, respectively.
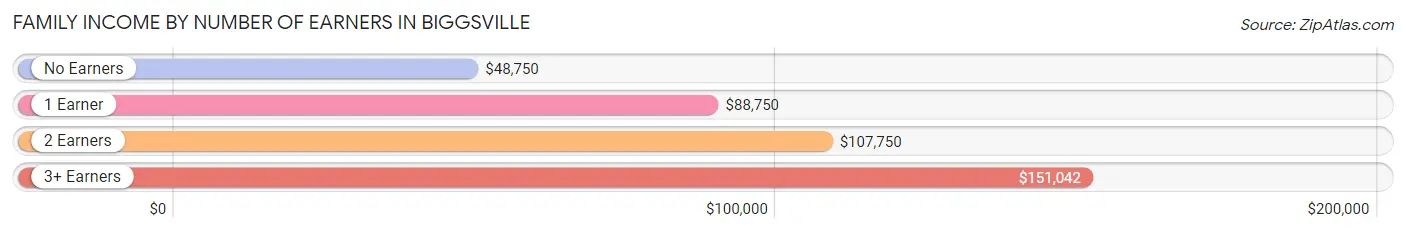
| Number of Earners | # Families | Median Income |
| No Earners | 21 (25.9%) | $48,750 |
| 1 Earner | 17 (21.0%) | $88,750 |
| 2 Earners | 34 (42.0%) | $107,750 |
| 3+ Earners | 9 (11.1%) | $151,042 |
| Total | 81 (100.0%) | $88,750 |
Household Income in Biggsville
Household Income Brackets in Biggsville
With 47 households falling in the category, the $100,000 to $149,999 income range is the most frequent in Biggsville, accounting for 32.2% of all households. In contrast, only 1 households (0.7%) fall into the $10,000 to $14,999 income bracket, making it the least populous group.
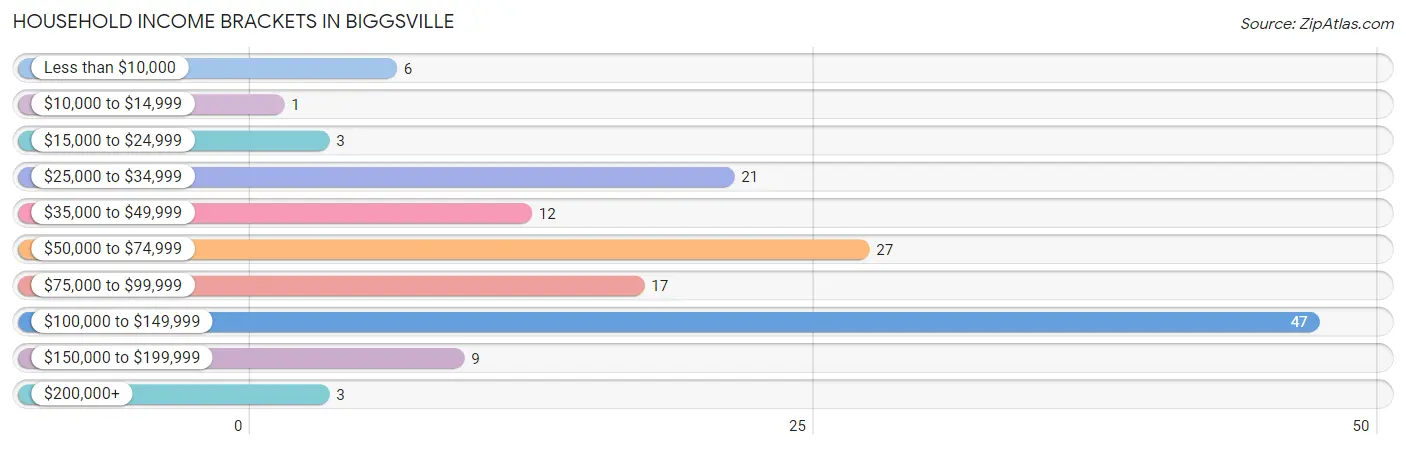
| Income Bracket | # Households | % Households |
| Less than $10,000 | 6 | 4.1% |
| $10,000 to $14,999 | 1 | 0.7% |
| $15,000 to $24,999 | 3 | 2.1% |
| $25,000 to $34,999 | 21 | 14.4% |
| $35,000 to $49,999 | 12 | 8.2% |
| $50,000 to $74,999 | 27 | 18.5% |
| $75,000 to $99,999 | 17 | 11.6% |
| $100,000 to $149,999 | 47 | 32.2% |
| $150,000 to $199,999 | 9 | 6.2% |
| $200,000+ | 3 | 2.1% |
Household Income by Householder Age in Biggsville
The median household income in Biggsville is $83,750, with the highest median household income of $113,300 found in the 45 to 64 years age bracket for the primary householder. A total of 58 households (39.7%) fall into this category. Meanwhile, the 15 to 24 years age bracket for the primary householder has the lowest median household income of $0, with 6 households (4.1%) in this group.
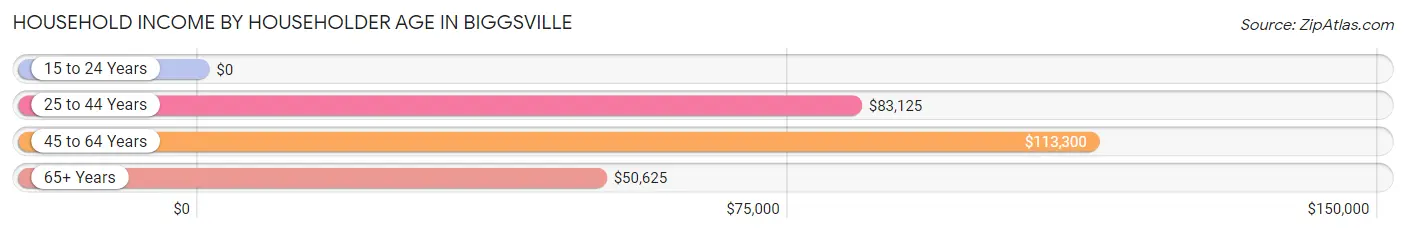
| Income Bracket | # Households | Median Income |
| 15 to 24 Years | 6 (4.1%) | $0 |
| 25 to 44 Years | 33 (22.6%) | $83,125 |
| 45 to 64 Years | 58 (39.7%) | $113,300 |
| 65+ Years | 49 (33.6%) | $50,625 |
| Total | 146 (100.0%) | $83,750 |
Poverty in Biggsville
Income Below Poverty by Sex and Age in Biggsville
With 5.8% poverty level for males and 14.7% for females among the residents of Biggsville, 35 to 44 year old males and 18 to 24 year old females are the most vulnerable to poverty, with 4 males (36.4%) and 13 females (76.5%) in their respective age groups living below the poverty level.
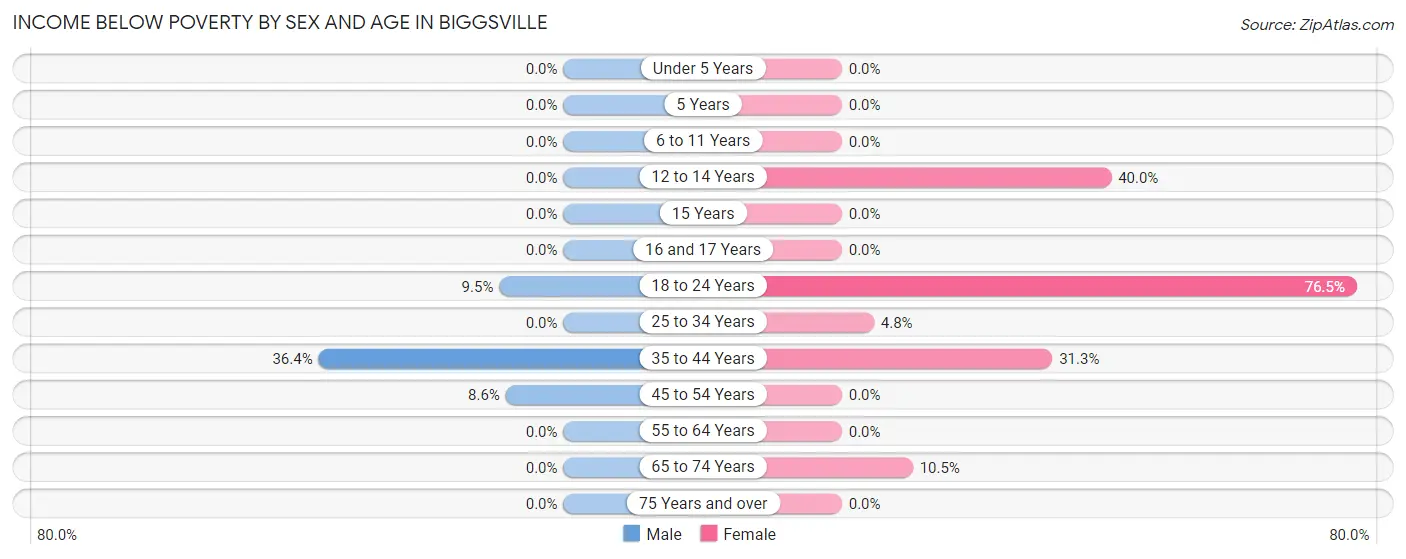
| Age Bracket | Male | Female |
| Under 5 Years | 0 (0.0%) | 0 (0.0%) |
| 5 Years | 0 (0.0%) | 0 (0.0%) |
| 6 to 11 Years | 0 (0.0%) | 0 (0.0%) |
| 12 to 14 Years | 0 (0.0%) | 2 (40.0%) |
| 15 Years | 0 (0.0%) | 0 (0.0%) |
| 16 and 17 Years | 0 (0.0%) | 0 (0.0%) |
| 18 to 24 Years | 2 (9.5%) | 13 (76.5%) |
| 25 to 34 Years | 0 (0.0%) | 1 (4.8%) |
| 35 to 44 Years | 4 (36.4%) | 5 (31.2%) |
| 45 to 54 Years | 3 (8.6%) | 0 (0.0%) |
| 55 to 64 Years | 0 (0.0%) | 0 (0.0%) |
| 65 to 74 Years | 0 (0.0%) | 2 (10.5%) |
| 75 Years and over | 0 (0.0%) | 0 (0.0%) |
| Total | 9 (5.8%) | 23 (14.7%) |
Income Above Poverty by Sex and Age in Biggsville
According to the poverty statistics in Biggsville, males aged under 5 years and females aged under 5 years are the age groups that are most secure financially, with 100.0% of males and 100.0% of females in these age groups living above the poverty line.
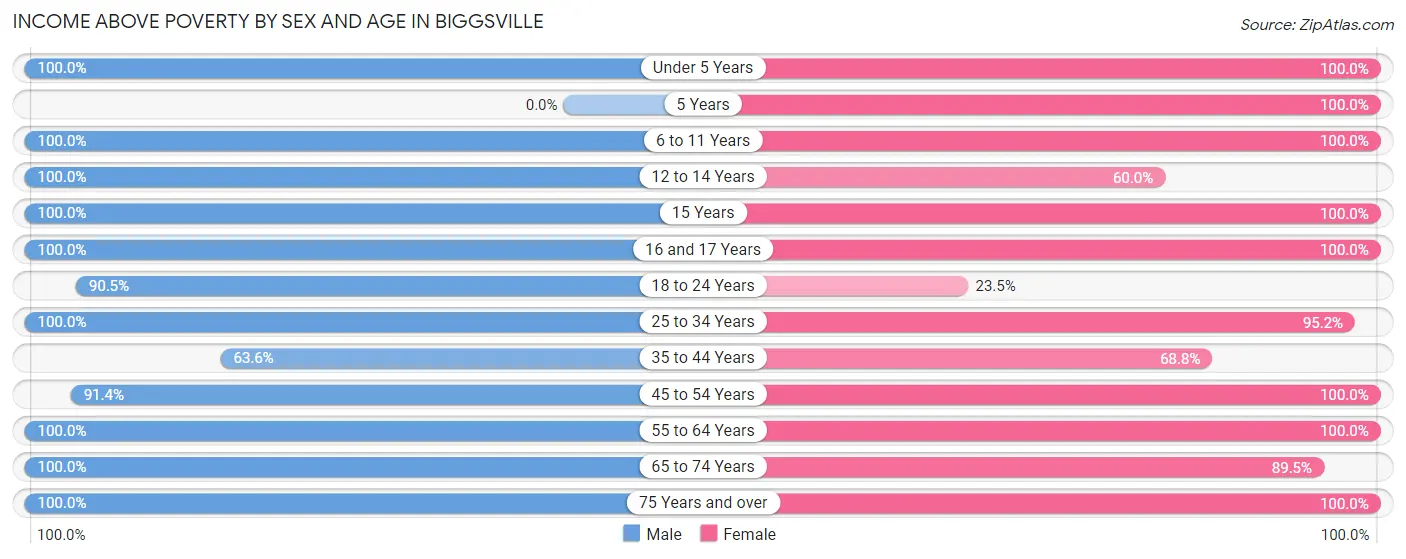
| Age Bracket | Male | Female |
| Under 5 Years | 6 (100.0%) | 6 (100.0%) |
| 5 Years | 0 (0.0%) | 2 (100.0%) |
| 6 to 11 Years | 9 (100.0%) | 8 (100.0%) |
| 12 to 14 Years | 3 (100.0%) | 3 (60.0%) |
| 15 Years | 2 (100.0%) | 4 (100.0%) |
| 16 and 17 Years | 3 (100.0%) | 4 (100.0%) |
| 18 to 24 Years | 19 (90.5%) | 4 (23.5%) |
| 25 to 34 Years | 15 (100.0%) | 20 (95.2%) |
| 35 to 44 Years | 7 (63.6%) | 11 (68.8%) |
| 45 to 54 Years | 32 (91.4%) | 16 (100.0%) |
| 55 to 64 Years | 14 (100.0%) | 15 (100.0%) |
| 65 to 74 Years | 17 (100.0%) | 17 (89.5%) |
| 75 Years and over | 19 (100.0%) | 23 (100.0%) |
| Total | 146 (94.2%) | 133 (85.3%) |
Income Below Poverty Among Married-Couple Families in Biggsville
The poverty statistics for married-couple families in Biggsville show that 5.0% or 3 of the total 60 families live below the poverty line. Families with 1 or 2 children have the highest poverty rate of 6.2%, comprising of 1 families. On the other hand, families with 3 or 4 children have the lowest poverty rate of 0.0%, which includes 0 families.
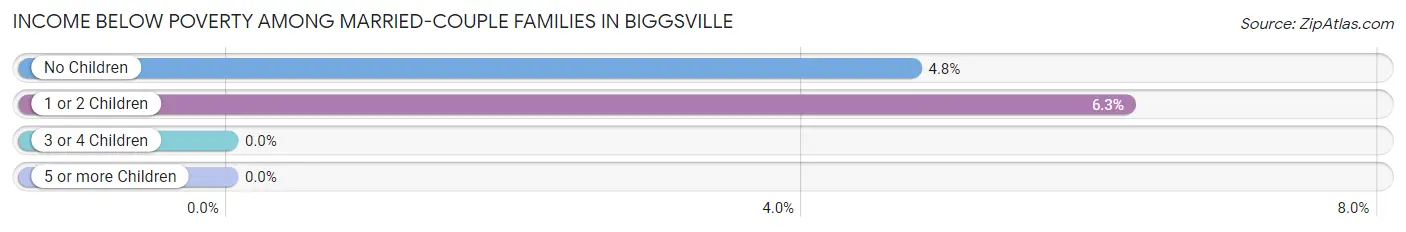
| Children | Above Poverty | Below Poverty |
| No Children | 40 (95.2%) | 2 (4.8%) |
| 1 or 2 Children | 15 (93.8%) | 1 (6.2%) |
| 3 or 4 Children | 2 (100.0%) | 0 (0.0%) |
| 5 or more Children | 0 (0.0%) | 0 (0.0%) |
| Total | 57 (95.0%) | 3 (5.0%) |
Income Below Poverty Among Single-Parent Households in Biggsville
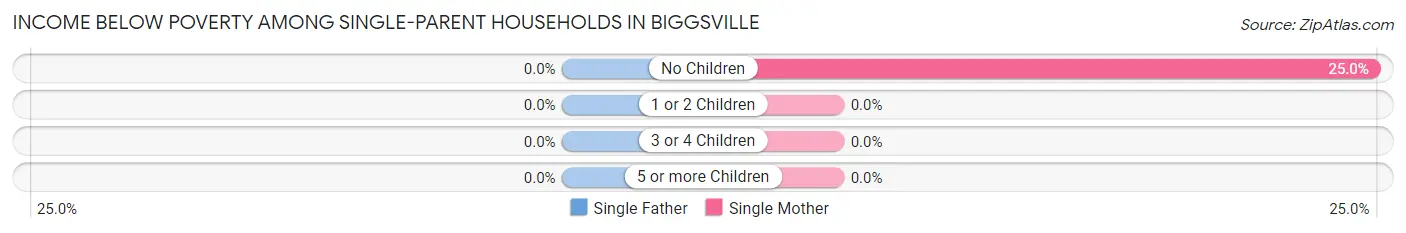
| Children | Single Father | Single Mother |
| No Children | 0 (0.0%) | 3 (25.0%) |
| 1 or 2 Children | 0 (0.0%) | 0 (0.0%) |
| 3 or 4 Children | 0 (0.0%) | 0 (0.0%) |
| 5 or more Children | 0 (0.0%) | 0 (0.0%) |
| Total | 0 (0.0%) | 3 (18.8%) |
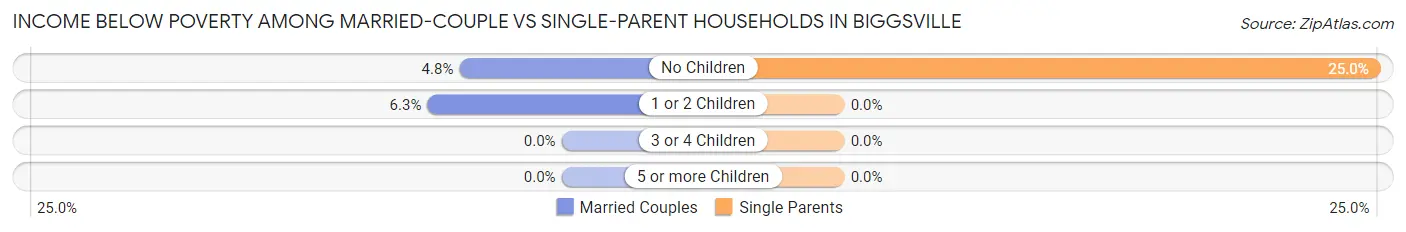
Income Below Poverty Among Married-Couple vs Single-Parent Households in Biggsville
The poverty data for Biggsville shows that 3 of the married-couple family households (5.0%) and 3 of the single-parent households (14.3%) are living below the poverty level. Within the married-couple family households, those with 1 or 2 children have the highest poverty rate, with 1 households (6.2%) falling below the poverty line. Among the single-parent households, those with no children have the highest poverty rate, with 3 household (25.0%) living below poverty.
| Children | Married-Couple Families | Single-Parent Households |
| No Children | 2 (4.8%) | 3 (25.0%) |
| 1 or 2 Children | 1 (6.2%) | 0 (0.0%) |
| 3 or 4 Children | 0 (0.0%) | 0 (0.0%) |
| 5 or more Children | 0 (0.0%) | 0 (0.0%) |
| Total | 3 (5.0%) | 3 (14.3%) |
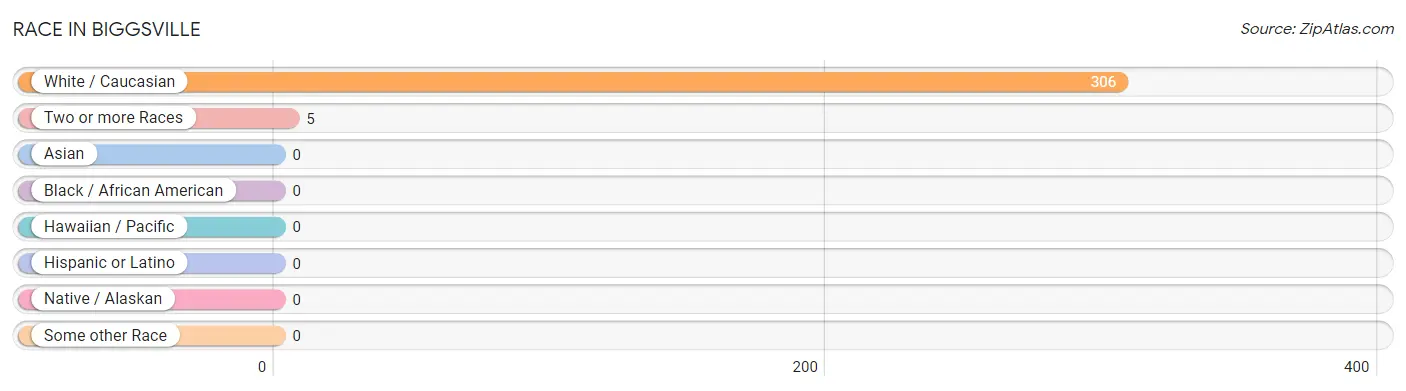
Race in Biggsville
The most populous races in Biggsville are White / Caucasian (306 | 98.4%), and Two or more Races (5 | 1.6%).
| Race | # Population | % Population |
| Asian | 0 | 0.0% |
| Black / African American | 0 | 0.0% |
| Hawaiian / Pacific | 0 | 0.0% |
| Hispanic or Latino | 0 | 0.0% |
| Native / Alaskan | 0 | 0.0% |
| White / Caucasian | 306 | 98.4% |
| Two or more Races | 5 | 1.6% |
| Some other Race | 0 | 0.0% |
| Total | 311 | 100.0% |
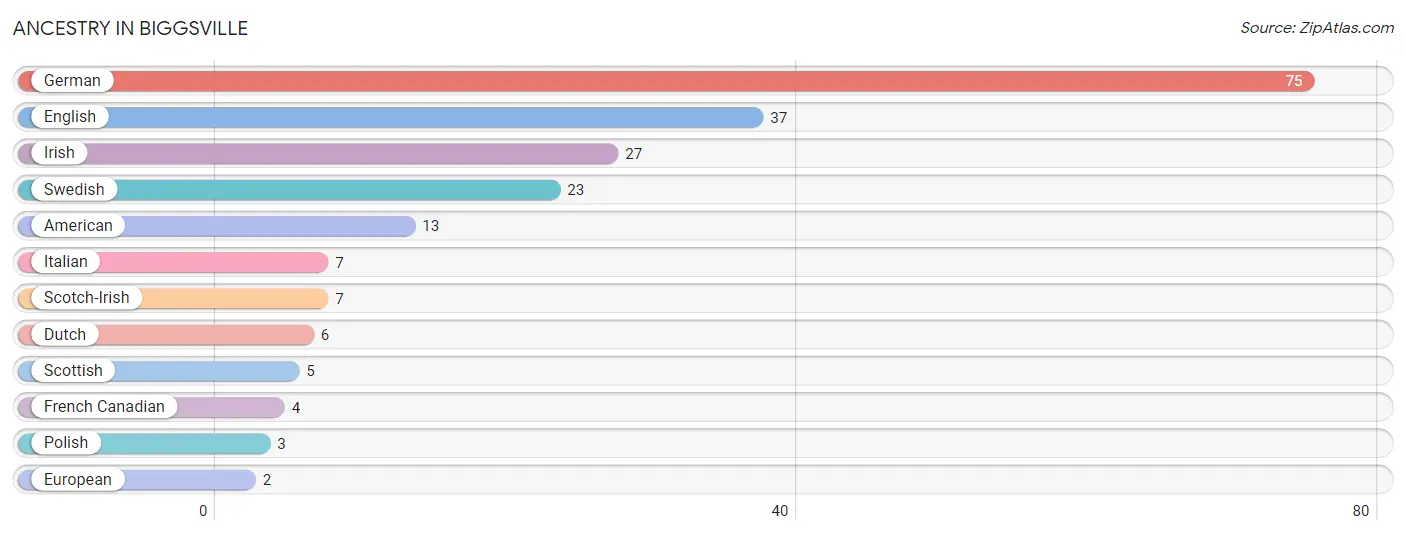
Ancestry in Biggsville
The most populous ancestries reported in Biggsville are German (75 | 24.1%), English (37 | 11.9%), Irish (27 | 8.7%), Swedish (23 | 7.4%), and American (13 | 4.2%), together accounting for 56.3% of all Biggsville residents.
| Ancestry | # Population | % Population |
| American | 13 | 4.2% |
| Dutch | 6 | 1.9% |
| English | 37 | 11.9% |
| European | 2 | 0.6% |
| French Canadian | 4 | 1.3% |
| German | 75 | 24.1% |
| Irish | 27 | 8.7% |
| Italian | 7 | 2.2% |
| Polish | 3 | 1.0% |
| Scotch-Irish | 7 | 2.2% |
| Scottish | 5 | 1.6% |
| Swedish | 23 | 7.4% | View All 12 Rows |
Immigrants in Biggsville

| Immigration Origin | # Population | % Population | View All 0 Rows |
Sex and Age in Biggsville
Sex and Age in Biggsville
The most populous age groups in Biggsville are 50 to 54 Years (26 | 16.8%) for men and 15 to 19 Years (19 | 12.2%) for women.
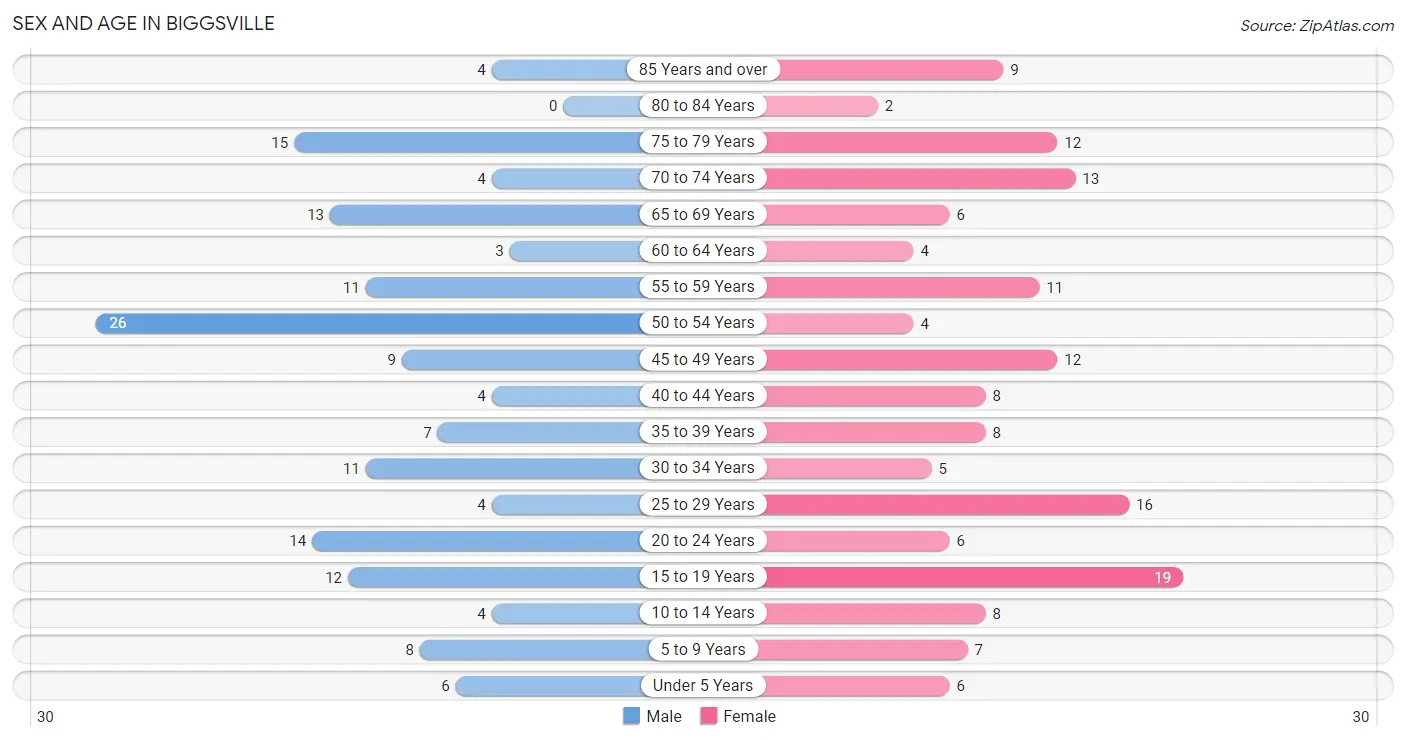
| Age Bracket | Male | Female |
| Under 5 Years | 6 (3.9%) | 6 (3.8%) |
| 5 to 9 Years | 8 (5.2%) | 7 (4.5%) |
| 10 to 14 Years | 4 (2.6%) | 8 (5.1%) |
| 15 to 19 Years | 12 (7.7%) | 19 (12.2%) |
| 20 to 24 Years | 14 (9.0%) | 6 (3.8%) |
| 25 to 29 Years | 4 (2.6%) | 16 (10.3%) |
| 30 to 34 Years | 11 (7.1%) | 5 (3.2%) |
| 35 to 39 Years | 7 (4.5%) | 8 (5.1%) |
| 40 to 44 Years | 4 (2.6%) | 8 (5.1%) |
| 45 to 49 Years | 9 (5.8%) | 12 (7.7%) |
| 50 to 54 Years | 26 (16.8%) | 4 (2.6%) |
| 55 to 59 Years | 11 (7.1%) | 11 (7.0%) |
| 60 to 64 Years | 3 (1.9%) | 4 (2.6%) |
| 65 to 69 Years | 13 (8.4%) | 6 (3.8%) |
| 70 to 74 Years | 4 (2.6%) | 13 (8.3%) |
| 75 to 79 Years | 15 (9.7%) | 12 (7.7%) |
| 80 to 84 Years | 0 (0.0%) | 2 (1.3%) |
| 85 Years and over | 4 (2.6%) | 9 (5.8%) |
| Total | 155 (100.0%) | 156 (100.0%) |
Families and Households in Biggsville
Median Family Size in Biggsville
The median family size in Biggsville is 2.83 persons per family, with married-couple families (60 | 74.1%) accounting for the largest median family size of 2.83 persons per family. On the other hand, single male/father families (5 | 6.2%) represent the smallest median family size with 2.80 persons per family.
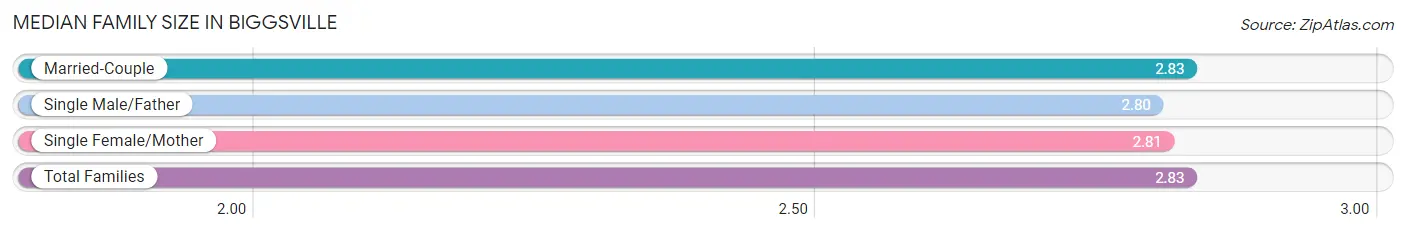
| Family Type | # Families | Family Size |
| Married-Couple | 60 (74.1%) | 2.83 |
| Single Male/Father | 5 (6.2%) | 2.80 |
| Single Female/Mother | 16 (19.8%) | 2.81 |
| Total Families | 81 (100.0%) | 2.83 |
Median Household Size in Biggsville
The median household size in Biggsville is 2.13 persons per household, with single female/mother households (16 | 11.0%) accounting for the largest median household size of 3.44 persons per household. non-family households (65 | 44.5%) represent the smallest median household size with 1.05 persons per household.
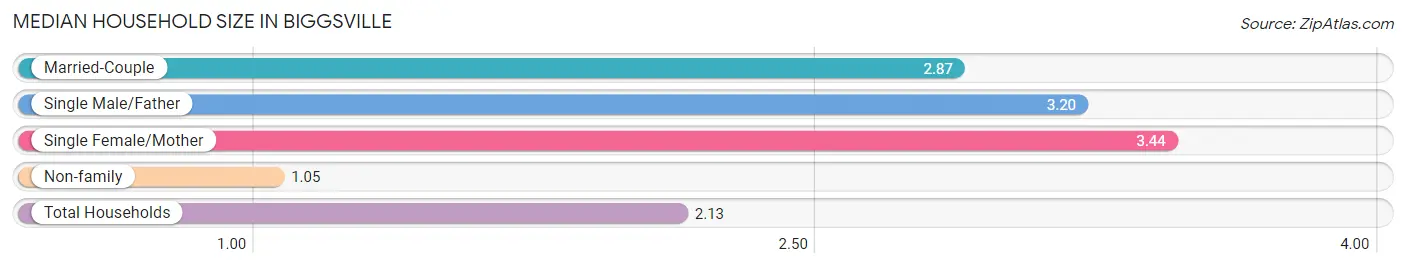
| Household Type | # Households | Household Size |
| Married-Couple | 60 (41.1%) | 2.87 |
| Single Male/Father | 5 (3.4%) | 3.20 |
| Single Female/Mother | 16 (11.0%) | 3.44 |
| Non-family | 65 (44.5%) | 1.05 |
| Total Households | 146 (100.0%) | 2.13 |
Household Size by Marriage Status in Biggsville
Out of a total of 146 households in Biggsville, 81 (55.5%) are family households, while 65 (44.5%) are nonfamily households. The most numerous type of family households are 2-person households, comprising 46, and the most common type of nonfamily households are 1-person households, comprising 61.
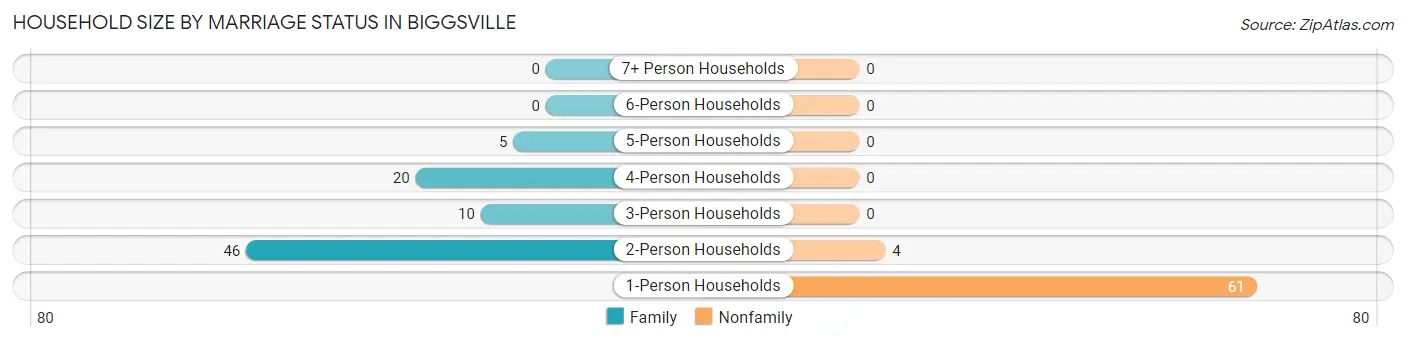
| Household Size | Family Households | Nonfamily Households |
| 1-Person Households | - | 61 (41.8%) |
| 2-Person Households | 46 (31.5%) | 4 (2.7%) |
| 3-Person Households | 10 (6.9%) | 0 (0.0%) |
| 4-Person Households | 20 (13.7%) | 0 (0.0%) |
| 5-Person Households | 5 (3.4%) | 0 (0.0%) |
| 6-Person Households | 0 (0.0%) | 0 (0.0%) |
| 7+ Person Households | 0 (0.0%) | 0 (0.0%) |
| Total | 81 (55.5%) | 65 (44.5%) |
Female Fertility in Biggsville
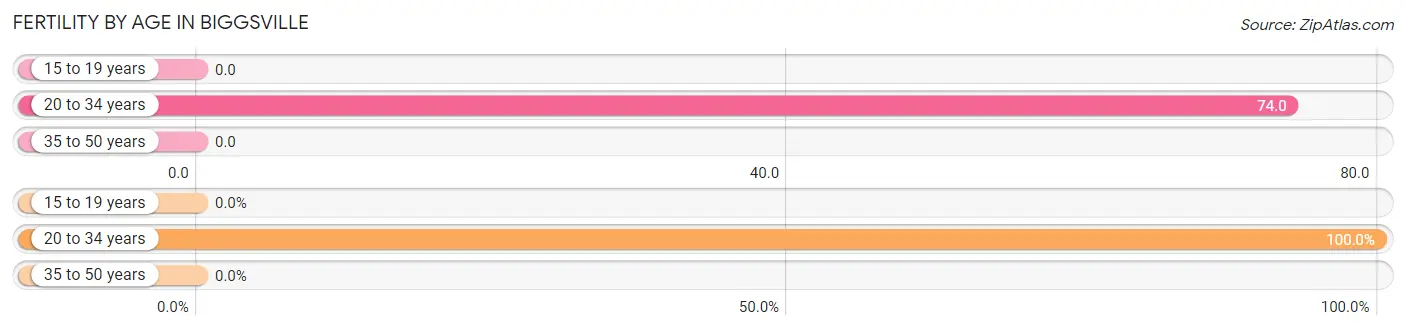
Fertility by Age in Biggsville
Average fertility rate in Biggsville is 27.0 births per 1,000 women. Women in the age bracket of 20 to 34 years have the highest fertility rate with 74.0 births per 1,000 women. Women in the age bracket of 20 to 34 years acount for 100.0% of all women with births.
| Age Bracket | Women with Births | Births / 1,000 Women |
| 15 to 19 years | 0 (0.0%) | 0.0 |
| 20 to 34 years | 2 (100.0%) | 74.0 |
| 35 to 50 years | 0 (0.0%) | 0.0 |
| Total | 2 (100.0%) | 27.0 |
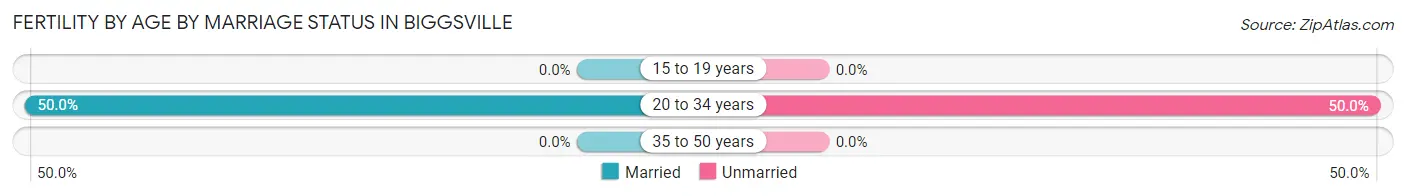
Fertility by Age by Marriage Status in Biggsville
50.0% of women with births (2) in Biggsville are married. The highest percentage of unmarried women with births falls into 20 to 34 years age bracket with 50.0% of them unmarried at the time of birth, while the lowest percentage of unmarried women with births belong to 20 to 34 years age bracket with 50.0% of them unmarried.
| Age Bracket | Married | Unmarried |
| 15 to 19 years | 0 (0.0%) | 0 (0.0%) |
| 20 to 34 years | 1 (50.0%) | 1 (50.0%) |
| 35 to 50 years | 0 (0.0%) | 0 (0.0%) |
| Total | 1 (50.0%) | 1 (50.0%) |
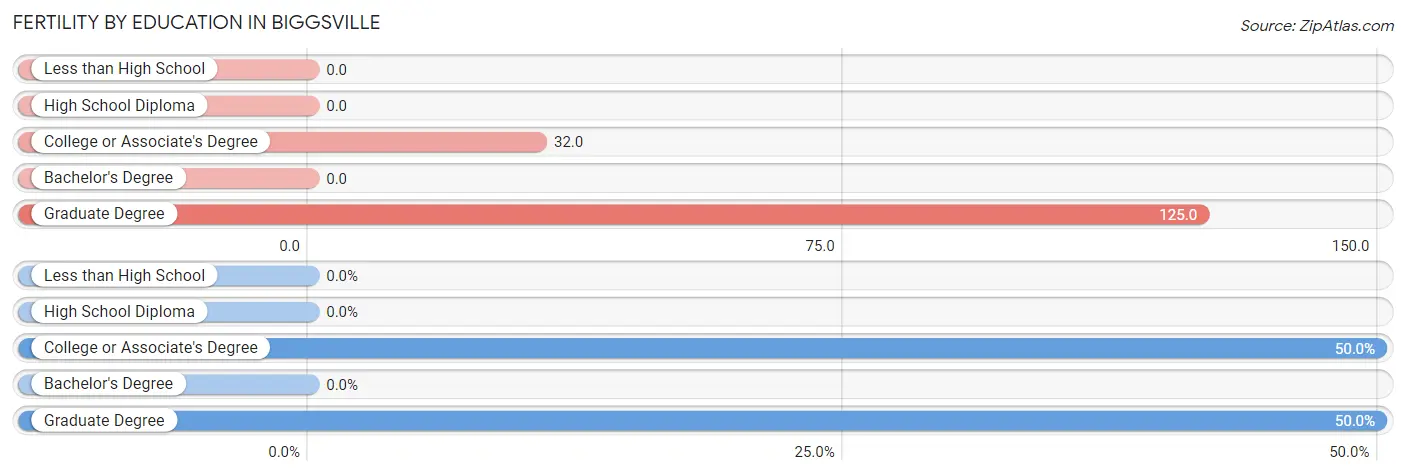
Fertility by Education in Biggsville
| Educational Attainment | Women with Births | Births / 1,000 Women |
| Less than High School | 0 (0.0%) | 0.0 |
| High School Diploma | 0 (0.0%) | 0.0 |
| College or Associate's Degree | 1 (50.0%) | 32.0 |
| Bachelor's Degree | 0 (0.0%) | 0.0 |
| Graduate Degree | 1 (50.0%) | 125.0 |
| Total | 2 (100.0%) | 27.0 |
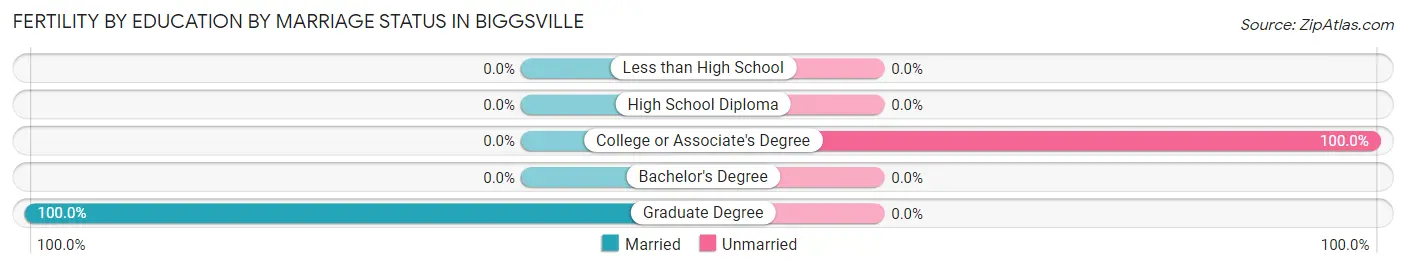
Fertility by Education by Marriage Status in Biggsville
50.0% of women with births in Biggsville are unmarried. Women with the educational attainment of graduate degree are most likely to be married with 100.0% of them married at childbirth, while women with the educational attainment of college or associate's degree are least likely to be married with 100.0% of them unmarried at childbirth.
| Educational Attainment | Married | Unmarried |
| Less than High School | 0 (0.0%) | 0 (0.0%) |
| High School Diploma | 0 (0.0%) | 0 (0.0%) |
| College or Associate's Degree | 0 (0.0%) | 1 (100.0%) |
| Bachelor's Degree | 0 (0.0%) | 0 (0.0%) |
| Graduate Degree | 1 (100.0%) | 0 (0.0%) |
| Total | 1 (50.0%) | 1 (50.0%) |
Employment Characteristics in Biggsville
Employment by Class of Employer in Biggsville
Among the 181 employed individuals in Biggsville, private company employees (124 | 68.5%), self-employed (not incorporated) (19 | 10.5%), and state government employees (19 | 10.5%) make up the most common classes of employment.
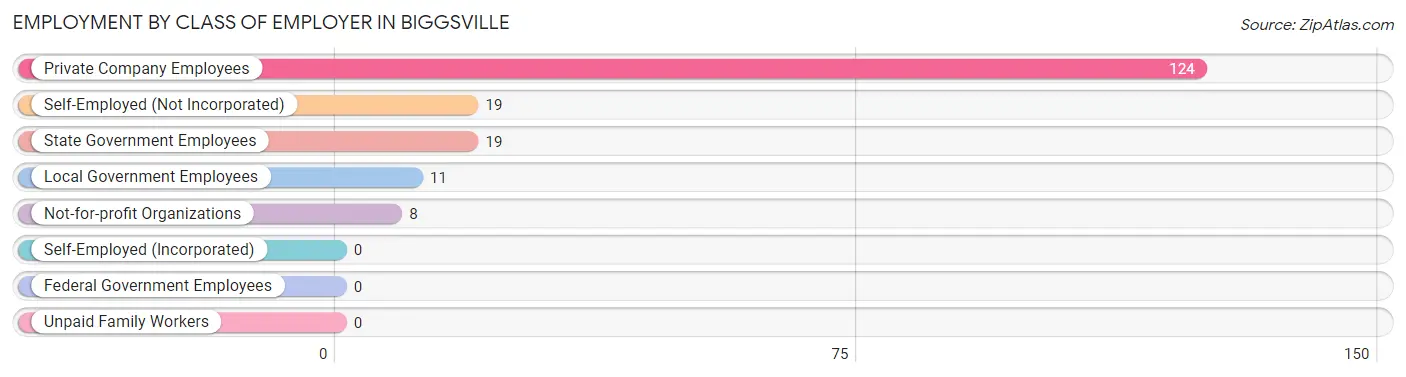
| Employer Class | # Employees | % Employees |
| Private Company Employees | 124 | 68.5% |
| Self-Employed (Incorporated) | 0 | 0.0% |
| Self-Employed (Not Incorporated) | 19 | 10.5% |
| Not-for-profit Organizations | 8 | 4.4% |
| Local Government Employees | 11 | 6.1% |
| State Government Employees | 19 | 10.5% |
| Federal Government Employees | 0 | 0.0% |
| Unpaid Family Workers | 0 | 0.0% |
| Total | 181 | 100.0% |
Employment Status by Age in Biggsville
According to the labor force statistics for Biggsville, out of the total population over 16 years of age (266), 70.3% or 187 individuals are in the labor force, with 3.2% or 6 of them unemployed. The age group with the highest labor force participation rate is 25 to 29 years, with 100.0% or 20 individuals in the labor force. Within the labor force, the 16 to 19 years age range has the highest percentage of unemployed individuals, with 25.0% or 5 of them being unemployed.
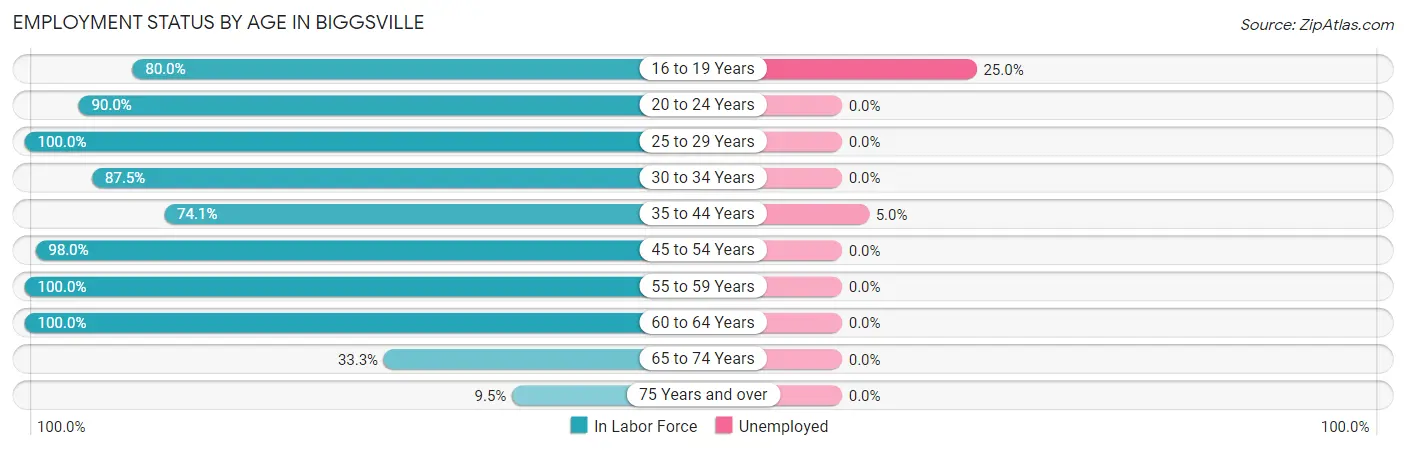
| Age Bracket | In Labor Force | Unemployed |
| 16 to 19 Years | 20 (80.0%) | 5 (25.0%) |
| 20 to 24 Years | 18 (90.0%) | 0 (0.0%) |
| 25 to 29 Years | 20 (100.0%) | 0 (0.0%) |
| 30 to 34 Years | 14 (87.5%) | 0 (0.0%) |
| 35 to 44 Years | 20 (74.1%) | 1 (5.0%) |
| 45 to 54 Years | 50 (98.0%) | 0 (0.0%) |
| 55 to 59 Years | 22 (100.0%) | 0 (0.0%) |
| 60 to 64 Years | 7 (100.0%) | 0 (0.0%) |
| 65 to 74 Years | 12 (33.3%) | 0 (0.0%) |
| 75 Years and over | 4 (9.5%) | 0 (0.0%) |
| Total | 187 (70.3%) | 6 (3.2%) |
Employment Status by Educational Attainment in Biggsville
According to labor force statistics for Biggsville, 93.0% of individuals (133) out of the total population between 25 and 64 years of age (143) are in the labor force, with 0.8% or 1 of them being unemployed. The group with the highest labor force participation rate are those with the educational attainment of bachelor's degree or higher, with 100.0% or 35 individuals in the labor force. Within the labor force, individuals with college / associate degree education have the highest percentage of unemployment, with 1.4% or 1 of them being unemployed.
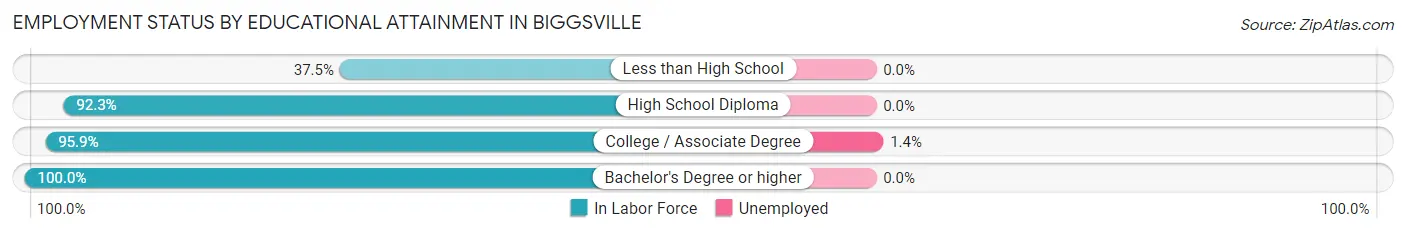
| Educational Attainment | In Labor Force | Unemployed |
| Less than High School | 3 (37.5%) | 0 (0.0%) |
| High School Diploma | 24 (92.3%) | 0 (0.0%) |
| College / Associate Degree | 71 (95.9%) | 1 (1.4%) |
| Bachelor's Degree or higher | 35 (100.0%) | 0 (0.0%) |
| Total | 133 (93.0%) | 1 (0.8%) |
Employment Occupations by Sex in Biggsville
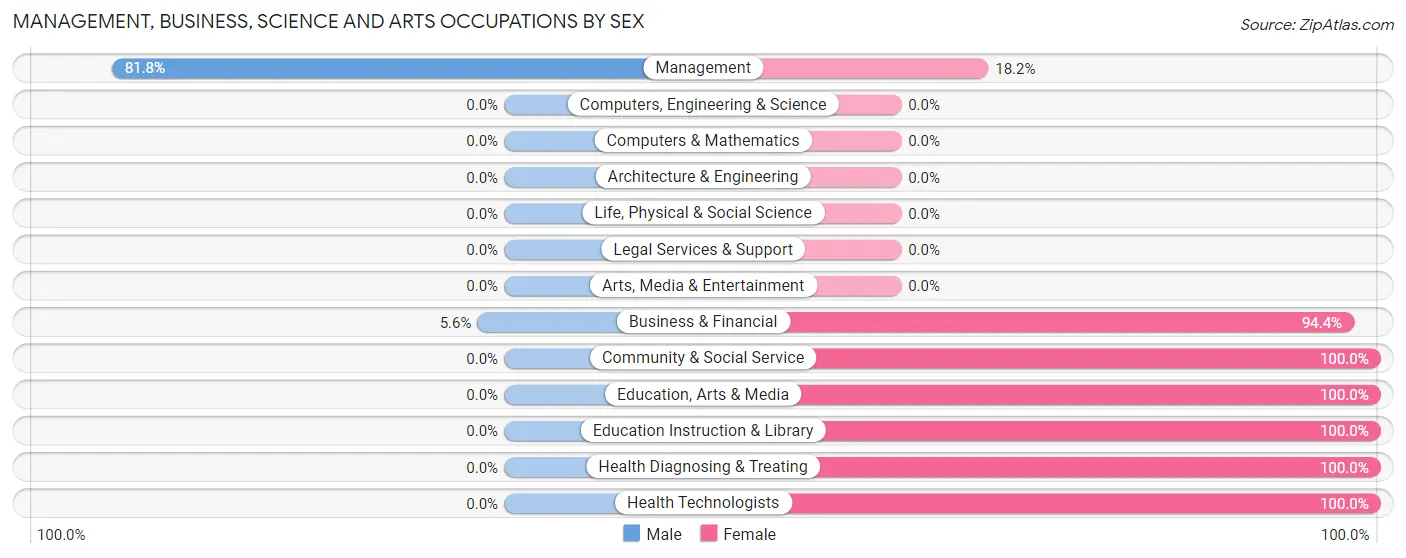
Management, Business, Science and Arts Occupations
The most common Management, Business, Science and Arts occupations in Biggsville are Management (33 | 18.2%), Community & Social Service (23 | 12.7%), Business & Financial (18 | 9.9%), Education, Arts & Media (14 | 7.7%), and Education Instruction & Library (9 | 5.0%).
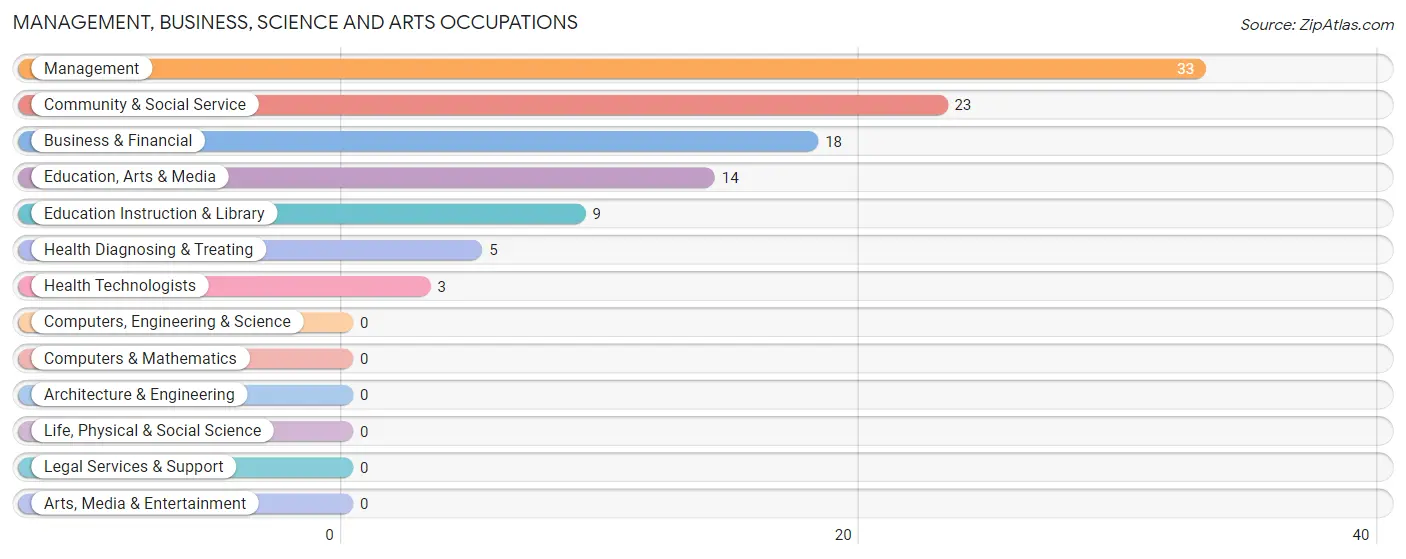
Management, Business, Science and Arts Occupations by Sex
Within the Management, Business, Science and Arts occupations in Biggsville, the most male-oriented occupations are Management (81.8%), and Business & Financial (5.6%), while the most female-oriented occupations are Community & Social Service (100.0%), Education, Arts & Media (100.0%), and Education Instruction & Library (100.0%).
| Occupation | Male | Female |
| Management | 27 (81.8%) | 6 (18.2%) |
| Business & Financial | 1 (5.6%) | 17 (94.4%) |
| Computers, Engineering & Science | 0 (0.0%) | 0 (0.0%) |
| Computers & Mathematics | 0 (0.0%) | 0 (0.0%) |
| Architecture & Engineering | 0 (0.0%) | 0 (0.0%) |
| Life, Physical & Social Science | 0 (0.0%) | 0 (0.0%) |
| Community & Social Service | 0 (0.0%) | 23 (100.0%) |
| Education, Arts & Media | 0 (0.0%) | 14 (100.0%) |
| Legal Services & Support | 0 (0.0%) | 0 (0.0%) |
| Education Instruction & Library | 0 (0.0%) | 9 (100.0%) |
| Arts, Media & Entertainment | 0 (0.0%) | 0 (0.0%) |
| Health Diagnosing & Treating | 0 (0.0%) | 5 (100.0%) |
| Health Technologists | 0 (0.0%) | 3 (100.0%) |
| Total (Category) | 28 (35.4%) | 51 (64.6%) |
| Total (Overall) | 97 (53.6%) | 84 (46.4%) |
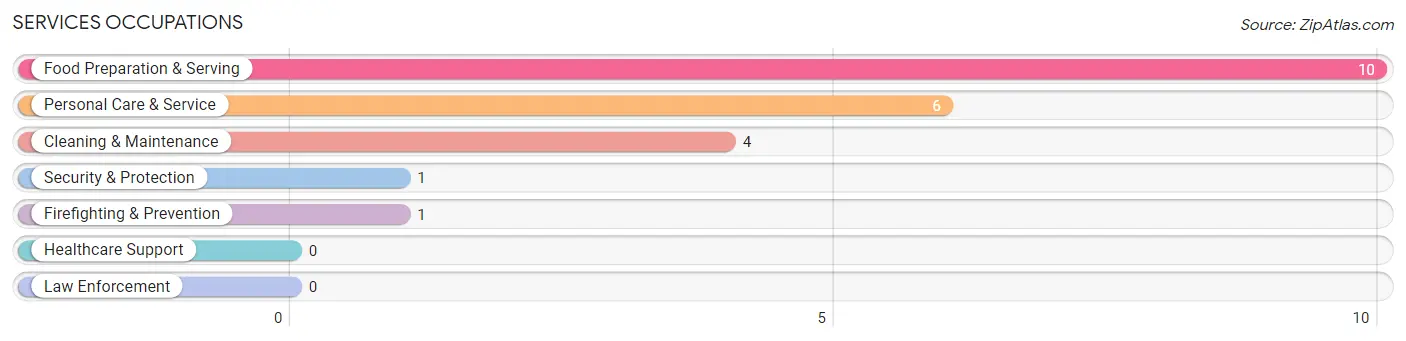
Services Occupations
The most common Services occupations in Biggsville are Food Preparation & Serving (10 | 5.5%), Personal Care & Service (6 | 3.3%), Cleaning & Maintenance (4 | 2.2%), Security & Protection (1 | 0.5%), and Firefighting & Prevention (1 | 0.5%).
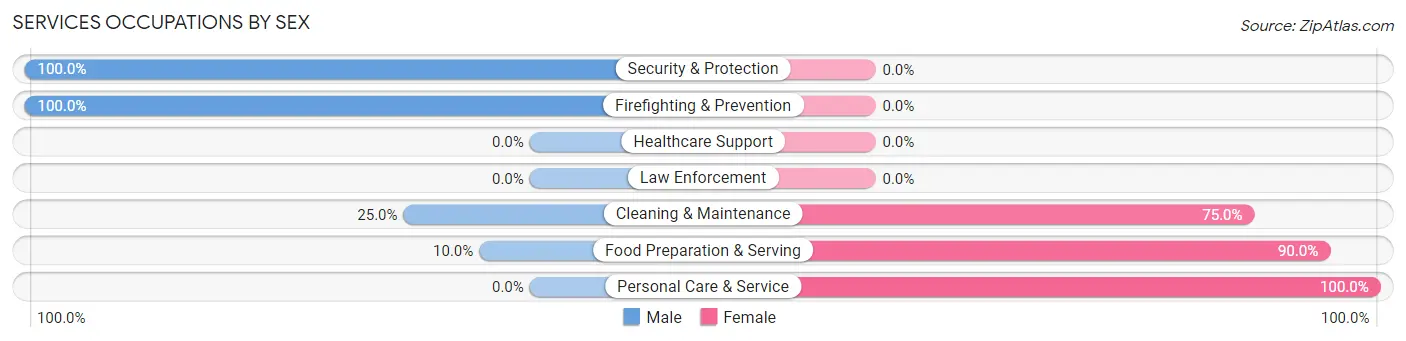
Services Occupations by Sex
Within the Services occupations in Biggsville, the most male-oriented occupations are Security & Protection (100.0%), Firefighting & Prevention (100.0%), and Cleaning & Maintenance (25.0%), while the most female-oriented occupations are Personal Care & Service (100.0%), Food Preparation & Serving (90.0%), and Cleaning & Maintenance (75.0%).
| Occupation | Male | Female |
| Healthcare Support | 0 (0.0%) | 0 (0.0%) |
| Security & Protection | 1 (100.0%) | 0 (0.0%) |
| Firefighting & Prevention | 1 (100.0%) | 0 (0.0%) |
| Law Enforcement | 0 (0.0%) | 0 (0.0%) |
| Food Preparation & Serving | 1 (10.0%) | 9 (90.0%) |
| Cleaning & Maintenance | 1 (25.0%) | 3 (75.0%) |
| Personal Care & Service | 0 (0.0%) | 6 (100.0%) |
| Total (Category) | 3 (14.3%) | 18 (85.7%) |
| Total (Overall) | 97 (53.6%) | 84 (46.4%) |
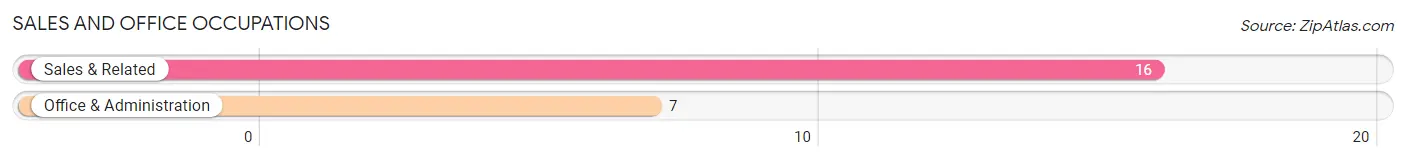
Sales and Office Occupations
The most common Sales and Office occupations in Biggsville are Sales & Related (16 | 8.8%), and Office & Administration (7 | 3.9%).
Sales and Office Occupations by Sex
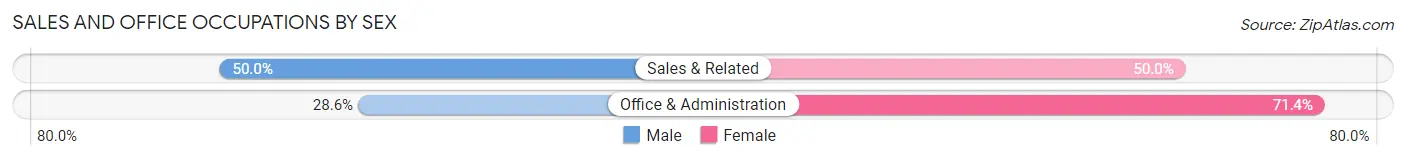
| Occupation | Male | Female |
| Sales & Related | 8 (50.0%) | 8 (50.0%) |
| Office & Administration | 2 (28.6%) | 5 (71.4%) |
| Total (Category) | 10 (43.5%) | 13 (56.5%) |
| Total (Overall) | 97 (53.6%) | 84 (46.4%) |
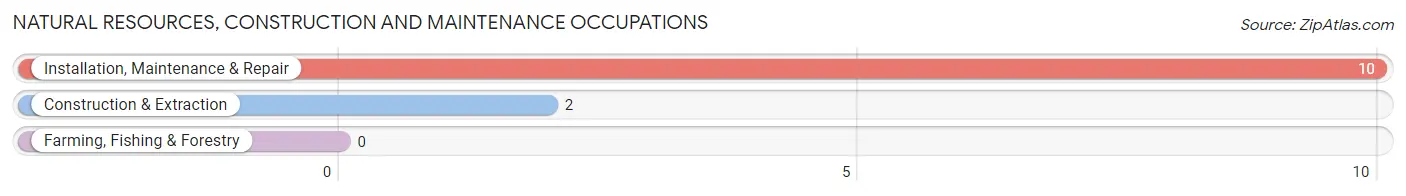
Natural Resources, Construction and Maintenance Occupations
The most common Natural Resources, Construction and Maintenance occupations in Biggsville are Installation, Maintenance & Repair (10 | 5.5%), and Construction & Extraction (2 | 1.1%).
Natural Resources, Construction and Maintenance Occupations by Sex
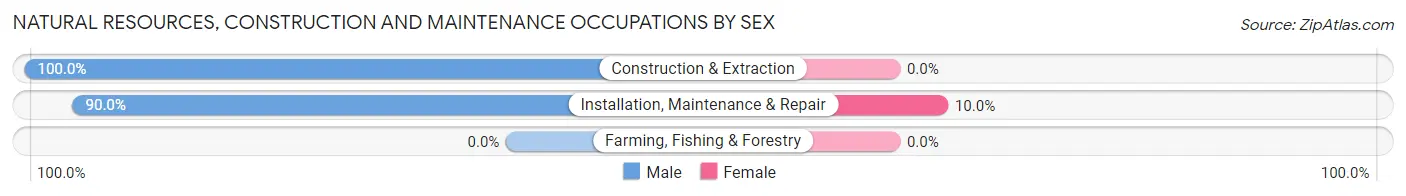
| Occupation | Male | Female |
| Farming, Fishing & Forestry | 0 (0.0%) | 0 (0.0%) |
| Construction & Extraction | 2 (100.0%) | 0 (0.0%) |
| Installation, Maintenance & Repair | 9 (90.0%) | 1 (10.0%) |
| Total (Category) | 11 (91.7%) | 1 (8.3%) |
| Total (Overall) | 97 (53.6%) | 84 (46.4%) |
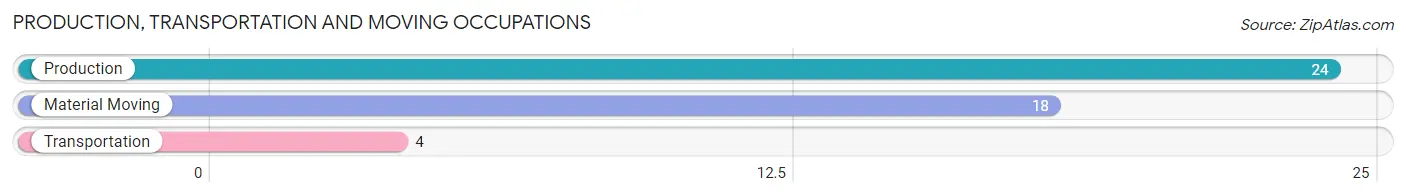
Production, Transportation and Moving Occupations
The most common Production, Transportation and Moving occupations in Biggsville are Production (24 | 13.3%), Material Moving (18 | 9.9%), and Transportation (4 | 2.2%).
Production, Transportation and Moving Occupations by Sex
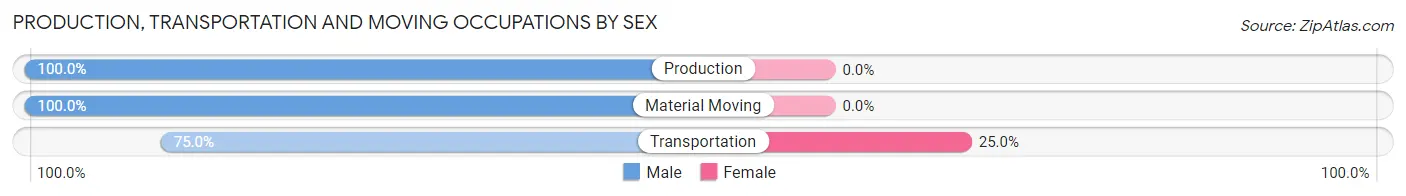
| Occupation | Male | Female |
| Production | 24 (100.0%) | 0 (0.0%) |
| Transportation | 3 (75.0%) | 1 (25.0%) |
| Material Moving | 18 (100.0%) | 0 (0.0%) |
| Total (Category) | 45 (97.8%) | 1 (2.2%) |
| Total (Overall) | 97 (53.6%) | 84 (46.4%) |
Employment Industries by Sex in Biggsville
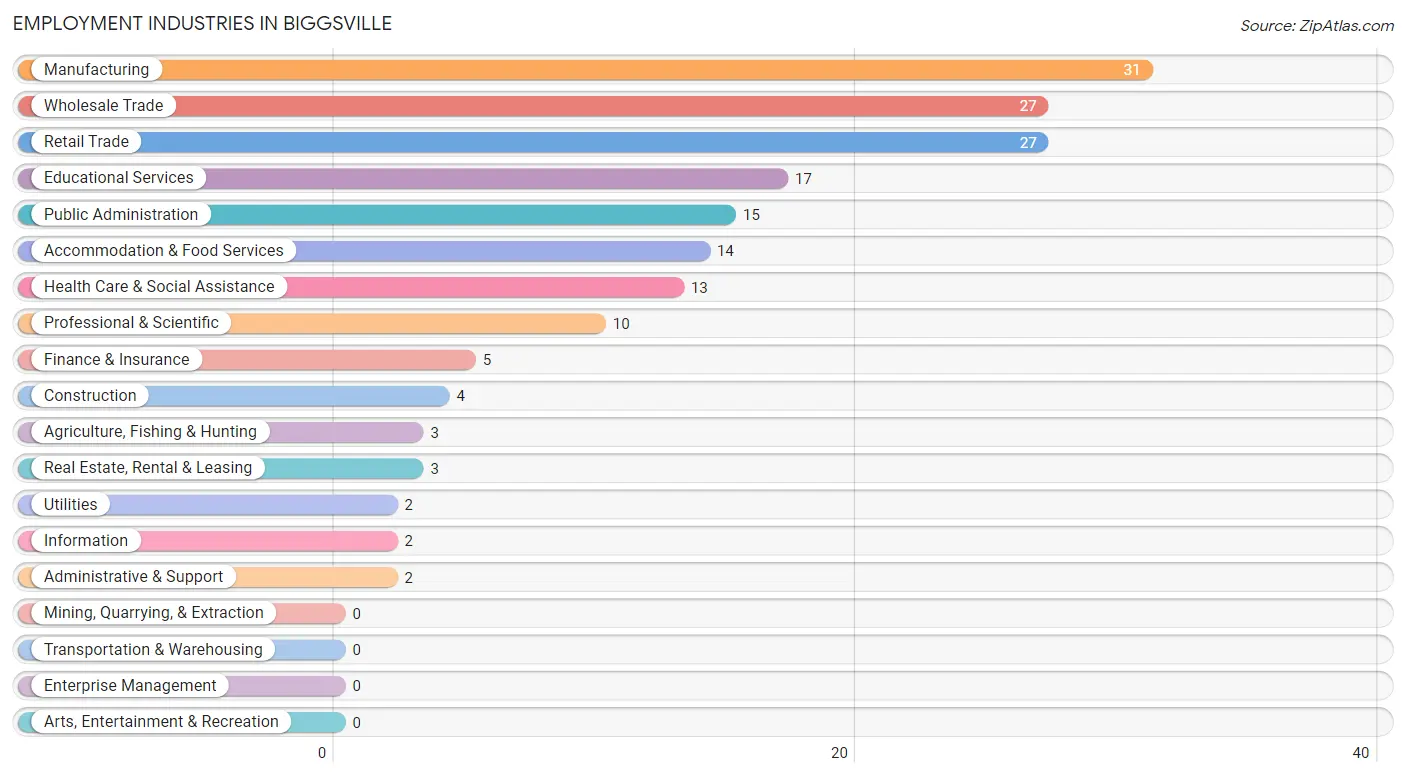
Employment Industries in Biggsville
The major employment industries in Biggsville include Manufacturing (31 | 17.1%), Wholesale Trade (27 | 14.9%), Retail Trade (27 | 14.9%), Educational Services (17 | 9.4%), and Public Administration (15 | 8.3%).
Employment Industries by Sex in Biggsville
The Biggsville industries that see more men than women are Agriculture, Fishing & Hunting (100.0%), Construction (100.0%), and Utilities (100.0%), whereas the industries that tend to have a higher number of women are Information (100.0%), Real Estate, Rental & Leasing (100.0%), and Health Care & Social Assistance (100.0%).
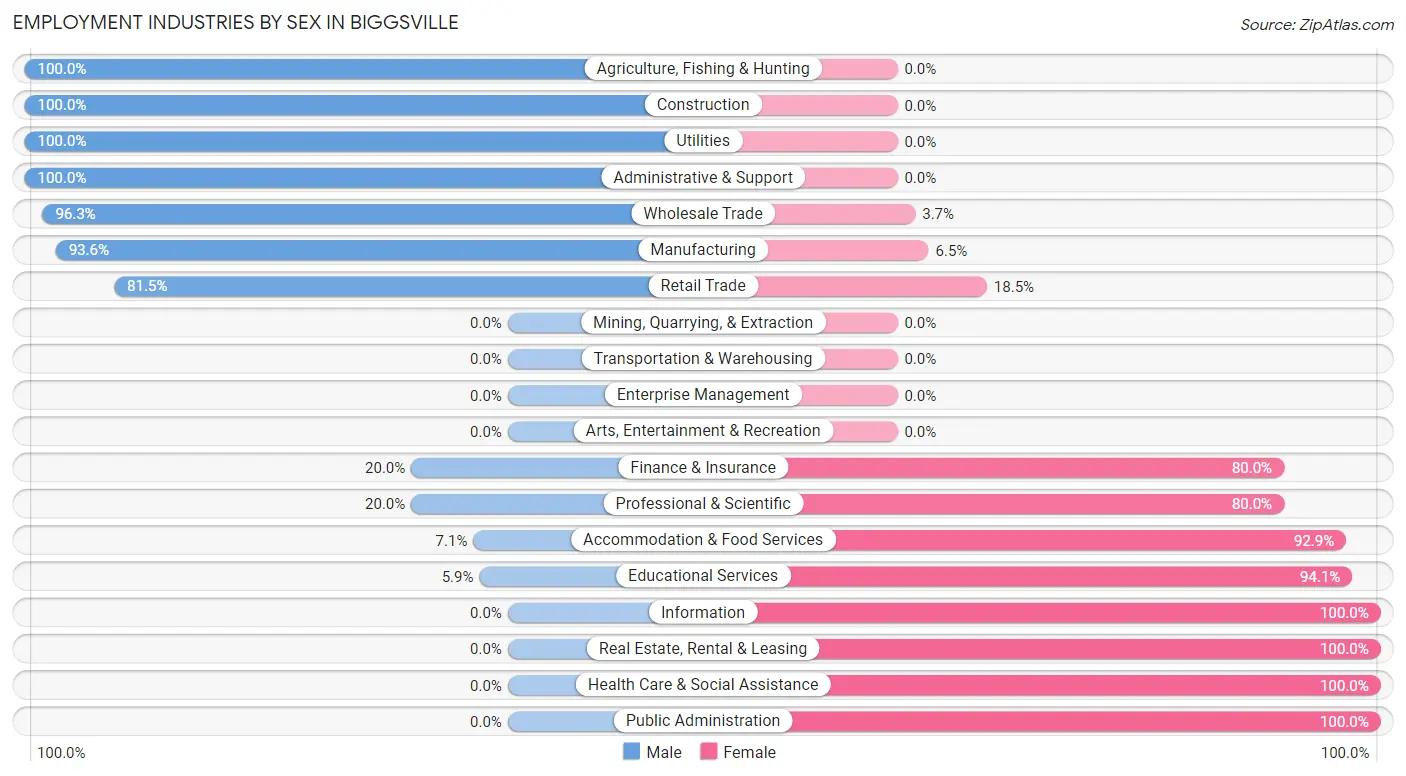
| Industry | Male | Female |
| Agriculture, Fishing & Hunting | 3 (100.0%) | 0 (0.0%) |
| Mining, Quarrying, & Extraction | 0 (0.0%) | 0 (0.0%) |
| Construction | 4 (100.0%) | 0 (0.0%) |
| Manufacturing | 29 (93.5%) | 2 (6.5%) |
| Wholesale Trade | 26 (96.3%) | 1 (3.7%) |
| Retail Trade | 22 (81.5%) | 5 (18.5%) |
| Transportation & Warehousing | 0 (0.0%) | 0 (0.0%) |
| Utilities | 2 (100.0%) | 0 (0.0%) |
| Information | 0 (0.0%) | 2 (100.0%) |
| Finance & Insurance | 1 (20.0%) | 4 (80.0%) |
| Real Estate, Rental & Leasing | 0 (0.0%) | 3 (100.0%) |
| Professional & Scientific | 2 (20.0%) | 8 (80.0%) |
| Enterprise Management | 0 (0.0%) | 0 (0.0%) |
| Administrative & Support | 2 (100.0%) | 0 (0.0%) |
| Educational Services | 1 (5.9%) | 16 (94.1%) |
| Health Care & Social Assistance | 0 (0.0%) | 13 (100.0%) |
| Arts, Entertainment & Recreation | 0 (0.0%) | 0 (0.0%) |
| Accommodation & Food Services | 1 (7.1%) | 13 (92.9%) |
| Public Administration | 0 (0.0%) | 15 (100.0%) |
| Total | 97 (53.6%) | 84 (46.4%) |
Education in Biggsville
School Enrollment in Biggsville
The most common levels of schooling among the 52 students in Biggsville are high school (17 | 32.7%), elementary school (15 | 28.8%), and college / undergraduate (10 | 19.2%).
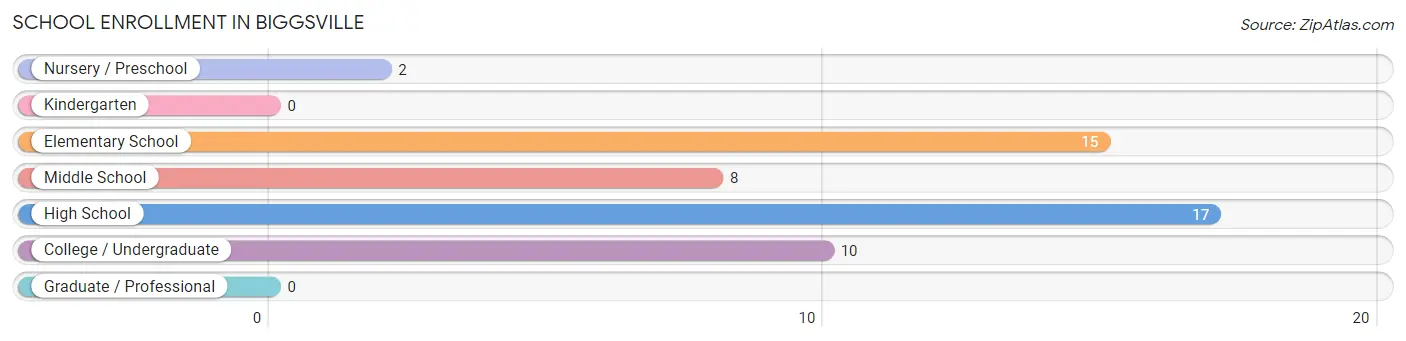
| School Level | # Students | % Students |
| Nursery / Preschool | 2 | 3.8% |
| Kindergarten | 0 | 0.0% |
| Elementary School | 15 | 28.8% |
| Middle School | 8 | 15.4% |
| High School | 17 | 32.7% |
| College / Undergraduate | 10 | 19.2% |
| Graduate / Professional | 0 | 0.0% |
| Total | 52 | 100.0% |
School Enrollment by Age by Funding Source in Biggsville
Out of a total of 52 students who are enrolled in schools in Biggsville, 5 (9.6%) attend a private institution, while the remaining 47 (90.4%) are enrolled in public schools. The age group of 15 to 17 year olds has the highest likelihood of being enrolled in private schools, with 3 (23.1% in the age bracket) enrolled. Conversely, the age group of 18 to 19 year olds has the lowest likelihood of being enrolled in a private school, with 11 (100.0% in the age bracket) attending a public institution.
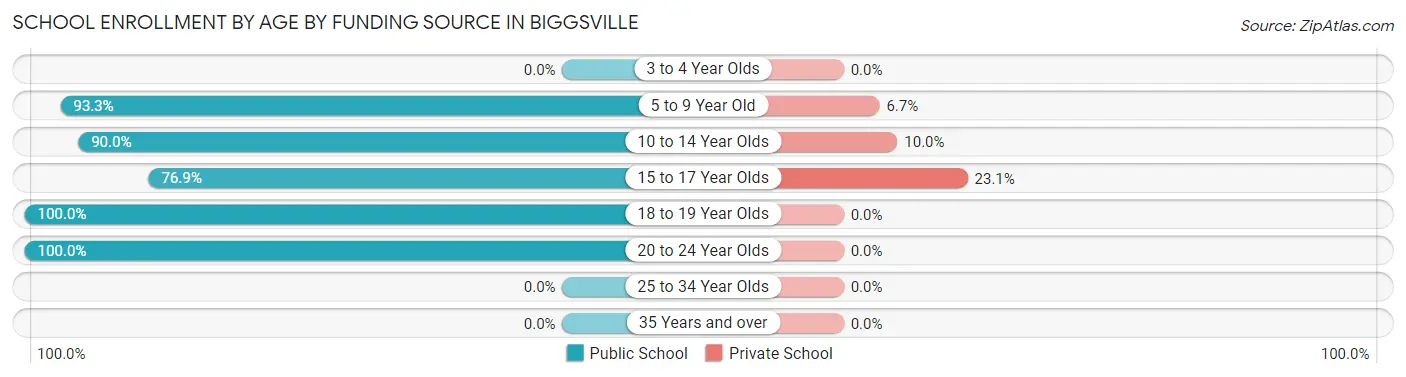
| Age Bracket | Public School | Private School |
| 3 to 4 Year Olds | 0 (0.0%) | 0 (0.0%) |
| 5 to 9 Year Old | 14 (93.3%) | 1 (6.7%) |
| 10 to 14 Year Olds | 9 (90.0%) | 1 (10.0%) |
| 15 to 17 Year Olds | 10 (76.9%) | 3 (23.1%) |
| 18 to 19 Year Olds | 11 (100.0%) | 0 (0.0%) |
| 20 to 24 Year Olds | 3 (100.0%) | 0 (0.0%) |
| 25 to 34 Year Olds | 0 (0.0%) | 0 (0.0%) |
| 35 Years and over | 0 (0.0%) | 0 (0.0%) |
| Total | 47 (90.4%) | 5 (9.6%) |
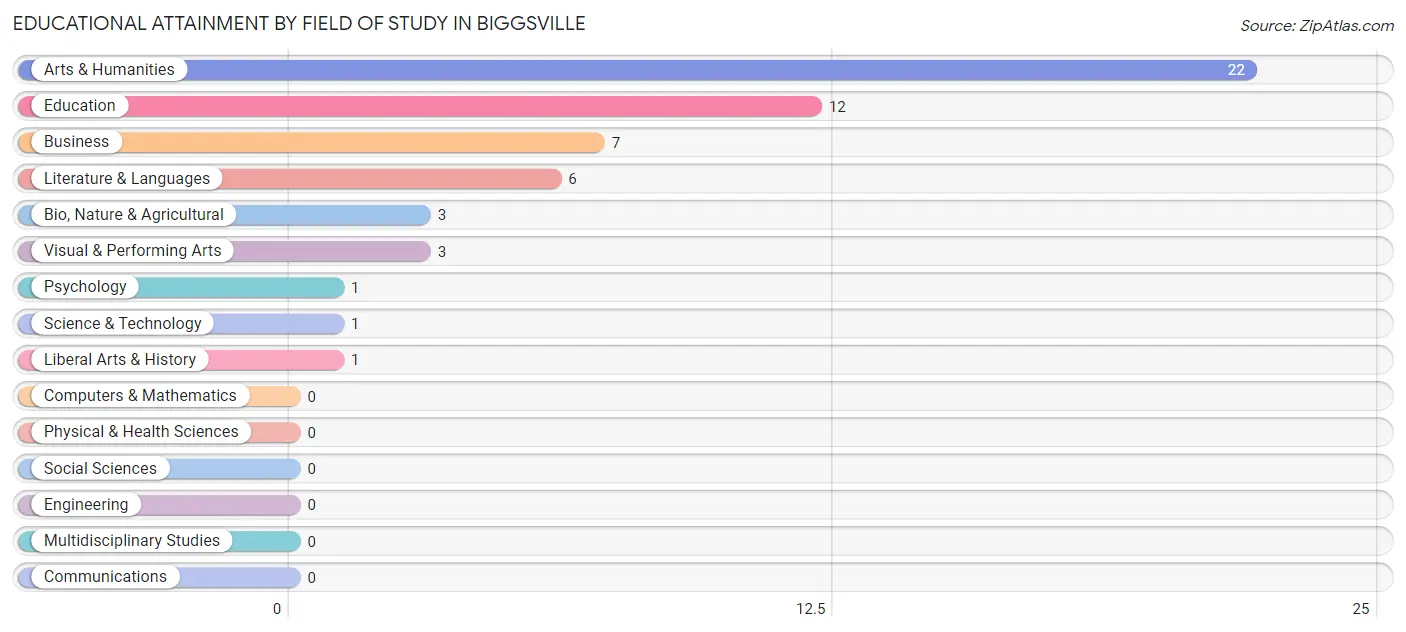
Educational Attainment by Field of Study in Biggsville
Arts & humanities (22 | 39.3%), education (12 | 21.4%), business (7 | 12.5%), literature & languages (6 | 10.7%), and bio, nature & agricultural (3 | 5.4%) are the most common fields of study among 56 individuals in Biggsville who have obtained a bachelor's degree or higher.
| Field of Study | # Graduates | % Graduates |
| Computers & Mathematics | 0 | 0.0% |
| Bio, Nature & Agricultural | 3 | 5.4% |
| Physical & Health Sciences | 0 | 0.0% |
| Psychology | 1 | 1.8% |
| Social Sciences | 0 | 0.0% |
| Engineering | 0 | 0.0% |
| Multidisciplinary Studies | 0 | 0.0% |
| Science & Technology | 1 | 1.8% |
| Business | 7 | 12.5% |
| Education | 12 | 21.4% |
| Literature & Languages | 6 | 10.7% |
| Liberal Arts & History | 1 | 1.8% |
| Visual & Performing Arts | 3 | 5.4% |
| Communications | 0 | 0.0% |
| Arts & Humanities | 22 | 39.3% |
| Total | 56 | 100.0% |
Transportation & Commute in Biggsville
Vehicle Availability by Sex in Biggsville
The most prevalent vehicle ownership categories in Biggsville are males with 5 or more vehicles (35, accounting for 36.1%) and females with 5 or more vehicles (14, making up 41.7%).
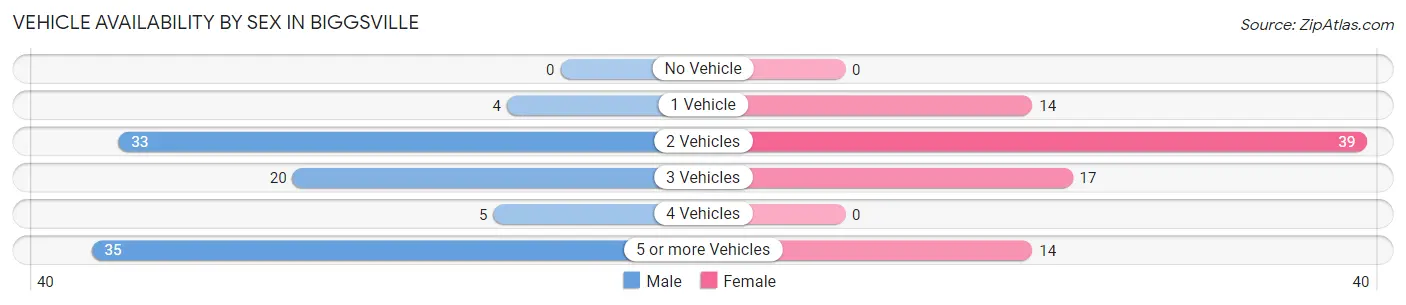
| Vehicles Available | Male | Female |
| No Vehicle | 0 (0.0%) | 0 (0.0%) |
| 1 Vehicle | 4 (4.1%) | 14 (16.7%) |
| 2 Vehicles | 33 (34.0%) | 39 (46.4%) |
| 3 Vehicles | 20 (20.6%) | 17 (20.2%) |
| 4 Vehicles | 5 (5.1%) | 0 (0.0%) |
| 5 or more Vehicles | 35 (36.1%) | 14 (16.7%) |
| Total | 97 (100.0%) | 84 (100.0%) |
Commute Time in Biggsville
The most frequently occuring commute durations in Biggsville are 5 to 9 minutes (39 commuters, 22.0%), 25 to 29 minutes (34 commuters, 19.2%), and 60 to 89 minutes (32 commuters, 18.1%).
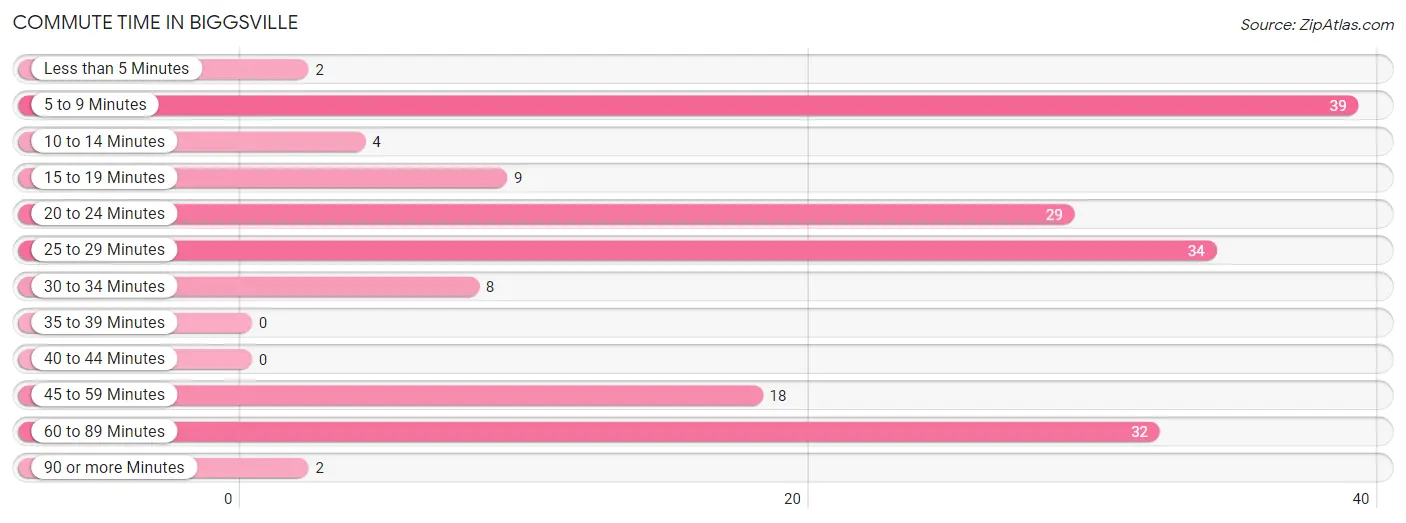
| Commute Time | # Commuters | % Commuters |
| Less than 5 Minutes | 2 | 1.1% |
| 5 to 9 Minutes | 39 | 22.0% |
| 10 to 14 Minutes | 4 | 2.3% |
| 15 to 19 Minutes | 9 | 5.1% |
| 20 to 24 Minutes | 29 | 16.4% |
| 25 to 29 Minutes | 34 | 19.2% |
| 30 to 34 Minutes | 8 | 4.5% |
| 35 to 39 Minutes | 0 | 0.0% |
| 40 to 44 Minutes | 0 | 0.0% |
| 45 to 59 Minutes | 18 | 10.2% |
| 60 to 89 Minutes | 32 | 18.1% |
| 90 or more Minutes | 2 | 1.1% |
Commute Time by Sex in Biggsville
The most common commute times in Biggsville are 5 to 9 minutes (25 commuters, 25.8%) for males and 25 to 29 minutes (17 commuters, 21.2%) for females.
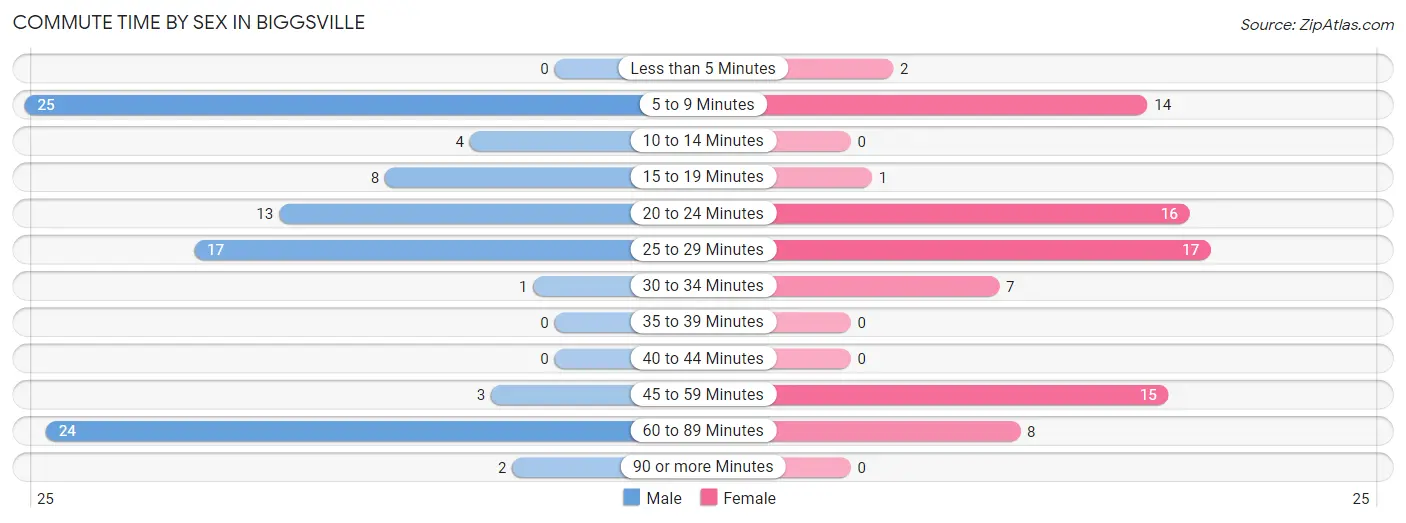
| Commute Time | Male | Female |
| Less than 5 Minutes | 0 (0.0%) | 2 (2.5%) |
| 5 to 9 Minutes | 25 (25.8%) | 14 (17.5%) |
| 10 to 14 Minutes | 4 (4.1%) | 0 (0.0%) |
| 15 to 19 Minutes | 8 (8.3%) | 1 (1.3%) |
| 20 to 24 Minutes | 13 (13.4%) | 16 (20.0%) |
| 25 to 29 Minutes | 17 (17.5%) | 17 (21.2%) |
| 30 to 34 Minutes | 1 (1.0%) | 7 (8.7%) |
| 35 to 39 Minutes | 0 (0.0%) | 0 (0.0%) |
| 40 to 44 Minutes | 0 (0.0%) | 0 (0.0%) |
| 45 to 59 Minutes | 3 (3.1%) | 15 (18.8%) |
| 60 to 89 Minutes | 24 (24.7%) | 8 (10.0%) |
| 90 or more Minutes | 2 (2.1%) | 0 (0.0%) |
Time of Departure to Work by Sex in Biggsville
The most frequent times of departure to work in Biggsville are 5:00 AM to 5:29 AM (42, 43.3%) for males and 7:30 AM to 7:59 AM (19, 23.7%) for females.
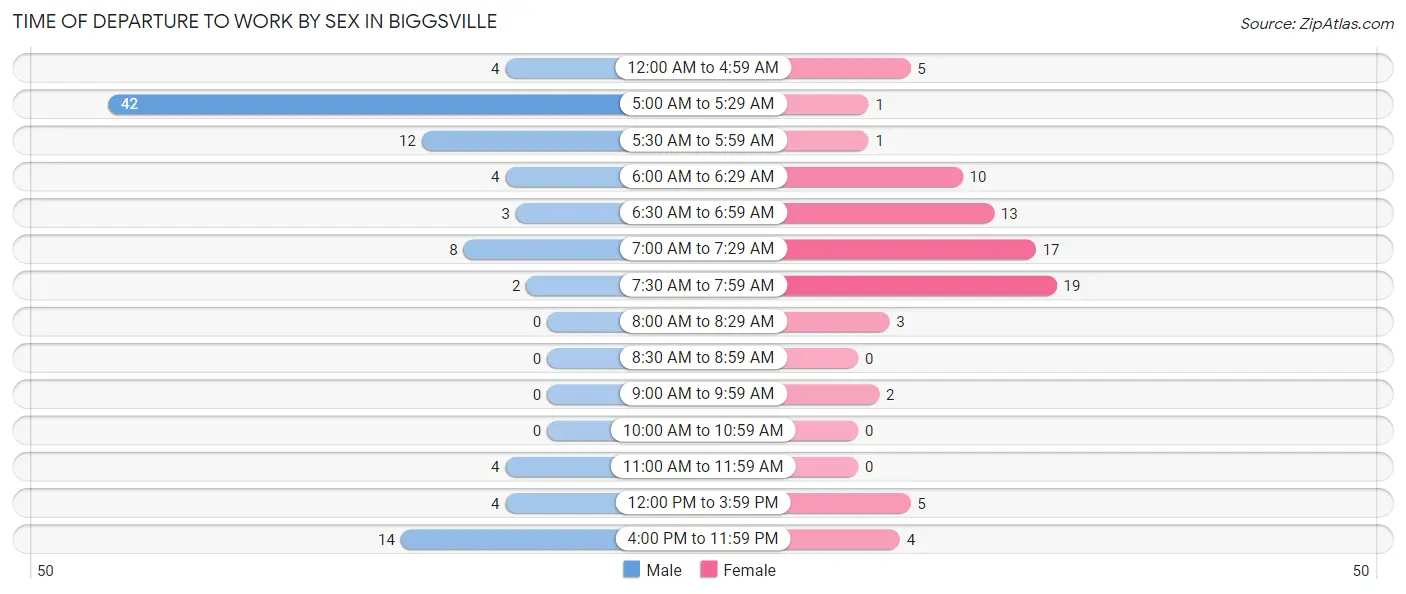
| Time of Departure | Male | Female |
| 12:00 AM to 4:59 AM | 4 (4.1%) | 5 (6.2%) |
| 5:00 AM to 5:29 AM | 42 (43.3%) | 1 (1.3%) |
| 5:30 AM to 5:59 AM | 12 (12.4%) | 1 (1.3%) |
| 6:00 AM to 6:29 AM | 4 (4.1%) | 10 (12.5%) |
| 6:30 AM to 6:59 AM | 3 (3.1%) | 13 (16.3%) |
| 7:00 AM to 7:29 AM | 8 (8.3%) | 17 (21.2%) |
| 7:30 AM to 7:59 AM | 2 (2.1%) | 19 (23.7%) |
| 8:00 AM to 8:29 AM | 0 (0.0%) | 3 (3.7%) |
| 8:30 AM to 8:59 AM | 0 (0.0%) | 0 (0.0%) |
| 9:00 AM to 9:59 AM | 0 (0.0%) | 2 (2.5%) |
| 10:00 AM to 10:59 AM | 0 (0.0%) | 0 (0.0%) |
| 11:00 AM to 11:59 AM | 4 (4.1%) | 0 (0.0%) |
| 12:00 PM to 3:59 PM | 4 (4.1%) | 5 (6.2%) |
| 4:00 PM to 11:59 PM | 14 (14.4%) | 4 (5.0%) |
| Total | 97 (100.0%) | 80 (100.0%) |
Housing Occupancy in Biggsville
Occupancy by Ownership in Biggsville
Of the total 146 dwellings in Biggsville, owner-occupied units account for 135 (92.5%), while renter-occupied units make up 11 (7.5%).
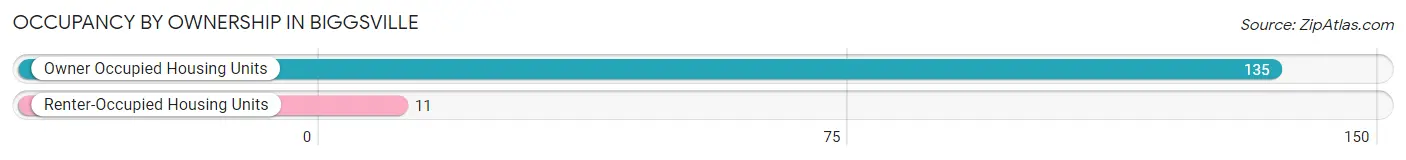
| Occupancy | # Housing Units | % Housing Units |
| Owner Occupied Housing Units | 135 | 92.5% |
| Renter-Occupied Housing Units | 11 | 7.5% |
| Total Occupied Housing Units | 146 | 100.0% |
Occupancy by Household Size in Biggsville
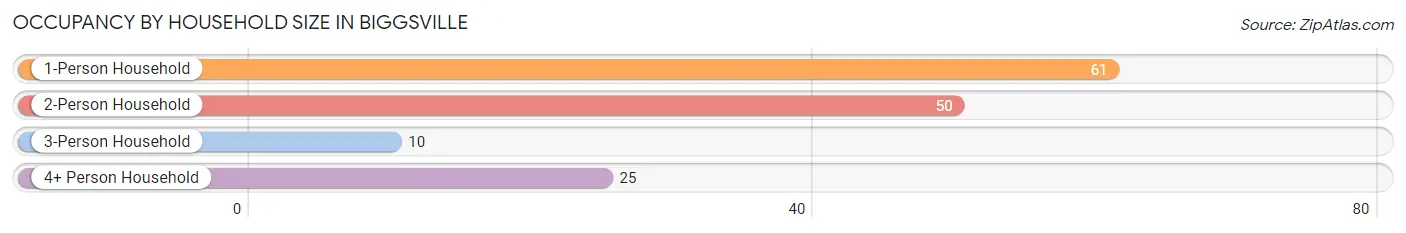
| Household Size | # Housing Units | % Housing Units |
| 1-Person Household | 61 | 41.8% |
| 2-Person Household | 50 | 34.3% |
| 3-Person Household | 10 | 6.9% |
| 4+ Person Household | 25 | 17.1% |
| Total Housing Units | 146 | 100.0% |
Occupancy by Ownership by Household Size in Biggsville
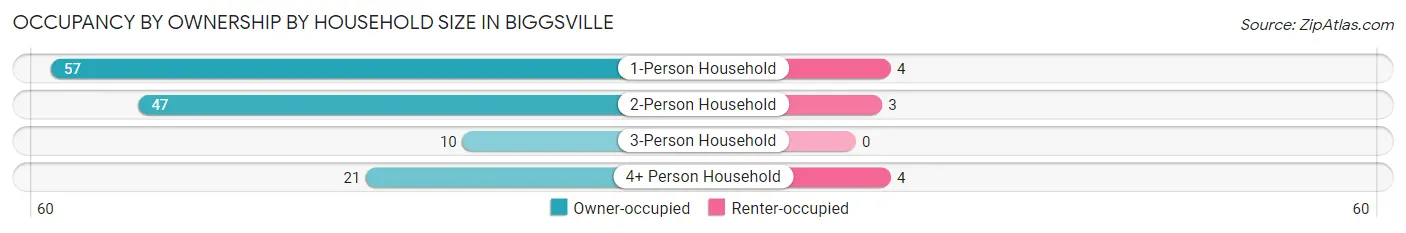
| Household Size | Owner-occupied | Renter-occupied |
| 1-Person Household | 57 (93.4%) | 4 (6.6%) |
| 2-Person Household | 47 (94.0%) | 3 (6.0%) |
| 3-Person Household | 10 (100.0%) | 0 (0.0%) |
| 4+ Person Household | 21 (84.0%) | 4 (16.0%) |
| Total Housing Units | 135 (92.5%) | 11 (7.5%) |
Occupancy by Educational Attainment in Biggsville
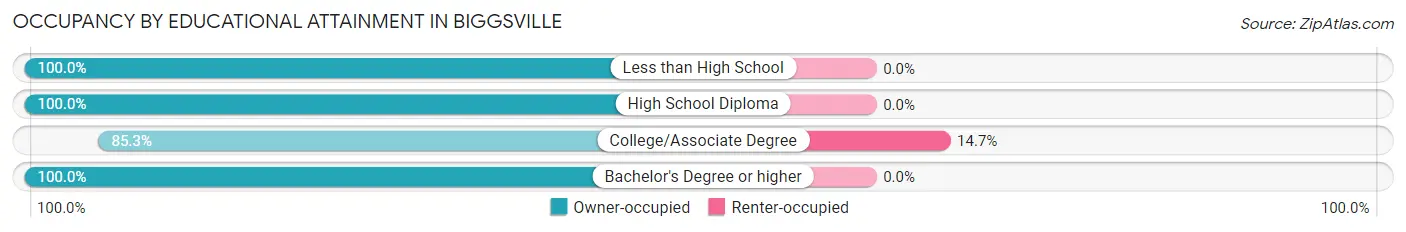
| Household Size | Owner-occupied | Renter-occupied |
| Less than High School | 5 (100.0%) | 0 (0.0%) |
| High School Diploma | 42 (100.0%) | 0 (0.0%) |
| College/Associate Degree | 64 (85.3%) | 11 (14.7%) |
| Bachelor's Degree or higher | 24 (100.0%) | 0 (0.0%) |
Occupancy by Age of Householder in Biggsville
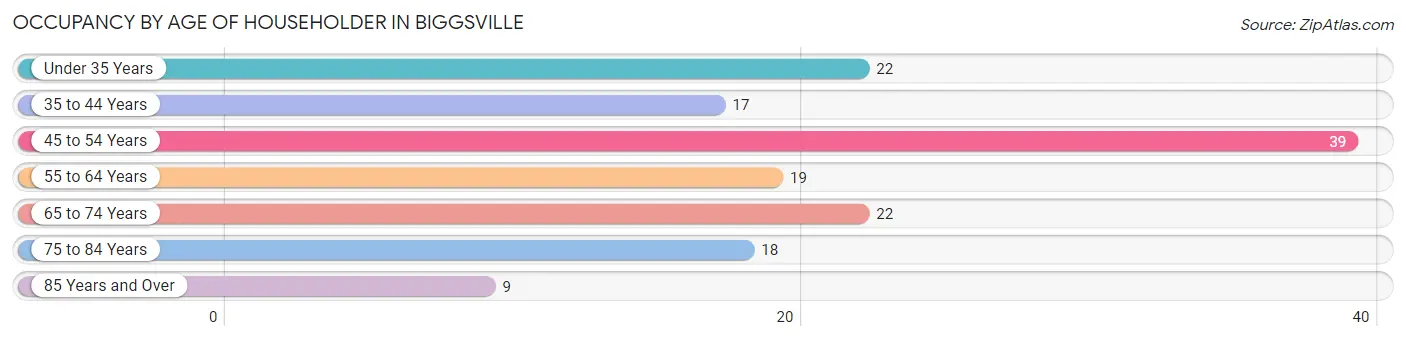
| Age Bracket | # Households | % Households |
| Under 35 Years | 22 | 15.1% |
| 35 to 44 Years | 17 | 11.6% |
| 45 to 54 Years | 39 | 26.7% |
| 55 to 64 Years | 19 | 13.0% |
| 65 to 74 Years | 22 | 15.1% |
| 75 to 84 Years | 18 | 12.3% |
| 85 Years and Over | 9 | 6.2% |
| Total | 146 | 100.0% |
Housing Finances in Biggsville
Median Income by Occupancy in Biggsville
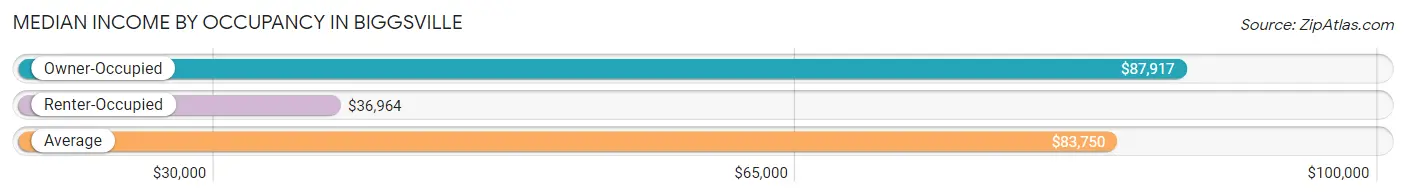
| Occupancy Type | # Households | Median Income |
| Owner-Occupied | 135 (92.5%) | $87,917 |
| Renter-Occupied | 11 (7.5%) | $36,964 |
| Average | 146 (100.0%) | $83,750 |
Occupancy by Householder Income Bracket in Biggsville
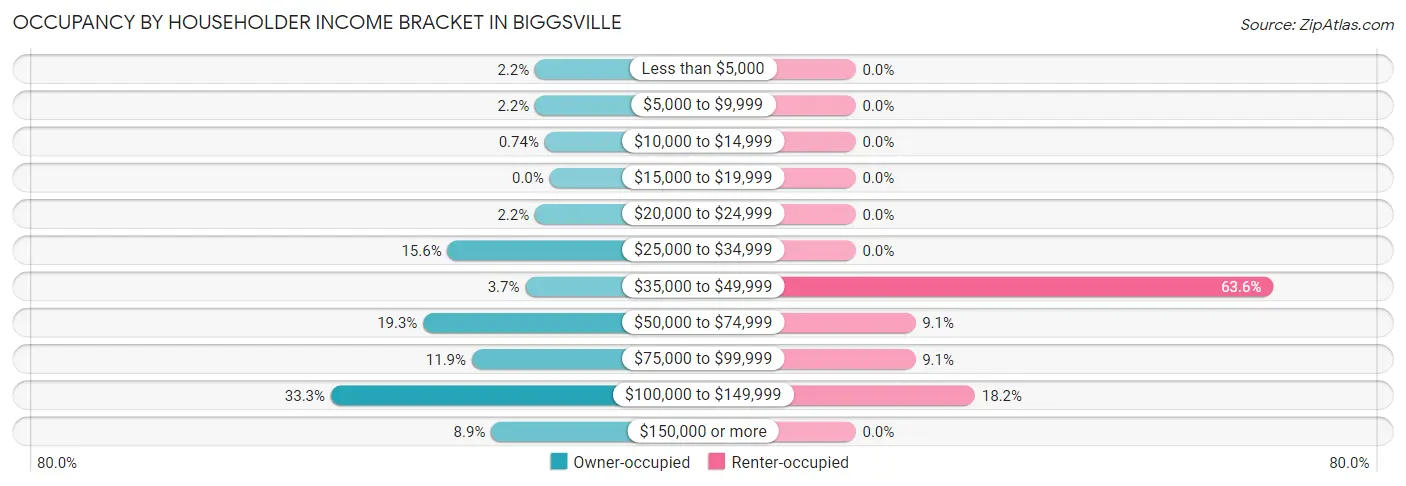
| Income Bracket | Owner-occupied | Renter-occupied |
| Less than $5,000 | 3 (2.2%) | 0 (0.0%) |
| $5,000 to $9,999 | 3 (2.2%) | 0 (0.0%) |
| $10,000 to $14,999 | 1 (0.7%) | 0 (0.0%) |
| $15,000 to $19,999 | 0 (0.0%) | 0 (0.0%) |
| $20,000 to $24,999 | 3 (2.2%) | 0 (0.0%) |
| $25,000 to $34,999 | 21 (15.6%) | 0 (0.0%) |
| $35,000 to $49,999 | 5 (3.7%) | 7 (63.6%) |
| $50,000 to $74,999 | 26 (19.3%) | 1 (9.1%) |
| $75,000 to $99,999 | 16 (11.8%) | 1 (9.1%) |
| $100,000 to $149,999 | 45 (33.3%) | 2 (18.2%) |
| $150,000 or more | 12 (8.9%) | 0 (0.0%) |
| Total | 135 (100.0%) | 11 (100.0%) |
Monthly Housing Cost Tiers in Biggsville
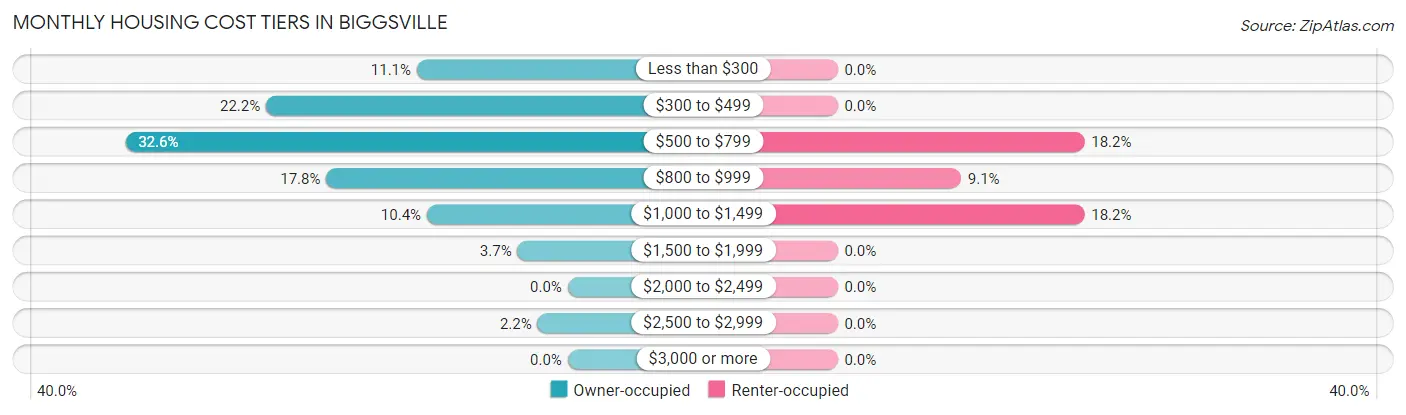
| Monthly Cost | Owner-occupied | Renter-occupied |
| Less than $300 | 15 (11.1%) | 0 (0.0%) |
| $300 to $499 | 30 (22.2%) | 0 (0.0%) |
| $500 to $799 | 44 (32.6%) | 2 (18.2%) |
| $800 to $999 | 24 (17.8%) | 1 (9.1%) |
| $1,000 to $1,499 | 14 (10.4%) | 2 (18.2%) |
| $1,500 to $1,999 | 5 (3.7%) | 0 (0.0%) |
| $2,000 to $2,499 | 0 (0.0%) | 0 (0.0%) |
| $2,500 to $2,999 | 3 (2.2%) | 0 (0.0%) |
| $3,000 or more | 0 (0.0%) | 0 (0.0%) |
| Total | 135 (100.0%) | 11 (100.0%) |
Physical Housing Characteristics in Biggsville
Housing Structures in Biggsville
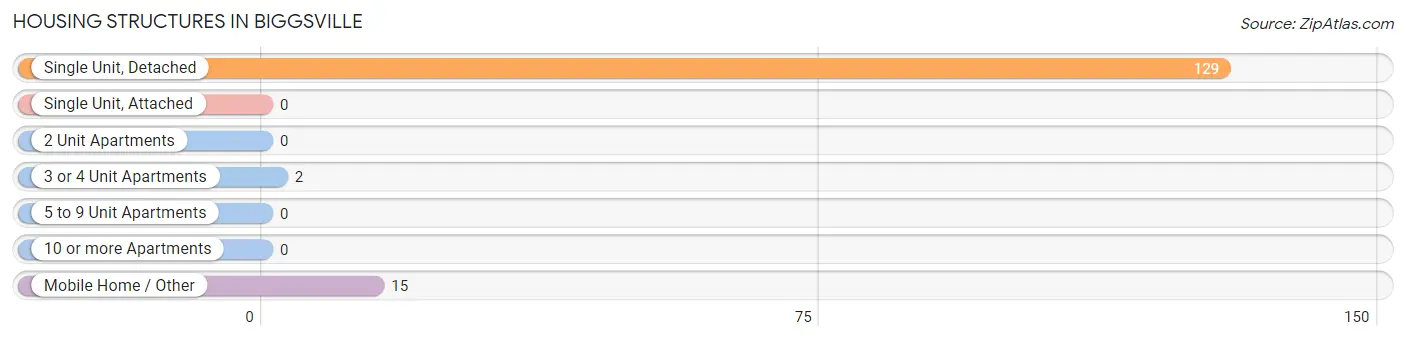
| Structure Type | # Housing Units | % Housing Units |
| Single Unit, Detached | 129 | 88.4% |
| Single Unit, Attached | 0 | 0.0% |
| 2 Unit Apartments | 0 | 0.0% |
| 3 or 4 Unit Apartments | 2 | 1.4% |
| 5 to 9 Unit Apartments | 0 | 0.0% |
| 10 or more Apartments | 0 | 0.0% |
| Mobile Home / Other | 15 | 10.3% |
| Total | 146 | 100.0% |
Housing Structures by Occupancy in Biggsville
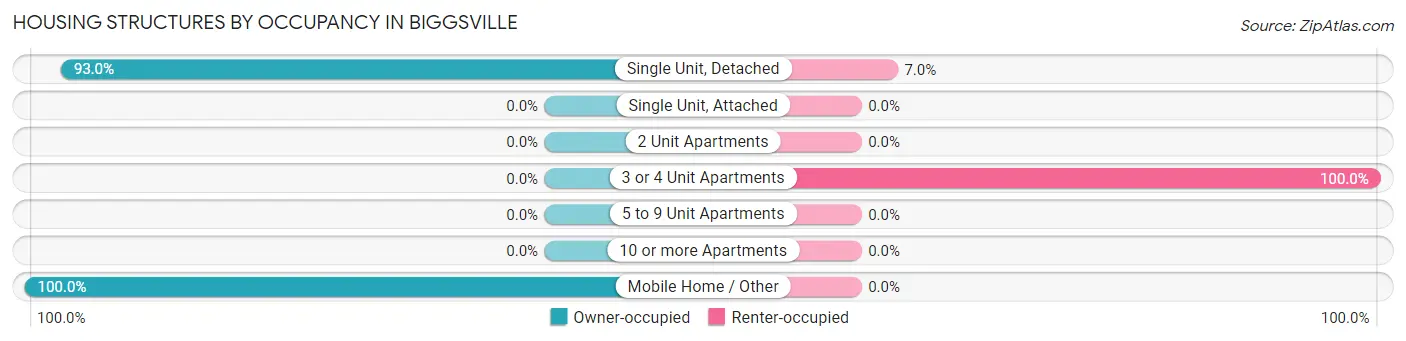
| Structure Type | Owner-occupied | Renter-occupied |
| Single Unit, Detached | 120 (93.0%) | 9 (7.0%) |
| Single Unit, Attached | 0 (0.0%) | 0 (0.0%) |
| 2 Unit Apartments | 0 (0.0%) | 0 (0.0%) |
| 3 or 4 Unit Apartments | 0 (0.0%) | 2 (100.0%) |
| 5 to 9 Unit Apartments | 0 (0.0%) | 0 (0.0%) |
| 10 or more Apartments | 0 (0.0%) | 0 (0.0%) |
| Mobile Home / Other | 15 (100.0%) | 0 (0.0%) |
| Total | 135 (92.5%) | 11 (7.5%) |
Housing Structures by Number of Rooms in Biggsville
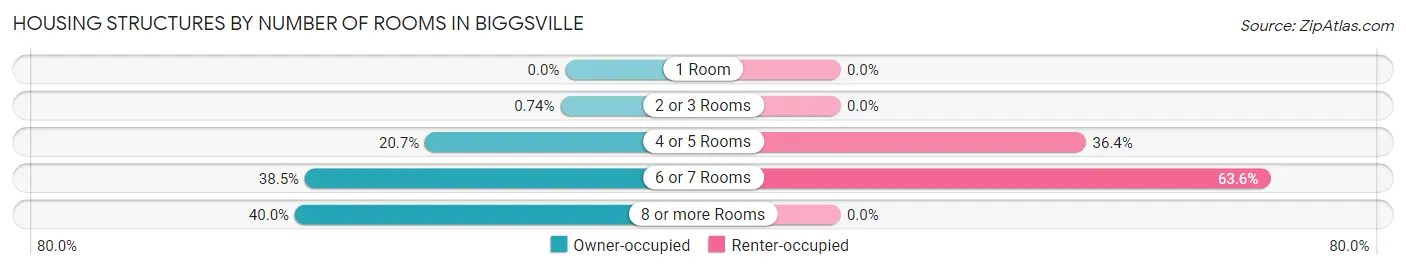
| Number of Rooms | Owner-occupied | Renter-occupied |
| 1 Room | 0 (0.0%) | 0 (0.0%) |
| 2 or 3 Rooms | 1 (0.7%) | 0 (0.0%) |
| 4 or 5 Rooms | 28 (20.7%) | 4 (36.4%) |
| 6 or 7 Rooms | 52 (38.5%) | 7 (63.6%) |
| 8 or more Rooms | 54 (40.0%) | 0 (0.0%) |
| Total | 135 (100.0%) | 11 (100.0%) |
Housing Structure by Heating Type in Biggsville
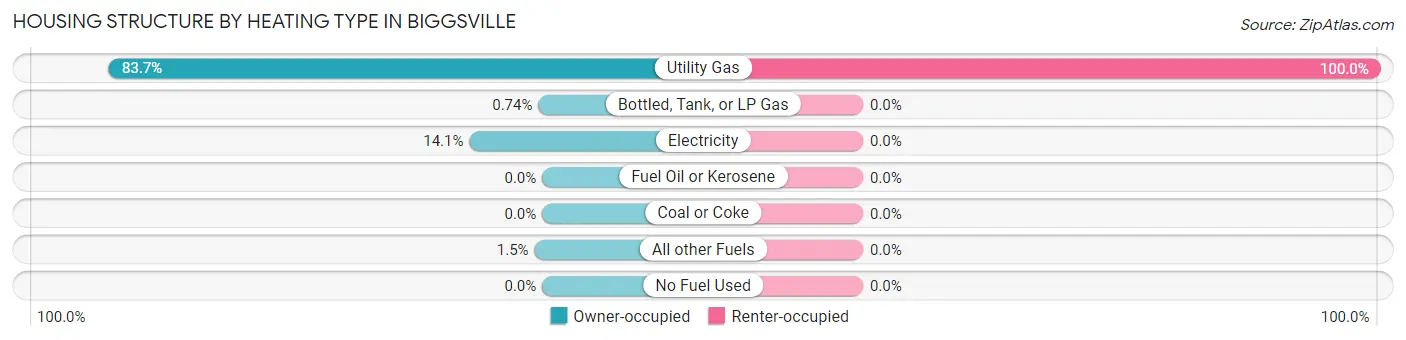
| Heating Type | Owner-occupied | Renter-occupied |
| Utility Gas | 113 (83.7%) | 11 (100.0%) |
| Bottled, Tank, or LP Gas | 1 (0.7%) | 0 (0.0%) |
| Electricity | 19 (14.1%) | 0 (0.0%) |
| Fuel Oil or Kerosene | 0 (0.0%) | 0 (0.0%) |
| Coal or Coke | 0 (0.0%) | 0 (0.0%) |
| All other Fuels | 2 (1.5%) | 0 (0.0%) |
| No Fuel Used | 0 (0.0%) | 0 (0.0%) |
| Total | 135 (100.0%) | 11 (100.0%) |
Household Vehicle Usage in Biggsville
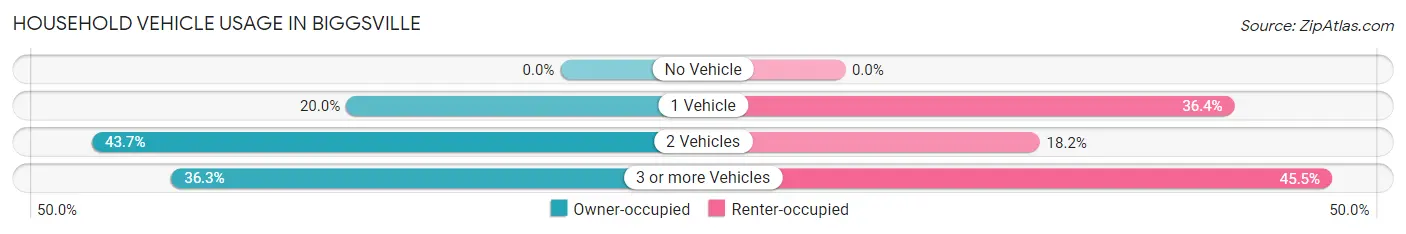
| Vehicles per Household | Owner-occupied | Renter-occupied |
| No Vehicle | 0 (0.0%) | 0 (0.0%) |
| 1 Vehicle | 27 (20.0%) | 4 (36.4%) |
| 2 Vehicles | 59 (43.7%) | 2 (18.2%) |
| 3 or more Vehicles | 49 (36.3%) | 5 (45.5%) |
| Total | 135 (100.0%) | 11 (100.0%) |
Real Estate & Mortgages in Biggsville
Real Estate and Mortgage Overview in Biggsville
| Characteristic | Without Mortgage | With Mortgage |
| Housing Units | 87 | 48 |
| Median Property Value | $74,800 | $88,300 |
| Median Household Income | $96,250 | $0 |
| Monthly Housing Costs | $496 | $0 |
| Real Estate Taxes | $1,571 | $1 |
Property Value by Mortgage Status in Biggsville
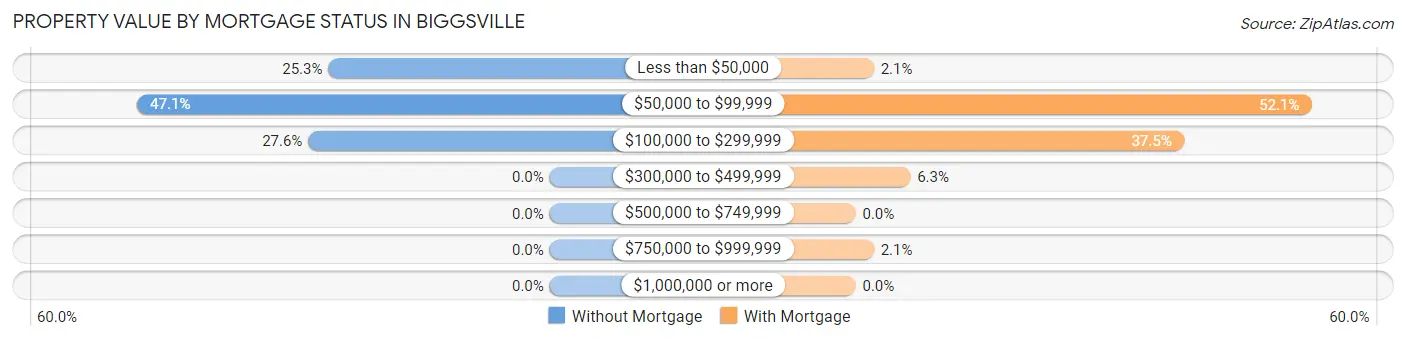
| Property Value | Without Mortgage | With Mortgage |
| Less than $50,000 | 22 (25.3%) | 1 (2.1%) |
| $50,000 to $99,999 | 41 (47.1%) | 25 (52.1%) |
| $100,000 to $299,999 | 24 (27.6%) | 18 (37.5%) |
| $300,000 to $499,999 | 0 (0.0%) | 3 (6.2%) |
| $500,000 to $749,999 | 0 (0.0%) | 0 (0.0%) |
| $750,000 to $999,999 | 0 (0.0%) | 1 (2.1%) |
| $1,000,000 or more | 0 (0.0%) | 0 (0.0%) |
| Total | 87 (100.0%) | 48 (100.0%) |
Household Income by Mortgage Status in Biggsville
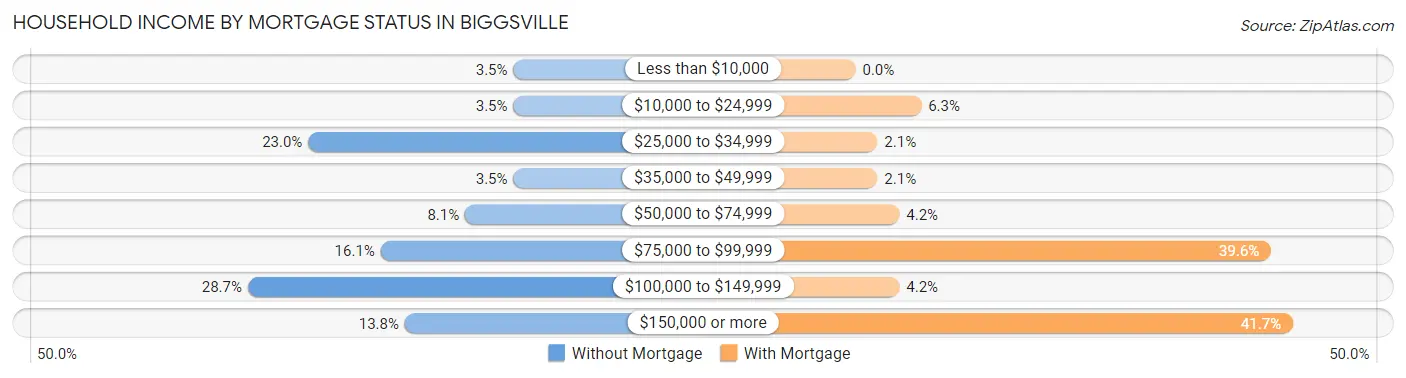
| Household Income | Without Mortgage | With Mortgage |
| Less than $10,000 | 3 (3.5%) | 0 (0.0%) |
| $10,000 to $24,999 | 3 (3.5%) | 3 (6.2%) |
| $25,000 to $34,999 | 20 (23.0%) | 1 (2.1%) |
| $35,000 to $49,999 | 3 (3.5%) | 1 (2.1%) |
| $50,000 to $74,999 | 7 (8.1%) | 2 (4.2%) |
| $75,000 to $99,999 | 14 (16.1%) | 19 (39.6%) |
| $100,000 to $149,999 | 25 (28.7%) | 2 (4.2%) |
| $150,000 or more | 12 (13.8%) | 20 (41.7%) |
| Total | 87 (100.0%) | 48 (100.0%) |
Property Value to Household Income Ratio in Biggsville
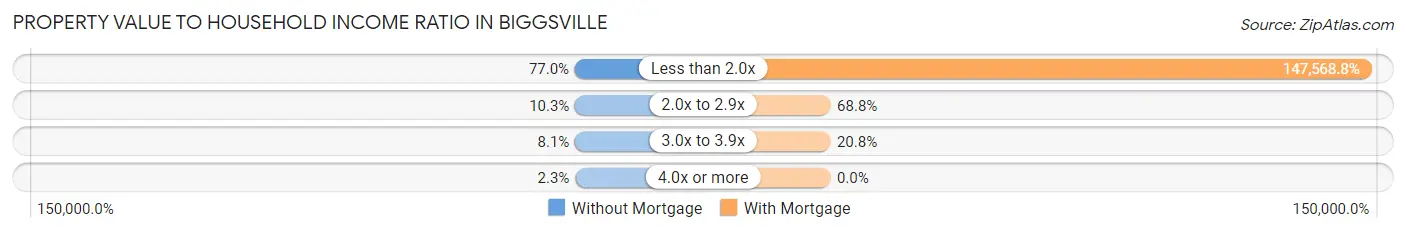
| Value-to-Income Ratio | Without Mortgage | With Mortgage |
| Less than 2.0x | 67 (77.0%) | 70,833 (147,568.8%) |
| 2.0x to 2.9x | 9 (10.3%) | 33 (68.8%) |
| 3.0x to 3.9x | 7 (8.1%) | 10 (20.8%) |
| 4.0x or more | 2 (2.3%) | 0 (0.0%) |
| Total | 87 (100.0%) | 48 (100.0%) |
Real Estate Taxes by Mortgage Status in Biggsville
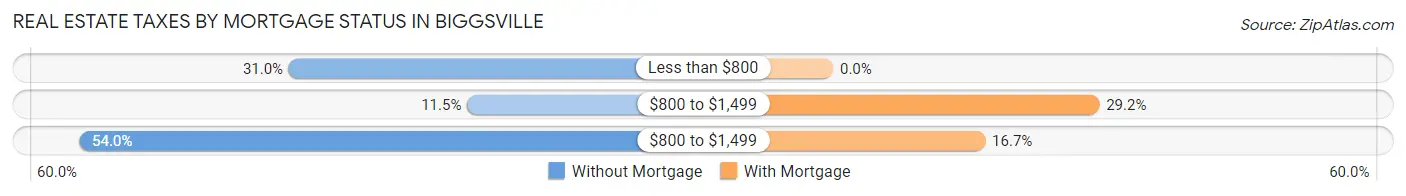
| Property Taxes | Without Mortgage | With Mortgage |
| Less than $800 | 27 (31.0%) | 0 (0.0%) |
| $800 to $1,499 | 10 (11.5%) | 14 (29.2%) |
| $800 to $1,499 | 47 (54.0%) | 8 (16.7%) |
| Total | 87 (100.0%) | 48 (100.0%) |
Health & Disability in Biggsville
Health Insurance Coverage by Age in Biggsville
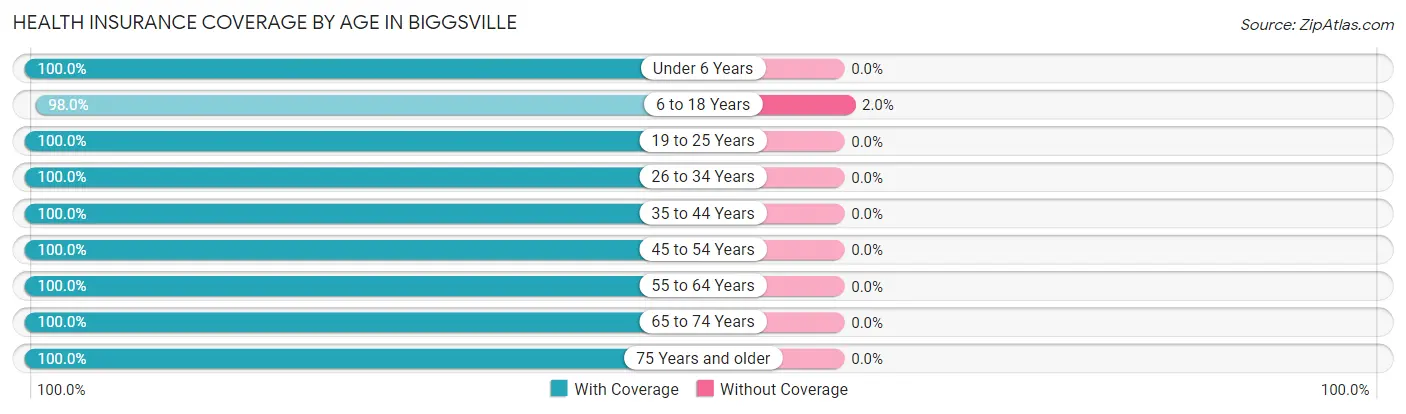
| Age Bracket | With Coverage | Without Coverage |
| Under 6 Years | 14 (100.0%) | 0 (0.0%) |
| 6 to 18 Years | 49 (98.0%) | 1 (2.0%) |
| 19 to 25 Years | 26 (100.0%) | 0 (0.0%) |
| 26 to 34 Years | 36 (100.0%) | 0 (0.0%) |
| 35 to 44 Years | 27 (100.0%) | 0 (0.0%) |
| 45 to 54 Years | 51 (100.0%) | 0 (0.0%) |
| 55 to 64 Years | 29 (100.0%) | 0 (0.0%) |
| 65 to 74 Years | 36 (100.0%) | 0 (0.0%) |
| 75 Years and older | 42 (100.0%) | 0 (0.0%) |
| Total | 310 (99.7%) | 1 (0.3%) |
Health Insurance Coverage by Citizenship Status in Biggsville
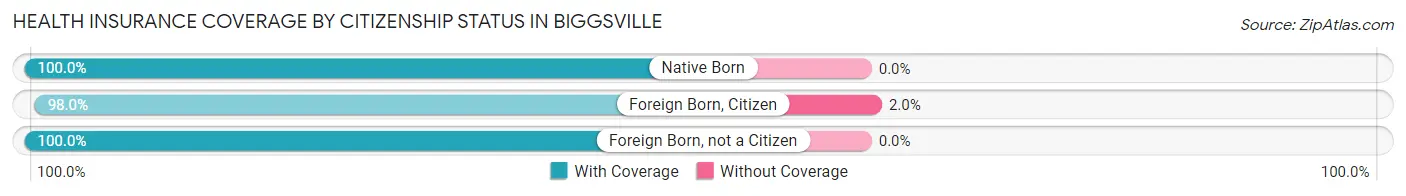
| Citizenship Status | With Coverage | Without Coverage |
| Native Born | 14 (100.0%) | 0 (0.0%) |
| Foreign Born, Citizen | 49 (98.0%) | 1 (2.0%) |
| Foreign Born, not a Citizen | 26 (100.0%) | 0 (0.0%) |
Health Insurance Coverage by Household Income in Biggsville
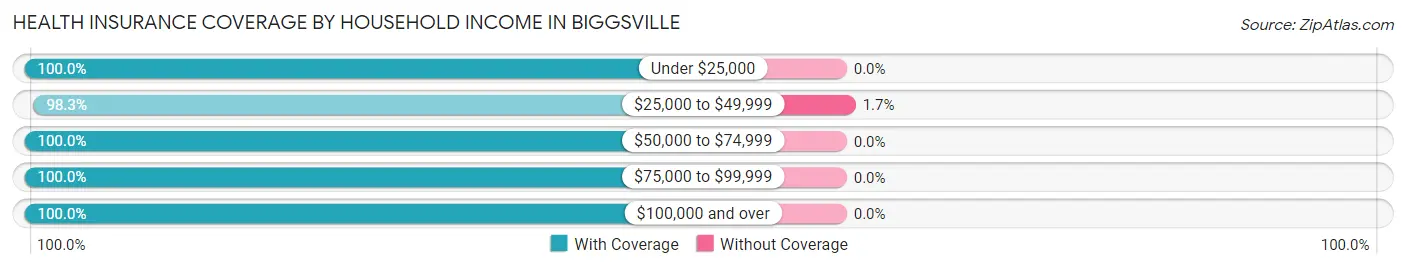
| Household Income | With Coverage | Without Coverage |
| Under $25,000 | 18 (100.0%) | 0 (0.0%) |
| $25,000 to $49,999 | 59 (98.3%) | 1 (1.7%) |
| $50,000 to $74,999 | 49 (100.0%) | 0 (0.0%) |
| $75,000 to $99,999 | 44 (100.0%) | 0 (0.0%) |
| $100,000 and over | 140 (100.0%) | 0 (0.0%) |
Public vs Private Health Insurance Coverage by Age in Biggsville
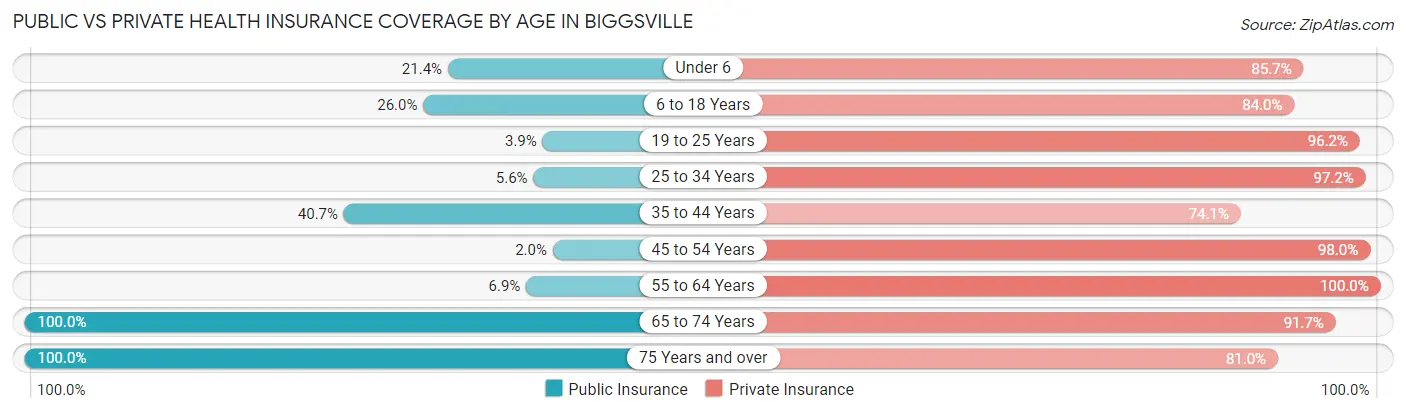
| Age Bracket | Public Insurance | Private Insurance |
| Under 6 | 3 (21.4%) | 12 (85.7%) |
| 6 to 18 Years | 13 (26.0%) | 42 (84.0%) |
| 19 to 25 Years | 1 (3.8%) | 25 (96.2%) |
| 25 to 34 Years | 2 (5.6%) | 35 (97.2%) |
| 35 to 44 Years | 11 (40.7%) | 20 (74.1%) |
| 45 to 54 Years | 1 (2.0%) | 50 (98.0%) |
| 55 to 64 Years | 2 (6.9%) | 29 (100.0%) |
| 65 to 74 Years | 36 (100.0%) | 33 (91.7%) |
| 75 Years and over | 42 (100.0%) | 34 (80.9%) |
| Total | 111 (35.7%) | 280 (90.0%) |
Disability Status by Sex by Age in Biggsville
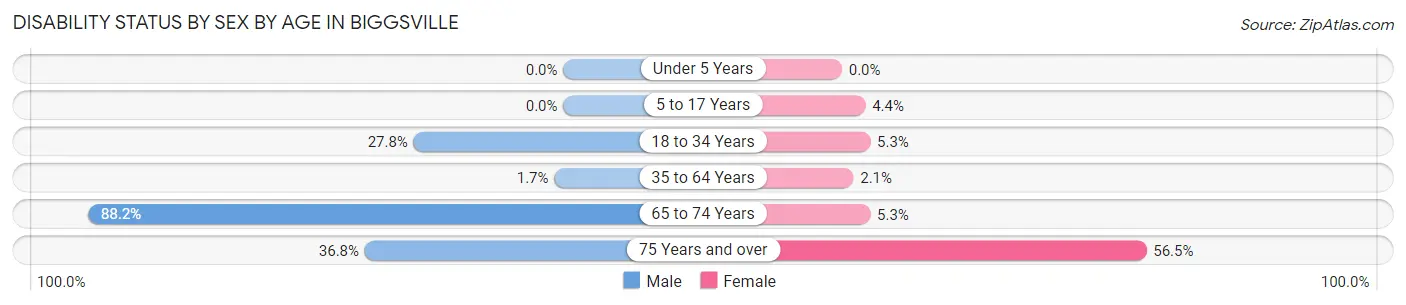
| Age Bracket | Male | Female |
| Under 5 Years | 0 (0.0%) | 0 (0.0%) |
| 5 to 17 Years | 0 (0.0%) | 1 (4.3%) |
| 18 to 34 Years | 10 (27.8%) | 2 (5.3%) |
| 35 to 64 Years | 1 (1.7%) | 1 (2.1%) |
| 65 to 74 Years | 15 (88.2%) | 1 (5.3%) |
| 75 Years and over | 7 (36.8%) | 13 (56.5%) |
Disability Class by Sex by Age in Biggsville
Disability Class: Hearing Difficulty
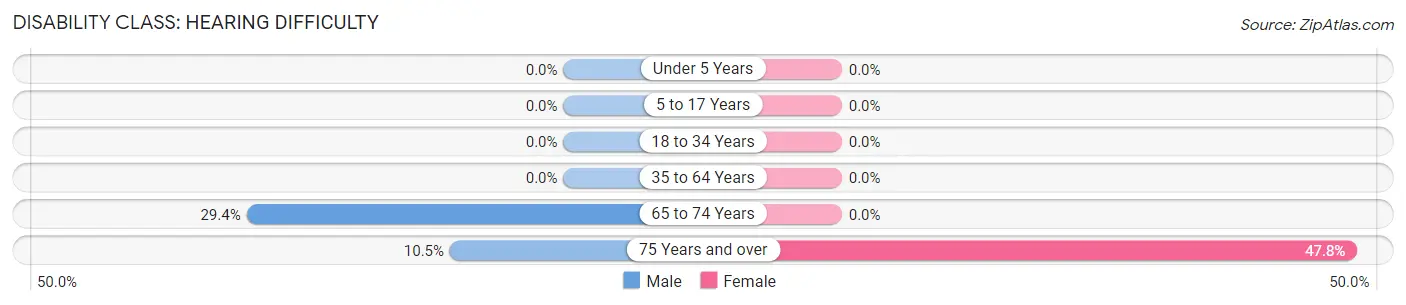
| Age Bracket | Male | Female |
| Under 5 Years | 0 (0.0%) | 0 (0.0%) |
| 5 to 17 Years | 0 (0.0%) | 0 (0.0%) |
| 18 to 34 Years | 0 (0.0%) | 0 (0.0%) |
| 35 to 64 Years | 0 (0.0%) | 0 (0.0%) |
| 65 to 74 Years | 5 (29.4%) | 0 (0.0%) |
| 75 Years and over | 2 (10.5%) | 11 (47.8%) |
Disability Class: Vision Difficulty
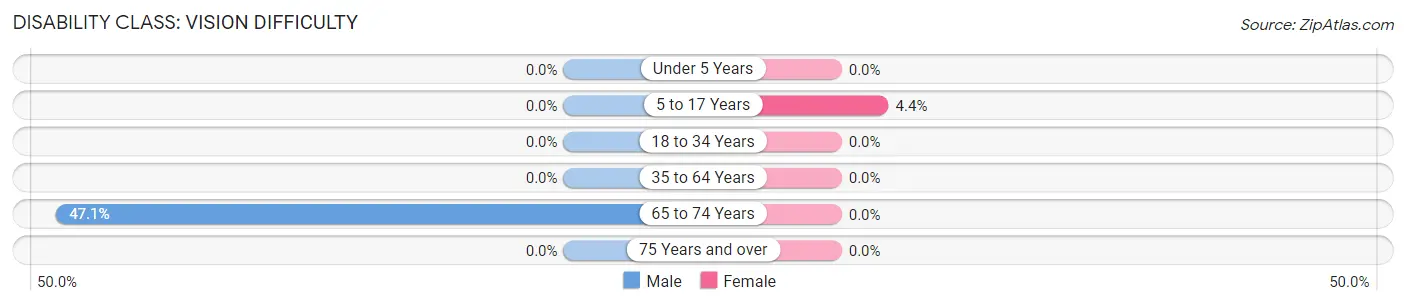
| Age Bracket | Male | Female |
| Under 5 Years | 0 (0.0%) | 0 (0.0%) |
| 5 to 17 Years | 0 (0.0%) | 1 (4.3%) |
| 18 to 34 Years | 0 (0.0%) | 0 (0.0%) |
| 35 to 64 Years | 0 (0.0%) | 0 (0.0%) |
| 65 to 74 Years | 8 (47.1%) | 0 (0.0%) |
| 75 Years and over | 0 (0.0%) | 0 (0.0%) |
Disability Class: Cognitive Difficulty
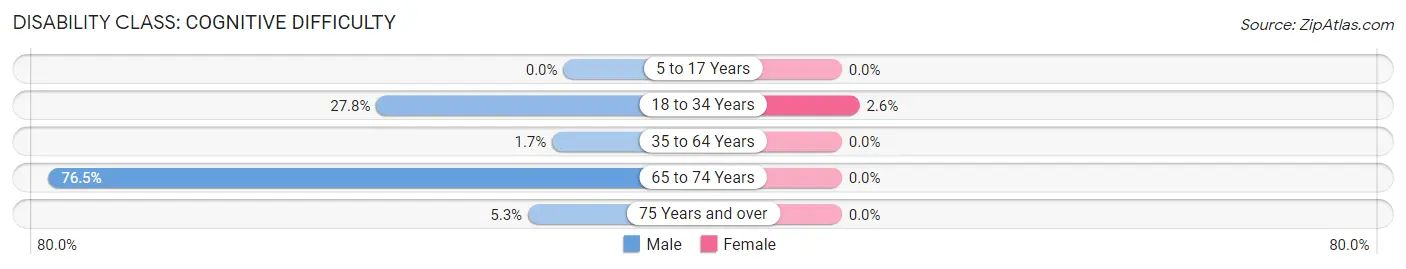
| Age Bracket | Male | Female |
| 5 to 17 Years | 0 (0.0%) | 0 (0.0%) |
| 18 to 34 Years | 10 (27.8%) | 1 (2.6%) |
| 35 to 64 Years | 1 (1.7%) | 0 (0.0%) |
| 65 to 74 Years | 13 (76.5%) | 0 (0.0%) |
| 75 Years and over | 1 (5.3%) | 0 (0.0%) |
Disability Class: Ambulatory Difficulty
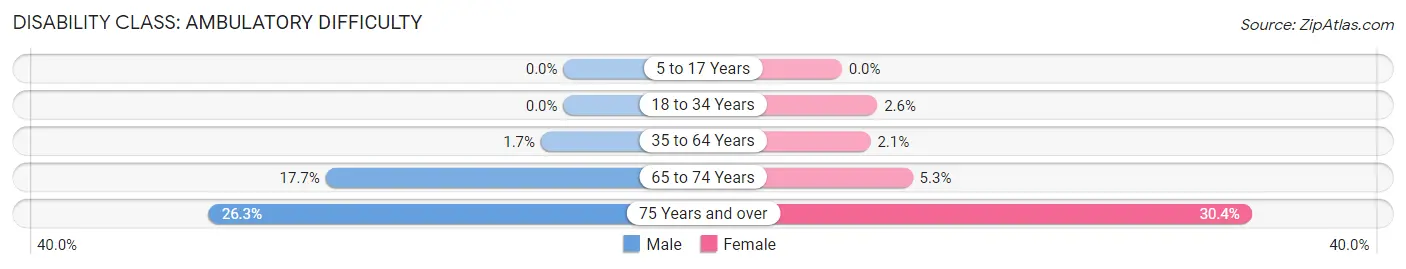
| Age Bracket | Male | Female |
| 5 to 17 Years | 0 (0.0%) | 0 (0.0%) |
| 18 to 34 Years | 0 (0.0%) | 1 (2.6%) |
| 35 to 64 Years | 1 (1.7%) | 1 (2.1%) |
| 65 to 74 Years | 3 (17.6%) | 1 (5.3%) |
| 75 Years and over | 5 (26.3%) | 7 (30.4%) |
Disability Class: Self-Care Difficulty
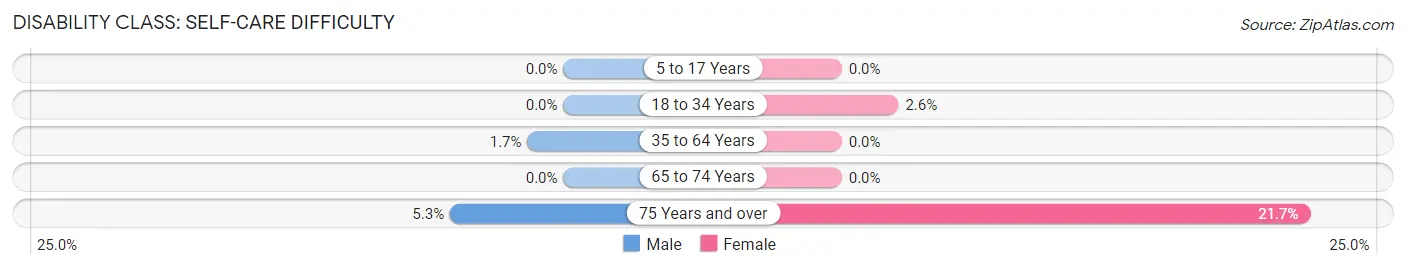
| Age Bracket | Male | Female |
| 5 to 17 Years | 0 (0.0%) | 0 (0.0%) |
| 18 to 34 Years | 0 (0.0%) | 1 (2.6%) |
| 35 to 64 Years | 1 (1.7%) | 0 (0.0%) |
| 65 to 74 Years | 0 (0.0%) | 0 (0.0%) |
| 75 Years and over | 1 (5.3%) | 5 (21.7%) |
Technology Access in Biggsville
Computing Device Access in Biggsville
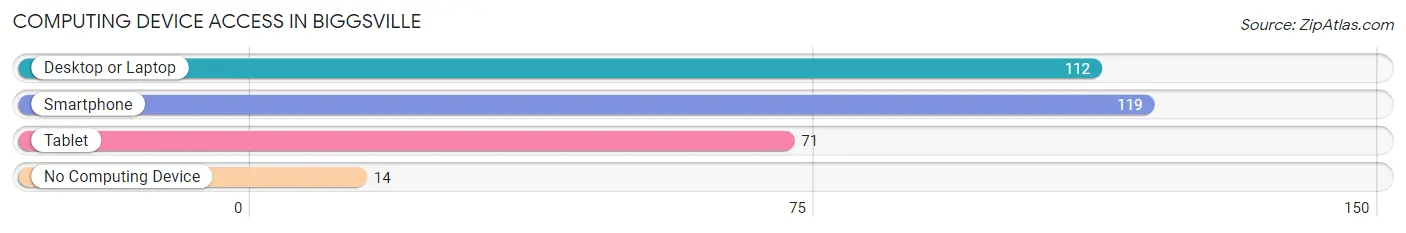
| Device Type | # Households | % Households |
| Desktop or Laptop | 112 | 76.7% |
| Smartphone | 119 | 81.5% |
| Tablet | 71 | 48.6% |
| No Computing Device | 14 | 9.6% |
| Total | 146 | 100.0% |
Internet Access in Biggsville
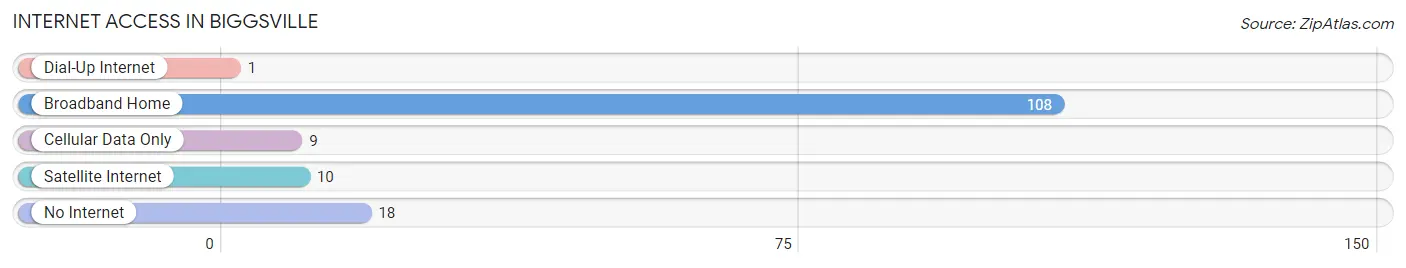
| Internet Type | # Households | % Households |
| Dial-Up Internet | 1 | 0.7% |
| Broadband Home | 108 | 74.0% |
| Cellular Data Only | 9 | 6.2% |
| Satellite Internet | 10 | 6.9% |
| No Internet | 18 | 12.3% |
| Total | 146 | 100.0% |
Biggsville Summary
Biggsville is a small village located in Henderson County, Illinois, United States. The population was estimated to be around 200 people in the year 2000. The village is located on the banks of the Mississippi River, and is part of the Burlington, Iowa metropolitan area.
History
Biggsville was founded in 1837 by William Biggs, a settler from Kentucky. The village was originally known as Biggsville, but the name was changed to Biggsville in 1845. The village was incorporated in 1854.
In the late 19th century, Biggsville was a thriving river port, with a large number of steamboats and barges passing through the village. The village was also home to a number of businesses, including a sawmill, a grist mill, a blacksmith shop, and a general store.
In the early 20th century, Biggsville was a popular tourist destination, with many visitors coming to the village to enjoy the scenery and the river. The village also had a number of hotels and restaurants.
Geography
Biggsville is located in Henderson County, Illinois, on the banks of the Mississippi River. The village is situated at an elevation of 590 feet (180 m) above sea level. The village is located approximately 25 miles (40 km) south of Burlington, Iowa, and approximately 50 miles (80 km) west of Davenport, Iowa.
The climate in Biggsville is humid continental, with hot summers and cold winters. The average annual temperature is around 50°F (10°C). The average annual precipitation is around 37 inches (94 cm).
Economy
The economy of Biggsville is largely based on agriculture. The village is home to a number of farms, which produce corn, soybeans, and other crops. The village also has a number of small businesses, including a general store, a restaurant, and a gas station.
Demographics
As of the 2000 census, there were 200 people living in Biggsville. The racial makeup of the village was 97.5% White, 0.5% African American, 0.5% Native American, and 1.5% from other races. The median household income was $30,000, and the median family income was $35,000.
The population of Biggsville is largely rural, with most of the residents living in single-family homes. The village is served by a number of churches, including the Biggsville United Methodist Church, the Biggsville Baptist Church, and the Biggsville Presbyterian Church.
Conclusion
Biggsville is a small village located in Henderson County, Illinois, United States. The village was founded in 1837 by William Biggs, and was incorporated in 1854. The village was once a thriving river port, and is now a popular tourist destination. The economy of Biggsville is largely based on agriculture, and the population is largely rural. As of the 2000 census, there were 200 people living in Biggsville.
Common Questions
What is Per Capita Income in Biggsville?
Per Capita income in Biggsville is $40,991.
What is the Median Family Income in Biggsville?
Median Family Income in Biggsville is $88,750.
What is the Median Household income in Biggsville?
Median Household Income in Biggsville is $83,750.
What is Income or Wage Gap in Biggsville?
Income or Wage Gap in Biggsville is 51.9%.
Women in Biggsville earn 48.1 cents for every dollar earned by a man.
What is Inequality or Gini Index in Biggsville?
Inequality or Gini Index in Biggsville is 0.34.
What is the Total Population of Biggsville?
Total Population of Biggsville is 311.
What is the Total Male Population of Biggsville?
Total Male Population of Biggsville is 155.
What is the Total Female Population of Biggsville?
Total Female Population of Biggsville is 156.
What is the Ratio of Males per 100 Females in Biggsville?
There are 99.36 Males per 100 Females in Biggsville.
What is the Ratio of Females per 100 Males in Biggsville?
There are 100.65 Females per 100 Males in Biggsville.
What is the Median Population Age in Biggsville?
Median Population Age in Biggsville is 45.4 Years.
What is the Average Family Size in Biggsville
Average Family Size in Biggsville is 2.8 People.
What is the Average Household Size in Biggsville
Average Household Size in Biggsville is 2.1 People.
How Large is the Labor Force in Biggsville?
There are 187 People in the Labor Forcein in Biggsville.
What is the Percentage of People in the Labor Force in Biggsville?
70.3% of People are in the Labor Force in Biggsville.
What is the Unemployment Rate in Biggsville?
Unemployment Rate in Biggsville is 3.2%.