St Francisville, IL Map & Demographics
St Francisville Map
St Francisville Overview
$33,632
PER CAPITA INCOME
$66,023
AVG FAMILY INCOME
$56,806
AVG HOUSEHOLD INCOME
36.7%
WAGE / INCOME GAP [ % ]
63.3¢/ $1
WAGE / INCOME GAP [ $ ]
0.53
INEQUALITY / GINI INDEX
669
TOTAL POPULATION
409
MALE POPULATION
260
FEMALE POPULATION
157.31
MALES / 100 FEMALES
63.57
FEMALES / 100 MALES
33.9
MEDIAN AGE
3.8
AVG FAMILY SIZE
2.9
AVG HOUSEHOLD SIZE
340
LABOR FORCE [ PEOPLE ]
58.1%
PERCENT IN LABOR FORCE
17.1%
UNEMPLOYMENT RATE
Income in St Francisville
Income Overview in St Francisville
Per Capita Income in St Francisville is $33,632, while median incomes of families and households are $66,023 and $56,806 respectively.
| Characteristic | Number | Measure |
| Per Capita Income | 669 | $33,632 |
| Median Family Income | 147 | $66,023 |
| Mean Family Income | 147 | $110,059 |
| Median Household Income | 229 | $56,806 |
| Mean Household Income | 229 | $90,734 |
| Income Deficit | 147 | $0 |
| Wage / Income Gap (%) | 669 | 36.74% |
| Wage / Income Gap ($) | 669 | 63.26¢ per $1 |
| Gini / Inequality Index | 669 | 0.53 |
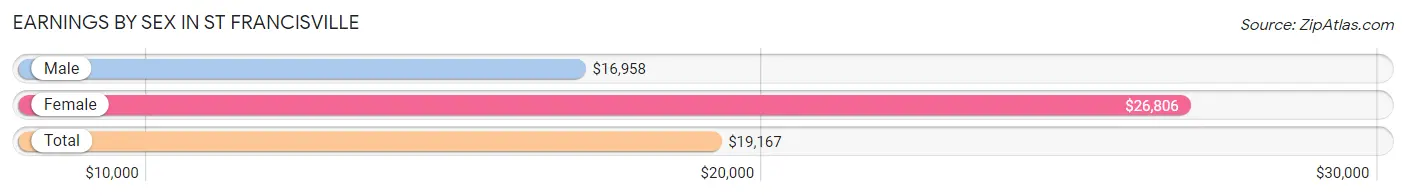
Earnings by Sex in St Francisville
Average Earnings in St Francisville are $19,167, $16,958 for men and $26,806 for women, a difference of 36.7%.
| Sex | Number | Average Earnings |
| Male | 249 (71.1%) | $16,958 |
| Female | 101 (28.9%) | $26,806 |
| Total | 350 (100.0%) | $19,167 |
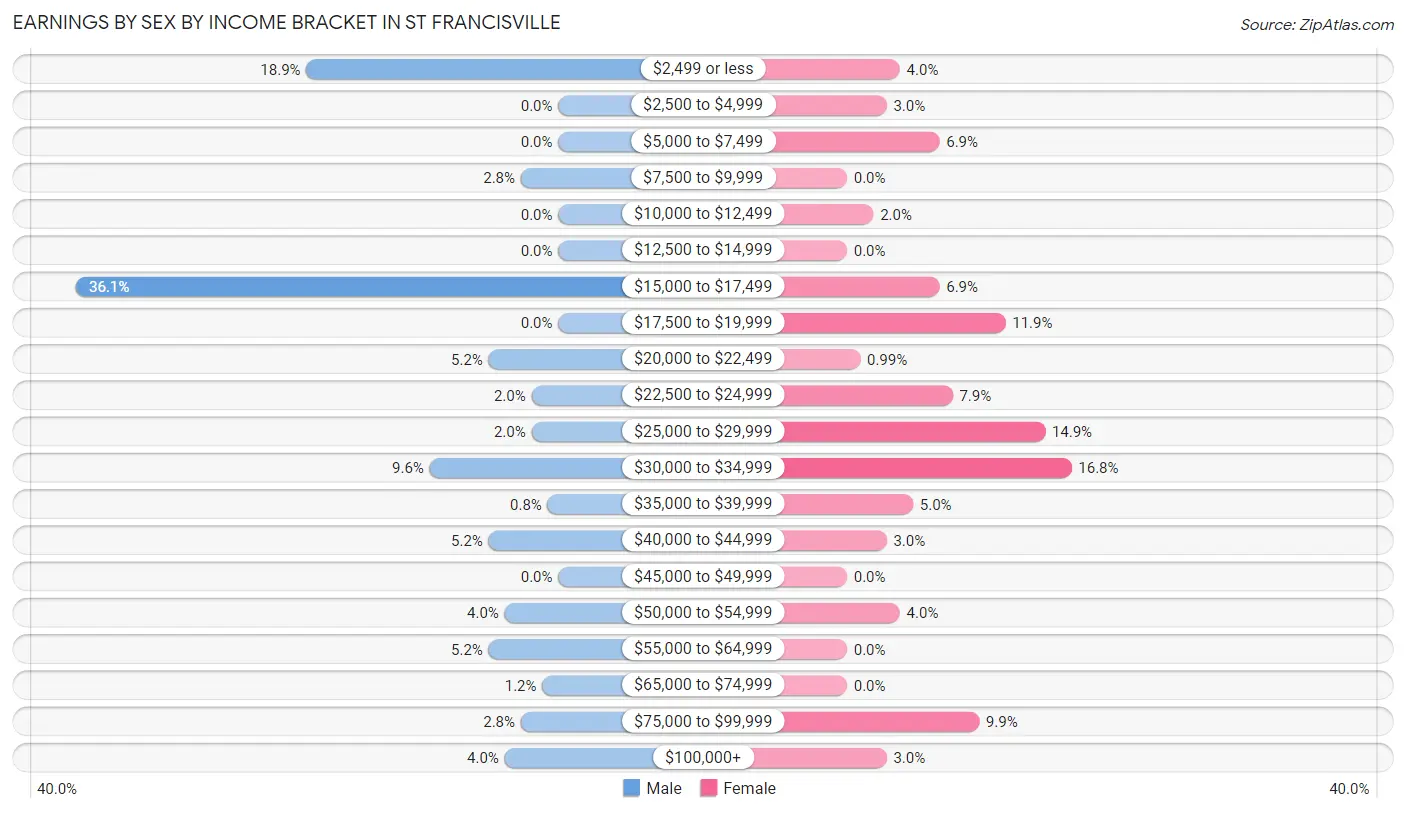
Earnings by Sex by Income Bracket in St Francisville
The most common earnings brackets in St Francisville are $15,000 to $17,499 for men (90 | 36.1%) and $30,000 to $34,999 for women (17 | 16.8%).
| Income | Male | Female |
| $2,499 or less | 47 (18.9%) | 4 (4.0%) |
| $2,500 to $4,999 | 0 (0.0%) | 3 (3.0%) |
| $5,000 to $7,499 | 0 (0.0%) | 7 (6.9%) |
| $7,500 to $9,999 | 7 (2.8%) | 0 (0.0%) |
| $10,000 to $12,499 | 0 (0.0%) | 2 (2.0%) |
| $12,500 to $14,999 | 0 (0.0%) | 0 (0.0%) |
| $15,000 to $17,499 | 90 (36.1%) | 7 (6.9%) |
| $17,500 to $19,999 | 0 (0.0%) | 12 (11.9%) |
| $20,000 to $22,499 | 13 (5.2%) | 1 (1.0%) |
| $22,500 to $24,999 | 5 (2.0%) | 8 (7.9%) |
| $25,000 to $29,999 | 5 (2.0%) | 15 (14.8%) |
| $30,000 to $34,999 | 24 (9.6%) | 17 (16.8%) |
| $35,000 to $39,999 | 2 (0.8%) | 5 (5.0%) |
| $40,000 to $44,999 | 13 (5.2%) | 3 (3.0%) |
| $45,000 to $49,999 | 0 (0.0%) | 0 (0.0%) |
| $50,000 to $54,999 | 10 (4.0%) | 4 (4.0%) |
| $55,000 to $64,999 | 13 (5.2%) | 0 (0.0%) |
| $65,000 to $74,999 | 3 (1.2%) | 0 (0.0%) |
| $75,000 to $99,999 | 7 (2.8%) | 10 (9.9%) |
| $100,000+ | 10 (4.0%) | 3 (3.0%) |
| Total | 249 (100.0%) | 101 (100.0%) |
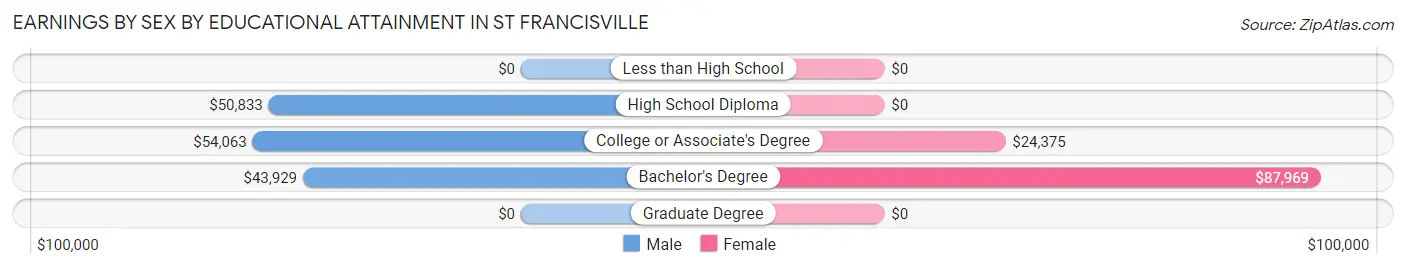
Earnings by Sex by Educational Attainment in St Francisville
Average earnings in St Francisville are $44,722 for men and $26,667 for women, a difference of 40.4%. Men with an educational attainment of college or associate's degree enjoy the highest average annual earnings of $54,063, while those with bachelor's degree education earn the least with $43,929. Women with an educational attainment of bachelor's degree earn the most with the average annual earnings of $87,969, while those with college or associate's degree education have the smallest earnings of $24,375.
| Educational Attainment | Male Income | Female Income |
| Less than High School | - | - |
| High School Diploma | $50,833 | $0 |
| College or Associate's Degree | $54,063 | $24,375 |
| Bachelor's Degree | $43,929 | $87,969 |
| Graduate Degree | - | - |
| Total | $44,722 | $26,667 |
Family Income in St Francisville
Family Income Brackets in St Francisville
According to the St Francisville family income data, there are 41 families falling into the $50,000 to $74,999 income range, which is the most common income bracket and makes up 27.9% of all families. Conversely, the less than $10,000 income bracket is the least frequent group with only 1 families (0.7%) belonging to this category.
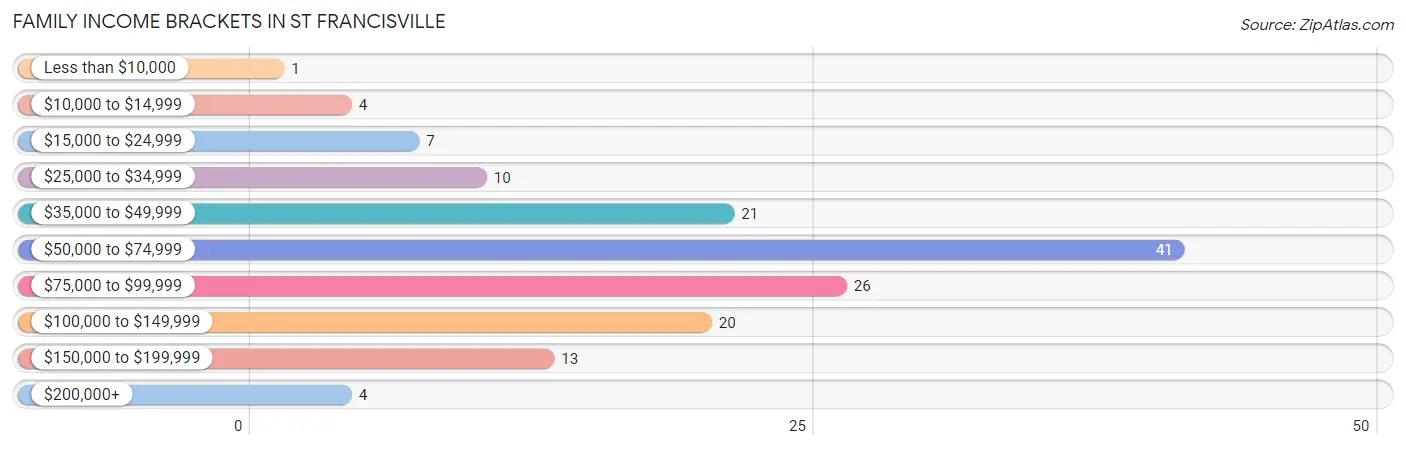
| Income Bracket | # Families | % Families |
| Less than $10,000 | 1 | 0.7% |
| $10,000 to $14,999 | 4 | 2.7% |
| $15,000 to $24,999 | 7 | 4.8% |
| $25,000 to $34,999 | 10 | 6.8% |
| $35,000 to $49,999 | 21 | 14.3% |
| $50,000 to $74,999 | 41 | 27.9% |
| $75,000 to $99,999 | 26 | 17.7% |
| $100,000 to $149,999 | 20 | 13.6% |
| $150,000 to $199,999 | 13 | 8.8% |
| $200,000+ | 4 | 2.7% |
Family Income by Famaliy Size in St Francisville
5-person families (9 | 6.1%) account for the highest median family income in St Francisville with $113,958 per family, while 2-person families (89 | 60.5%) have the highest median income of $30,938 per family member.
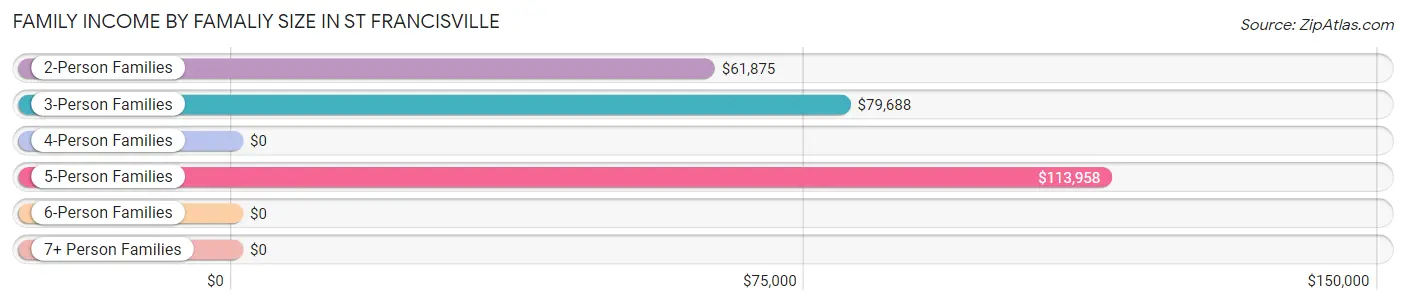
| Income Bracket | # Families | Median Income |
| 2-Person Families | 89 (60.5%) | $61,875 |
| 3-Person Families | 27 (18.4%) | $79,688 |
| 4-Person Families | 18 (12.2%) | $0 |
| 5-Person Families | 9 (6.1%) | $113,958 |
| 6-Person Families | 4 (2.7%) | $0 |
| 7+ Person Families | 0 (0.0%) | $0 |
| Total | 147 (100.0%) | $66,023 |
Family Income by Number of Earners in St Francisville
The median family income in St Francisville is $66,023, with families comprising 3+ earners (16) having the highest median family income of $160,357, while families with 1 earner (53) have the lowest median family income of $43,594, accounting for 10.9% and 36.0% of families, respectively.
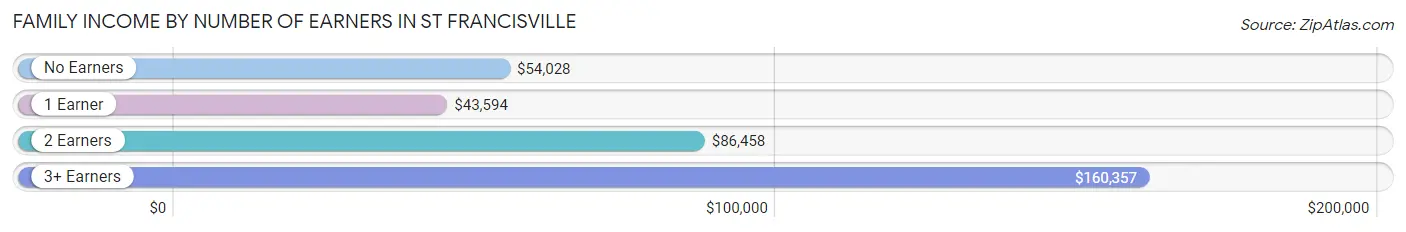
| Number of Earners | # Families | Median Income |
| No Earners | 35 (23.8%) | $54,028 |
| 1 Earner | 53 (36.0%) | $43,594 |
| 2 Earners | 43 (29.2%) | $86,458 |
| 3+ Earners | 16 (10.9%) | $160,357 |
| Total | 147 (100.0%) | $66,023 |
Household Income in St Francisville
Household Income Brackets in St Francisville
With 64 households falling in the category, the $50,000 to $74,999 income range is the most frequent in St Francisville, accounting for 28.0% of all households. In contrast, only 5 households (2.2%) fall into the $200,000+ income bracket, making it the least populous group.
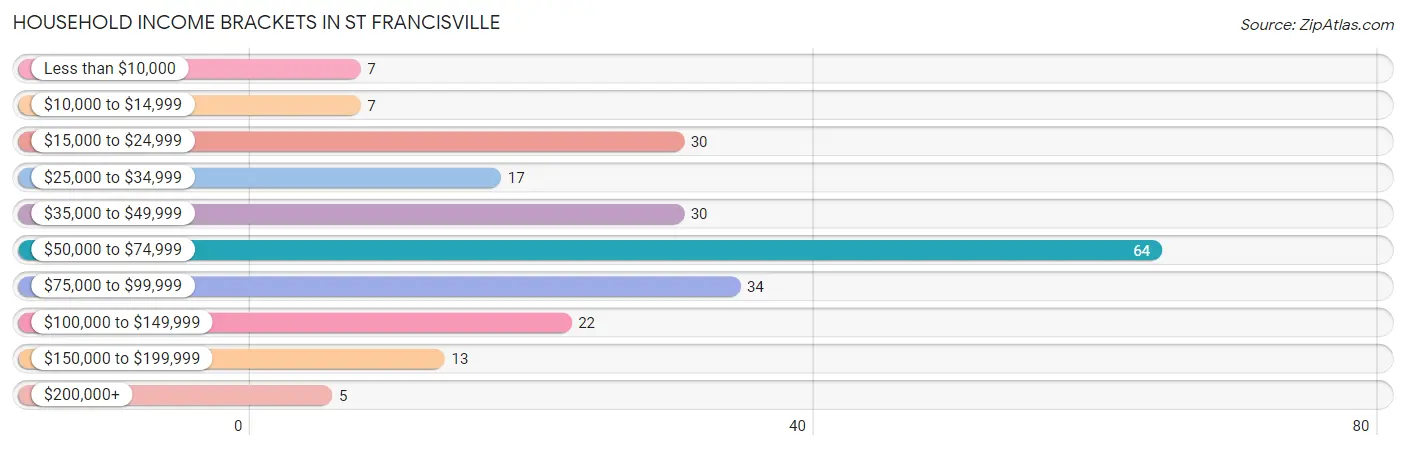
| Income Bracket | # Households | % Households |
| Less than $10,000 | 7 | 3.1% |
| $10,000 to $14,999 | 7 | 3.1% |
| $15,000 to $24,999 | 30 | 13.1% |
| $25,000 to $34,999 | 17 | 7.4% |
| $35,000 to $49,999 | 30 | 13.1% |
| $50,000 to $74,999 | 64 | 27.9% |
| $75,000 to $99,999 | 34 | 14.8% |
| $100,000 to $149,999 | 22 | 9.6% |
| $150,000 to $199,999 | 13 | 5.7% |
| $200,000+ | 5 | 2.2% |
Household Income by Householder Age in St Francisville
The median household income in St Francisville is $56,806, with the highest median household income of $65,313 found in the 45 to 64 years age bracket for the primary householder. A total of 97 households (42.4%) fall into this category. Meanwhile, the 15 to 24 years age bracket for the primary householder has the lowest median household income of $0, with 9 households (3.9%) in this group.
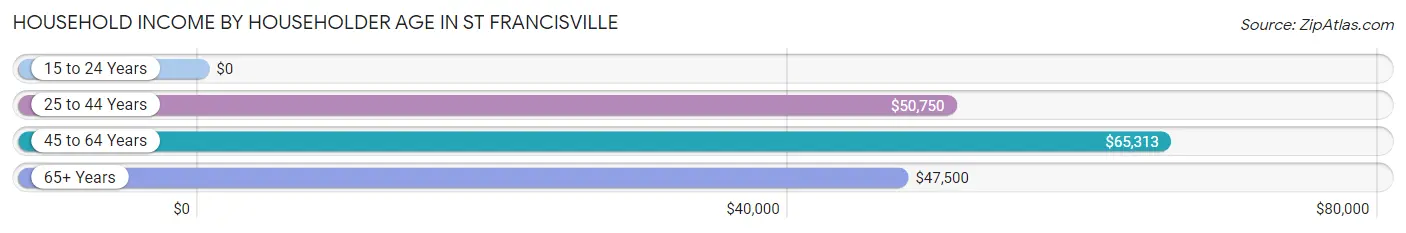
| Income Bracket | # Households | Median Income |
| 15 to 24 Years | 9 (3.9%) | $0 |
| 25 to 44 Years | 41 (17.9%) | $50,750 |
| 45 to 64 Years | 97 (42.4%) | $65,313 |
| 65+ Years | 82 (35.8%) | $47,500 |
| Total | 229 (100.0%) | $56,806 |
Poverty in St Francisville
Income Below Poverty by Sex and Age in St Francisville
With 8.3% poverty level for males and 13.1% for females among the residents of St Francisville, 12 to 14 year old males and 5 year old females are the most vulnerable to poverty, with 4 males (66.7%) and 1 females (100.0%) in their respective age groups living below the poverty level.
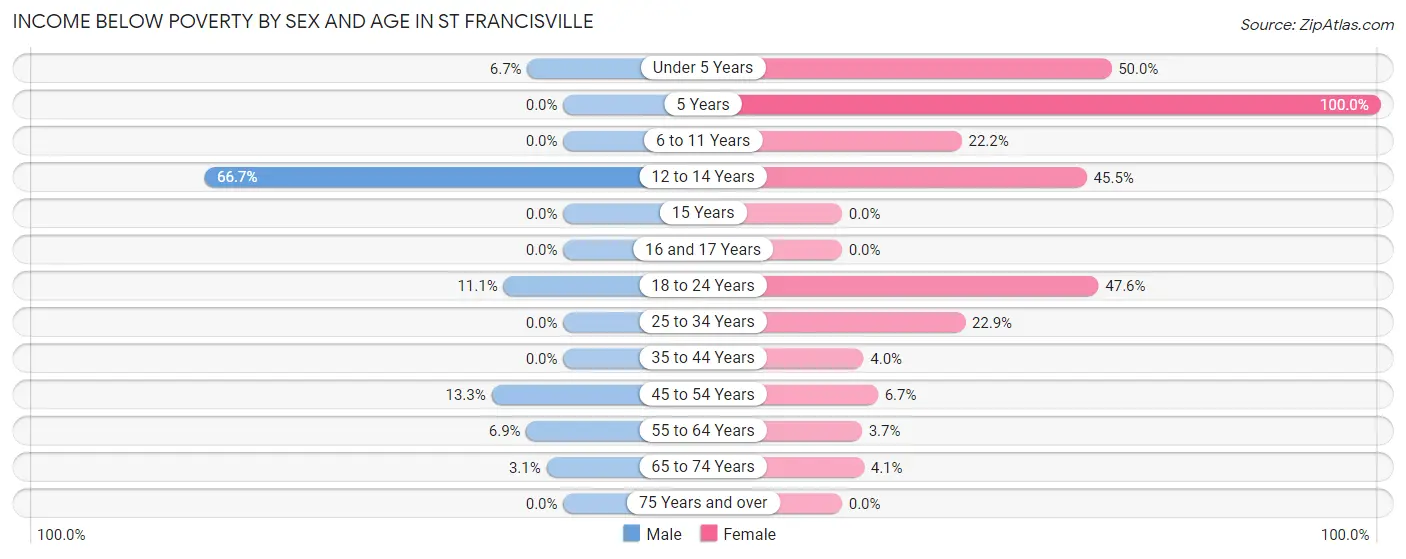
| Age Bracket | Male | Female |
| Under 5 Years | 2 (6.7%) | 2 (50.0%) |
| 5 Years | 0 (0.0%) | 1 (100.0%) |
| 6 to 11 Years | 0 (0.0%) | 2 (22.2%) |
| 12 to 14 Years | 4 (66.7%) | 5 (45.5%) |
| 15 Years | 0 (0.0%) | 0 (0.0%) |
| 16 and 17 Years | 0 (0.0%) | 0 (0.0%) |
| 18 to 24 Years | 20 (11.1%) | 10 (47.6%) |
| 25 to 34 Years | 0 (0.0%) | 8 (22.9%) |
| 35 to 44 Years | 0 (0.0%) | 1 (4.0%) |
| 45 to 54 Years | 2 (13.3%) | 1 (6.7%) |
| 55 to 64 Years | 5 (6.9%) | 2 (3.7%) |
| 65 to 74 Years | 1 (3.1%) | 2 (4.1%) |
| 75 Years and over | 0 (0.0%) | 0 (0.0%) |
| Total | 34 (8.3%) | 34 (13.1%) |
Income Above Poverty by Sex and Age in St Francisville
According to the poverty statistics in St Francisville, males aged 6 to 11 years and females aged 15 years are the age groups that are most secure financially, with 100.0% of males and 100.0% of females in these age groups living above the poverty line.
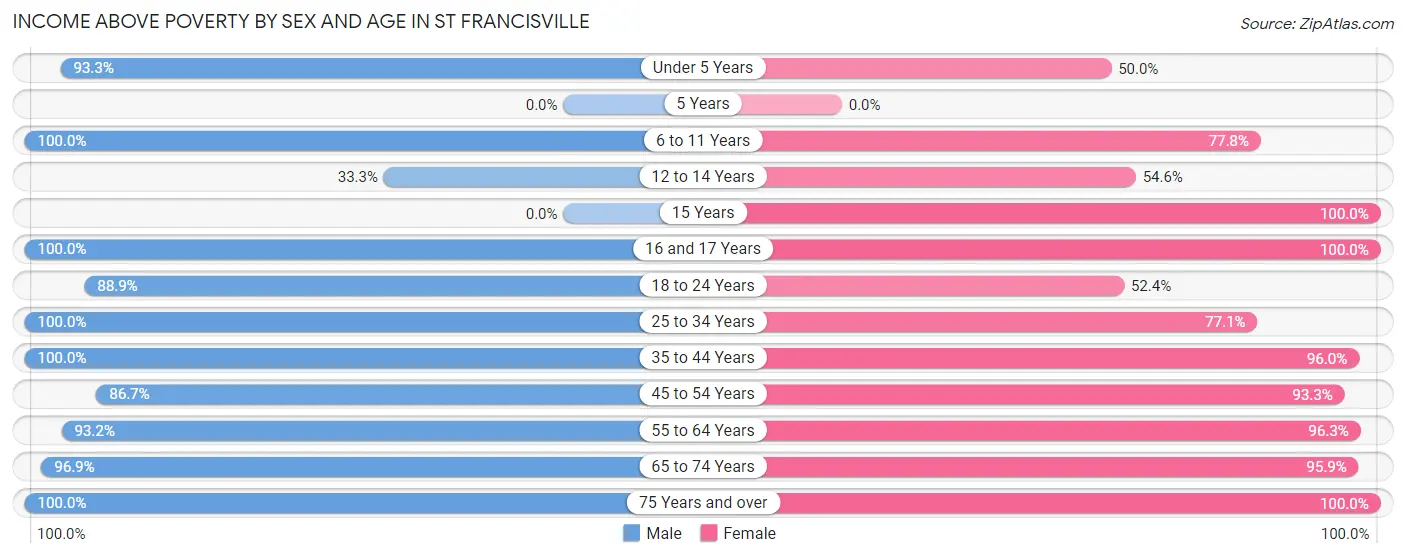
| Age Bracket | Male | Female |
| Under 5 Years | 28 (93.3%) | 2 (50.0%) |
| 5 Years | 0 (0.0%) | 0 (0.0%) |
| 6 to 11 Years | 15 (100.0%) | 7 (77.8%) |
| 12 to 14 Years | 2 (33.3%) | 6 (54.5%) |
| 15 Years | 0 (0.0%) | 8 (100.0%) |
| 16 and 17 Years | 1 (100.0%) | 2 (100.0%) |
| 18 to 24 Years | 160 (88.9%) | 11 (52.4%) |
| 25 to 34 Years | 20 (100.0%) | 27 (77.1%) |
| 35 to 44 Years | 16 (100.0%) | 24 (96.0%) |
| 45 to 54 Years | 13 (86.7%) | 14 (93.3%) |
| 55 to 64 Years | 68 (93.1%) | 52 (96.3%) |
| 65 to 74 Years | 31 (96.9%) | 47 (95.9%) |
| 75 Years and over | 21 (100.0%) | 26 (100.0%) |
| Total | 375 (91.7%) | 226 (86.9%) |
Income Below Poverty Among Married-Couple Families in St Francisville
The poverty statistics for married-couple families in St Francisville show that 4.8% or 6 of the total 124 families live below the poverty line. Families with 1 or 2 children have the highest poverty rate of 7.1%, comprising of 1 families. On the other hand, families with 3 or 4 children have the lowest poverty rate of 0.0%, which includes 0 families.
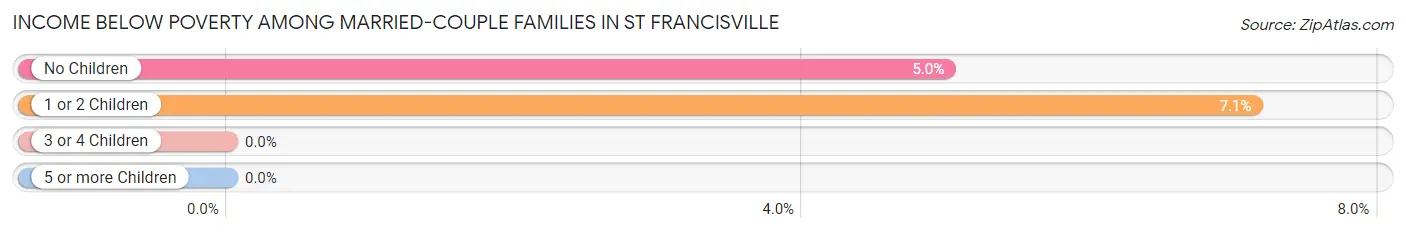
| Children | Above Poverty | Below Poverty |
| No Children | 95 (95.0%) | 5 (5.0%) |
| 1 or 2 Children | 13 (92.9%) | 1 (7.1%) |
| 3 or 4 Children | 10 (100.0%) | 0 (0.0%) |
| 5 or more Children | 0 (0.0%) | 0 (0.0%) |
| Total | 118 (95.2%) | 6 (4.8%) |
Income Below Poverty Among Single-Parent Households in St Francisville
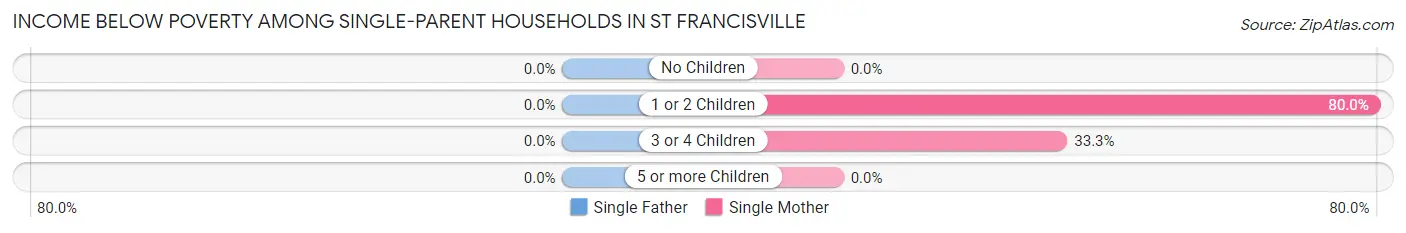
| Children | Single Father | Single Mother |
| No Children | 0 (0.0%) | 0 (0.0%) |
| 1 or 2 Children | 0 (0.0%) | 4 (80.0%) |
| 3 or 4 Children | 0 (0.0%) | 1 (33.3%) |
| 5 or more Children | 0 (0.0%) | 0 (0.0%) |
| Total | 0 (0.0%) | 5 (35.7%) |
Income Below Poverty Among Married-Couple vs Single-Parent Households in St Francisville
The poverty data for St Francisville shows that 6 of the married-couple family households (4.8%) and 5 of the single-parent households (21.7%) are living below the poverty level. Within the married-couple family households, those with 1 or 2 children have the highest poverty rate, with 1 households (7.1%) falling below the poverty line. Among the single-parent households, those with 1 or 2 children have the highest poverty rate, with 4 household (80.0%) living below poverty.
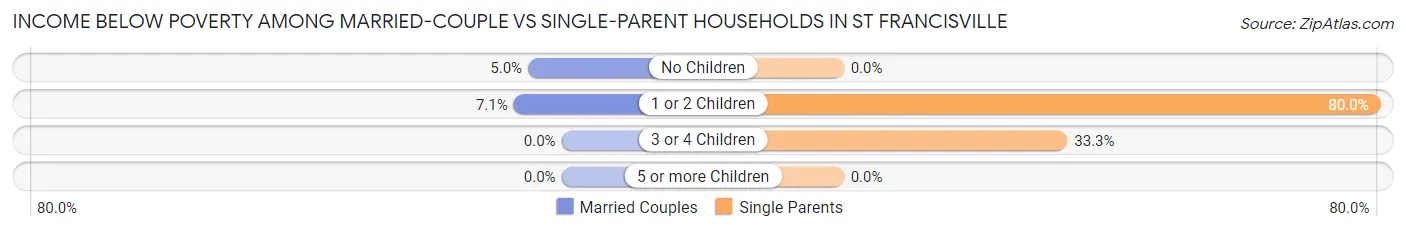
| Children | Married-Couple Families | Single-Parent Households |
| No Children | 5 (5.0%) | 0 (0.0%) |
| 1 or 2 Children | 1 (7.1%) | 4 (80.0%) |
| 3 or 4 Children | 0 (0.0%) | 1 (33.3%) |
| 5 or more Children | 0 (0.0%) | 0 (0.0%) |
| Total | 6 (4.8%) | 5 (21.7%) |
Race in St Francisville
The most populous races in St Francisville are White / Caucasian (475 | 71.0%), Two or more Races (163 | 24.4%), and Native / Alaskan (31 | 4.6%).
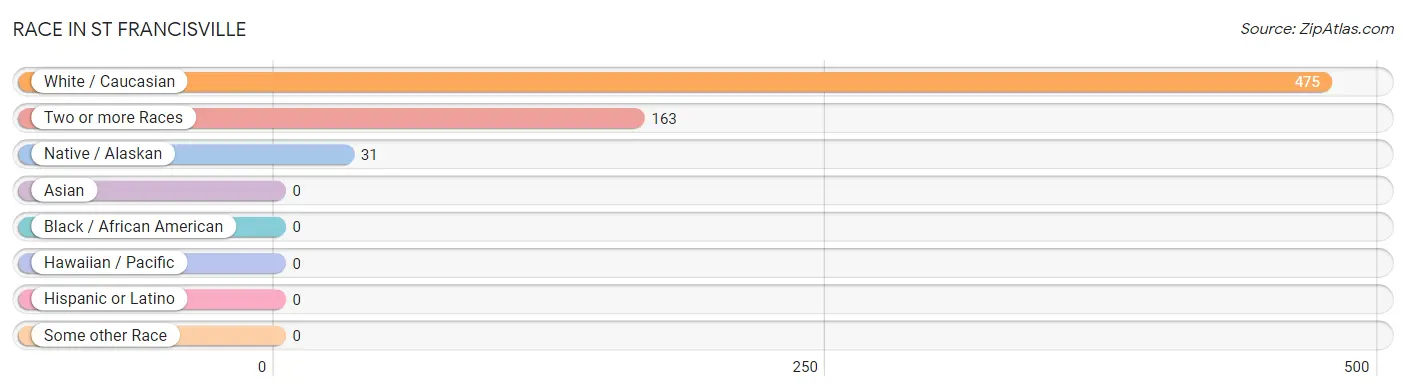
| Race | # Population | % Population |
| Asian | 0 | 0.0% |
| Black / African American | 0 | 0.0% |
| Hawaiian / Pacific | 0 | 0.0% |
| Hispanic or Latino | 0 | 0.0% |
| Native / Alaskan | 31 | 4.6% |
| White / Caucasian | 475 | 71.0% |
| Two or more Races | 163 | 24.4% |
| Some other Race | 0 | 0.0% |
| Total | 669 | 100.0% |
Ancestry in St Francisville
The most populous ancestries reported in St Francisville are Irish (157 | 23.5%), German (120 | 17.9%), Swedish (96 | 14.3%), English (73 | 10.9%), and American (43 | 6.4%), together accounting for 73.1% of all St Francisville residents.
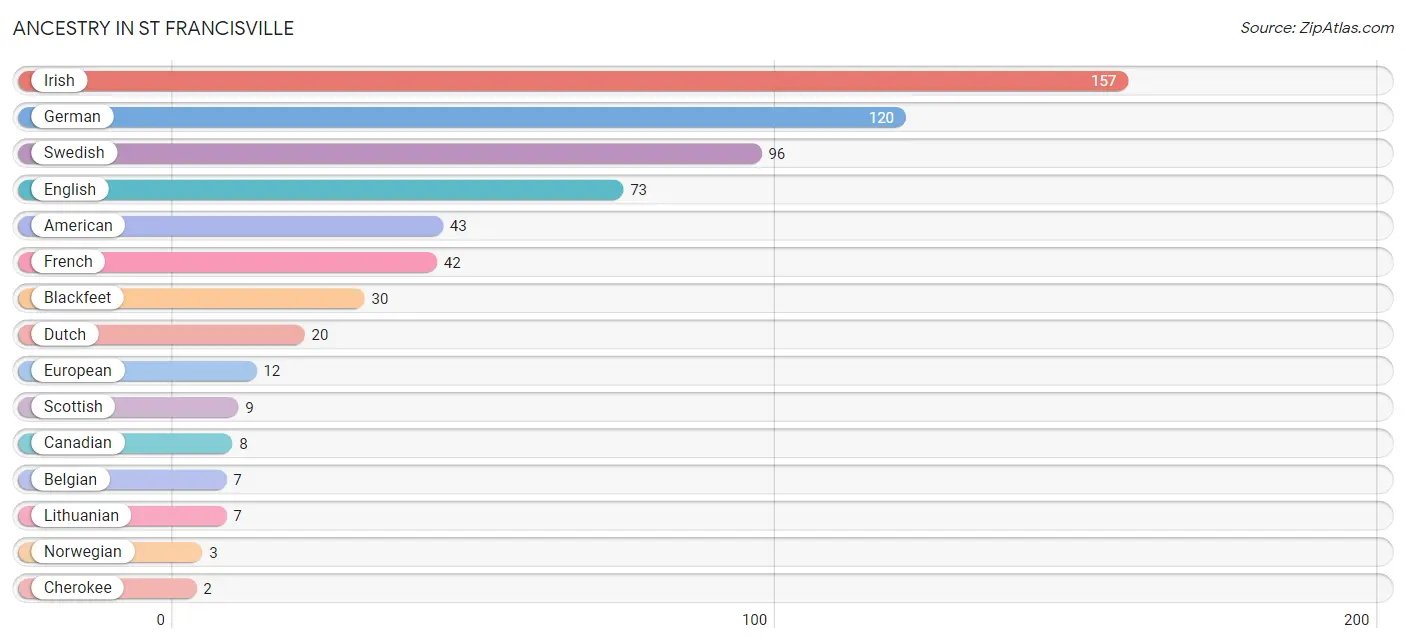
| Ancestry | # Population | % Population |
| American | 43 | 6.4% |
| Belgian | 7 | 1.1% |
| Blackfeet | 30 | 4.5% |
| Canadian | 8 | 1.2% |
| Cherokee | 2 | 0.3% |
| Crow | 1 | 0.2% |
| Dutch | 20 | 3.0% |
| English | 73 | 10.9% |
| European | 12 | 1.8% |
| French | 42 | 6.3% |
| German | 120 | 17.9% |
| Irish | 157 | 23.5% |
| Lithuanian | 7 | 1.1% |
| Norwegian | 3 | 0.4% |
| Scotch-Irish | 2 | 0.3% |
| Scottish | 9 | 1.3% |
| Swedish | 96 | 14.3% |
| Welsh | 2 | 0.3% | View All 18 Rows |
Immigrants in St Francisville
The most numerous immigrant groups reported in St Francisville came from , and Canada (3 | 0.4%), together accounting for 0.4% of all St Francisville residents.

| Immigration Origin | # Population | % Population |
| Canada | 3 | 0.4% | View All 1 Rows |
Sex and Age in St Francisville
Sex and Age in St Francisville
The most populous age groups in St Francisville are 20 to 24 Years (178 | 43.5%) for men and 65 to 69 Years (40 | 15.4%) for women.
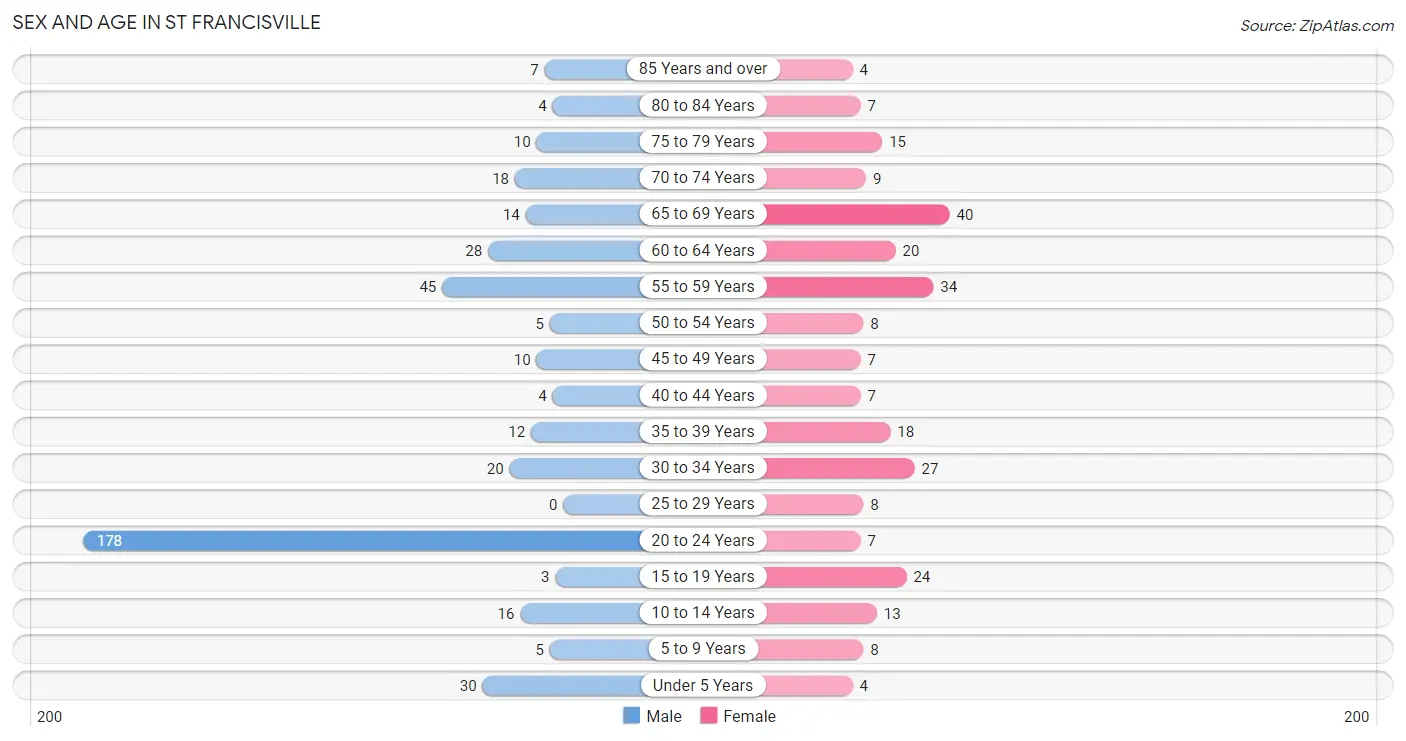
| Age Bracket | Male | Female |
| Under 5 Years | 30 (7.3%) | 4 (1.5%) |
| 5 to 9 Years | 5 (1.2%) | 8 (3.1%) |
| 10 to 14 Years | 16 (3.9%) | 13 (5.0%) |
| 15 to 19 Years | 3 (0.7%) | 24 (9.2%) |
| 20 to 24 Years | 178 (43.5%) | 7 (2.7%) |
| 25 to 29 Years | 0 (0.0%) | 8 (3.1%) |
| 30 to 34 Years | 20 (4.9%) | 27 (10.4%) |
| 35 to 39 Years | 12 (2.9%) | 18 (6.9%) |
| 40 to 44 Years | 4 (1.0%) | 7 (2.7%) |
| 45 to 49 Years | 10 (2.4%) | 7 (2.7%) |
| 50 to 54 Years | 5 (1.2%) | 8 (3.1%) |
| 55 to 59 Years | 45 (11.0%) | 34 (13.1%) |
| 60 to 64 Years | 28 (6.9%) | 20 (7.7%) |
| 65 to 69 Years | 14 (3.4%) | 40 (15.4%) |
| 70 to 74 Years | 18 (4.4%) | 9 (3.5%) |
| 75 to 79 Years | 10 (2.4%) | 15 (5.8%) |
| 80 to 84 Years | 4 (1.0%) | 7 (2.7%) |
| 85 Years and over | 7 (1.7%) | 4 (1.5%) |
| Total | 409 (100.0%) | 260 (100.0%) |
Families and Households in St Francisville
Median Family Size in St Francisville
The median family size in St Francisville is 3.82 persons per family, with single female/mother families (14 | 9.5%) accounting for the largest median family size of 10.71 persons per family. On the other hand, married-couple families (124 | 84.4%) represent the smallest median family size with 3.09 persons per family.
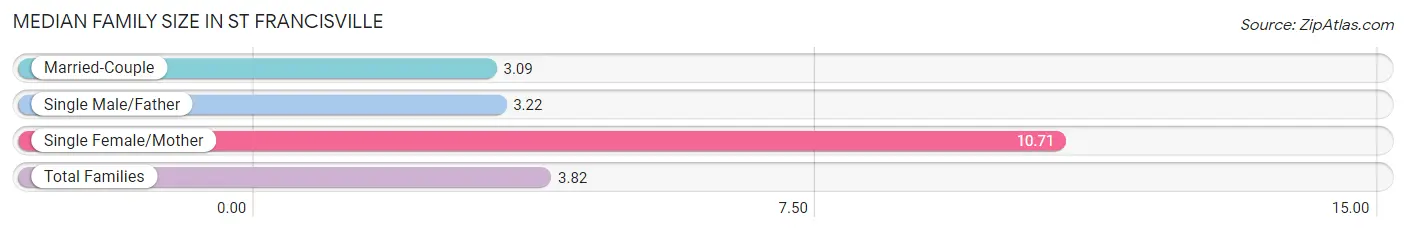
| Family Type | # Families | Family Size |
| Married-Couple | 124 (84.4%) | 3.09 |
| Single Male/Father | 9 (6.1%) | 3.22 |
| Single Female/Mother | 14 (9.5%) | 10.71 |
| Total Families | 147 (100.0%) | 3.82 |
Median Household Size in St Francisville
The median household size in St Francisville is 2.92 persons per household, with single female/mother households (14 | 6.1%) accounting for the largest median household size of 11.71 persons per household. non-family households (82 | 35.8%) represent the smallest median household size with 1.13 persons per household.
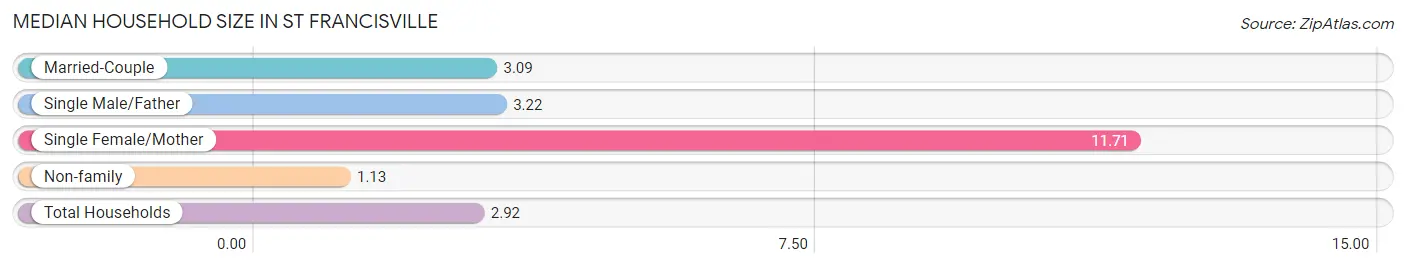
| Household Type | # Households | Household Size |
| Married-Couple | 124 (54.1%) | 3.09 |
| Single Male/Father | 9 (3.9%) | 3.22 |
| Single Female/Mother | 14 (6.1%) | 11.71 |
| Non-family | 82 (35.8%) | 1.13 |
| Total Households | 229 (100.0%) | 2.92 |
Household Size by Marriage Status in St Francisville
Out of a total of 229 households in St Francisville, 147 (64.2%) are family households, while 82 (35.8%) are nonfamily households. The most numerous type of family households are 2-person households, comprising 87, and the most common type of nonfamily households are 1-person households, comprising 70.
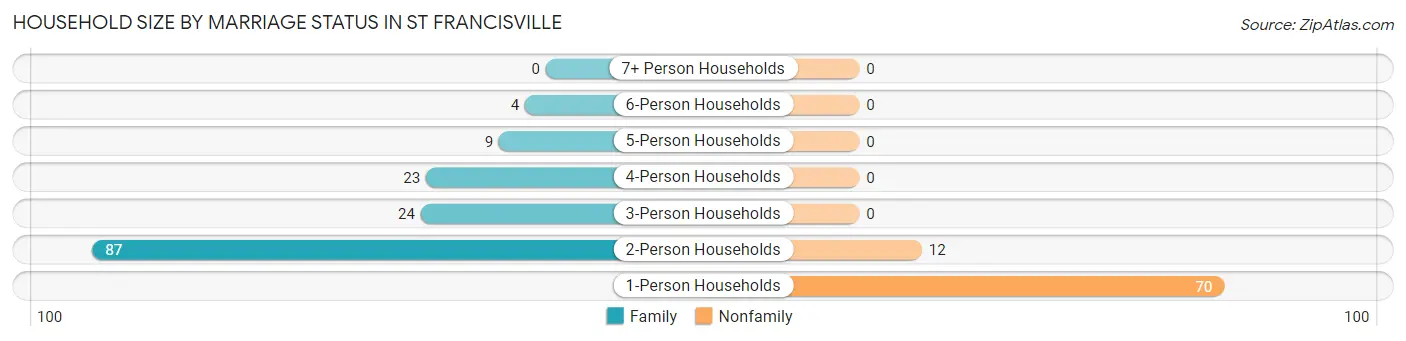
| Household Size | Family Households | Nonfamily Households |
| 1-Person Households | - | 70 (30.6%) |
| 2-Person Households | 87 (38.0%) | 12 (5.2%) |
| 3-Person Households | 24 (10.5%) | 0 (0.0%) |
| 4-Person Households | 23 (10.0%) | 0 (0.0%) |
| 5-Person Households | 9 (3.9%) | 0 (0.0%) |
| 6-Person Households | 4 (1.8%) | 0 (0.0%) |
| 7+ Person Households | 0 (0.0%) | 0 (0.0%) |
| Total | 147 (64.2%) | 82 (35.8%) |
Female Fertility in St Francisville
Fertility by Age in St Francisville
Average fertility rate in St Francisville is 132.0 births per 1,000 women. Women in the age bracket of 15 to 19 years have the highest fertility rate with 417.0 births per 1,000 women. Women in the age bracket of 15 to 19 years acount for 71.4% of all women with births.
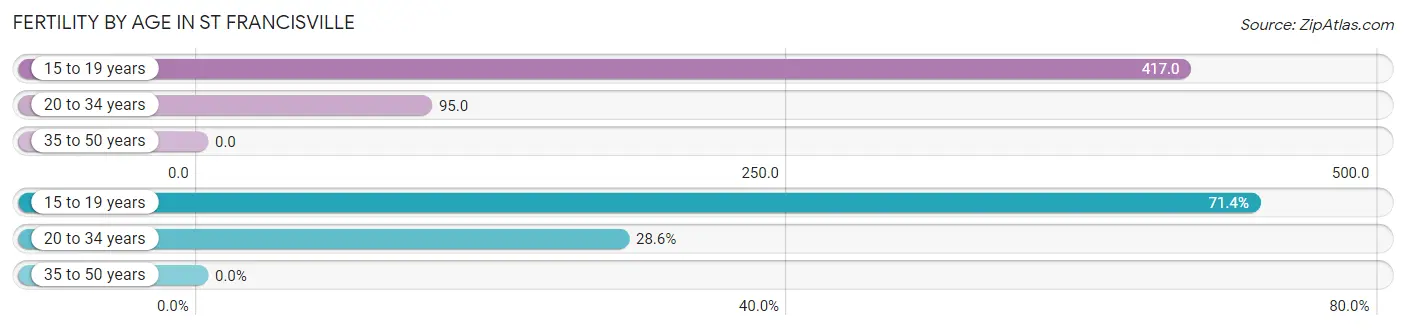
| Age Bracket | Women with Births | Births / 1,000 Women |
| 15 to 19 years | 10 (71.4%) | 417.0 |
| 20 to 34 years | 4 (28.6%) | 95.0 |
| 35 to 50 years | 0 (0.0%) | 0.0 |
| Total | 14 (100.0%) | 132.0 |
Fertility by Age by Marriage Status in St Francisville
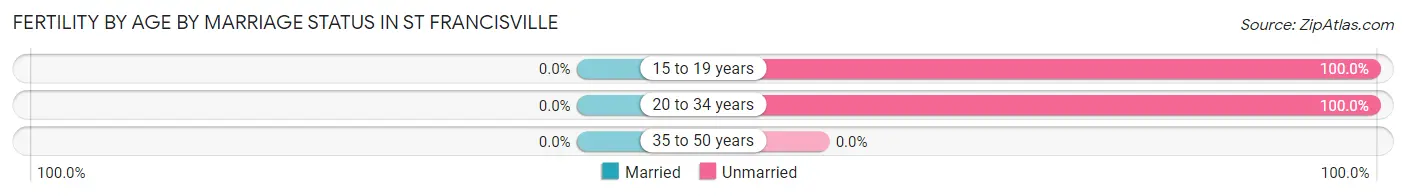
| Age Bracket | Married | Unmarried |
| 15 to 19 years | 0 (0.0%) | 10 (100.0%) |
| 20 to 34 years | 0 (0.0%) | 4 (100.0%) |
| 35 to 50 years | 0 (0.0%) | 0 (0.0%) |
| Total | 0 (0.0%) | 14 (100.0%) |
Fertility by Education in St Francisville
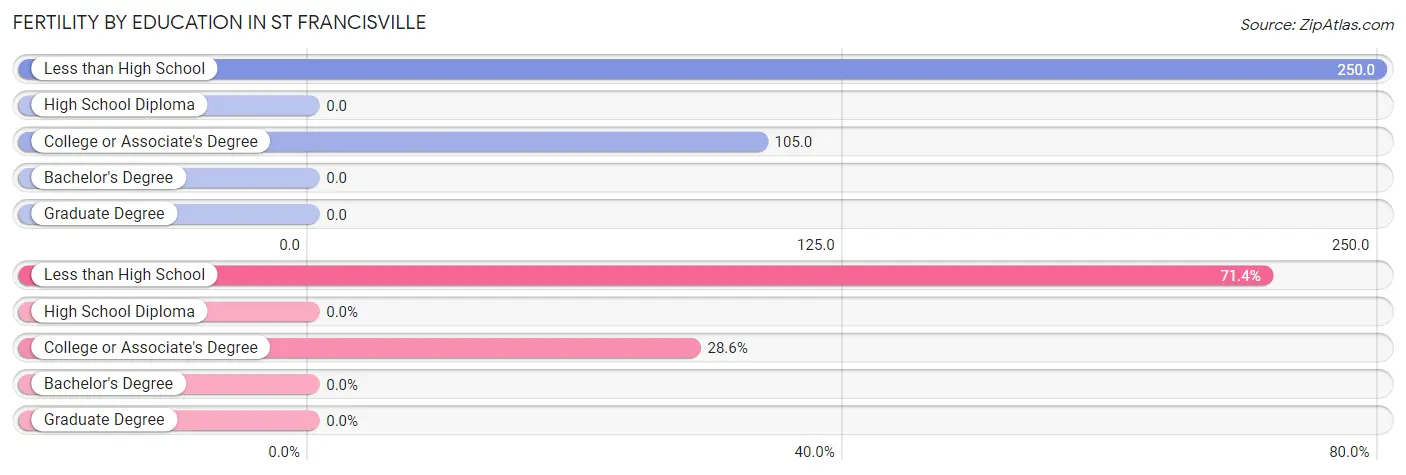
| Educational Attainment | Women with Births | Births / 1,000 Women |
| Less than High School | 10 (71.4%) | 250.0 |
| High School Diploma | 0 (0.0%) | 0.0 |
| College or Associate's Degree | 4 (28.6%) | 105.0 |
| Bachelor's Degree | 0 (0.0%) | 0.0 |
| Graduate Degree | 0 (0.0%) | 0.0 |
| Total | 14 (100.0%) | 132.0 |
Fertility by Education by Marriage Status in St Francisville
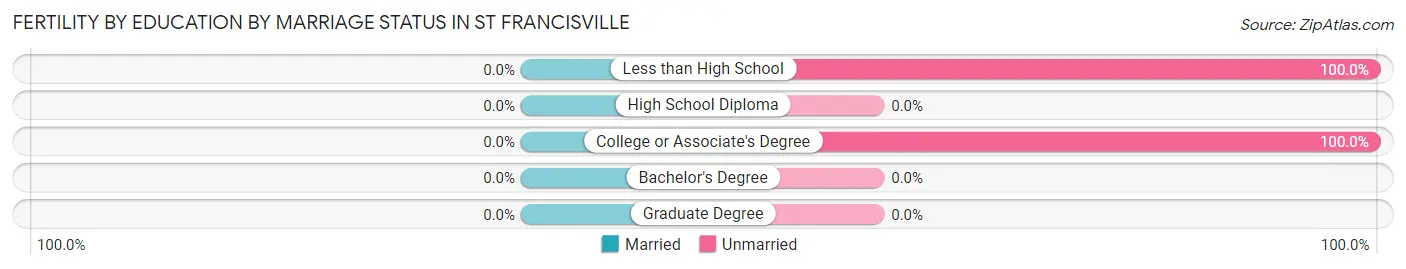
| Educational Attainment | Married | Unmarried |
| Less than High School | 0 (0.0%) | 10 (100.0%) |
| High School Diploma | 0 (0.0%) | 0 (0.0%) |
| College or Associate's Degree | 0 (0.0%) | 4 (100.0%) |
| Bachelor's Degree | 0 (0.0%) | 0 (0.0%) |
| Graduate Degree | 0 (0.0%) | 0 (0.0%) |
| Total | 0 (0.0%) | 14 (100.0%) |
Employment Characteristics in St Francisville
Employment by Class of Employer in St Francisville
Among the 280 employed individuals in St Francisville, private company employees (128 | 45.7%), self-employed (not incorporated) (94 | 33.6%), and state government employees (21 | 7.5%) make up the most common classes of employment.
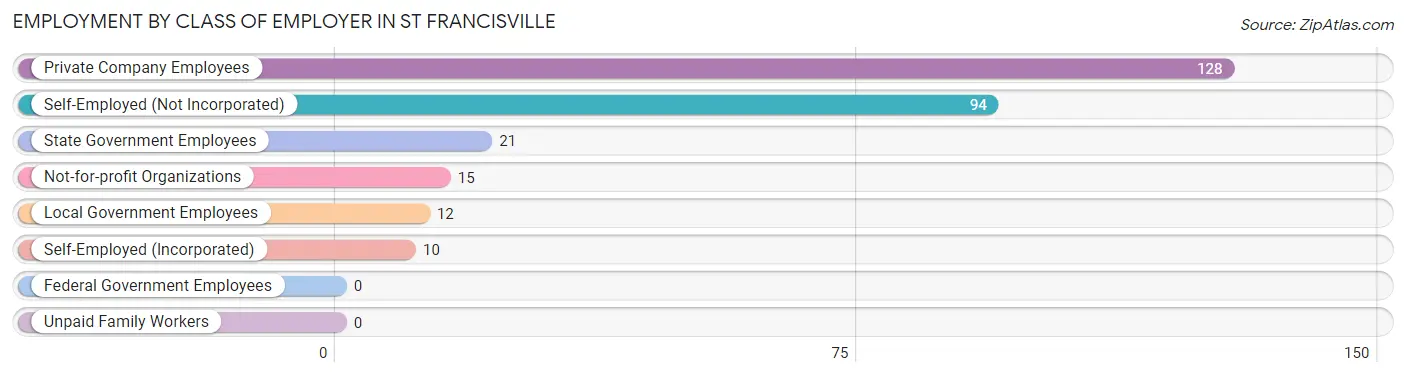
| Employer Class | # Employees | % Employees |
| Private Company Employees | 128 | 45.7% |
| Self-Employed (Incorporated) | 10 | 3.6% |
| Self-Employed (Not Incorporated) | 94 | 33.6% |
| Not-for-profit Organizations | 15 | 5.4% |
| Local Government Employees | 12 | 4.3% |
| State Government Employees | 21 | 7.5% |
| Federal Government Employees | 0 | 0.0% |
| Unpaid Family Workers | 0 | 0.0% |
| Total | 280 | 100.0% |
Employment Status by Age in St Francisville
According to the labor force statistics for St Francisville, out of the total population over 16 years of age (585), 58.1% or 340 individuals are in the labor force, with 17.1% or 58 of them unemployed. The age group with the highest labor force participation rate is 45 to 54 years, with 90.0% or 27 individuals in the labor force. Within the labor force, the 30 to 34 years age range has the highest percentage of unemployed individuals, with 30.6% or 11 of them being unemployed.
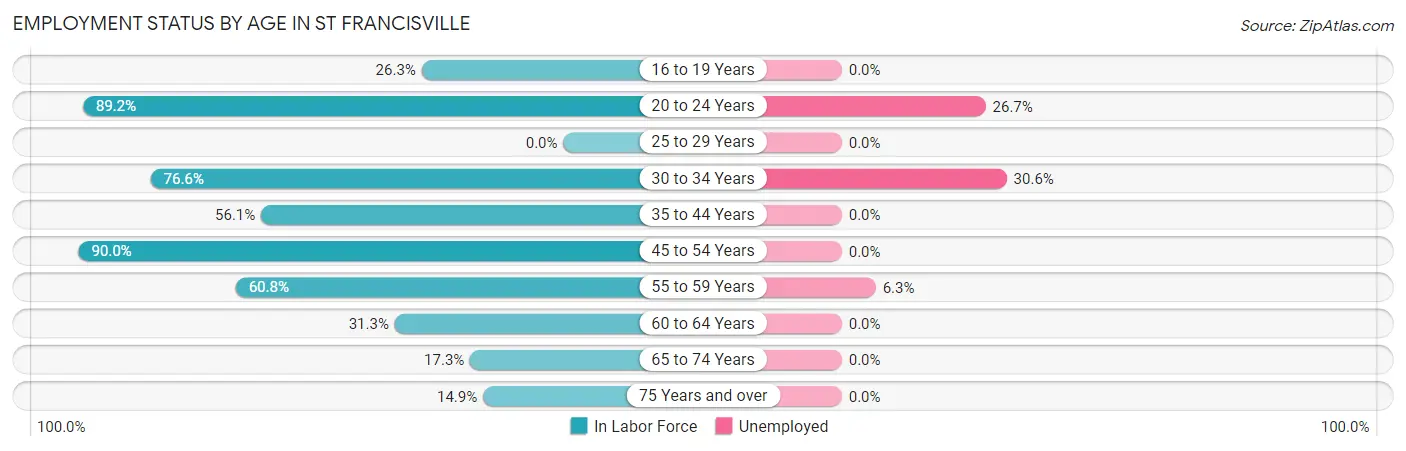
| Age Bracket | In Labor Force | Unemployed |
| 16 to 19 Years | 5 (26.3%) | 0 (0.0%) |
| 20 to 24 Years | 165 (89.2%) | 44 (26.7%) |
| 25 to 29 Years | 0 (0.0%) | 0 (0.0%) |
| 30 to 34 Years | 36 (76.6%) | 11 (30.6%) |
| 35 to 44 Years | 23 (56.1%) | 0 (0.0%) |
| 45 to 54 Years | 27 (90.0%) | 0 (0.0%) |
| 55 to 59 Years | 48 (60.8%) | 3 (6.3%) |
| 60 to 64 Years | 15 (31.3%) | 0 (0.0%) |
| 65 to 74 Years | 14 (17.3%) | 0 (0.0%) |
| 75 Years and over | 7 (14.9%) | 0 (0.0%) |
| Total | 340 (58.1%) | 58 (17.1%) |
Employment Status by Educational Attainment in St Francisville
According to labor force statistics for St Francisville, 58.9% of individuals (149) out of the total population between 25 and 64 years of age (253) are in the labor force, with 9.4% or 14 of them being unemployed. The group with the highest labor force participation rate are those with the educational attainment of bachelor's degree or higher, with 73.5% or 36 individuals in the labor force. Within the labor force, individuals with less than high school education have the highest percentage of unemployment, with 47.8% or 11 of them being unemployed.
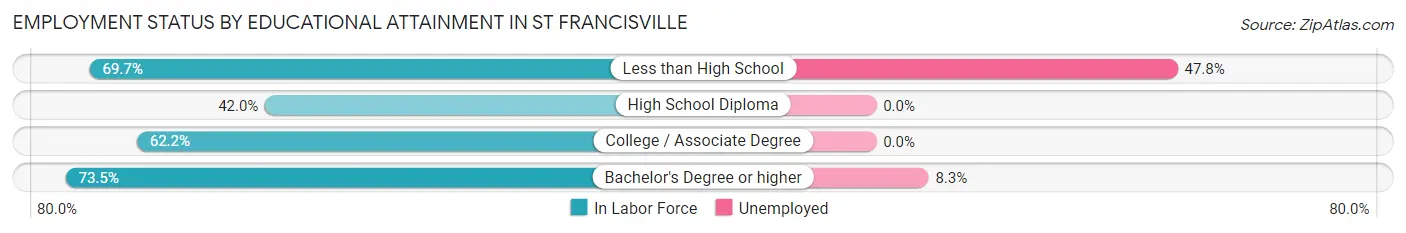
| Educational Attainment | In Labor Force | Unemployed |
| Less than High School | 23 (69.7%) | 16 (47.8%) |
| High School Diploma | 34 (42.0%) | 0 (0.0%) |
| College / Associate Degree | 56 (62.2%) | 0 (0.0%) |
| Bachelor's Degree or higher | 36 (73.5%) | 4 (8.3%) |
| Total | 149 (58.9%) | 24 (9.4%) |
Employment Occupations by Sex in St Francisville
Management, Business, Science and Arts Occupations
The most common Management, Business, Science and Arts occupations in St Francisville are Health Diagnosing & Treating (14 | 5.0%), Management (11 | 3.9%), Community & Social Service (8 | 2.8%), Business & Financial (7 | 2.5%), and Computers, Engineering & Science (6 | 2.1%).
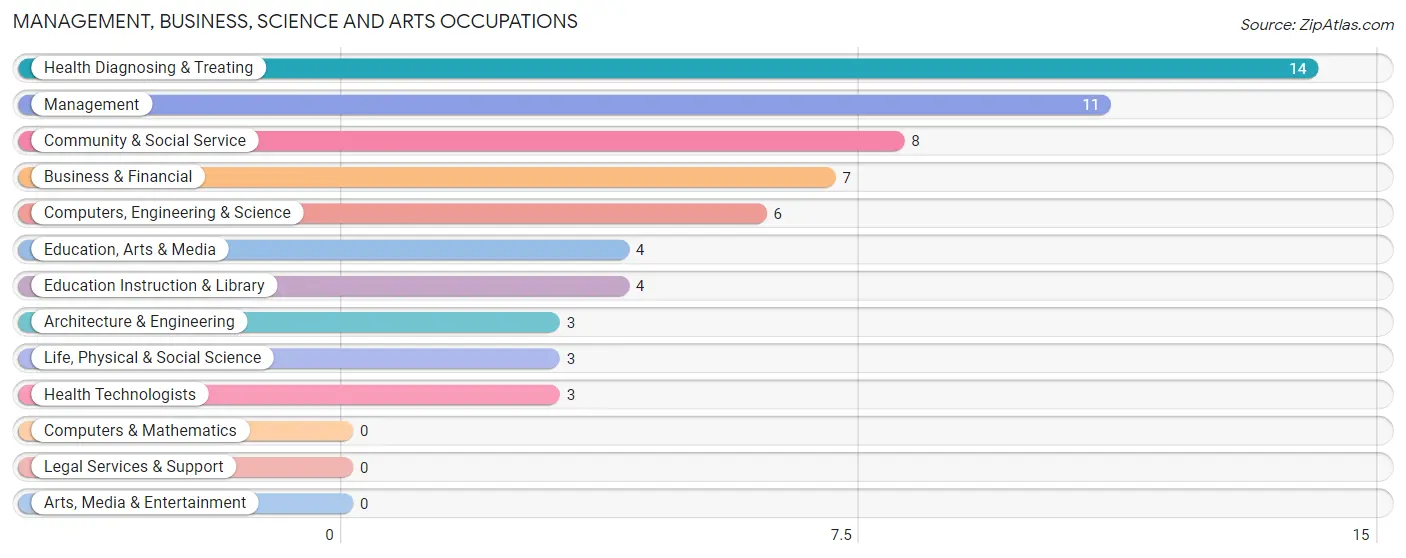
Management, Business, Science and Arts Occupations by Sex
Within the Management, Business, Science and Arts occupations in St Francisville, the most male-oriented occupations are Computers, Engineering & Science (100.0%), Architecture & Engineering (100.0%), and Life, Physical & Social Science (100.0%), while the most female-oriented occupations are Business & Financial (100.0%), Education Instruction & Library (100.0%), and Health Diagnosing & Treating (100.0%).
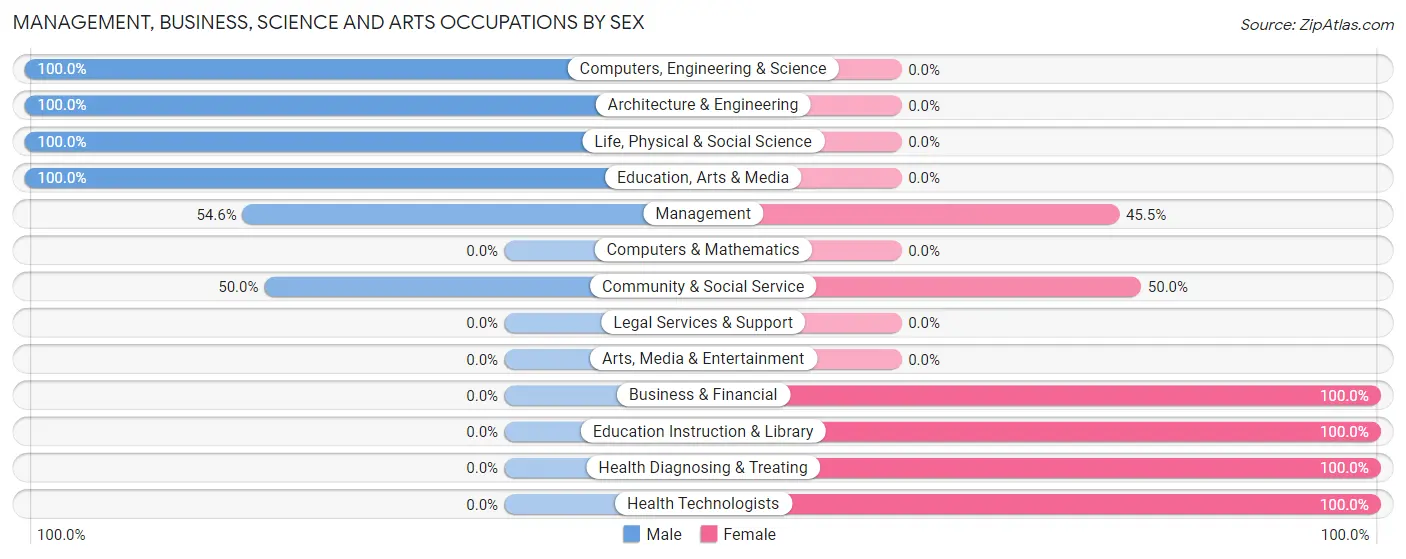
| Occupation | Male | Female |
| Management | 6 (54.5%) | 5 (45.5%) |
| Business & Financial | 0 (0.0%) | 7 (100.0%) |
| Computers, Engineering & Science | 6 (100.0%) | 0 (0.0%) |
| Computers & Mathematics | 0 (0.0%) | 0 (0.0%) |
| Architecture & Engineering | 3 (100.0%) | 0 (0.0%) |
| Life, Physical & Social Science | 3 (100.0%) | 0 (0.0%) |
| Community & Social Service | 4 (50.0%) | 4 (50.0%) |
| Education, Arts & Media | 4 (100.0%) | 0 (0.0%) |
| Legal Services & Support | 0 (0.0%) | 0 (0.0%) |
| Education Instruction & Library | 0 (0.0%) | 4 (100.0%) |
| Arts, Media & Entertainment | 0 (0.0%) | 0 (0.0%) |
| Health Diagnosing & Treating | 0 (0.0%) | 14 (100.0%) |
| Health Technologists | 0 (0.0%) | 3 (100.0%) |
| Total (Category) | 16 (34.8%) | 30 (65.2%) |
| Total (Overall) | 200 (70.9%) | 82 (29.1%) |
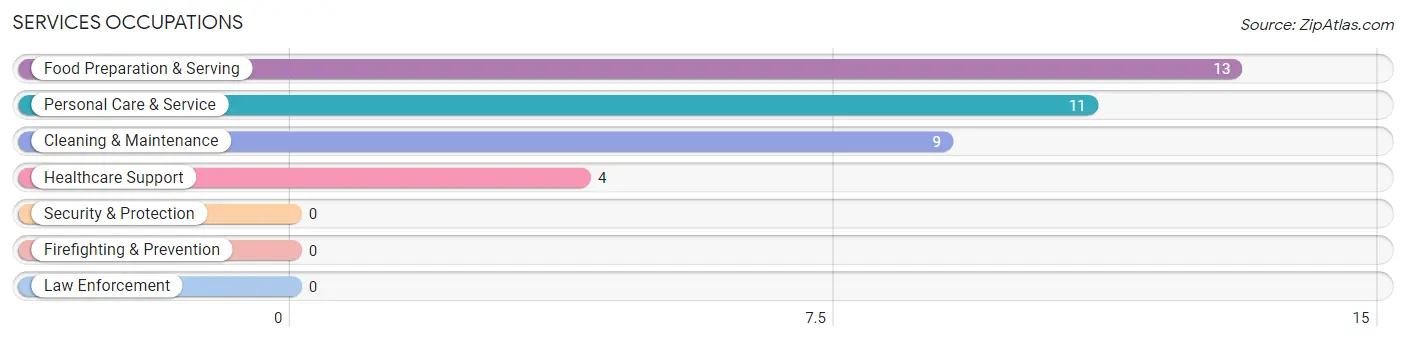
Services Occupations
The most common Services occupations in St Francisville are Food Preparation & Serving (13 | 4.6%), Personal Care & Service (11 | 3.9%), Cleaning & Maintenance (9 | 3.2%), and Healthcare Support (4 | 1.4%).
Services Occupations by Sex
Within the Services occupations in St Francisville, the most male-oriented occupations are Cleaning & Maintenance (100.0%), Personal Care & Service (63.6%), and Food Preparation & Serving (7.7%), while the most female-oriented occupations are Healthcare Support (100.0%), Food Preparation & Serving (92.3%), and Personal Care & Service (36.4%).
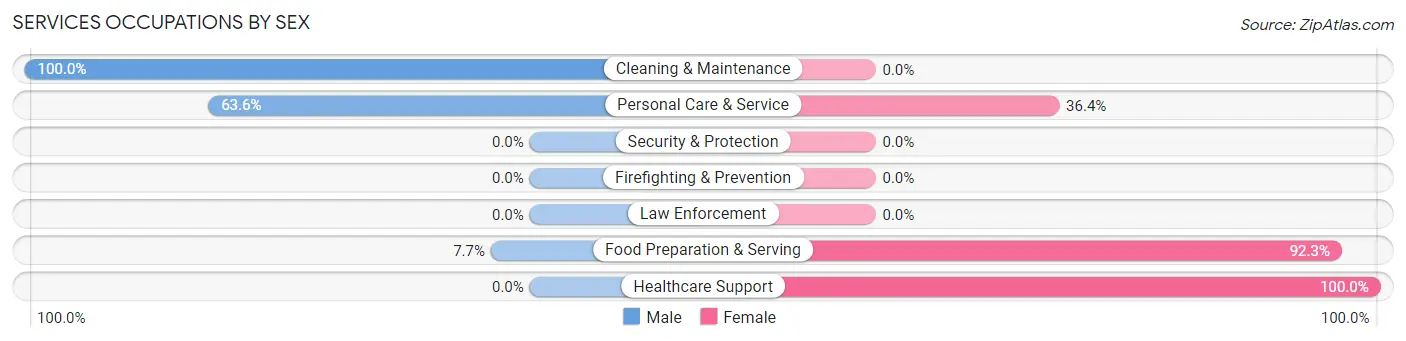
| Occupation | Male | Female |
| Healthcare Support | 0 (0.0%) | 4 (100.0%) |
| Security & Protection | 0 (0.0%) | 0 (0.0%) |
| Firefighting & Prevention | 0 (0.0%) | 0 (0.0%) |
| Law Enforcement | 0 (0.0%) | 0 (0.0%) |
| Food Preparation & Serving | 1 (7.7%) | 12 (92.3%) |
| Cleaning & Maintenance | 9 (100.0%) | 0 (0.0%) |
| Personal Care & Service | 7 (63.6%) | 4 (36.4%) |
| Total (Category) | 17 (46.0%) | 20 (54.0%) |
| Total (Overall) | 200 (70.9%) | 82 (29.1%) |
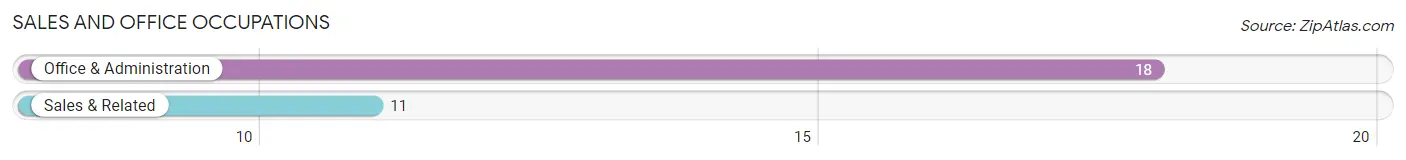
Sales and Office Occupations
The most common Sales and Office occupations in St Francisville are Office & Administration (18 | 6.4%), and Sales & Related (11 | 3.9%).
Sales and Office Occupations by Sex
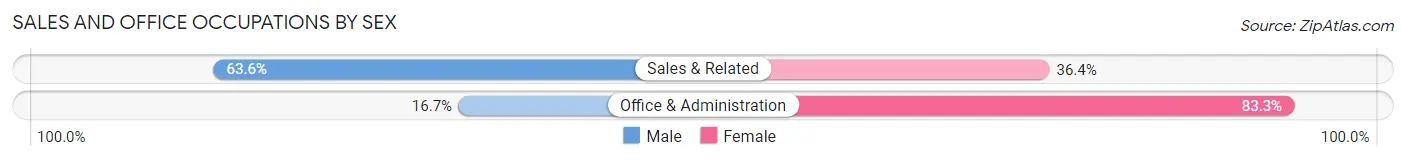
| Occupation | Male | Female |
| Sales & Related | 7 (63.6%) | 4 (36.4%) |
| Office & Administration | 3 (16.7%) | 15 (83.3%) |
| Total (Category) | 10 (34.5%) | 19 (65.5%) |
| Total (Overall) | 200 (70.9%) | 82 (29.1%) |
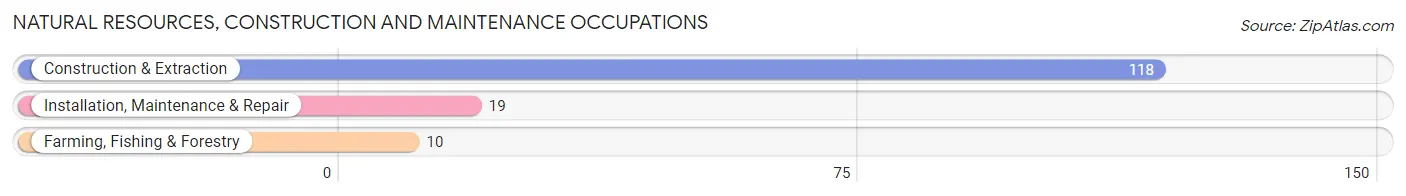
Natural Resources, Construction and Maintenance Occupations
The most common Natural Resources, Construction and Maintenance occupations in St Francisville are Construction & Extraction (118 | 41.8%), Installation, Maintenance & Repair (19 | 6.7%), and Farming, Fishing & Forestry (10 | 3.5%).
Natural Resources, Construction and Maintenance Occupations by Sex
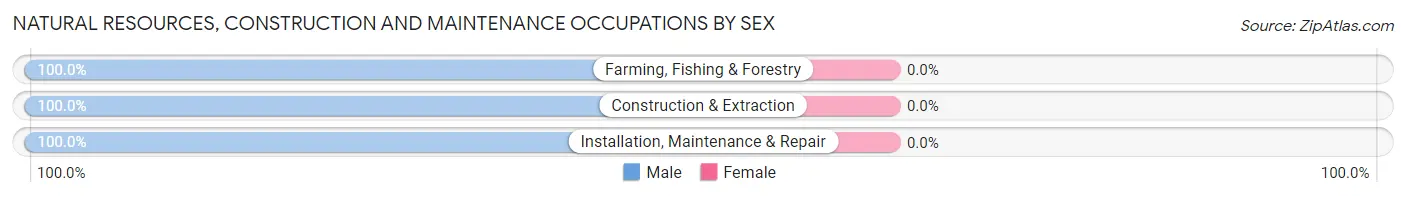
| Occupation | Male | Female |
| Farming, Fishing & Forestry | 10 (100.0%) | 0 (0.0%) |
| Construction & Extraction | 118 (100.0%) | 0 (0.0%) |
| Installation, Maintenance & Repair | 19 (100.0%) | 0 (0.0%) |
| Total (Category) | 147 (100.0%) | 0 (0.0%) |
| Total (Overall) | 200 (70.9%) | 82 (29.1%) |
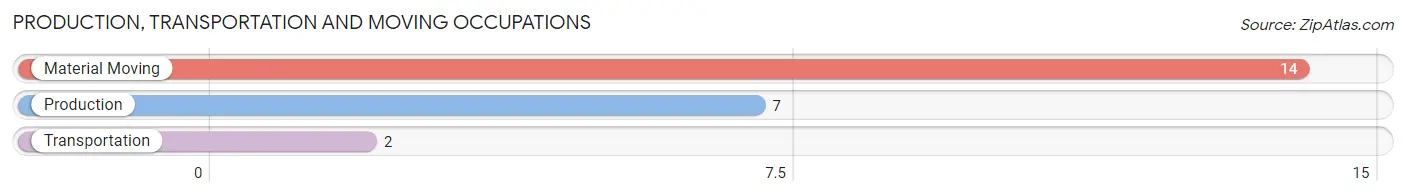
Production, Transportation and Moving Occupations
The most common Production, Transportation and Moving occupations in St Francisville are Material Moving (14 | 5.0%), Production (7 | 2.5%), and Transportation (2 | 0.7%).
Production, Transportation and Moving Occupations by Sex
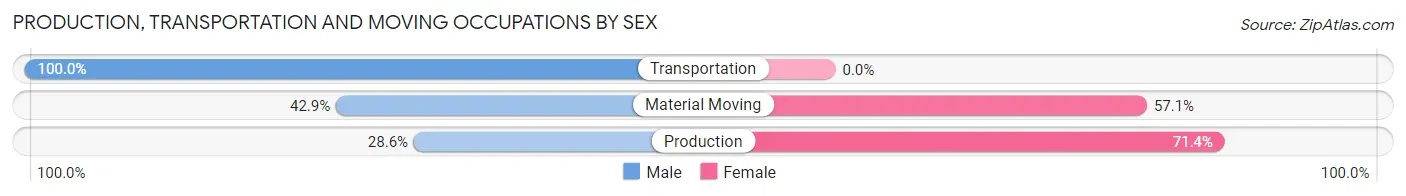
| Occupation | Male | Female |
| Production | 2 (28.6%) | 5 (71.4%) |
| Transportation | 2 (100.0%) | 0 (0.0%) |
| Material Moving | 6 (42.9%) | 8 (57.1%) |
| Total (Category) | 10 (43.5%) | 13 (56.5%) |
| Total (Overall) | 200 (70.9%) | 82 (29.1%) |
Employment Industries by Sex in St Francisville
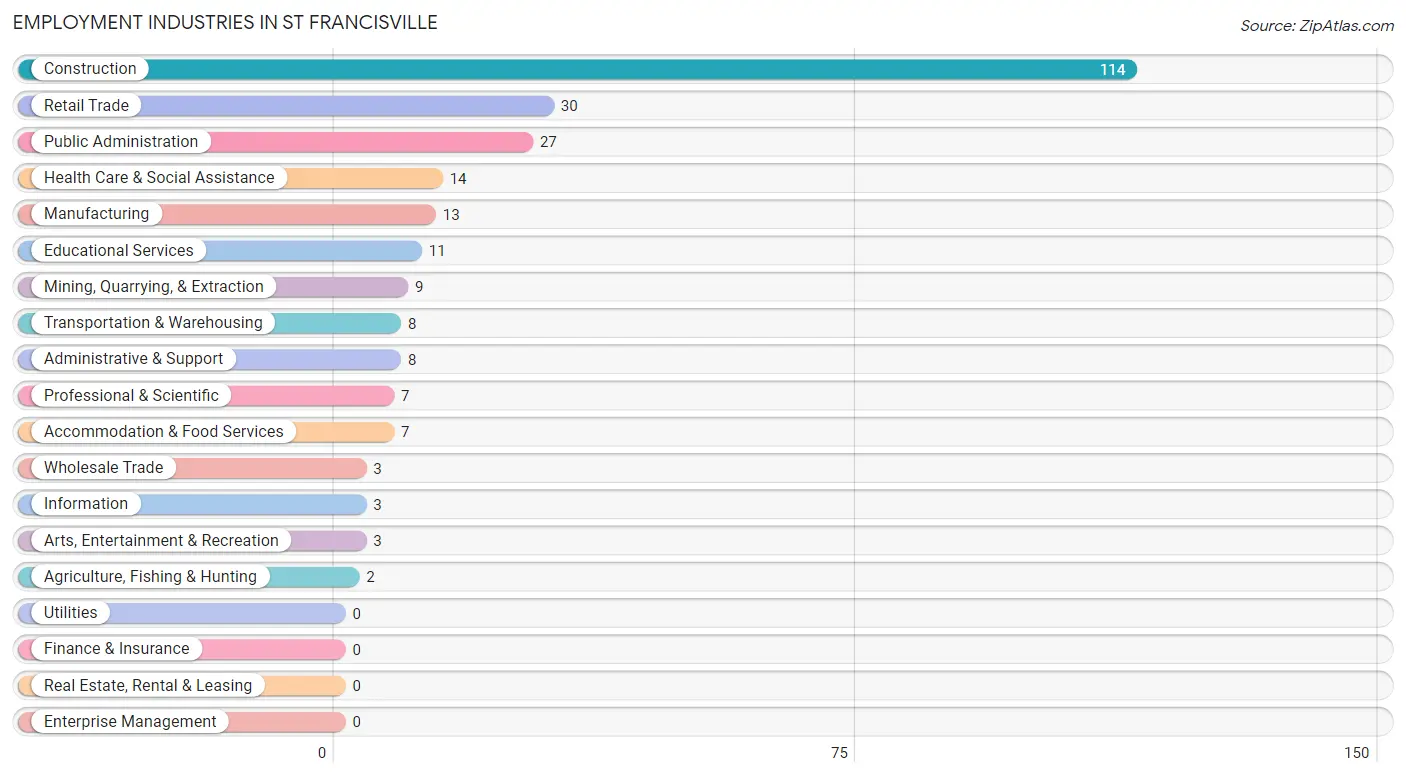
Employment Industries in St Francisville
The major employment industries in St Francisville include Construction (114 | 40.4%), Retail Trade (30 | 10.6%), Public Administration (27 | 9.6%), Health Care & Social Assistance (14 | 5.0%), and Manufacturing (13 | 4.6%).
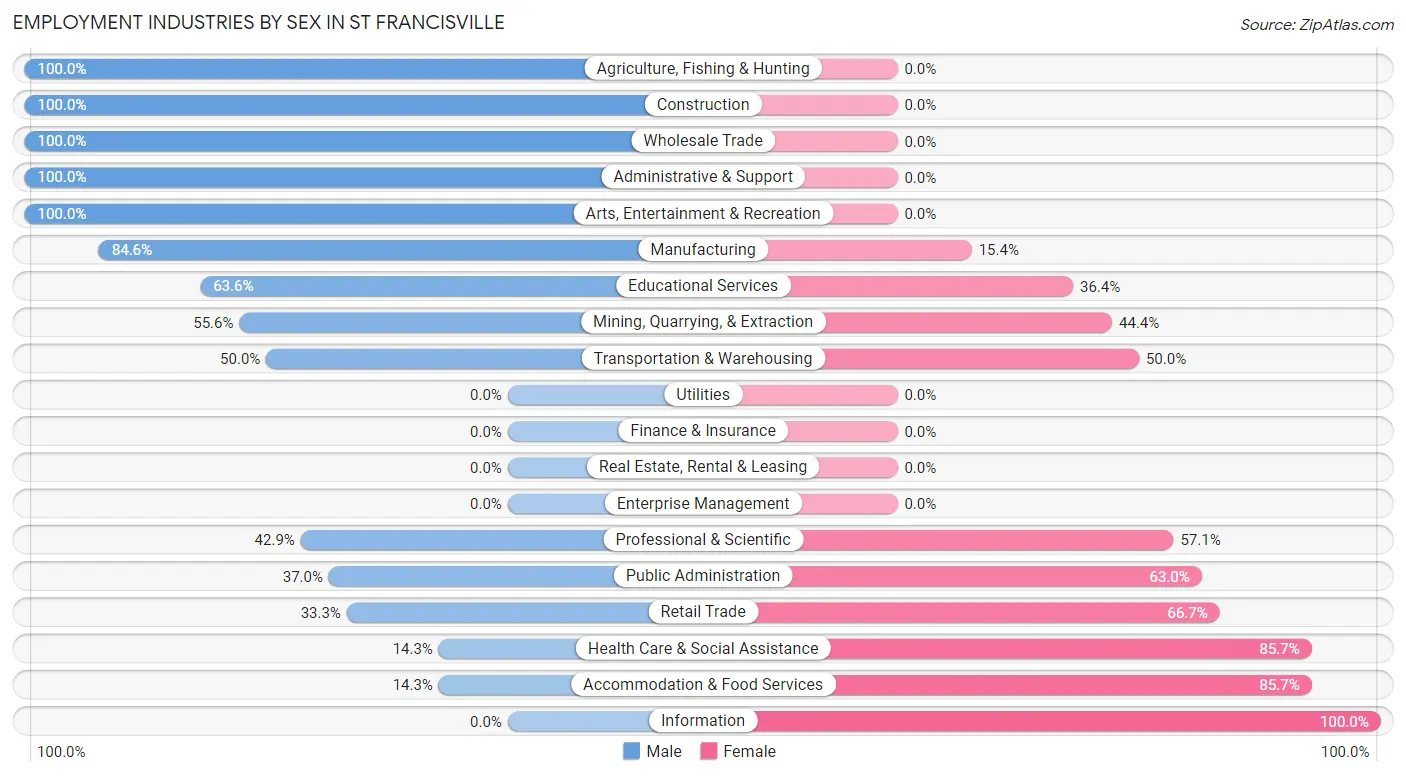
Employment Industries by Sex in St Francisville
The St Francisville industries that see more men than women are Agriculture, Fishing & Hunting (100.0%), Construction (100.0%), and Wholesale Trade (100.0%), whereas the industries that tend to have a higher number of women are Information (100.0%), Health Care & Social Assistance (85.7%), and Accommodation & Food Services (85.7%).
| Industry | Male | Female |
| Agriculture, Fishing & Hunting | 2 (100.0%) | 0 (0.0%) |
| Mining, Quarrying, & Extraction | 5 (55.6%) | 4 (44.4%) |
| Construction | 114 (100.0%) | 0 (0.0%) |
| Manufacturing | 11 (84.6%) | 2 (15.4%) |
| Wholesale Trade | 3 (100.0%) | 0 (0.0%) |
| Retail Trade | 10 (33.3%) | 20 (66.7%) |
| Transportation & Warehousing | 4 (50.0%) | 4 (50.0%) |
| Utilities | 0 (0.0%) | 0 (0.0%) |
| Information | 0 (0.0%) | 3 (100.0%) |
| Finance & Insurance | 0 (0.0%) | 0 (0.0%) |
| Real Estate, Rental & Leasing | 0 (0.0%) | 0 (0.0%) |
| Professional & Scientific | 3 (42.9%) | 4 (57.1%) |
| Enterprise Management | 0 (0.0%) | 0 (0.0%) |
| Administrative & Support | 8 (100.0%) | 0 (0.0%) |
| Educational Services | 7 (63.6%) | 4 (36.4%) |
| Health Care & Social Assistance | 2 (14.3%) | 12 (85.7%) |
| Arts, Entertainment & Recreation | 3 (100.0%) | 0 (0.0%) |
| Accommodation & Food Services | 1 (14.3%) | 6 (85.7%) |
| Public Administration | 10 (37.0%) | 17 (63.0%) |
| Total | 200 (70.9%) | 82 (29.1%) |
Education in St Francisville
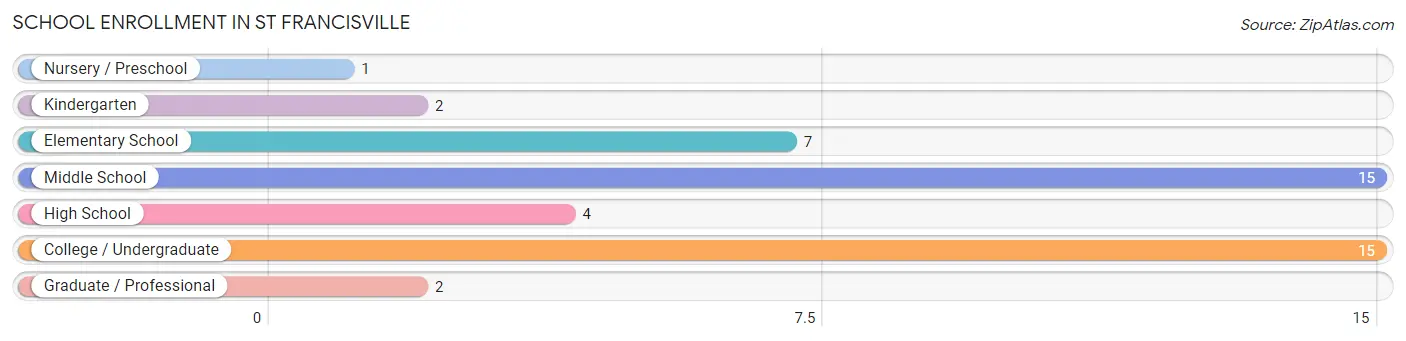
School Enrollment in St Francisville
The most common levels of schooling among the 46 students in St Francisville are middle school (15 | 32.6%), college / undergraduate (15 | 32.6%), and elementary school (7 | 15.2%).
| School Level | # Students | % Students |
| Nursery / Preschool | 1 | 2.2% |
| Kindergarten | 2 | 4.3% |
| Elementary School | 7 | 15.2% |
| Middle School | 15 | 32.6% |
| High School | 4 | 8.7% |
| College / Undergraduate | 15 | 32.6% |
| Graduate / Professional | 2 | 4.3% |
| Total | 46 | 100.0% |
School Enrollment by Age by Funding Source in St Francisville
Out of a total of 46 students who are enrolled in schools in St Francisville, 3 (6.5%) attend a private institution, while the remaining 43 (93.5%) are enrolled in public schools. The age group of 3 to 4 year olds has the highest likelihood of being enrolled in private schools, with 1 (100.0% in the age bracket) enrolled. Conversely, the age group of 5 to 9 year old has the lowest likelihood of being enrolled in a private school, with 7 (100.0% in the age bracket) attending a public institution.
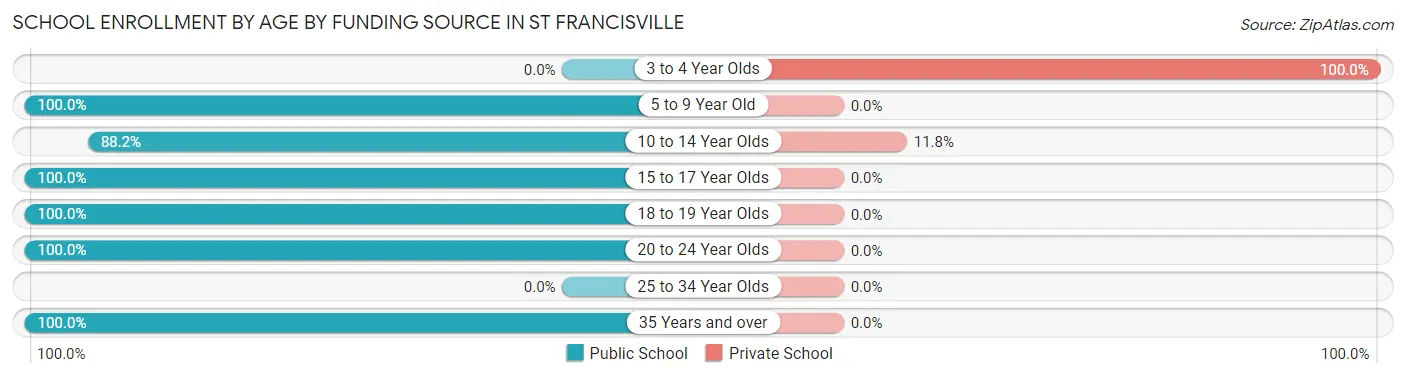
| Age Bracket | Public School | Private School |
| 3 to 4 Year Olds | 0 (0.0%) | 1 (100.0%) |
| 5 to 9 Year Old | 7 (100.0%) | 0 (0.0%) |
| 10 to 14 Year Olds | 15 (88.2%) | 2 (11.8%) |
| 15 to 17 Year Olds | 2 (100.0%) | 0 (0.0%) |
| 18 to 19 Year Olds | 2 (100.0%) | 0 (0.0%) |
| 20 to 24 Year Olds | 12 (100.0%) | 0 (0.0%) |
| 25 to 34 Year Olds | 0 (0.0%) | 0 (0.0%) |
| 35 Years and over | 5 (100.0%) | 0 (0.0%) |
| Total | 43 (93.5%) | 3 (6.5%) |
Educational Attainment by Field of Study in St Francisville
Business (23 | 27.1%), education (19 | 22.4%), physical & health sciences (13 | 15.3%), science & technology (9 | 10.6%), and liberal arts & history (8 | 9.4%) are the most common fields of study among 85 individuals in St Francisville who have obtained a bachelor's degree or higher.
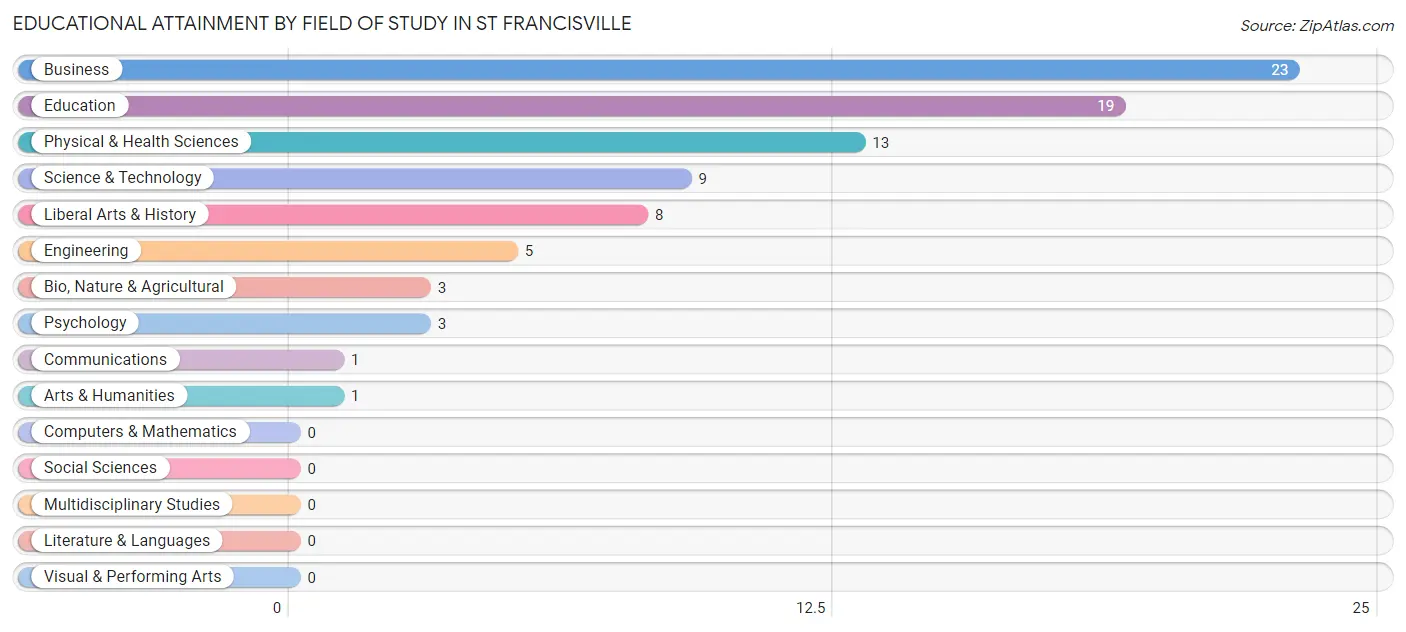
| Field of Study | # Graduates | % Graduates |
| Computers & Mathematics | 0 | 0.0% |
| Bio, Nature & Agricultural | 3 | 3.5% |
| Physical & Health Sciences | 13 | 15.3% |
| Psychology | 3 | 3.5% |
| Social Sciences | 0 | 0.0% |
| Engineering | 5 | 5.9% |
| Multidisciplinary Studies | 0 | 0.0% |
| Science & Technology | 9 | 10.6% |
| Business | 23 | 27.1% |
| Education | 19 | 22.4% |
| Literature & Languages | 0 | 0.0% |
| Liberal Arts & History | 8 | 9.4% |
| Visual & Performing Arts | 0 | 0.0% |
| Communications | 1 | 1.2% |
| Arts & Humanities | 1 | 1.2% |
| Total | 85 | 100.0% |
Transportation & Commute in St Francisville
Vehicle Availability by Sex in St Francisville
The most prevalent vehicle ownership categories in St Francisville are males with 2 vehicles (121, accounting for 60.5%) and females with 2 vehicles (34, making up 151.2%).
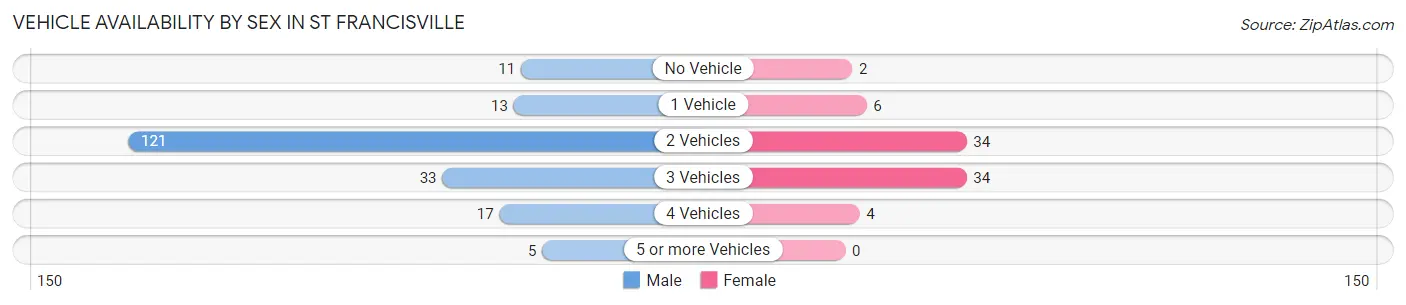
| Vehicles Available | Male | Female |
| No Vehicle | 11 (5.5%) | 2 (2.5%) |
| 1 Vehicle | 13 (6.5%) | 6 (7.5%) |
| 2 Vehicles | 121 (60.5%) | 34 (42.5%) |
| 3 Vehicles | 33 (16.5%) | 34 (42.5%) |
| 4 Vehicles | 17 (8.5%) | 4 (5.0%) |
| 5 or more Vehicles | 5 (2.5%) | 0 (0.0%) |
| Total | 200 (100.0%) | 80 (100.0%) |
Commute Time in St Francisville
The most frequently occuring commute durations in St Francisville are 5 to 9 minutes (111 commuters, 40.7%), 25 to 29 minutes (31 commuters, 11.4%), and 15 to 19 minutes (30 commuters, 11.0%).
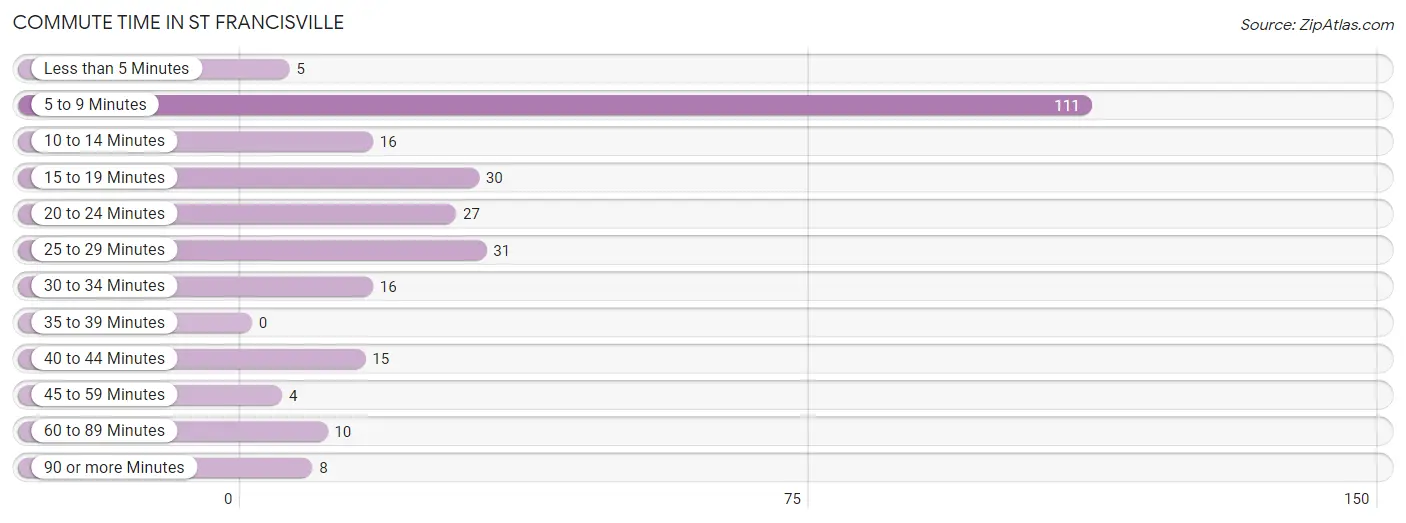
| Commute Time | # Commuters | % Commuters |
| Less than 5 Minutes | 5 | 1.8% |
| 5 to 9 Minutes | 111 | 40.7% |
| 10 to 14 Minutes | 16 | 5.9% |
| 15 to 19 Minutes | 30 | 11.0% |
| 20 to 24 Minutes | 27 | 9.9% |
| 25 to 29 Minutes | 31 | 11.4% |
| 30 to 34 Minutes | 16 | 5.9% |
| 35 to 39 Minutes | 0 | 0.0% |
| 40 to 44 Minutes | 15 | 5.5% |
| 45 to 59 Minutes | 4 | 1.5% |
| 60 to 89 Minutes | 10 | 3.7% |
| 90 or more Minutes | 8 | 2.9% |
Commute Time by Sex in St Francisville
The most common commute times in St Francisville are 5 to 9 minutes (106 commuters, 53.0%) for males and 25 to 29 minutes (19 commuters, 26.0%) for females.
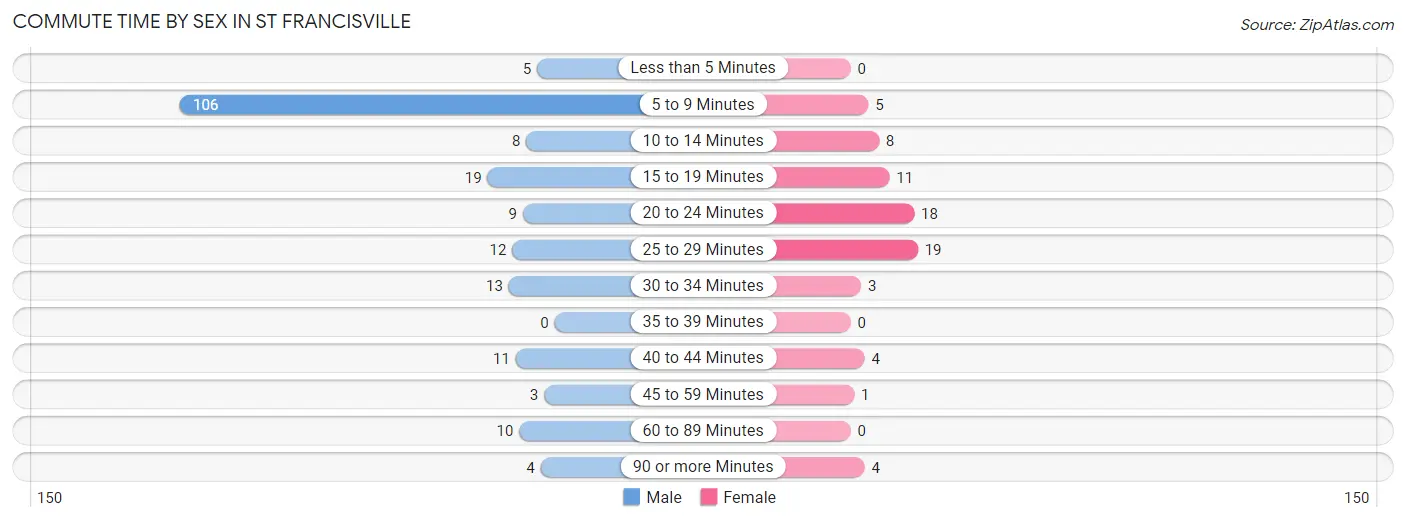
| Commute Time | Male | Female |
| Less than 5 Minutes | 5 (2.5%) | 0 (0.0%) |
| 5 to 9 Minutes | 106 (53.0%) | 5 (6.9%) |
| 10 to 14 Minutes | 8 (4.0%) | 8 (11.0%) |
| 15 to 19 Minutes | 19 (9.5%) | 11 (15.1%) |
| 20 to 24 Minutes | 9 (4.5%) | 18 (24.7%) |
| 25 to 29 Minutes | 12 (6.0%) | 19 (26.0%) |
| 30 to 34 Minutes | 13 (6.5%) | 3 (4.1%) |
| 35 to 39 Minutes | 0 (0.0%) | 0 (0.0%) |
| 40 to 44 Minutes | 11 (5.5%) | 4 (5.5%) |
| 45 to 59 Minutes | 3 (1.5%) | 1 (1.4%) |
| 60 to 89 Minutes | 10 (5.0%) | 0 (0.0%) |
| 90 or more Minutes | 4 (2.0%) | 4 (5.5%) |
Time of Departure to Work by Sex in St Francisville
The most frequent times of departure to work in St Francisville are 6:30 AM to 6:59 AM (98, 49.0%) for males and 4:00 PM to 11:59 PM (17, 23.3%) for females.
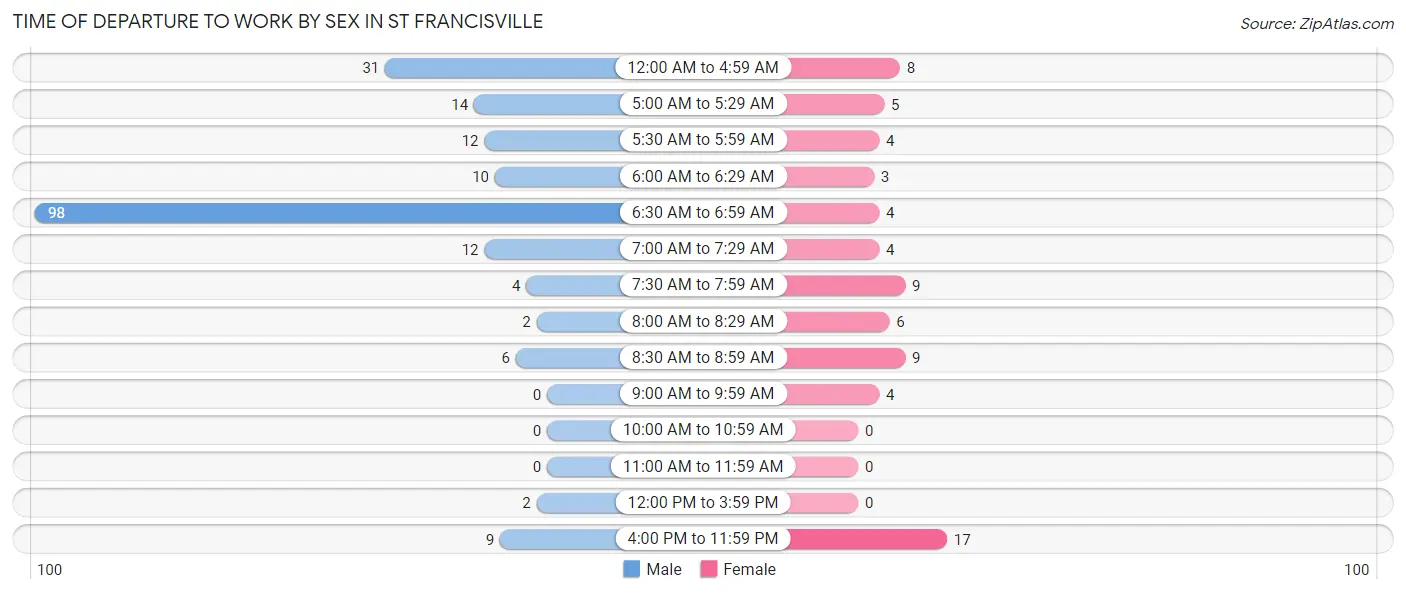
| Time of Departure | Male | Female |
| 12:00 AM to 4:59 AM | 31 (15.5%) | 8 (11.0%) |
| 5:00 AM to 5:29 AM | 14 (7.0%) | 5 (6.9%) |
| 5:30 AM to 5:59 AM | 12 (6.0%) | 4 (5.5%) |
| 6:00 AM to 6:29 AM | 10 (5.0%) | 3 (4.1%) |
| 6:30 AM to 6:59 AM | 98 (49.0%) | 4 (5.5%) |
| 7:00 AM to 7:29 AM | 12 (6.0%) | 4 (5.5%) |
| 7:30 AM to 7:59 AM | 4 (2.0%) | 9 (12.3%) |
| 8:00 AM to 8:29 AM | 2 (1.0%) | 6 (8.2%) |
| 8:30 AM to 8:59 AM | 6 (3.0%) | 9 (12.3%) |
| 9:00 AM to 9:59 AM | 0 (0.0%) | 4 (5.5%) |
| 10:00 AM to 10:59 AM | 0 (0.0%) | 0 (0.0%) |
| 11:00 AM to 11:59 AM | 0 (0.0%) | 0 (0.0%) |
| 12:00 PM to 3:59 PM | 2 (1.0%) | 0 (0.0%) |
| 4:00 PM to 11:59 PM | 9 (4.5%) | 17 (23.3%) |
| Total | 200 (100.0%) | 73 (100.0%) |
Housing Occupancy in St Francisville
Occupancy by Ownership in St Francisville
Of the total 229 dwellings in St Francisville, owner-occupied units account for 182 (79.5%), while renter-occupied units make up 47 (20.5%).
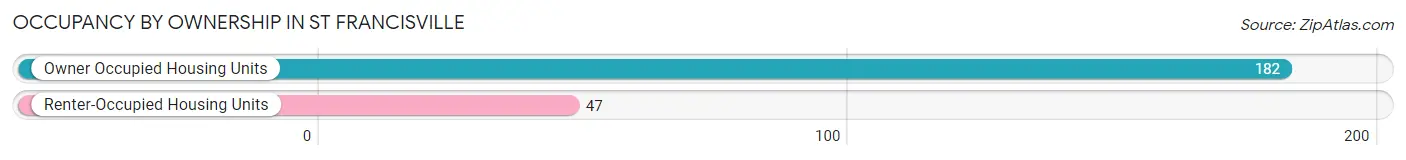
| Occupancy | # Housing Units | % Housing Units |
| Owner Occupied Housing Units | 182 | 79.5% |
| Renter-Occupied Housing Units | 47 | 20.5% |
| Total Occupied Housing Units | 229 | 100.0% |
Occupancy by Household Size in St Francisville
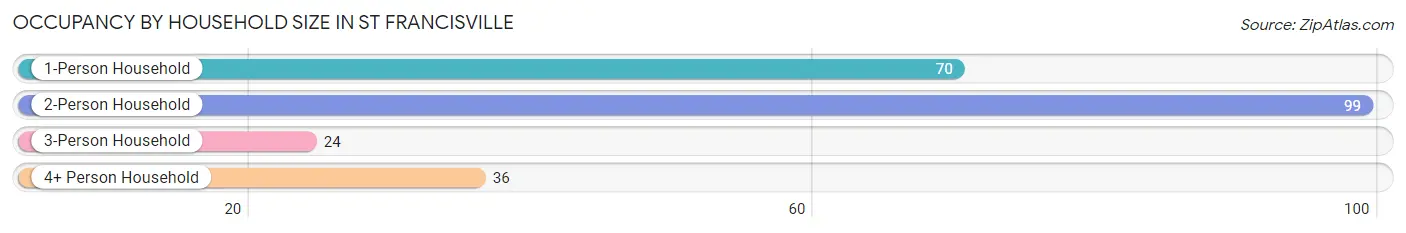
| Household Size | # Housing Units | % Housing Units |
| 1-Person Household | 70 | 30.6% |
| 2-Person Household | 99 | 43.2% |
| 3-Person Household | 24 | 10.5% |
| 4+ Person Household | 36 | 15.7% |
| Total Housing Units | 229 | 100.0% |
Occupancy by Ownership by Household Size in St Francisville
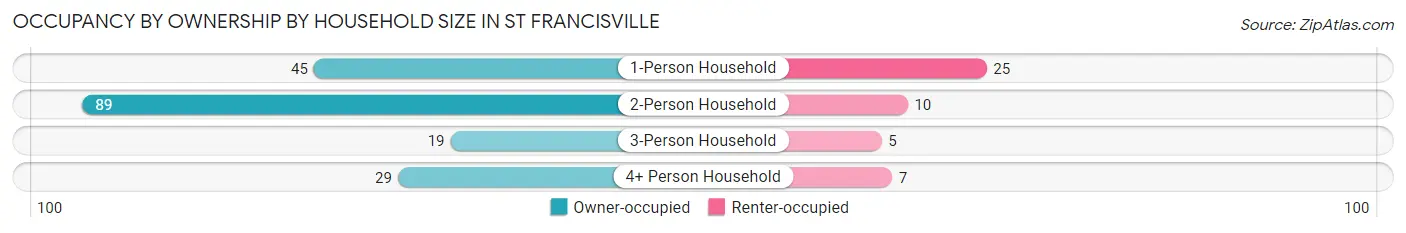
| Household Size | Owner-occupied | Renter-occupied |
| 1-Person Household | 45 (64.3%) | 25 (35.7%) |
| 2-Person Household | 89 (89.9%) | 10 (10.1%) |
| 3-Person Household | 19 (79.2%) | 5 (20.8%) |
| 4+ Person Household | 29 (80.6%) | 7 (19.4%) |
| Total Housing Units | 182 (79.5%) | 47 (20.5%) |
Occupancy by Educational Attainment in St Francisville
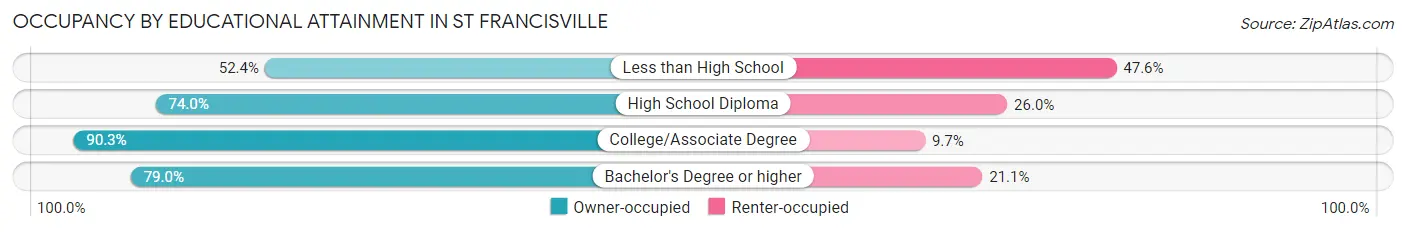
| Household Size | Owner-occupied | Renter-occupied |
| Less than High School | 11 (52.4%) | 10 (47.6%) |
| High School Diploma | 57 (74.0%) | 20 (26.0%) |
| College/Associate Degree | 84 (90.3%) | 9 (9.7%) |
| Bachelor's Degree or higher | 30 (78.9%) | 8 (21.0%) |
Occupancy by Age of Householder in St Francisville
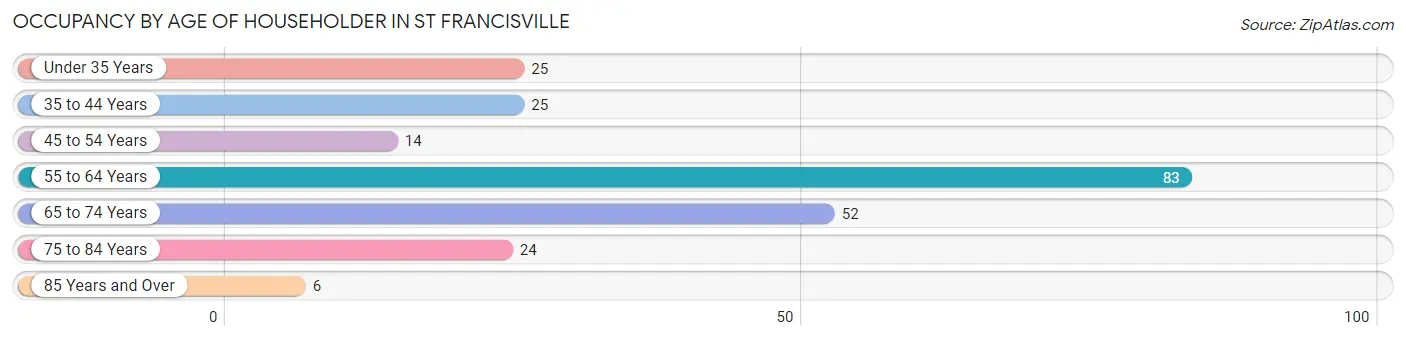
| Age Bracket | # Households | % Households |
| Under 35 Years | 25 | 10.9% |
| 35 to 44 Years | 25 | 10.9% |
| 45 to 54 Years | 14 | 6.1% |
| 55 to 64 Years | 83 | 36.2% |
| 65 to 74 Years | 52 | 22.7% |
| 75 to 84 Years | 24 | 10.5% |
| 85 Years and Over | 6 | 2.6% |
| Total | 229 | 100.0% |
Housing Finances in St Francisville
Median Income by Occupancy in St Francisville
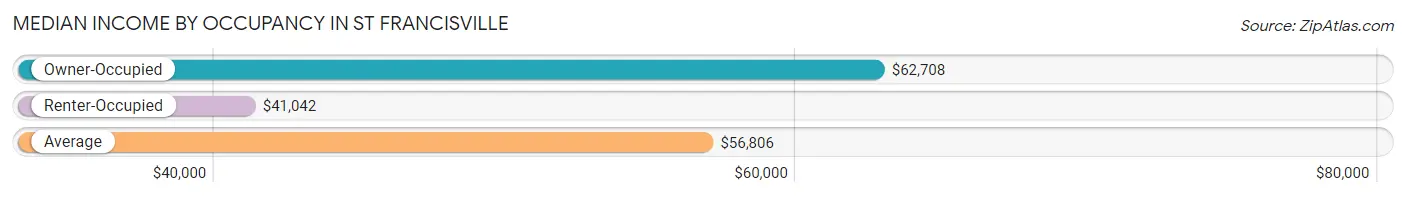
| Occupancy Type | # Households | Median Income |
| Owner-Occupied | 182 (79.5%) | $62,708 |
| Renter-Occupied | 47 (20.5%) | $41,042 |
| Average | 229 (100.0%) | $56,806 |
Occupancy by Householder Income Bracket in St Francisville
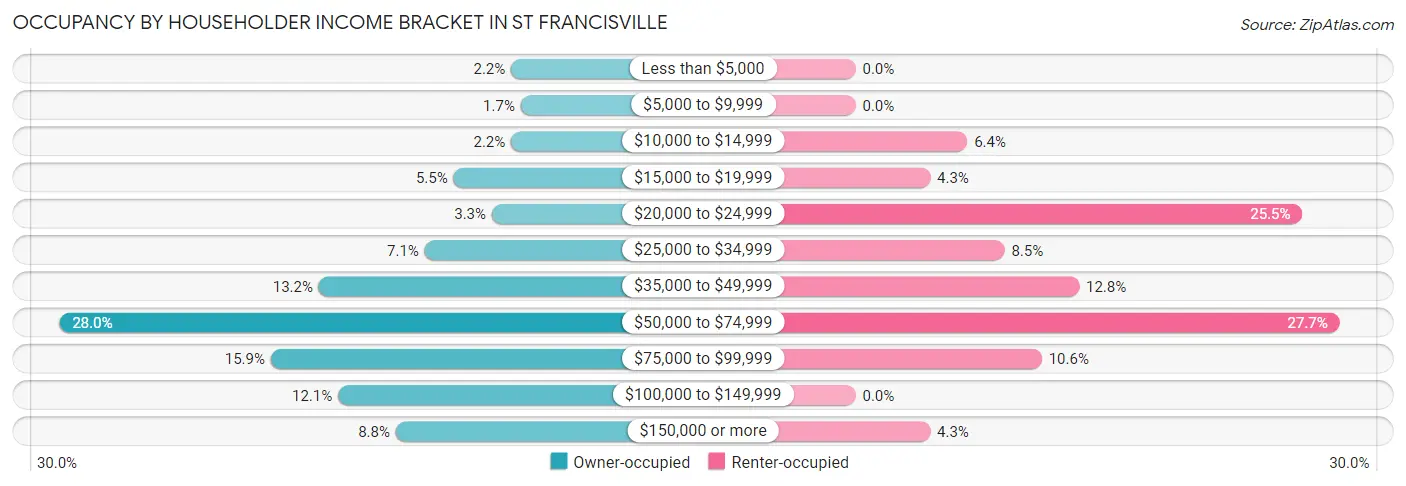
| Income Bracket | Owner-occupied | Renter-occupied |
| Less than $5,000 | 4 (2.2%) | 0 (0.0%) |
| $5,000 to $9,999 | 3 (1.7%) | 0 (0.0%) |
| $10,000 to $14,999 | 4 (2.2%) | 3 (6.4%) |
| $15,000 to $19,999 | 10 (5.5%) | 2 (4.3%) |
| $20,000 to $24,999 | 6 (3.3%) | 12 (25.5%) |
| $25,000 to $34,999 | 13 (7.1%) | 4 (8.5%) |
| $35,000 to $49,999 | 24 (13.2%) | 6 (12.8%) |
| $50,000 to $74,999 | 51 (28.0%) | 13 (27.7%) |
| $75,000 to $99,999 | 29 (15.9%) | 5 (10.6%) |
| $100,000 to $149,999 | 22 (12.1%) | 0 (0.0%) |
| $150,000 or more | 16 (8.8%) | 2 (4.3%) |
| Total | 182 (100.0%) | 47 (100.0%) |
Monthly Housing Cost Tiers in St Francisville
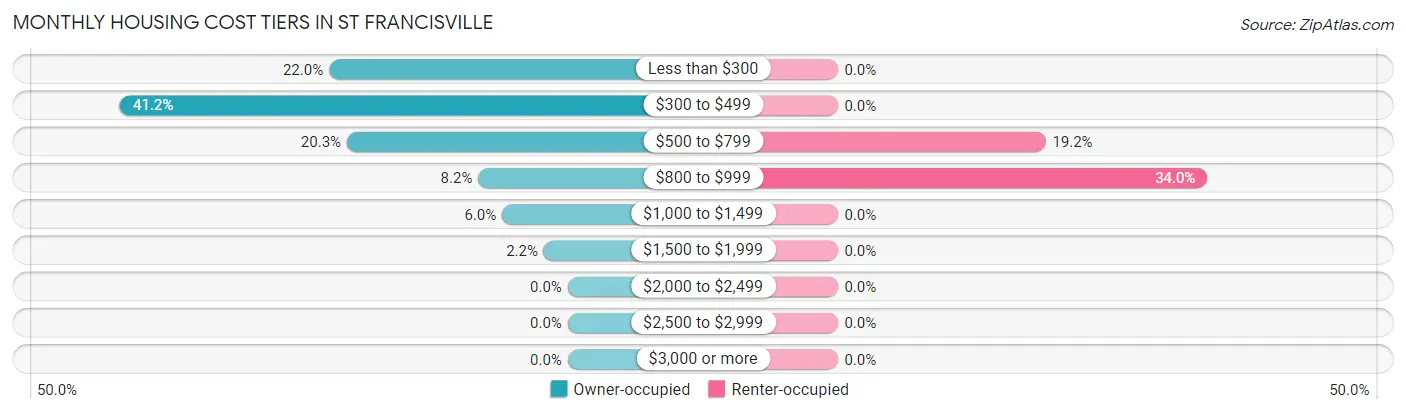
| Monthly Cost | Owner-occupied | Renter-occupied |
| Less than $300 | 40 (22.0%) | 0 (0.0%) |
| $300 to $499 | 75 (41.2%) | 0 (0.0%) |
| $500 to $799 | 37 (20.3%) | 9 (19.2%) |
| $800 to $999 | 15 (8.2%) | 16 (34.0%) |
| $1,000 to $1,499 | 11 (6.0%) | 0 (0.0%) |
| $1,500 to $1,999 | 4 (2.2%) | 0 (0.0%) |
| $2,000 to $2,499 | 0 (0.0%) | 0 (0.0%) |
| $2,500 to $2,999 | 0 (0.0%) | 0 (0.0%) |
| $3,000 or more | 0 (0.0%) | 0 (0.0%) |
| Total | 182 (100.0%) | 47 (100.0%) |
Physical Housing Characteristics in St Francisville
Housing Structures in St Francisville
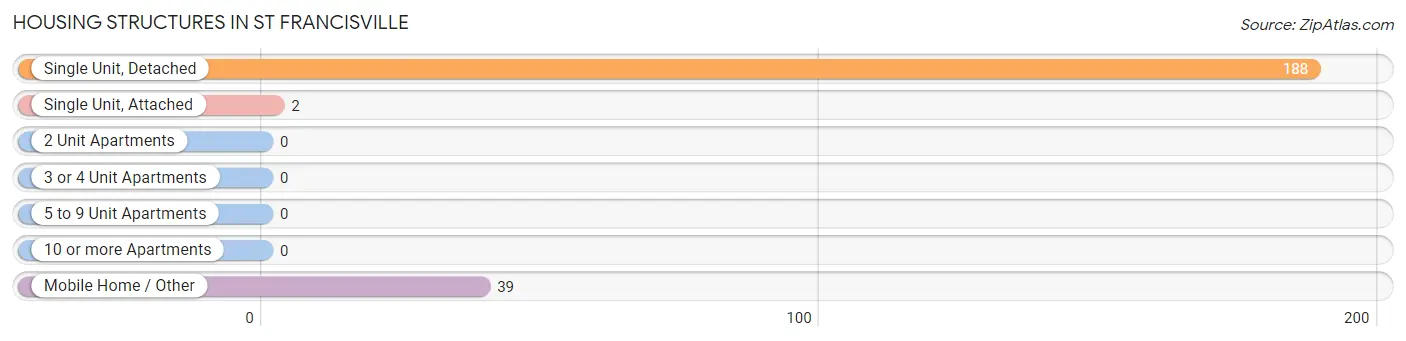
| Structure Type | # Housing Units | % Housing Units |
| Single Unit, Detached | 188 | 82.1% |
| Single Unit, Attached | 2 | 0.9% |
| 2 Unit Apartments | 0 | 0.0% |
| 3 or 4 Unit Apartments | 0 | 0.0% |
| 5 to 9 Unit Apartments | 0 | 0.0% |
| 10 or more Apartments | 0 | 0.0% |
| Mobile Home / Other | 39 | 17.0% |
| Total | 229 | 100.0% |
Housing Structures by Occupancy in St Francisville
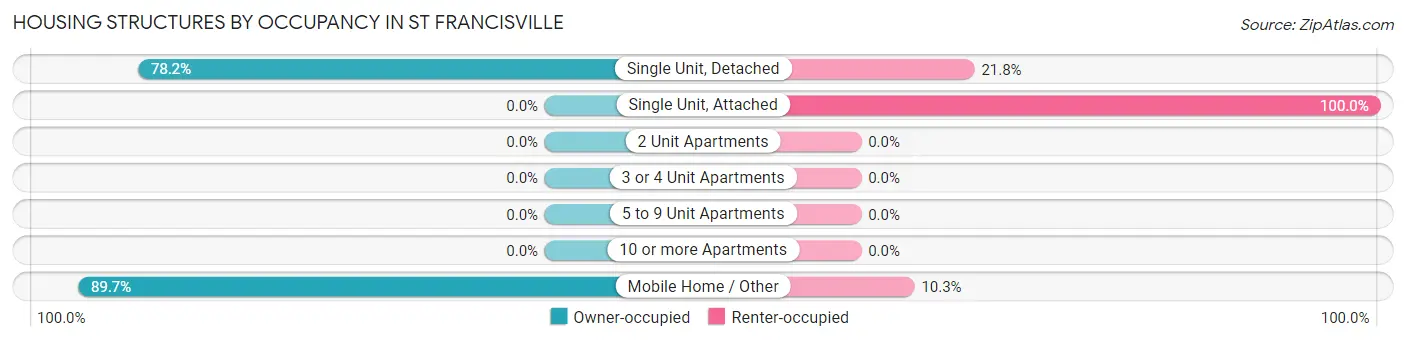
| Structure Type | Owner-occupied | Renter-occupied |
| Single Unit, Detached | 147 (78.2%) | 41 (21.8%) |
| Single Unit, Attached | 0 (0.0%) | 2 (100.0%) |
| 2 Unit Apartments | 0 (0.0%) | 0 (0.0%) |
| 3 or 4 Unit Apartments | 0 (0.0%) | 0 (0.0%) |
| 5 to 9 Unit Apartments | 0 (0.0%) | 0 (0.0%) |
| 10 or more Apartments | 0 (0.0%) | 0 (0.0%) |
| Mobile Home / Other | 35 (89.7%) | 4 (10.3%) |
| Total | 182 (79.5%) | 47 (20.5%) |
Housing Structures by Number of Rooms in St Francisville
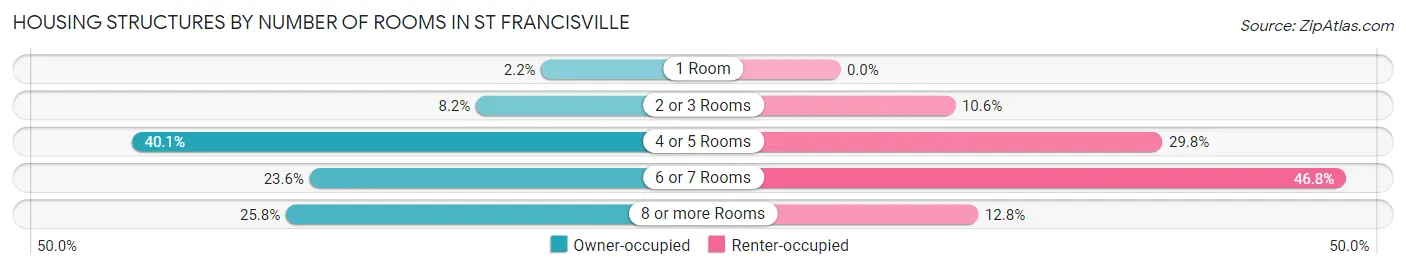
| Number of Rooms | Owner-occupied | Renter-occupied |
| 1 Room | 4 (2.2%) | 0 (0.0%) |
| 2 or 3 Rooms | 15 (8.2%) | 5 (10.6%) |
| 4 or 5 Rooms | 73 (40.1%) | 14 (29.8%) |
| 6 or 7 Rooms | 43 (23.6%) | 22 (46.8%) |
| 8 or more Rooms | 47 (25.8%) | 6 (12.8%) |
| Total | 182 (100.0%) | 47 (100.0%) |
Housing Structure by Heating Type in St Francisville
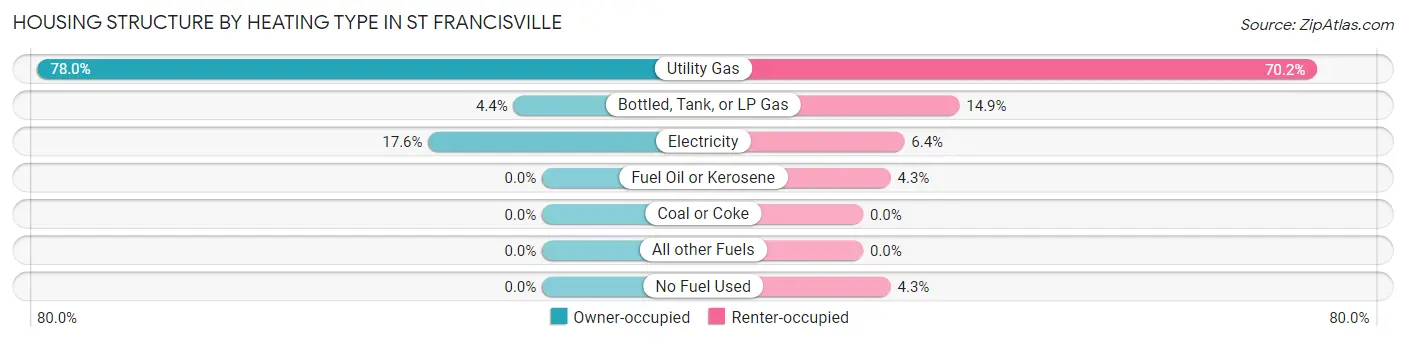
| Heating Type | Owner-occupied | Renter-occupied |
| Utility Gas | 142 (78.0%) | 33 (70.2%) |
| Bottled, Tank, or LP Gas | 8 (4.4%) | 7 (14.9%) |
| Electricity | 32 (17.6%) | 3 (6.4%) |
| Fuel Oil or Kerosene | 0 (0.0%) | 2 (4.3%) |
| Coal or Coke | 0 (0.0%) | 0 (0.0%) |
| All other Fuels | 0 (0.0%) | 0 (0.0%) |
| No Fuel Used | 0 (0.0%) | 2 (4.3%) |
| Total | 182 (100.0%) | 47 (100.0%) |
Household Vehicle Usage in St Francisville
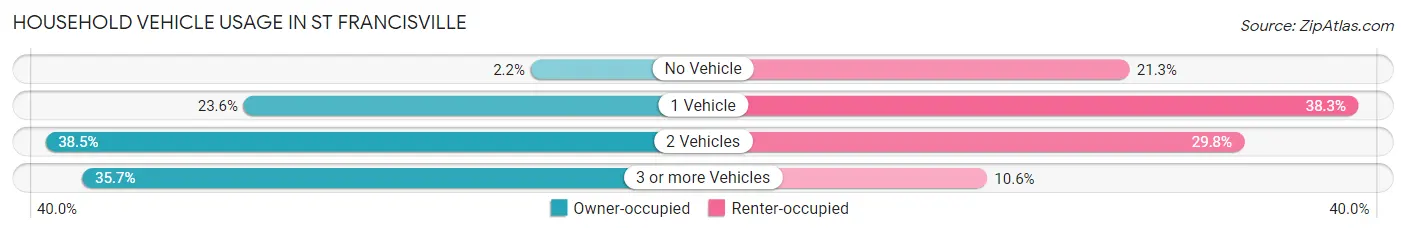
| Vehicles per Household | Owner-occupied | Renter-occupied |
| No Vehicle | 4 (2.2%) | 10 (21.3%) |
| 1 Vehicle | 43 (23.6%) | 18 (38.3%) |
| 2 Vehicles | 70 (38.5%) | 14 (29.8%) |
| 3 or more Vehicles | 65 (35.7%) | 5 (10.6%) |
| Total | 182 (100.0%) | 47 (100.0%) |
Real Estate & Mortgages in St Francisville
Real Estate and Mortgage Overview in St Francisville
| Characteristic | Without Mortgage | With Mortgage |
| Housing Units | 136 | 46 |
| Median Property Value | $58,000 | $61,400 |
| Median Household Income | $54,583 | $7 |
| Monthly Housing Costs | $348 | $0 |
| Real Estate Taxes | $627 | $0 |
Property Value by Mortgage Status in St Francisville
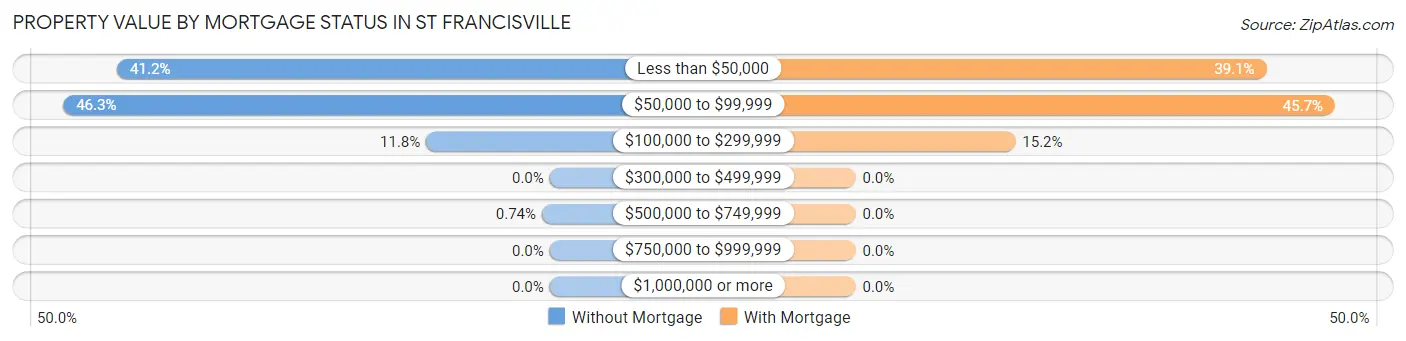
| Property Value | Without Mortgage | With Mortgage |
| Less than $50,000 | 56 (41.2%) | 18 (39.1%) |
| $50,000 to $99,999 | 63 (46.3%) | 21 (45.7%) |
| $100,000 to $299,999 | 16 (11.8%) | 7 (15.2%) |
| $300,000 to $499,999 | 0 (0.0%) | 0 (0.0%) |
| $500,000 to $749,999 | 1 (0.7%) | 0 (0.0%) |
| $750,000 to $999,999 | 0 (0.0%) | 0 (0.0%) |
| $1,000,000 or more | 0 (0.0%) | 0 (0.0%) |
| Total | 136 (100.0%) | 46 (100.0%) |
Household Income by Mortgage Status in St Francisville
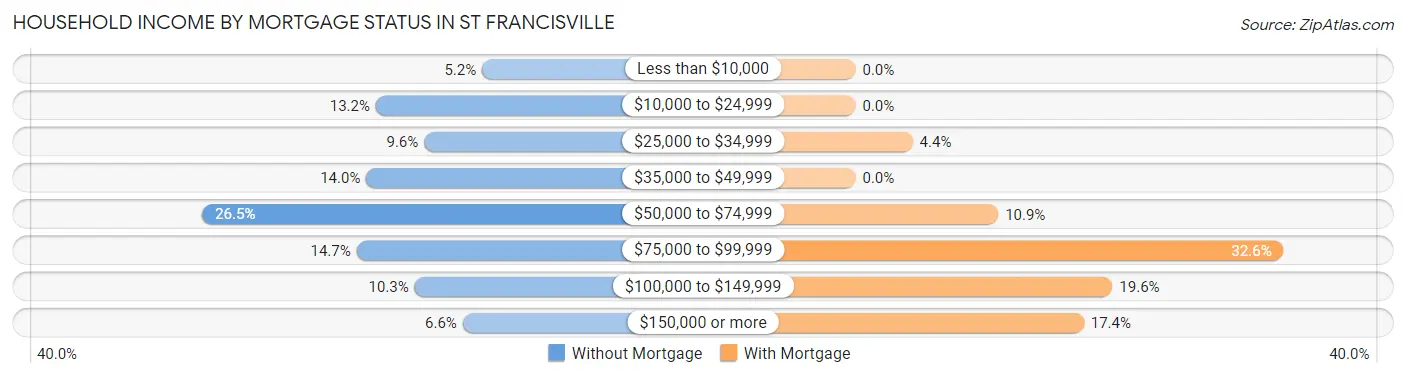
| Household Income | Without Mortgage | With Mortgage |
| Less than $10,000 | 7 (5.1%) | 0 (0.0%) |
| $10,000 to $24,999 | 18 (13.2%) | 0 (0.0%) |
| $25,000 to $34,999 | 13 (9.6%) | 2 (4.3%) |
| $35,000 to $49,999 | 19 (14.0%) | 0 (0.0%) |
| $50,000 to $74,999 | 36 (26.5%) | 5 (10.9%) |
| $75,000 to $99,999 | 20 (14.7%) | 15 (32.6%) |
| $100,000 to $149,999 | 14 (10.3%) | 9 (19.6%) |
| $150,000 or more | 9 (6.6%) | 8 (17.4%) |
| Total | 136 (100.0%) | 46 (100.0%) |
Property Value to Household Income Ratio in St Francisville
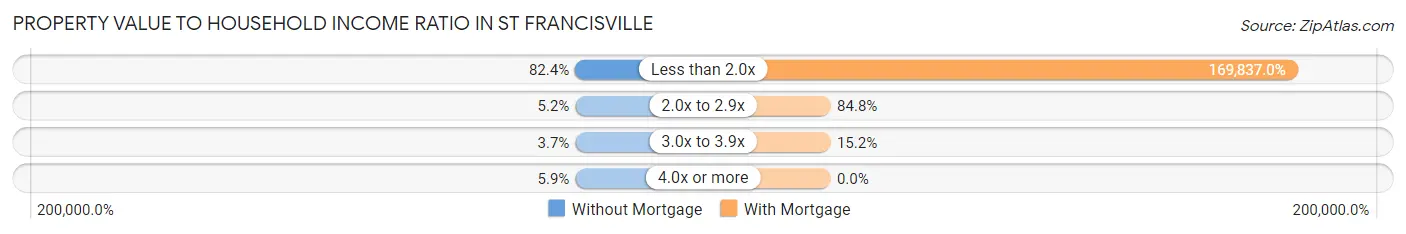
| Value-to-Income Ratio | Without Mortgage | With Mortgage |
| Less than 2.0x | 112 (82.4%) | 78,125 (169,837.0%) |
| 2.0x to 2.9x | 7 (5.1%) | 39 (84.8%) |
| 3.0x to 3.9x | 5 (3.7%) | 7 (15.2%) |
| 4.0x or more | 8 (5.9%) | 0 (0.0%) |
| Total | 136 (100.0%) | 46 (100.0%) |
Real Estate Taxes by Mortgage Status in St Francisville
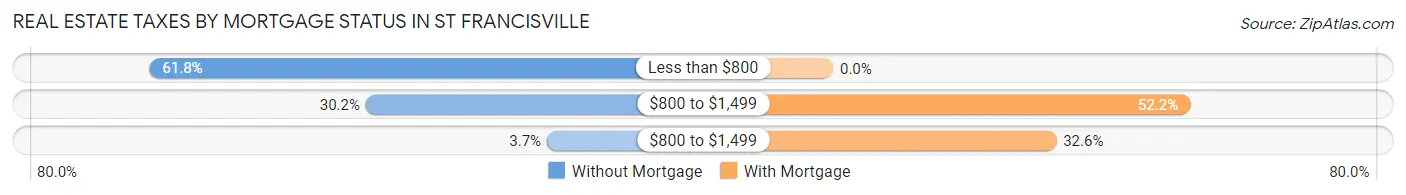
| Property Taxes | Without Mortgage | With Mortgage |
| Less than $800 | 84 (61.8%) | 0 (0.0%) |
| $800 to $1,499 | 41 (30.1%) | 24 (52.2%) |
| $800 to $1,499 | 5 (3.7%) | 15 (32.6%) |
| Total | 136 (100.0%) | 46 (100.0%) |
Health & Disability in St Francisville
Health Insurance Coverage by Age in St Francisville
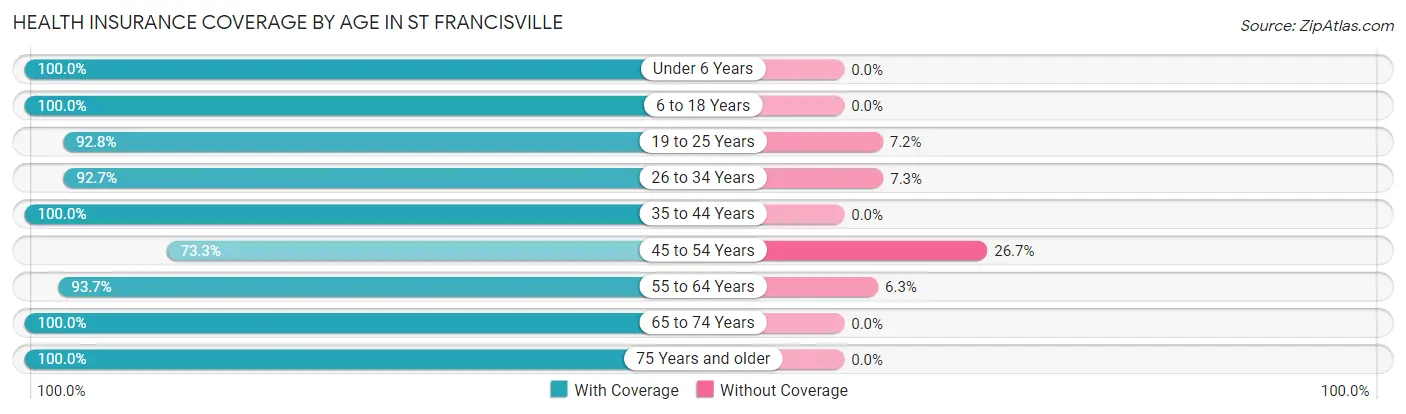
| Age Bracket | With Coverage | Without Coverage |
| Under 6 Years | 35 (100.0%) | 0 (0.0%) |
| 6 to 18 Years | 58 (100.0%) | 0 (0.0%) |
| 19 to 25 Years | 181 (92.8%) | 14 (7.2%) |
| 26 to 34 Years | 51 (92.7%) | 4 (7.3%) |
| 35 to 44 Years | 41 (100.0%) | 0 (0.0%) |
| 45 to 54 Years | 22 (73.3%) | 8 (26.7%) |
| 55 to 64 Years | 119 (93.7%) | 8 (6.3%) |
| 65 to 74 Years | 81 (100.0%) | 0 (0.0%) |
| 75 Years and older | 47 (100.0%) | 0 (0.0%) |
| Total | 635 (94.9%) | 34 (5.1%) |
Health Insurance Coverage by Citizenship Status in St Francisville

| Citizenship Status | With Coverage | Without Coverage |
| Native Born | 35 (100.0%) | 0 (0.0%) |
| Foreign Born, Citizen | 58 (100.0%) | 0 (0.0%) |
| Foreign Born, not a Citizen | 181 (92.8%) | 14 (7.2%) |
Health Insurance Coverage by Household Income in St Francisville
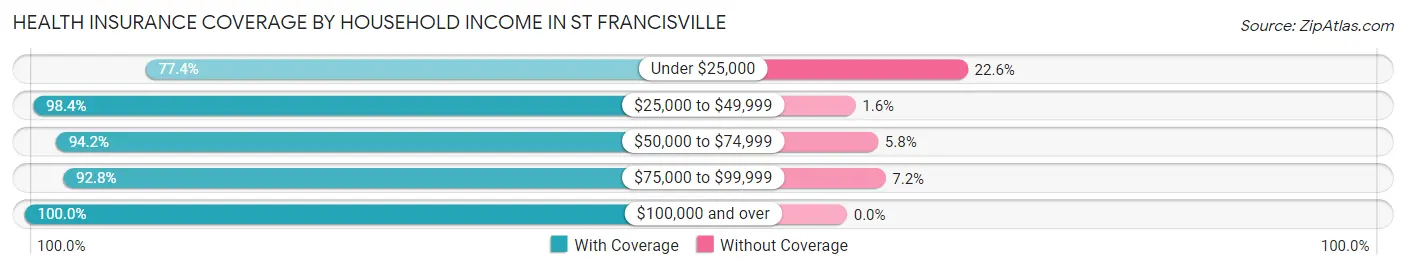
| Household Income | With Coverage | Without Coverage |
| Under $25,000 | 41 (77.4%) | 12 (22.6%) |
| $25,000 to $49,999 | 122 (98.4%) | 2 (1.6%) |
| $50,000 to $74,999 | 226 (94.2%) | 14 (5.8%) |
| $75,000 to $99,999 | 77 (92.8%) | 6 (7.2%) |
| $100,000 and over | 169 (100.0%) | 0 (0.0%) |
Public vs Private Health Insurance Coverage by Age in St Francisville
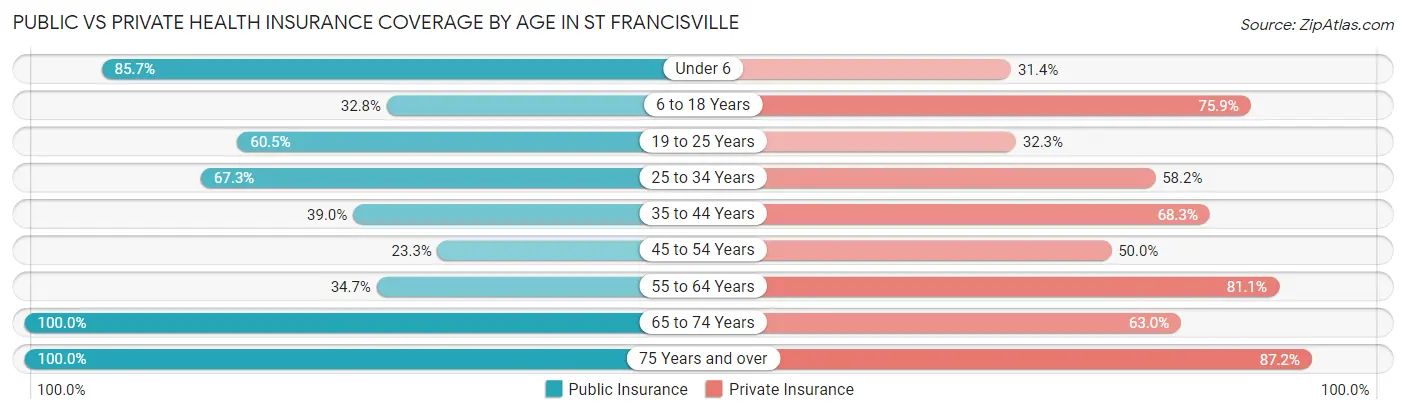
| Age Bracket | Public Insurance | Private Insurance |
| Under 6 | 30 (85.7%) | 11 (31.4%) |
| 6 to 18 Years | 19 (32.8%) | 44 (75.9%) |
| 19 to 25 Years | 118 (60.5%) | 63 (32.3%) |
| 25 to 34 Years | 37 (67.3%) | 32 (58.2%) |
| 35 to 44 Years | 16 (39.0%) | 28 (68.3%) |
| 45 to 54 Years | 7 (23.3%) | 15 (50.0%) |
| 55 to 64 Years | 44 (34.6%) | 103 (81.1%) |
| 65 to 74 Years | 81 (100.0%) | 51 (63.0%) |
| 75 Years and over | 47 (100.0%) | 41 (87.2%) |
| Total | 399 (59.6%) | 388 (58.0%) |
Disability Status by Sex by Age in St Francisville
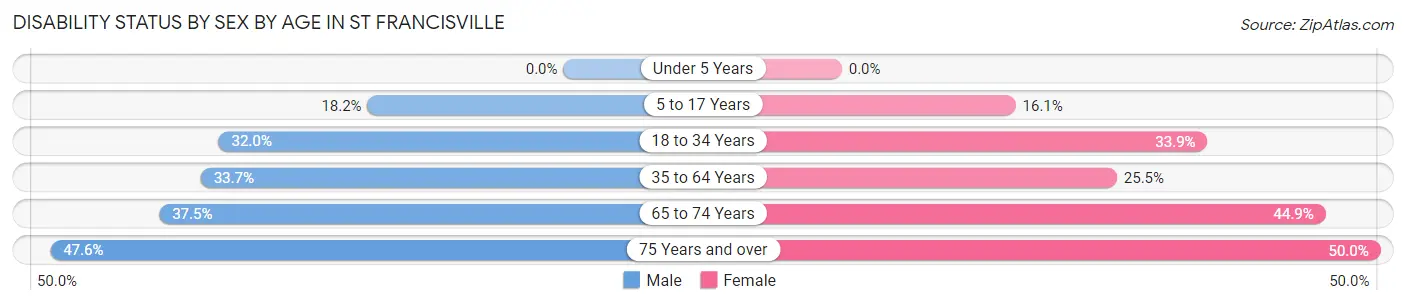
| Age Bracket | Male | Female |
| Under 5 Years | 0 (0.0%) | 0 (0.0%) |
| 5 to 17 Years | 4 (18.2%) | 5 (16.1%) |
| 18 to 34 Years | 64 (32.0%) | 19 (33.9%) |
| 35 to 64 Years | 35 (33.7%) | 24 (25.5%) |
| 65 to 74 Years | 12 (37.5%) | 22 (44.9%) |
| 75 Years and over | 10 (47.6%) | 13 (50.0%) |
Disability Class by Sex by Age in St Francisville
Disability Class: Hearing Difficulty
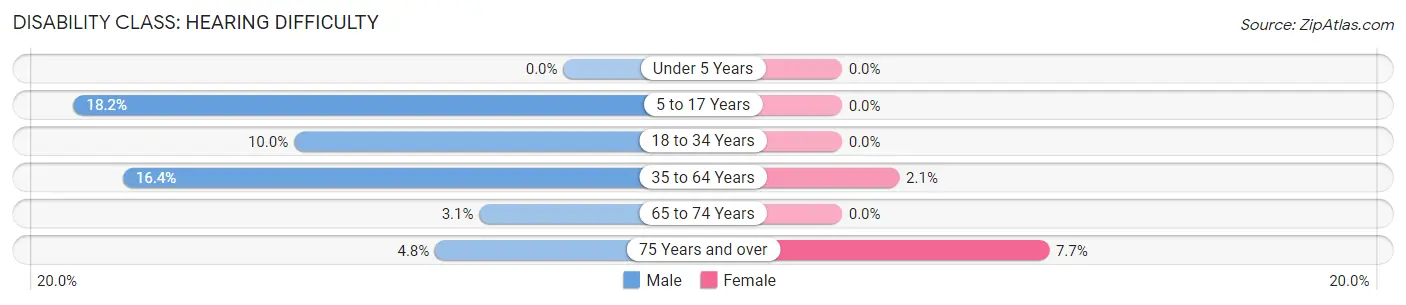
| Age Bracket | Male | Female |
| Under 5 Years | 0 (0.0%) | 0 (0.0%) |
| 5 to 17 Years | 4 (18.2%) | 0 (0.0%) |
| 18 to 34 Years | 20 (10.0%) | 0 (0.0%) |
| 35 to 64 Years | 17 (16.4%) | 2 (2.1%) |
| 65 to 74 Years | 1 (3.1%) | 0 (0.0%) |
| 75 Years and over | 1 (4.8%) | 2 (7.7%) |
Disability Class: Vision Difficulty
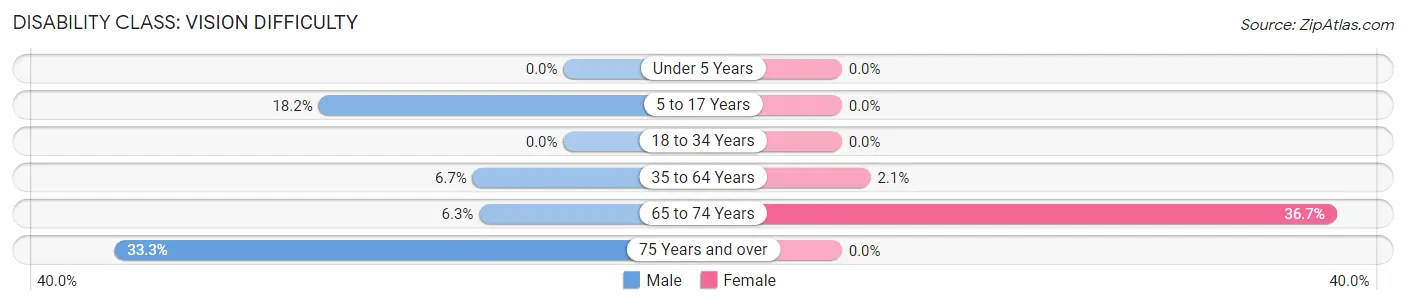
| Age Bracket | Male | Female |
| Under 5 Years | 0 (0.0%) | 0 (0.0%) |
| 5 to 17 Years | 4 (18.2%) | 0 (0.0%) |
| 18 to 34 Years | 0 (0.0%) | 0 (0.0%) |
| 35 to 64 Years | 7 (6.7%) | 2 (2.1%) |
| 65 to 74 Years | 2 (6.2%) | 18 (36.7%) |
| 75 Years and over | 7 (33.3%) | 0 (0.0%) |
Disability Class: Cognitive Difficulty
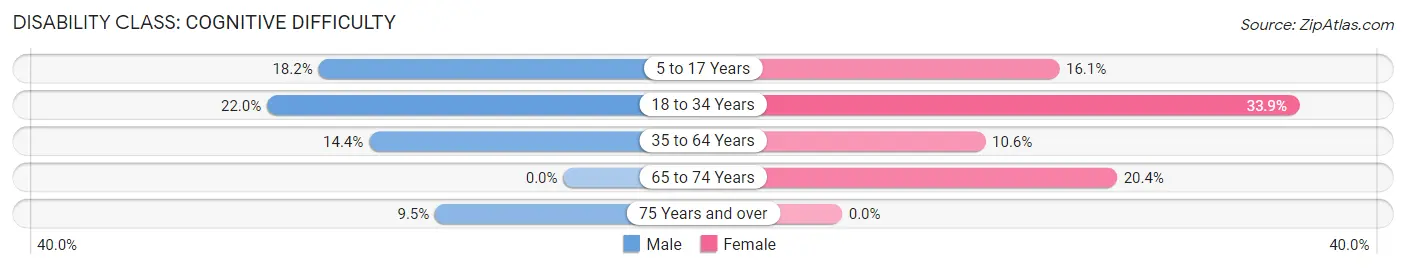
| Age Bracket | Male | Female |
| 5 to 17 Years | 4 (18.2%) | 5 (16.1%) |
| 18 to 34 Years | 44 (22.0%) | 19 (33.9%) |
| 35 to 64 Years | 15 (14.4%) | 10 (10.6%) |
| 65 to 74 Years | 0 (0.0%) | 10 (20.4%) |
| 75 Years and over | 2 (9.5%) | 0 (0.0%) |
Disability Class: Ambulatory Difficulty
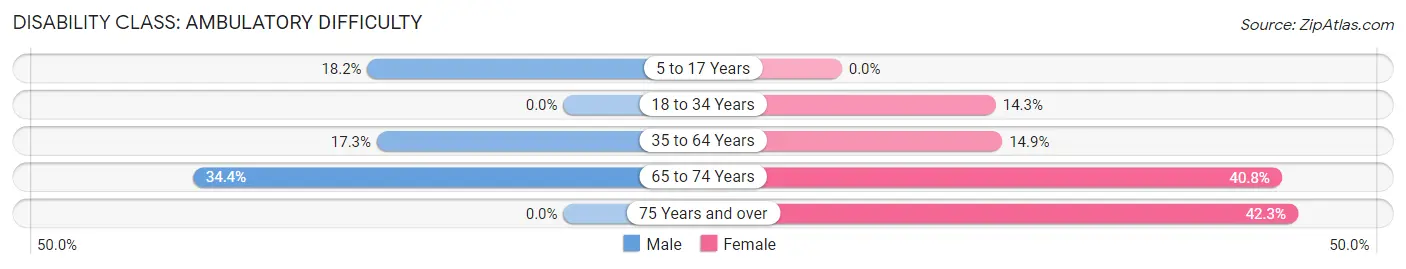
| Age Bracket | Male | Female |
| 5 to 17 Years | 4 (18.2%) | 0 (0.0%) |
| 18 to 34 Years | 0 (0.0%) | 8 (14.3%) |
| 35 to 64 Years | 18 (17.3%) | 14 (14.9%) |
| 65 to 74 Years | 11 (34.4%) | 20 (40.8%) |
| 75 Years and over | 0 (0.0%) | 11 (42.3%) |
Disability Class: Self-Care Difficulty
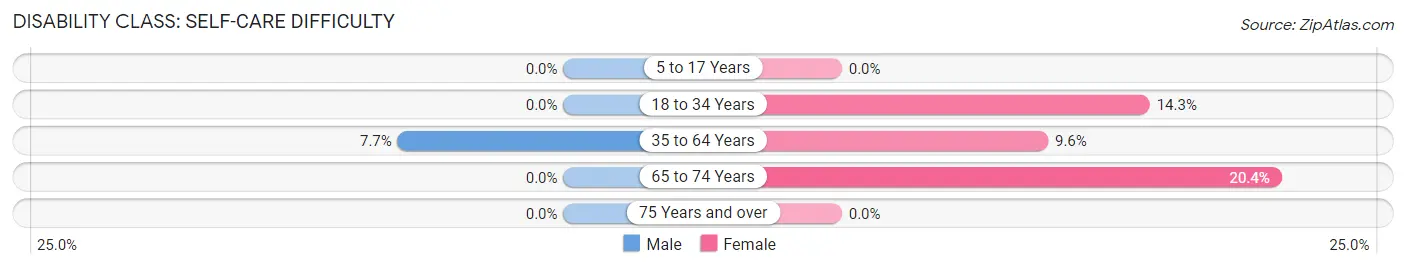
| Age Bracket | Male | Female |
| 5 to 17 Years | 0 (0.0%) | 0 (0.0%) |
| 18 to 34 Years | 0 (0.0%) | 8 (14.3%) |
| 35 to 64 Years | 8 (7.7%) | 9 (9.6%) |
| 65 to 74 Years | 0 (0.0%) | 10 (20.4%) |
| 75 Years and over | 0 (0.0%) | 0 (0.0%) |
Technology Access in St Francisville
Computing Device Access in St Francisville
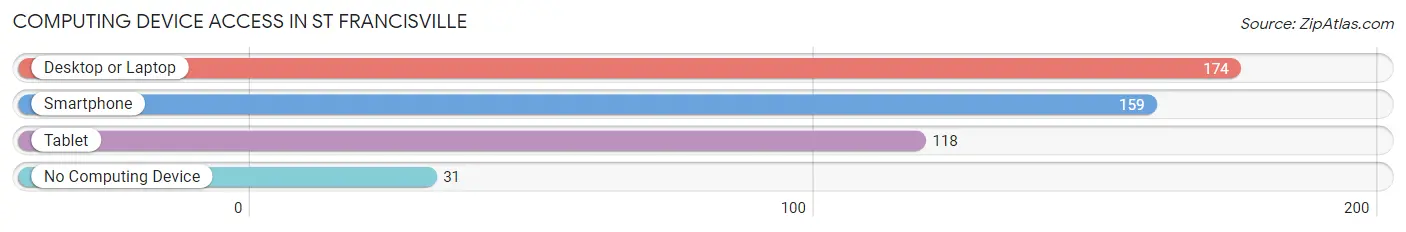
| Device Type | # Households | % Households |
| Desktop or Laptop | 174 | 76.0% |
| Smartphone | 159 | 69.4% |
| Tablet | 118 | 51.5% |
| No Computing Device | 31 | 13.5% |
| Total | 229 | 100.0% |
Internet Access in St Francisville
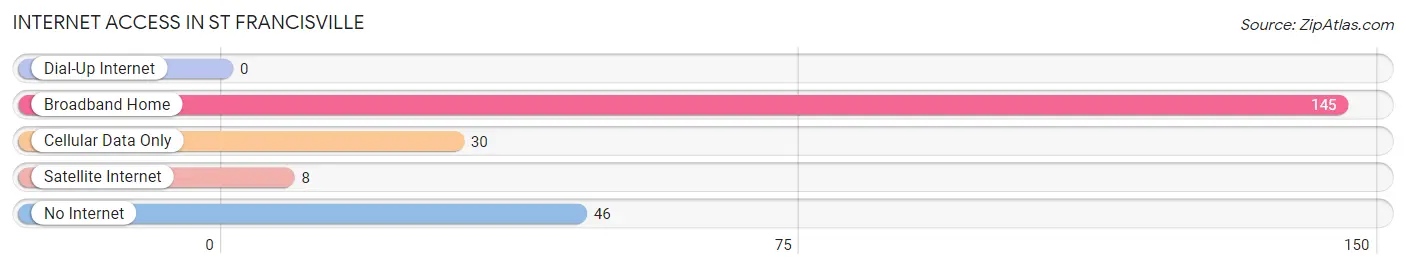
| Internet Type | # Households | % Households |
| Dial-Up Internet | 0 | 0.0% |
| Broadband Home | 145 | 63.3% |
| Cellular Data Only | 30 | 13.1% |
| Satellite Internet | 8 | 3.5% |
| No Internet | 46 | 20.1% |
| Total | 229 | 100.0% |
St Francisville Summary
Francisville is a small village located in Lawrence County, Illinois, United States. It is situated on the banks of the Embarras River, approximately 10 miles south of Lawrenceville. The population was estimated to be 545 in the 2010 census.
History
The area that is now Francisville was first settled in 1818 by a group of settlers from Kentucky. The settlement was originally known as “Embarras”, after the river that runs through the area. In 1820, the name was changed to “Francisville” in honor of the first settler, Francis Smith.
The village was officially incorporated in 1867. During the late 19th century, the village was a thriving agricultural center, with a number of businesses and industries. The village was also home to a number of churches, including the Methodist Episcopal Church, the Presbyterian Church, and the Catholic Church.
In the early 20th century, the village experienced a period of decline. The Great Depression and World War II had a devastating effect on the local economy, and many businesses and industries closed. The population of the village declined from a peak of 845 in 1920 to 545 in 2010.
Geography
Francisville is located in southeastern Illinois, approximately 10 miles south of Lawrenceville. The village is situated on the banks of the Embarras River, which flows through the area. The village is surrounded by rolling hills and farmland.
The climate in Francisville is characterized by hot, humid summers and cold, wet winters. The average annual temperature is 54°F, and the average annual precipitation is 40 inches.
Economy
The economy of Francisville is largely based on agriculture. The village is home to a number of farms, which produce a variety of crops, including corn, soybeans, wheat, and hay. The village also has a number of small businesses, including a grocery store, a hardware store, and a restaurant.
Demographics
As of the 2010 census, the population of Francisville was 545. The racial makeup of the village was 97.3% White, 0.7% African American, 0.2% Native American, 0.2% Asian, and 1.6% from other races. The median household income was $37,500, and the median family income was $45,000.
Conclusion
Francisville is a small village located in Lawrence County, Illinois. It was first settled in 1818 and was officially incorporated in 1867. The village has a population of 545 and is largely based on agriculture. The village is home to a number of small businesses, and the median household income is $37,500.
Common Questions
What is Per Capita Income in St Francisville?
Per Capita income in St Francisville is $33,632.
What is the Median Family Income in St Francisville?
Median Family Income in St Francisville is $66,023.
What is the Median Household income in St Francisville?
Median Household Income in St Francisville is $56,806.
What is Income or Wage Gap in St Francisville?
Income or Wage Gap in St Francisville is 36.7%.
Women in St Francisville earn 63.3 cents for every dollar earned by a man.
What is Inequality or Gini Index in St Francisville?
Inequality or Gini Index in St Francisville is 0.53.
What is the Total Population of St Francisville?
Total Population of St Francisville is 669.
What is the Total Male Population of St Francisville?
Total Male Population of St Francisville is 409.
What is the Total Female Population of St Francisville?
Total Female Population of St Francisville is 260.
What is the Ratio of Males per 100 Females in St Francisville?
There are 157.31 Males per 100 Females in St Francisville.
What is the Ratio of Females per 100 Males in St Francisville?
There are 63.57 Females per 100 Males in St Francisville.
What is the Median Population Age in St Francisville?
Median Population Age in St Francisville is 33.9 Years.
What is the Average Family Size in St Francisville
Average Family Size in St Francisville is 3.8 People.
What is the Average Household Size in St Francisville
Average Household Size in St Francisville is 2.9 People.
How Large is the Labor Force in St Francisville?
There are 340 People in the Labor Forcein in St Francisville.
What is the Percentage of People in the Labor Force in St Francisville?
58.1% of People are in the Labor Force in St Francisville.
What is the Unemployment Rate in St Francisville?
Unemployment Rate in St Francisville is 17.1%.