Zip Codes with the Highest Percentage of Population Employed in Life, Physical & Social Science in Hamden, CT
RELATED REPORTS & OPTIONS
Life, Physical & Social Science
Hamden
Compare Zip Codes
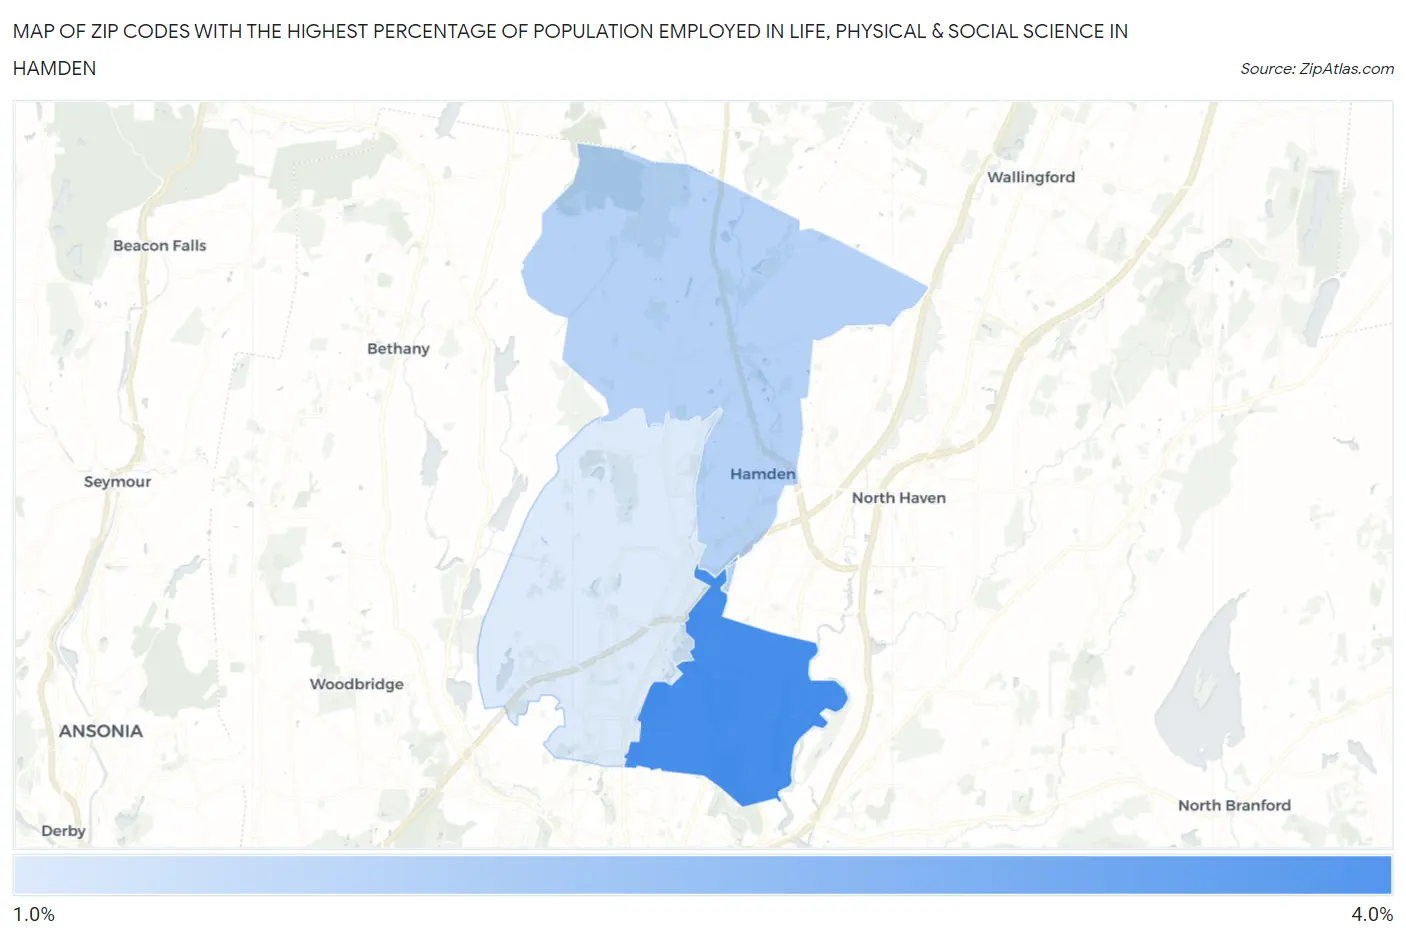
Map of Zip Codes with the Highest Percentage of Population Employed in Life, Physical & Social Science in Hamden
1.5%
3.1%
Zip Codes with the Highest Percentage of Population Employed in Life, Physical & Social Science in Hamden, CT
| Zip Code | % Employed | vs State | vs National | |
| 1. | 06517 | 3.1% | 1.2%(+1.88)#22 | 1.1%(+2.03)#1,737 |
| 2. | 06518 | 1.9% | 1.2%(+0.661)#48 | 1.1%(+0.812)#3,969 |
| 3. | 06514 | 1.5% | 1.2%(+0.237)#76 | 1.1%(+0.388)#5,777 |
1
Common Questions
What are the Top Zip Codes with the Highest Percentage of Population Employed in Life, Physical & Social Science in Hamden, CT?
Top Zip Codes with the Highest Percentage of Population Employed in Life, Physical & Social Science in Hamden, CT are:
What zip code has the Highest Percentage of Population Employed in Life, Physical & Social Science in Hamden, CT?
06517 has the Highest Percentage of Population Employed in Life, Physical & Social Science in Hamden, CT with 3.1%.
What is the Percentage of Population Employed in Life, Physical & Social Science in Connecticut?
Percentage of Population Employed in Life, Physical & Social Science in Connecticut is 1.2%.
What is the Percentage of Population Employed in Life, Physical & Social Science in the United States?
Percentage of Population Employed in Life, Physical & Social Science in the United States is 1.1%.