Zip Codes with the Highest Percentage of Population Employed in Life, Physical & Social Science in Connecticut
RELATED REPORTS & OPTIONS
Life, Physical & Social Science
Connecticut
Compare Zip Codes
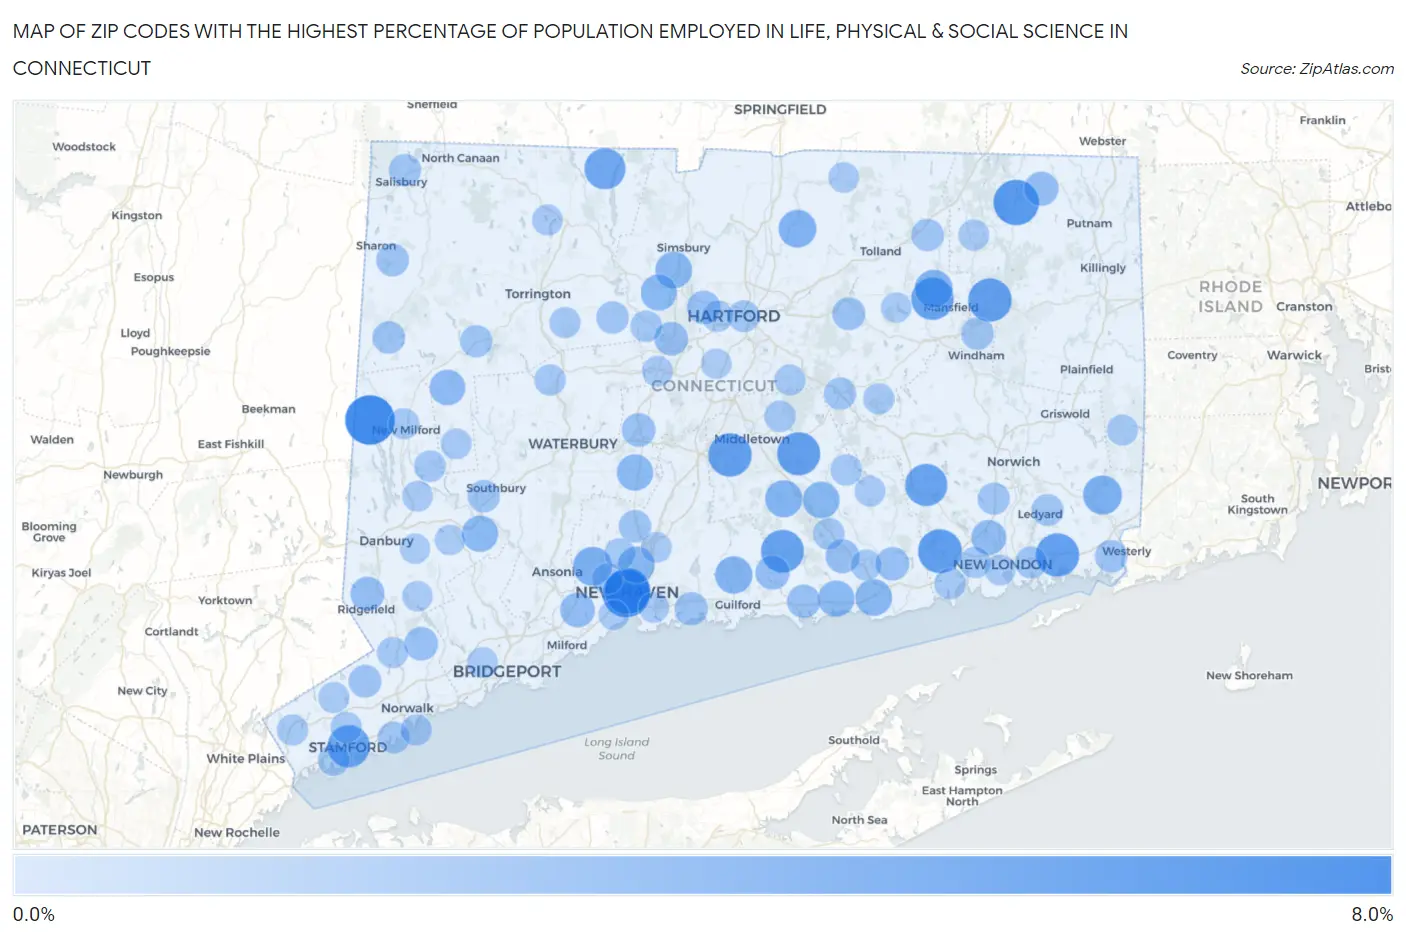
Map of Zip Codes with the Highest Percentage of Population Employed in Life, Physical & Social Science in Connecticut
0.0%
8.0%
Zip Codes with the Highest Percentage of Population Employed in Life, Physical & Social Science in Connecticut
| Zip Code | % Employed | vs State | vs National | |
| 1. | 06784 | 7.0% | 1.2%(+5.76)#1 | 1.1%(+5.91)#407 |
| 2. | 06510 | 6.3% | 1.2%(+5.07)#2 | 1.1%(+5.22)#501 |
| 3. | 06511 | 5.9% | 1.2%(+4.64)#3 | 1.1%(+4.80)#557 |
| 4. | 06282 | 5.8% | 1.2%(+4.51)#4 | 1.1%(+4.66)#583 |
| 5. | 06333 | 5.3% | 1.2%(+4.07)#5 | 1.1%(+4.22)#682 |
| 6. | 06355 | 5.1% | 1.2%(+3.90)#6 | 1.1%(+4.05)#721 |
| 7. | 06235 | 5.1% | 1.2%(+3.89)#7 | 1.1%(+4.05)#723 |
| 8. | 06481 | 5.1% | 1.2%(+3.88)#8 | 1.1%(+4.03)#730 |
| 9. | 06456 | 5.0% | 1.2%(+3.79)#9 | 1.1%(+3.95)#753 |
| 10. | 06419 | 5.0% | 1.2%(+3.75)#10 | 1.1%(+3.90)#764 |
| 11. | 06268 | 4.9% | 1.2%(+3.62)#11 | 1.1%(+3.77)#805 |
| 12. | 06901 | 4.8% | 1.2%(+3.58)#12 | 1.1%(+3.73)#815 |
| 13. | 06420 | 4.8% | 1.2%(+3.55)#13 | 1.1%(+3.70)#822 |
| 14. | 06091 | 4.4% | 1.2%(+3.20)#14 | 1.1%(+3.35)#948 |
| 15. | 06359 | 3.8% | 1.2%(+2.55)#15 | 1.1%(+2.70)#1,266 |
| 16. | 06525 | 3.8% | 1.2%(+2.52)#16 | 1.1%(+2.67)#1,287 |
| 17. | 06269 | 3.5% | 1.2%(+2.24)#17 | 1.1%(+2.39)#1,439 |
| 18. | 06016 | 3.4% | 1.2%(+2.19)#18 | 1.1%(+2.34)#1,473 |
| 19. | 06437 | 3.3% | 1.2%(+2.07)#19 | 1.1%(+2.22)#1,565 |
| 20. | 06441 | 3.3% | 1.2%(+2.04)#20 | 1.1%(+2.19)#1,594 |
| 21. | 06475 | 3.2% | 1.2%(+1.91)#21 | 1.1%(+2.07)#1,702 |
| 22. | 06517 | 3.1% | 1.2%(+1.88)#22 | 1.1%(+2.03)#1,737 |
| 23. | 06089 | 3.1% | 1.2%(+1.88)#23 | 1.1%(+2.03)#1,738 |
| 24. | 06438 | 3.1% | 1.2%(+1.87)#24 | 1.1%(+2.02)#1,745 |
| 25. | 06498 | 3.0% | 1.2%(+1.79)#25 | 1.1%(+1.94)#1,838 |
| 26. | 06410 | 3.0% | 1.2%(+1.77)#26 | 1.1%(+1.93)#1,856 |
| 27. | 06482 | 3.0% | 1.2%(+1.77)#27 | 1.1%(+1.92)#1,865 |
| 28. | 06001 | 3.0% | 1.2%(+1.76)#28 | 1.1%(+1.91)#1,870 |
| 29. | 06794 | 2.8% | 1.2%(+1.57)#29 | 1.1%(+1.72)#2,102 |
| 30. | 06375 | 2.6% | 1.2%(+1.40)#30 | 1.1%(+1.55)#2,331 |
| 31. | 06477 | 2.5% | 1.2%(+1.29)#31 | 1.1%(+1.44)#2,507 |
| 32. | 06281 | 2.4% | 1.2%(+1.20)#32 | 1.1%(+1.35)#2,680 |
| 33. | 06443 | 2.4% | 1.2%(+1.16)#33 | 1.1%(+1.31)#2,760 |
| 34. | 06877 | 2.4% | 1.2%(+1.12)#34 | 1.1%(+1.27)#2,821 |
| 35. | 06417 | 2.3% | 1.2%(+1.09)#35 | 1.1%(+1.24)#2,866 |
| 36. | 06032 | 2.3% | 1.2%(+1.01)#36 | 1.1%(+1.16)#3,058 |
| 37. | 06883 | 2.2% | 1.2%(+0.991)#37 | 1.1%(+1.14)#3,107 |
| 38. | 06479 | 2.2% | 1.2%(+0.990)#38 | 1.1%(+1.14)#3,108 |
| 39. | 06371 | 2.2% | 1.2%(+0.949)#39 | 1.1%(+1.10)#3,204 |
| 40. | 06117 | 2.2% | 1.2%(+0.946)#40 | 1.1%(+1.10)#3,211 |
| 41. | 06413 | 2.1% | 1.2%(+0.897)#41 | 1.1%(+1.05)#3,327 |
| 42. | 06405 | 2.1% | 1.2%(+0.868)#42 | 1.1%(+1.02)#3,401 |
| 43. | 06043 | 2.1% | 1.2%(+0.820)#43 | 1.1%(+0.971)#3,510 |
| 44. | 06069 | 2.0% | 1.2%(+0.749)#44 | 1.1%(+0.899)#3,715 |
| 45. | 06840 | 2.0% | 1.2%(+0.723)#45 | 1.1%(+0.874)#3,789 |
| 46. | 06757 | 1.9% | 1.2%(+0.694)#46 | 1.1%(+0.845)#3,871 |
| 47. | 06379 | 1.9% | 1.2%(+0.688)#47 | 1.1%(+0.838)#3,890 |
| 48. | 06518 | 1.9% | 1.2%(+0.661)#48 | 1.1%(+0.812)#3,969 |
| 49. | 06488 | 1.9% | 1.2%(+0.646)#49 | 1.1%(+0.796)#4,015 |
| 50. | 06279 | 1.9% | 1.2%(+0.643)#50 | 1.1%(+0.794)#4,026 |
| 51. | 06256 | 1.9% | 1.2%(+0.642)#51 | 1.1%(+0.793)#4,029 |
| 52. | 06013 | 1.9% | 1.2%(+0.642)#52 | 1.1%(+0.792)#4,031 |
| 53. | 06447 | 1.8% | 1.2%(+0.599)#53 | 1.1%(+0.750)#4,173 |
| 54. | 06750 | 1.8% | 1.2%(+0.593)#54 | 1.1%(+0.744)#4,194 |
| 55. | 06068 | 1.8% | 1.2%(+0.585)#55 | 1.1%(+0.736)#4,230 |
| 56. | 06382 | 1.8% | 1.2%(+0.584)#56 | 1.1%(+0.735)#4,234 |
| 57. | 06340 | 1.8% | 1.2%(+0.547)#57 | 1.1%(+0.698)#4,360 |
| 58. | 06853 | 1.7% | 1.2%(+0.501)#58 | 1.1%(+0.652)#4,539 |
| 59. | 06339 | 1.7% | 1.2%(+0.499)#59 | 1.1%(+0.650)#4,551 |
| 60. | 06103 | 1.7% | 1.2%(+0.462)#60 | 1.1%(+0.613)#4,709 |
| 61. | 06085 | 1.7% | 1.2%(+0.414)#61 | 1.1%(+0.565)#4,917 |
| 62. | 06752 | 1.7% | 1.2%(+0.408)#62 | 1.1%(+0.559)#4,944 |
| 63. | 06870 | 1.6% | 1.2%(+0.381)#63 | 1.1%(+0.532)#5,063 |
| 64. | 06412 | 1.6% | 1.2%(+0.381)#64 | 1.1%(+0.532)#5,064 |
| 65. | 06480 | 1.6% | 1.2%(+0.358)#65 | 1.1%(+0.509)#5,158 |
| 66. | 06469 | 1.6% | 1.2%(+0.337)#66 | 1.1%(+0.488)#5,256 |
| 67. | 06787 | 1.6% | 1.2%(+0.326)#67 | 1.1%(+0.477)#5,299 |
| 68. | 06385 | 1.6% | 1.2%(+0.326)#68 | 1.1%(+0.477)#5,302 |
| 69. | 06905 | 1.5% | 1.2%(+0.282)#69 | 1.1%(+0.433)#5,525 |
| 70. | 06515 | 1.5% | 1.2%(+0.278)#70 | 1.1%(+0.429)#5,546 |
| 71. | 06119 | 1.5% | 1.2%(+0.274)#71 | 1.1%(+0.425)#5,569 |
| 72. | 06357 | 1.5% | 1.2%(+0.268)#72 | 1.1%(+0.419)#5,607 |
| 73. | 06831 | 1.5% | 1.2%(+0.258)#73 | 1.1%(+0.409)#5,663 |
| 74. | 06776 | 1.5% | 1.2%(+0.247)#74 | 1.1%(+0.398)#5,713 |
| 75. | 06897 | 1.5% | 1.2%(+0.241)#75 | 1.1%(+0.392)#5,748 |
| 76. | 06514 | 1.5% | 1.2%(+0.237)#76 | 1.1%(+0.388)#5,777 |
| 77. | 06791 | 1.5% | 1.2%(+0.232)#77 | 1.1%(+0.383)#5,808 |
| 78. | 06426 | 1.5% | 1.2%(+0.227)#78 | 1.1%(+0.378)#5,829 |
| 79. | 06855 | 1.5% | 1.2%(+0.212)#79 | 1.1%(+0.362)#5,905 |
| 80. | 06073 | 1.5% | 1.2%(+0.209)#80 | 1.1%(+0.360)#5,917 |
| 81. | 06384 | 1.4% | 1.2%(+0.207)#81 | 1.1%(+0.358)#5,922 |
| 82. | 06231 | 1.4% | 1.2%(+0.199)#82 | 1.1%(+0.350)#5,956 |
| 83. | 06903 | 1.4% | 1.2%(+0.198)#83 | 1.1%(+0.349)#5,959 |
| 84. | 06278 | 1.4% | 1.2%(+0.196)#84 | 1.1%(+0.347)#5,978 |
| 85. | 06473 | 1.4% | 1.2%(+0.187)#85 | 1.1%(+0.338)#6,032 |
| 86. | 06098 | 1.4% | 1.2%(+0.186)#86 | 1.1%(+0.337)#6,040 |
| 87. | 06783 | 1.4% | 1.2%(+0.184)#87 | 1.1%(+0.335)#6,049 |
| 88. | 06825 | 1.4% | 1.2%(+0.157)#88 | 1.1%(+0.308)#6,198 |
| 89. | 06062 | 1.4% | 1.2%(+0.146)#89 | 1.1%(+0.297)#6,265 |
| 90. | 06320 | 1.4% | 1.2%(+0.143)#90 | 1.1%(+0.294)#6,277 |
| 91. | 06512 | 1.4% | 1.2%(+0.131)#91 | 1.1%(+0.282)#6,342 |
| 92. | 06423 | 1.4% | 1.2%(+0.130)#92 | 1.1%(+0.281)#6,346 |
| 93. | 06804 | 1.4% | 1.2%(+0.127)#93 | 1.1%(+0.277)#6,365 |
| 94. | 06071 | 1.4% | 1.2%(+0.109)#94 | 1.1%(+0.260)#6,471 |
| 95. | 06238 | 1.3% | 1.2%(+0.090)#95 | 1.1%(+0.241)#6,587 |
| 96. | 06111 | 1.3% | 1.2%(+0.072)#96 | 1.1%(+0.223)#6,717 |
| 97. | 06896 | 1.3% | 1.2%(+0.060)#97 | 1.1%(+0.211)#6,792 |
| 98. | 06470 | 1.3% | 1.2%(+0.045)#98 | 1.1%(+0.196)#6,890 |
| 99. | 06516 | 1.3% | 1.2%(+0.034)#99 | 1.1%(+0.185)#6,957 |
| 100. | 06801 | 1.3% | 1.2%(+0.027)#100 | 1.1%(+0.178)#7,009 |
Common Questions
What are the Top 10 Zip Codes with the Highest Percentage of Population Employed in Life, Physical & Social Science in Connecticut?
Top 10 Zip Codes with the Highest Percentage of Population Employed in Life, Physical & Social Science in Connecticut are:
What zip code has the Highest Percentage of Population Employed in Life, Physical & Social Science in Connecticut?
06784 has the Highest Percentage of Population Employed in Life, Physical & Social Science in Connecticut with 7.0%.
What is the Percentage of Population Employed in Life, Physical & Social Science in the State of Connecticut?
Percentage of Population Employed in Life, Physical & Social Science in Connecticut is 1.2%.
What is the Percentage of Population Employed in Life, Physical & Social Science in the United States?
Percentage of Population Employed in Life, Physical & Social Science in the United States is 1.1%.