Madison Center, CT Map & Demographics
Madison Center Map
Madison Center Overview
$108,406
PER CAPITA INCOME
$209,962
AVG FAMILY INCOME
$130,625
AVG HOUSEHOLD INCOME
0.55
INEQUALITY / GINI INDEX
1,536
TOTAL POPULATION
704
MALE POPULATION
832
FEMALE POPULATION
84.62
MALES / 100 FEMALES
118.18
FEMALES / 100 MALES
61.8
MEDIAN AGE
2.6
AVG FAMILY SIZE
1.9
AVG HOUSEHOLD SIZE
843
LABOR FORCE [ PEOPLE ]
57.7%
PERCENT IN LABOR FORCE
2.7%
UNEMPLOYMENT RATE
Income in Madison Center
Income Overview in Madison Center
Per Capita Income in Madison Center is $108,406, while median incomes of families and households are $209,962 and $130,625 respectively.
| Characteristic | Number | Measure |
| Per Capita Income | 1,536 | $108,406 |
| Median Family Income | 383 | $209,962 |
| Mean Family Income | 383 | $318,563 |
| Median Household Income | 796 | $130,625 |
| Mean Household Income | 796 | $192,854 |
| Income Deficit | 383 | $0 |
| Wage / Income Gap (%) | 1,536 | 0.00% |
| Wage / Income Gap ($) | 1,536 | 100.00¢ per $1 |
| Gini / Inequality Index | 1,536 | 0.55 |
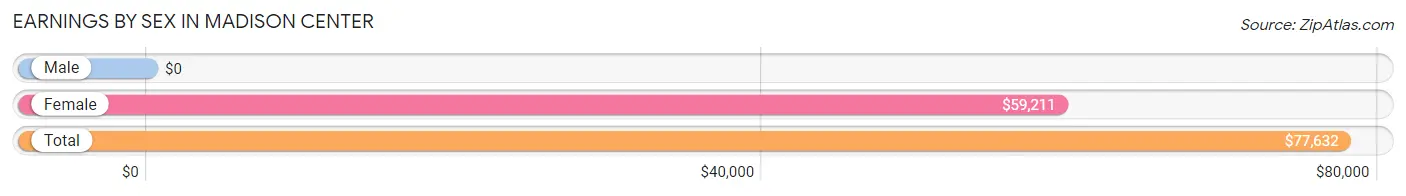
Earnings by Sex in Madison Center
| Sex | Number | Average Earnings |
| Male | 474 (52.4%) | $0 |
| Female | 430 (47.6%) | $59,211 |
| Total | 904 (100.0%) | $77,632 |
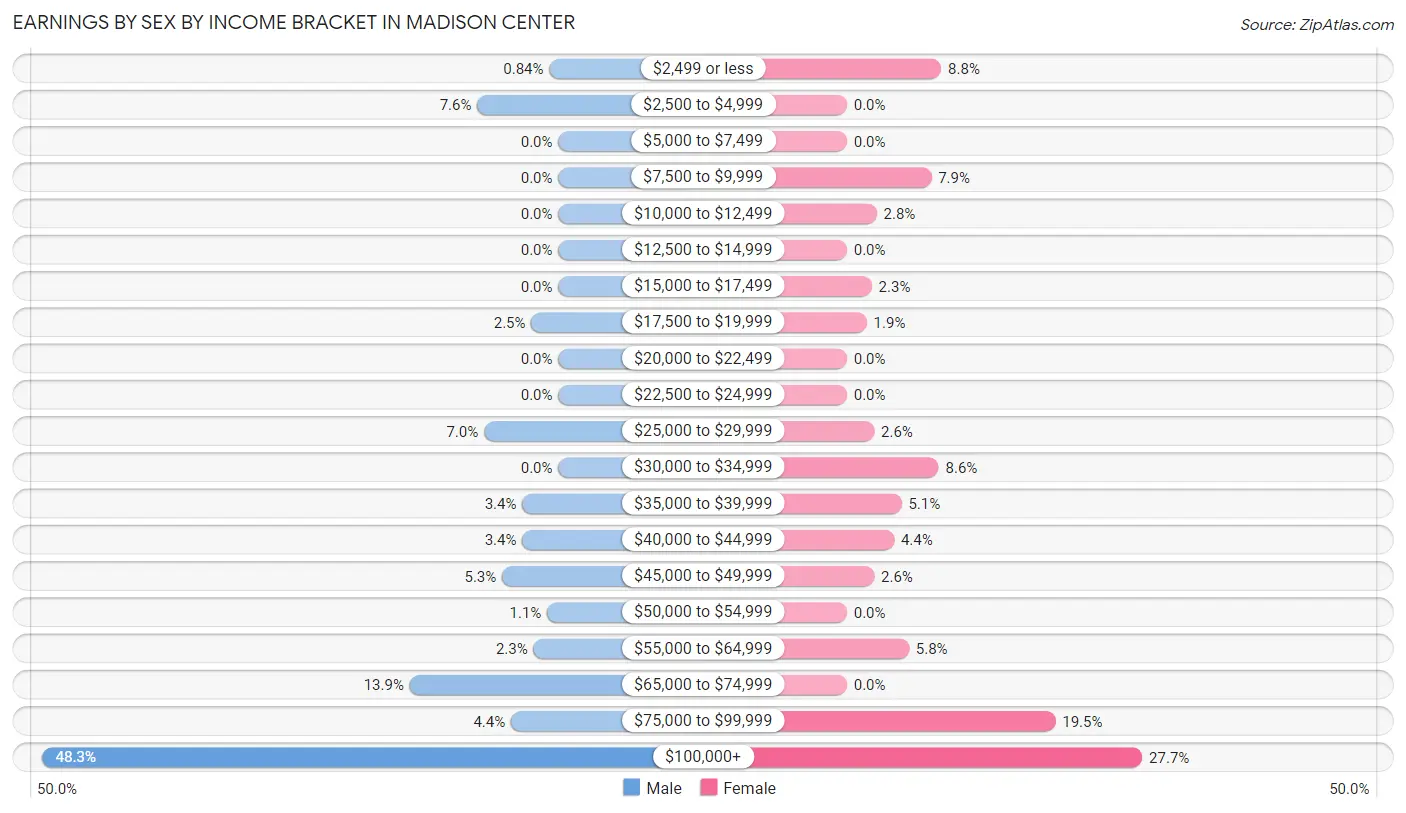
Earnings by Sex by Income Bracket in Madison Center
The most common earnings brackets in Madison Center are $100,000+ for men (229 | 48.3%) and $100,000+ for women (119 | 27.7%).
| Income | Male | Female |
| $2,499 or less | 4 (0.8%) | 38 (8.8%) |
| $2,500 to $4,999 | 36 (7.6%) | 0 (0.0%) |
| $5,000 to $7,499 | 0 (0.0%) | 0 (0.0%) |
| $7,500 to $9,999 | 0 (0.0%) | 34 (7.9%) |
| $10,000 to $12,499 | 0 (0.0%) | 12 (2.8%) |
| $12,500 to $14,999 | 0 (0.0%) | 0 (0.0%) |
| $15,000 to $17,499 | 0 (0.0%) | 10 (2.3%) |
| $17,500 to $19,999 | 12 (2.5%) | 8 (1.9%) |
| $20,000 to $22,499 | 0 (0.0%) | 0 (0.0%) |
| $22,500 to $24,999 | 0 (0.0%) | 0 (0.0%) |
| $25,000 to $29,999 | 33 (7.0%) | 11 (2.6%) |
| $30,000 to $34,999 | 0 (0.0%) | 37 (8.6%) |
| $35,000 to $39,999 | 16 (3.4%) | 22 (5.1%) |
| $40,000 to $44,999 | 16 (3.4%) | 19 (4.4%) |
| $45,000 to $49,999 | 25 (5.3%) | 11 (2.6%) |
| $50,000 to $54,999 | 5 (1.1%) | 0 (0.0%) |
| $55,000 to $64,999 | 11 (2.3%) | 25 (5.8%) |
| $65,000 to $74,999 | 66 (13.9%) | 0 (0.0%) |
| $75,000 to $99,999 | 21 (4.4%) | 84 (19.5%) |
| $100,000+ | 229 (48.3%) | 119 (27.7%) |
| Total | 474 (100.0%) | 430 (100.0%) |
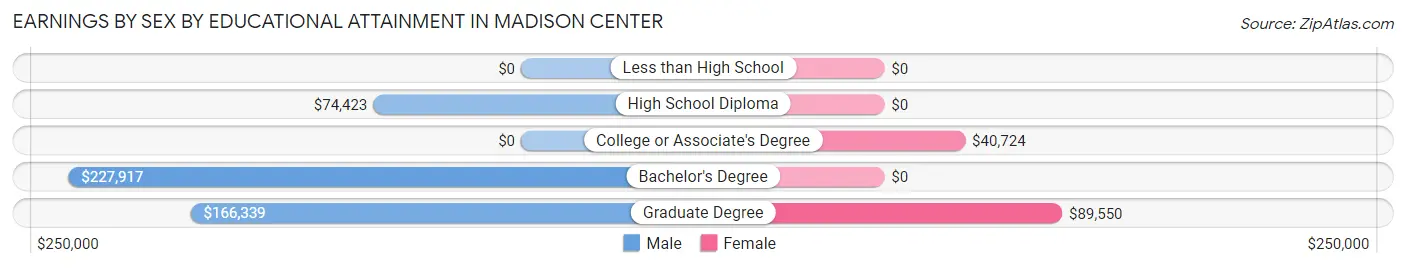
Earnings by Sex by Educational Attainment in Madison Center
Average earnings in Madison Center are $121,042 for men and $80,852 for women, a difference of 33.2%. Men with an educational attainment of bachelor's degree enjoy the highest average annual earnings of $227,917, while those with high school diploma education earn the least with $74,423. Women with an educational attainment of graduate degree earn the most with the average annual earnings of $89,550, while those with college or associate's degree education have the smallest earnings of $40,724.
| Educational Attainment | Male Income | Female Income |
| Less than High School | - | - |
| High School Diploma | $74,423 | $0 |
| College or Associate's Degree | - | - |
| Bachelor's Degree | $227,917 | $0 |
| Graduate Degree | $166,339 | $89,550 |
| Total | $121,042 | $80,852 |
Family Income in Madison Center
Family Income Brackets in Madison Center
According to the Madison Center family income data, there are 224 families falling into the $200,000+ income range, which is the most common income bracket and makes up 58.5% of all families.
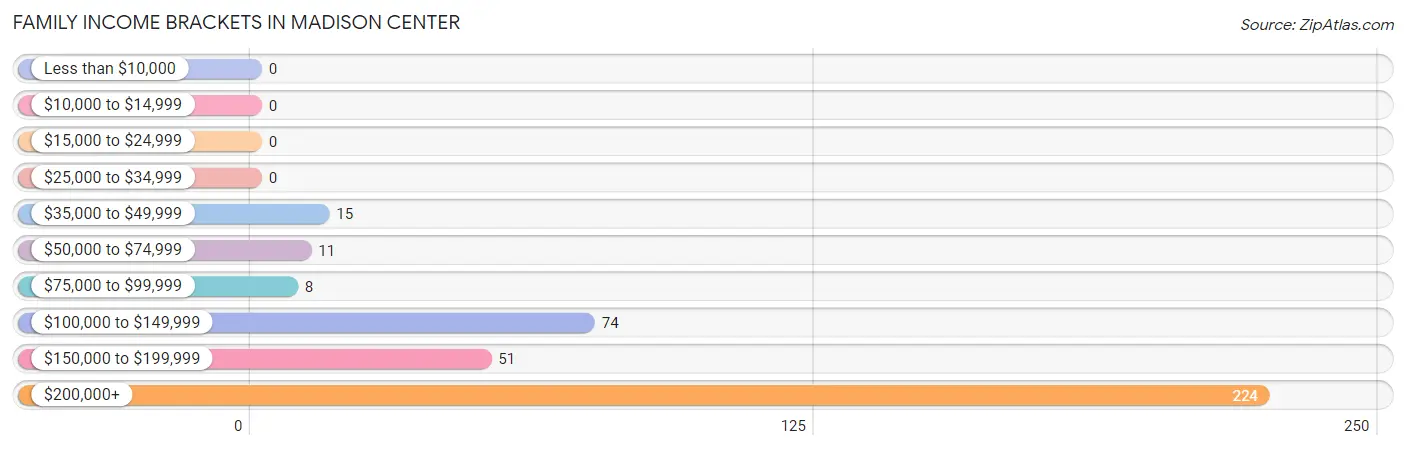
| Income Bracket | # Families | % Families |
| Less than $10,000 | 0 | 0.0% |
| $10,000 to $14,999 | 0 | 0.0% |
| $15,000 to $24,999 | 0 | 0.0% |
| $25,000 to $34,999 | 0 | 0.0% |
| $35,000 to $49,999 | 15 | 3.9% |
| $50,000 to $74,999 | 11 | 2.9% |
| $75,000 to $99,999 | 8 | 2.1% |
| $100,000 to $149,999 | 74 | 19.3% |
| $150,000 to $199,999 | 51 | 13.3% |
| $200,000+ | 224 | 58.5% |
Family Income by Famaliy Size in Madison Center
4-person families (63 | 16.5%) account for the highest median family income in Madison Center with $250,001 per family, while 2-person families (273 | 71.3%) have the highest median income of $104,337 per family member.
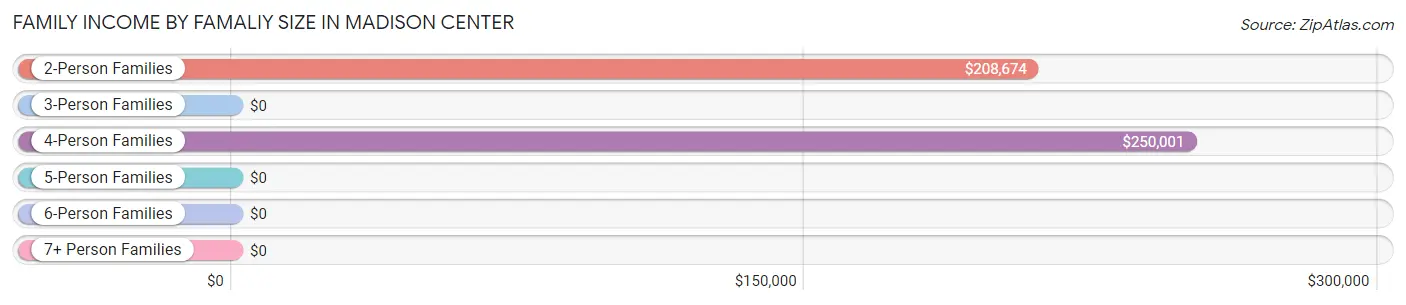
| Income Bracket | # Families | Median Income |
| 2-Person Families | 273 (71.3%) | $208,674 |
| 3-Person Families | 47 (12.3%) | $0 |
| 4-Person Families | 63 (16.5%) | $250,001 |
| 5-Person Families | 0 (0.0%) | $0 |
| 6-Person Families | 0 (0.0%) | $0 |
| 7+ Person Families | 0 (0.0%) | $0 |
| Total | 383 (100.0%) | $209,962 |
Family Income by Number of Earners in Madison Center
The median family income in Madison Center is $209,962, with families comprising 3+ earners (57) having the highest median family income of $250,001, while families with no earners (55) have the lowest median family income of $106,023, accounting for 14.9% and 14.4% of families, respectively.
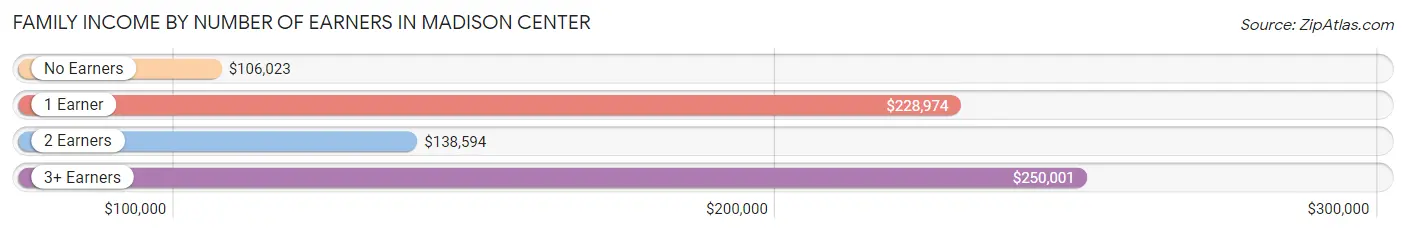
| Number of Earners | # Families | Median Income |
| No Earners | 55 (14.4%) | $106,023 |
| 1 Earner | 186 (48.6%) | $228,974 |
| 2 Earners | 85 (22.2%) | $138,594 |
| 3+ Earners | 57 (14.9%) | $250,001 |
| Total | 383 (100.0%) | $209,962 |
Household Income in Madison Center
Household Income Brackets in Madison Center
With 261 households falling in the category, the $200,000+ income range is the most frequent in Madison Center, accounting for 32.8% of all households. In contrast, only 4 households (0.5%) fall into the $15,000 to $24,999 income bracket, making it the least populous group.
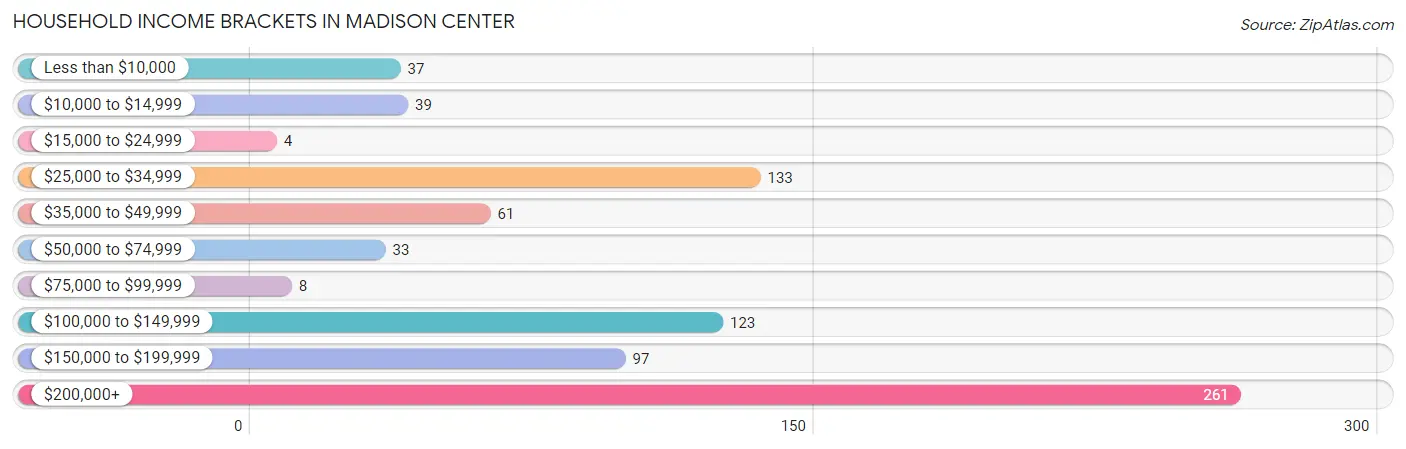
| Income Bracket | # Households | % Households |
| Less than $10,000 | 37 | 4.6% |
| $10,000 to $14,999 | 39 | 4.9% |
| $15,000 to $24,999 | 4 | 0.5% |
| $25,000 to $34,999 | 133 | 16.7% |
| $35,000 to $49,999 | 61 | 7.7% |
| $50,000 to $74,999 | 33 | 4.1% |
| $75,000 to $99,999 | 8 | 1.0% |
| $100,000 to $149,999 | 123 | 15.5% |
| $150,000 to $199,999 | 97 | 12.2% |
| $200,000+ | 261 | 32.8% |
Household Income by Householder Age in Madison Center
The median household income in Madison Center is $130,625, with the highest median household income of $250,001 found in the 45 to 64 years age bracket for the primary householder. A total of 279 households (35.0%) fall into this category.
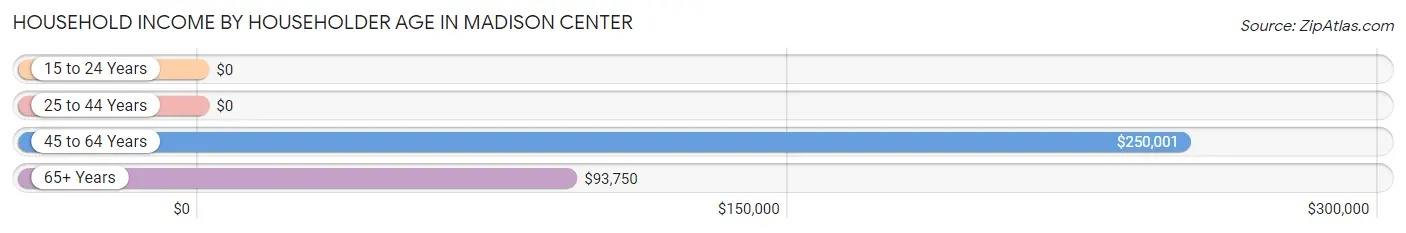
| Income Bracket | # Households | Median Income |
| 15 to 24 Years | 0 (0.0%) | $0 |
| 25 to 44 Years | 79 (9.9%) | $0 |
| 45 to 64 Years | 279 (35.0%) | $250,001 |
| 65+ Years | 438 (55.0%) | $93,750 |
| Total | 796 (100.0%) | $130,625 |
Poverty in Madison Center
Income Below Poverty by Sex and Age in Madison Center
With 3.3% poverty level for males and 9.7% for females among the residents of Madison Center, 25 to 34 year old males and 25 to 34 year old females are the most vulnerable to poverty, with 23 males (79.3%) and 7 females (35.0%) in their respective age groups living below the poverty level.
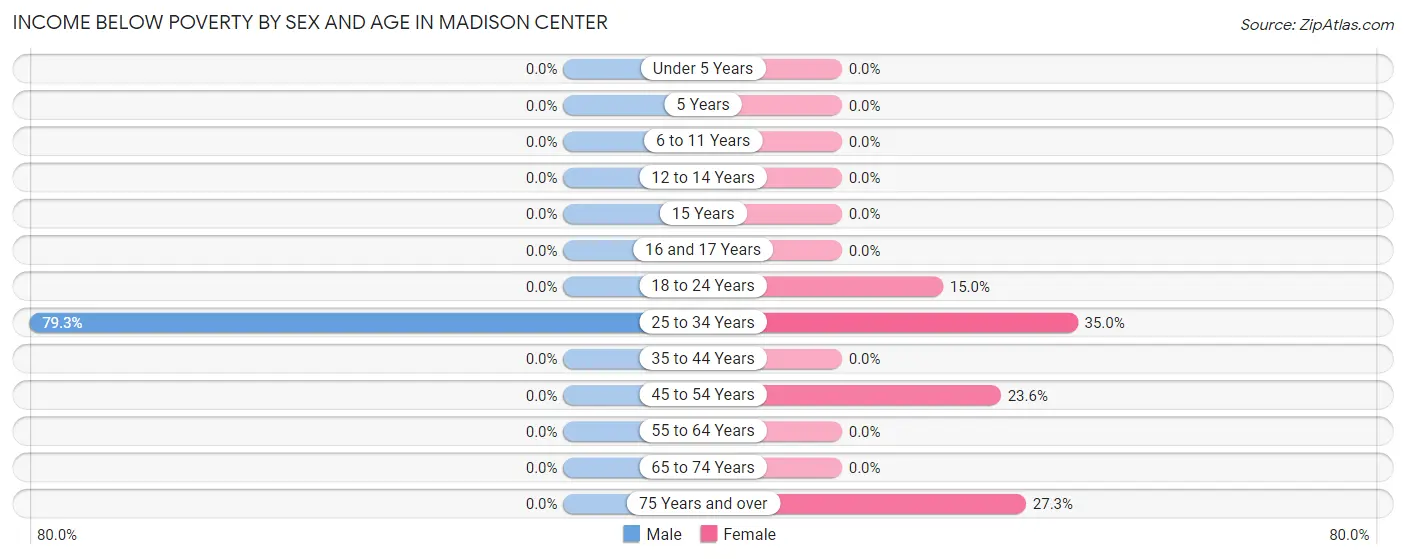
| Age Bracket | Male | Female |
| Under 5 Years | 0 (0.0%) | 0 (0.0%) |
| 5 Years | 0 (0.0%) | 0 (0.0%) |
| 6 to 11 Years | 0 (0.0%) | 0 (0.0%) |
| 12 to 14 Years | 0 (0.0%) | 0 (0.0%) |
| 15 Years | 0 (0.0%) | 0 (0.0%) |
| 16 and 17 Years | 0 (0.0%) | 0 (0.0%) |
| 18 to 24 Years | 0 (0.0%) | 6 (15.0%) |
| 25 to 34 Years | 23 (79.3%) | 7 (35.0%) |
| 35 to 44 Years | 0 (0.0%) | 0 (0.0%) |
| 45 to 54 Years | 0 (0.0%) | 21 (23.6%) |
| 55 to 64 Years | 0 (0.0%) | 0 (0.0%) |
| 65 to 74 Years | 0 (0.0%) | 0 (0.0%) |
| 75 Years and over | 0 (0.0%) | 47 (27.3%) |
| Total | 23 (3.3%) | 81 (9.7%) |
Income Above Poverty by Sex and Age in Madison Center
According to the poverty statistics in Madison Center, males aged under 5 years and females aged under 5 years are the age groups that are most secure financially, with 100.0% of males and 100.0% of females in these age groups living above the poverty line.
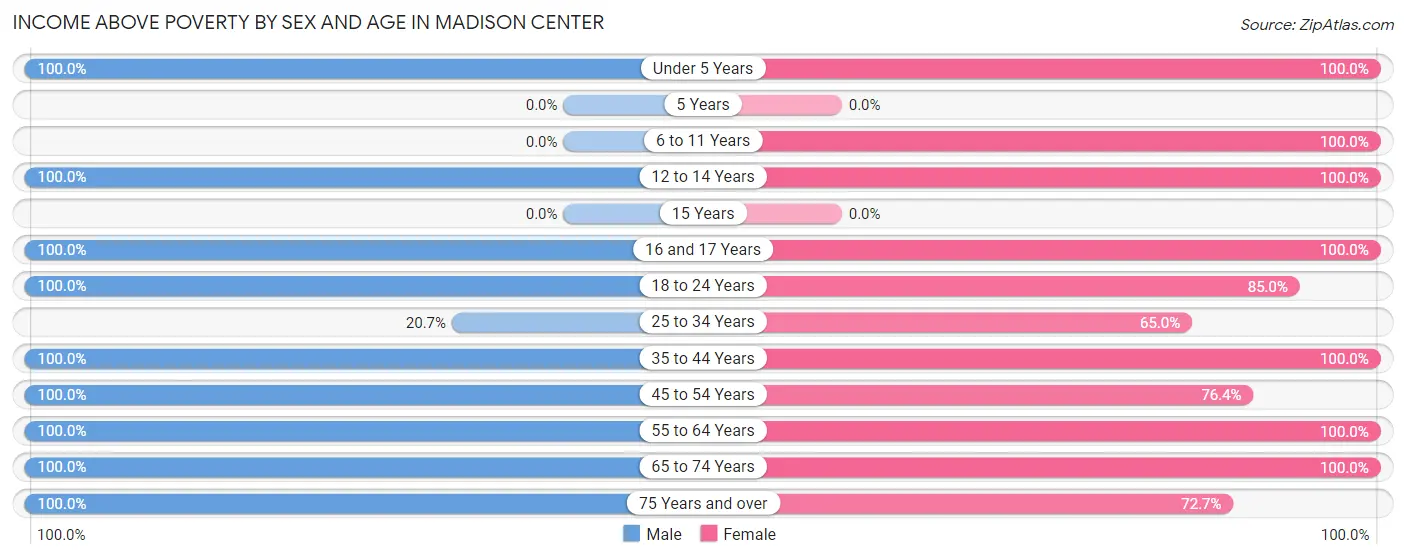
| Age Bracket | Male | Female |
| Under 5 Years | 7 (100.0%) | 6 (100.0%) |
| 5 Years | 0 (0.0%) | 0 (0.0%) |
| 6 to 11 Years | 0 (0.0%) | 17 (100.0%) |
| 12 to 14 Years | 14 (100.0%) | 31 (100.0%) |
| 15 Years | 0 (0.0%) | 0 (0.0%) |
| 16 and 17 Years | 57 (100.0%) | 11 (100.0%) |
| 18 to 24 Years | 33 (100.0%) | 34 (85.0%) |
| 25 to 34 Years | 6 (20.7%) | 13 (65.0%) |
| 35 to 44 Years | 55 (100.0%) | 50 (100.0%) |
| 45 to 54 Years | 52 (100.0%) | 68 (76.4%) |
| 55 to 64 Years | 208 (100.0%) | 225 (100.0%) |
| 65 to 74 Years | 132 (100.0%) | 171 (100.0%) |
| 75 Years and over | 111 (100.0%) | 125 (72.7%) |
| Total | 675 (96.7%) | 751 (90.3%) |
Income Below Poverty Among Married-Couple Families in Madison Center
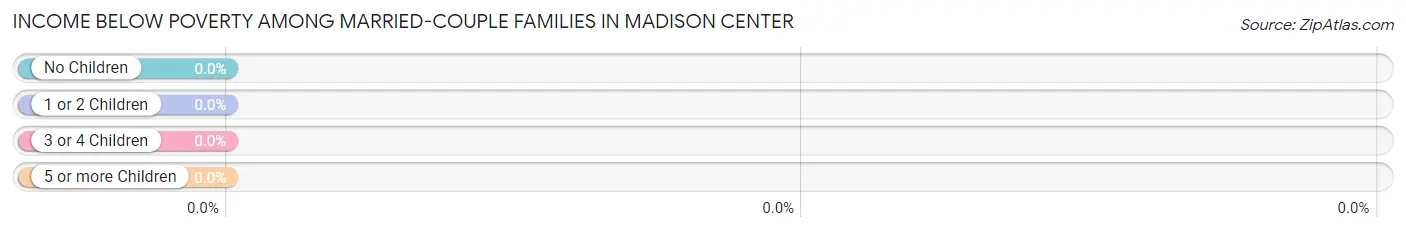
| Children | Above Poverty | Below Poverty |
| No Children | 253 (100.0%) | 0 (0.0%) |
| 1 or 2 Children | 92 (100.0%) | 0 (0.0%) |
| 3 or 4 Children | 0 (0.0%) | 0 (0.0%) |
| 5 or more Children | 0 (0.0%) | 0 (0.0%) |
| Total | 345 (100.0%) | 0 (0.0%) |
Income Below Poverty Among Single-Parent Households in Madison Center
| Children | Single Father | Single Mother |
| No Children | 0 (0.0%) | 0 (0.0%) |
| 1 or 2 Children | 0 (0.0%) | 0 (0.0%) |
| 3 or 4 Children | 0 (0.0%) | 0 (0.0%) |
| 5 or more Children | 0 (0.0%) | 0 (0.0%) |
| Total | 0 (0.0%) | 0 (0.0%) |
Income Below Poverty Among Married-Couple vs Single-Parent Households in Madison Center
| Children | Married-Couple Families | Single-Parent Households |
| No Children | 0 (0.0%) | 0 (0.0%) |
| 1 or 2 Children | 0 (0.0%) | 0 (0.0%) |
| 3 or 4 Children | 0 (0.0%) | 0 (0.0%) |
| 5 or more Children | 0 (0.0%) | 0 (0.0%) |
| Total | 0 (0.0%) | 0 (0.0%) |
Race in Madison Center
The most populous races in Madison Center are White / Caucasian (1,506 | 98.1%), Two or more Races (23 | 1.5%), and Hispanic or Latino (12 | 0.8%).
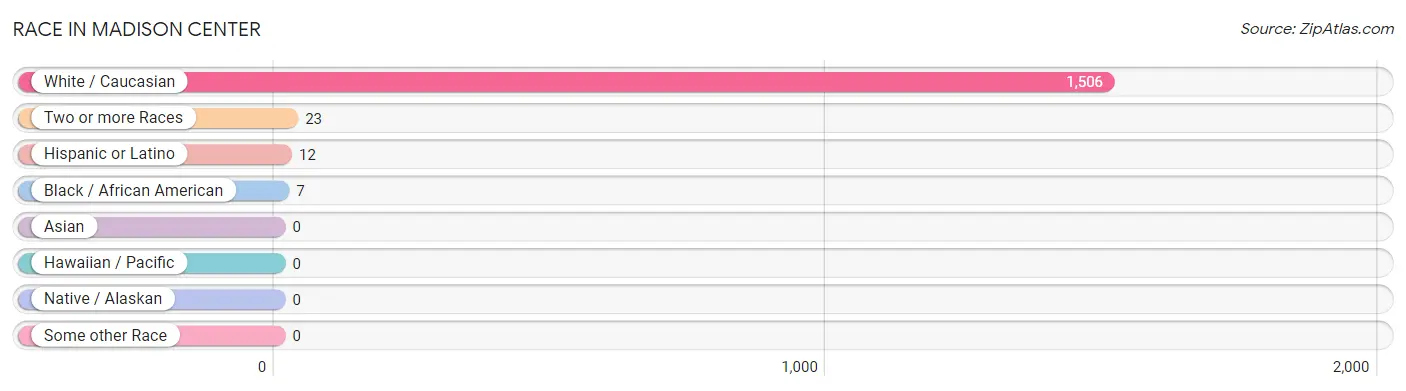
| Race | # Population | % Population |
| Asian | 0 | 0.0% |
| Black / African American | 7 | 0.5% |
| Hawaiian / Pacific | 0 | 0.0% |
| Hispanic or Latino | 12 | 0.8% |
| Native / Alaskan | 0 | 0.0% |
| White / Caucasian | 1,506 | 98.1% |
| Two or more Races | 23 | 1.5% |
| Some other Race | 0 | 0.0% |
| Total | 1,536 | 100.0% |
Ancestry in Madison Center
The most populous ancestries reported in Madison Center are Irish (616 | 40.1%), English (454 | 29.6%), Italian (219 | 14.3%), German (199 | 13.0%), and Polish (92 | 6.0%), together accounting for 102.9% of all Madison Center residents.
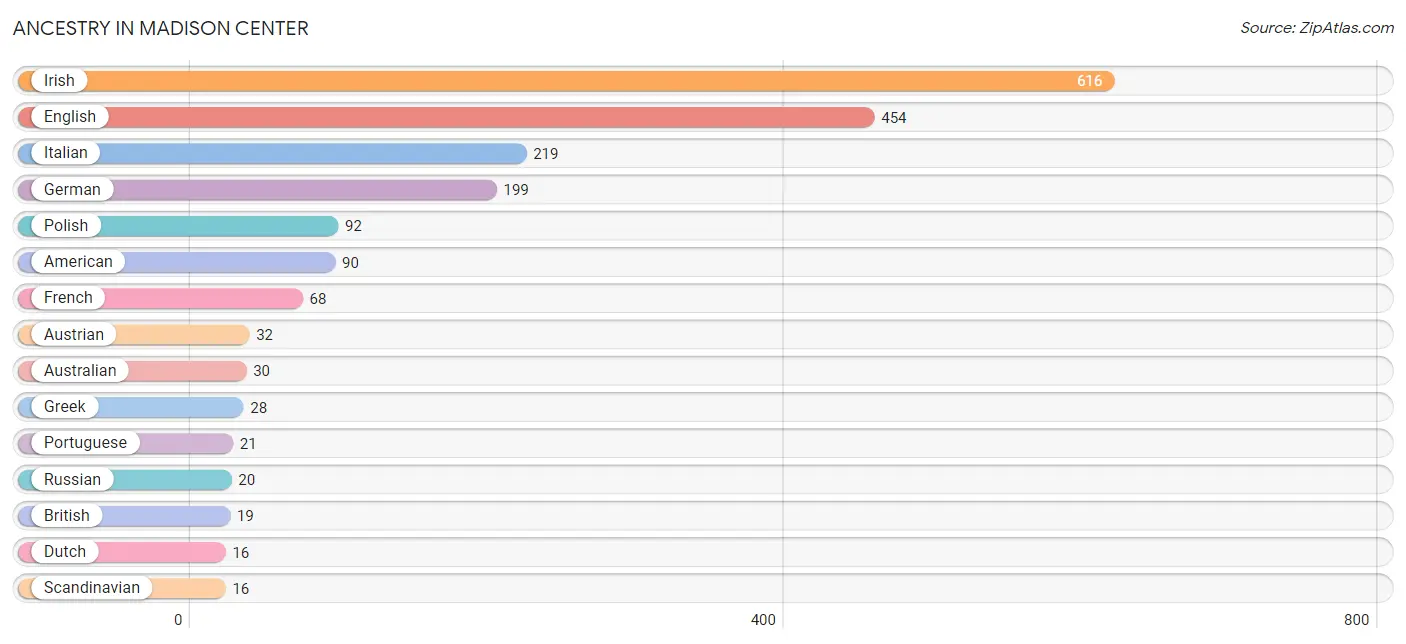
| Ancestry | # Population | % Population |
| American | 90 | 5.9% |
| Australian | 30 | 1.9% |
| Austrian | 32 | 2.1% |
| British | 19 | 1.2% |
| Cuban | 6 | 0.4% |
| Dutch | 16 | 1.0% |
| Eastern European | 13 | 0.9% |
| English | 454 | 29.6% |
| European | 7 | 0.5% |
| Finnish | 12 | 0.8% |
| French | 68 | 4.4% |
| French Canadian | 5 | 0.3% |
| German | 199 | 13.0% |
| Greek | 28 | 1.8% |
| Hungarian | 11 | 0.7% |
| Irish | 616 | 40.1% |
| Iroquois | 4 | 0.3% |
| Italian | 219 | 14.3% |
| Northern European | 10 | 0.6% |
| Polish | 92 | 6.0% |
| Portuguese | 21 | 1.4% |
| Puerto Rican | 6 | 0.4% |
| Russian | 20 | 1.3% |
| Scandinavian | 16 | 1.0% |
| Scottish | 11 | 0.7% |
| Swiss | 12 | 0.8% | View All 26 Rows |
Immigrants in Madison Center
The most numerous immigrant groups reported in Madison Center came from Europe (44 | 2.9%), England (24 | 1.6%), Northern Europe (24 | 1.6%), Austria (20 | 1.3%), and Western Europe (20 | 1.3%), together accounting for 8.6% of all Madison Center residents.
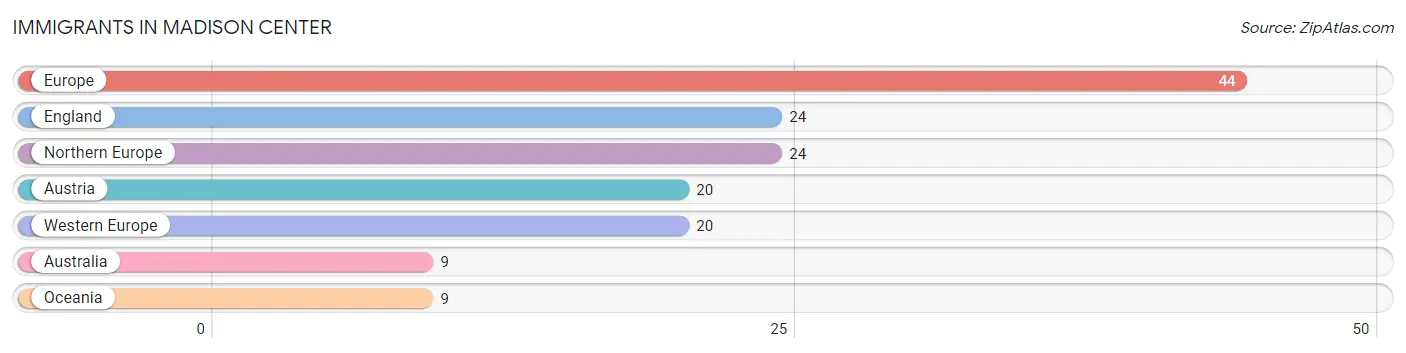
| Immigration Origin | # Population | % Population |
| Australia | 9 | 0.6% |
| Austria | 20 | 1.3% |
| England | 24 | 1.6% |
| Europe | 44 | 2.9% |
| Northern Europe | 24 | 1.6% |
| Oceania | 9 | 0.6% |
| Western Europe | 20 | 1.3% | View All 7 Rows |
Sex and Age in Madison Center
Sex and Age in Madison Center
The most populous age groups in Madison Center are 60 to 64 Years (110 | 15.6%) for men and 60 to 64 Years (147 | 17.7%) for women.
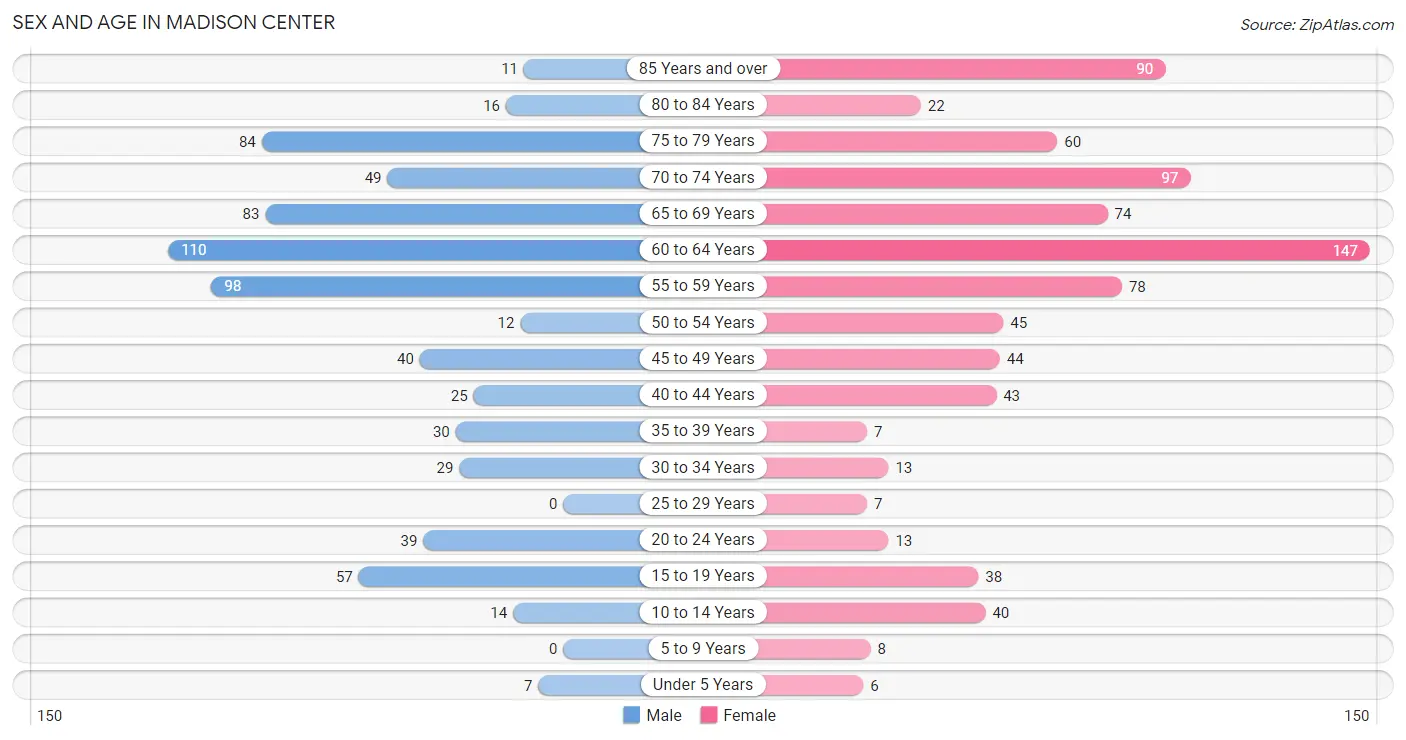
| Age Bracket | Male | Female |
| Under 5 Years | 7 (1.0%) | 6 (0.7%) |
| 5 to 9 Years | 0 (0.0%) | 8 (1.0%) |
| 10 to 14 Years | 14 (2.0%) | 40 (4.8%) |
| 15 to 19 Years | 57 (8.1%) | 38 (4.6%) |
| 20 to 24 Years | 39 (5.5%) | 13 (1.6%) |
| 25 to 29 Years | 0 (0.0%) | 7 (0.8%) |
| 30 to 34 Years | 29 (4.1%) | 13 (1.6%) |
| 35 to 39 Years | 30 (4.3%) | 7 (0.8%) |
| 40 to 44 Years | 25 (3.5%) | 43 (5.2%) |
| 45 to 49 Years | 40 (5.7%) | 44 (5.3%) |
| 50 to 54 Years | 12 (1.7%) | 45 (5.4%) |
| 55 to 59 Years | 98 (13.9%) | 78 (9.4%) |
| 60 to 64 Years | 110 (15.6%) | 147 (17.7%) |
| 65 to 69 Years | 83 (11.8%) | 74 (8.9%) |
| 70 to 74 Years | 49 (7.0%) | 97 (11.7%) |
| 75 to 79 Years | 84 (11.9%) | 60 (7.2%) |
| 80 to 84 Years | 16 (2.3%) | 22 (2.6%) |
| 85 Years and over | 11 (1.6%) | 90 (10.8%) |
| Total | 704 (100.0%) | 832 (100.0%) |
Families and Households in Madison Center
Median Family Size in Madison Center
The median family size in Madison Center is 2.64 persons per family, with married-couple families (345 | 90.1%) accounting for the largest median family size of 2.7 persons per family. On the other hand, single male/father families (5 | 1.3%) represent the smallest median family size with 2.00 persons per family.
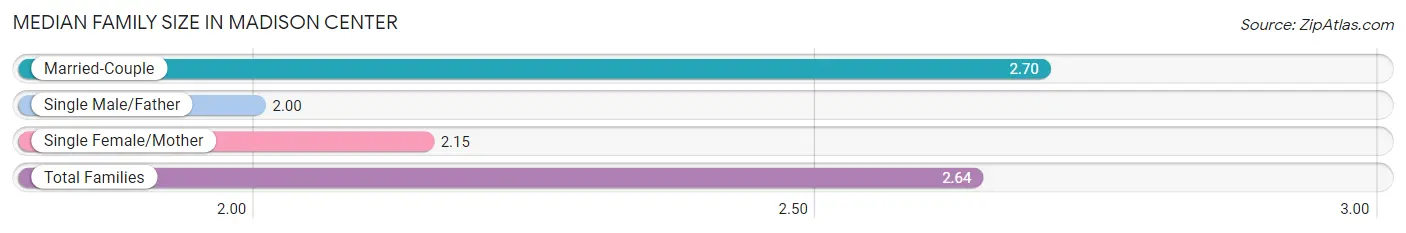
| Family Type | # Families | Family Size |
| Married-Couple | 345 (90.1%) | 2.70 |
| Single Male/Father | 5 (1.3%) | 2.00 |
| Single Female/Mother | 33 (8.6%) | 2.15 |
| Total Families | 383 (100.0%) | 2.64 |
Median Household Size in Madison Center
The median household size in Madison Center is 1.85 persons per household, with single male/father households (5 | 0.6%) accounting for the largest median household size of 3 persons per household. non-family households (413 | 51.9%) represent the smallest median household size with 1.11 persons per household.
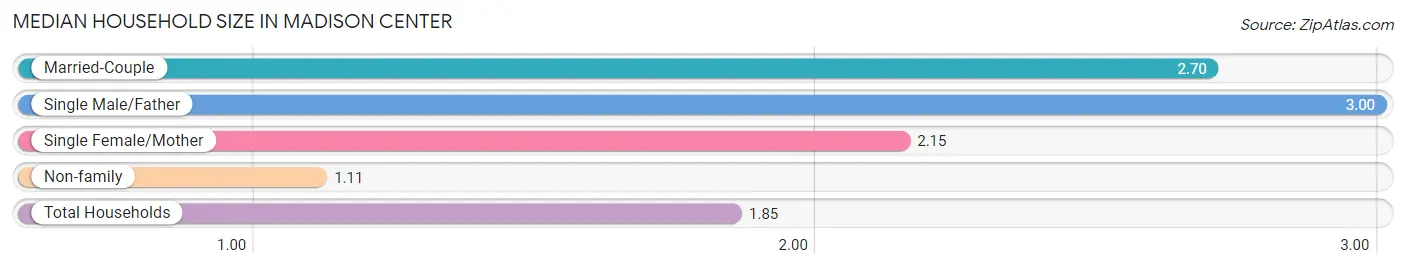
| Household Type | # Households | Household Size |
| Married-Couple | 345 (43.3%) | 2.70 |
| Single Male/Father | 5 (0.6%) | 3.00 |
| Single Female/Mother | 33 (4.2%) | 2.15 |
| Non-family | 413 (51.9%) | 1.11 |
| Total Households | 796 (100.0%) | 1.85 |
Household Size by Marriage Status in Madison Center
Out of a total of 796 households in Madison Center, 383 (48.1%) are family households, while 413 (51.9%) are nonfamily households. The most numerous type of family households are 2-person households, comprising 268, and the most common type of nonfamily households are 1-person households, comprising 374.
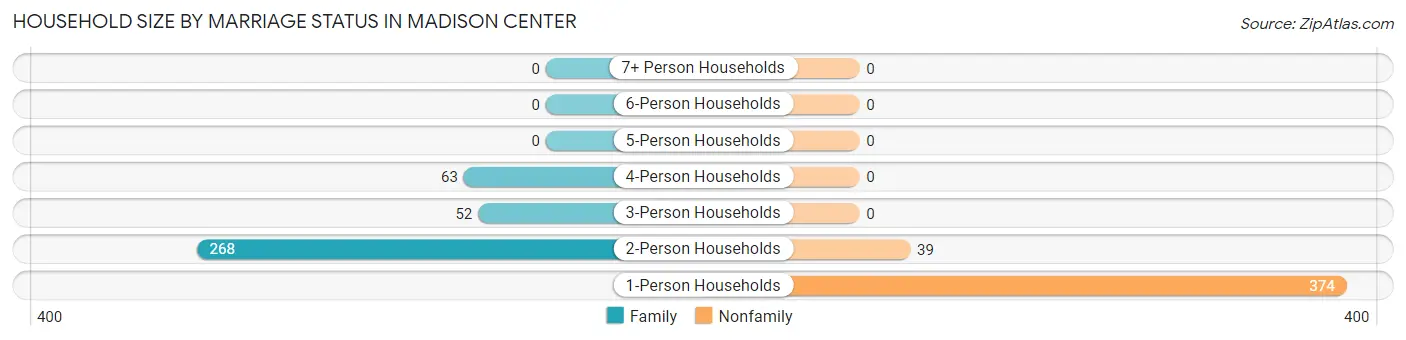
| Household Size | Family Households | Nonfamily Households |
| 1-Person Households | - | 374 (47.0%) |
| 2-Person Households | 268 (33.7%) | 39 (4.9%) |
| 3-Person Households | 52 (6.5%) | 0 (0.0%) |
| 4-Person Households | 63 (7.9%) | 0 (0.0%) |
| 5-Person Households | 0 (0.0%) | 0 (0.0%) |
| 6-Person Households | 0 (0.0%) | 0 (0.0%) |
| 7+ Person Households | 0 (0.0%) | 0 (0.0%) |
| Total | 383 (48.1%) | 413 (51.9%) |
Female Fertility in Madison Center
Fertility by Age in Madison Center
Average fertility rate in Madison Center is 36.0 births per 1,000 women. Women in the age bracket of 20 to 34 years have the highest fertility rate with 182.0 births per 1,000 women. Women in the age bracket of 20 to 34 years acount for 100.0% of all women with births.
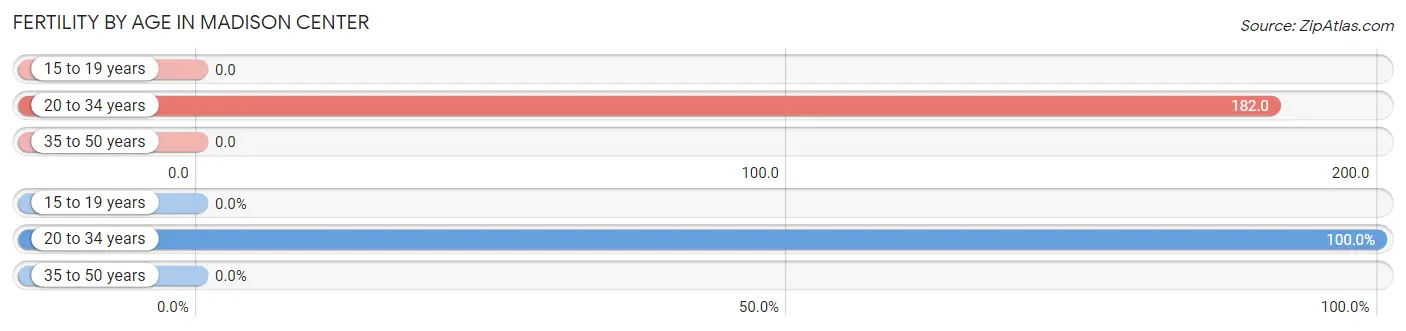
| Age Bracket | Women with Births | Births / 1,000 Women |
| 15 to 19 years | 0 (0.0%) | 0.0 |
| 20 to 34 years | 6 (100.0%) | 182.0 |
| 35 to 50 years | 0 (0.0%) | 0.0 |
| Total | 6 (100.0%) | 36.0 |
Fertility by Age by Marriage Status in Madison Center
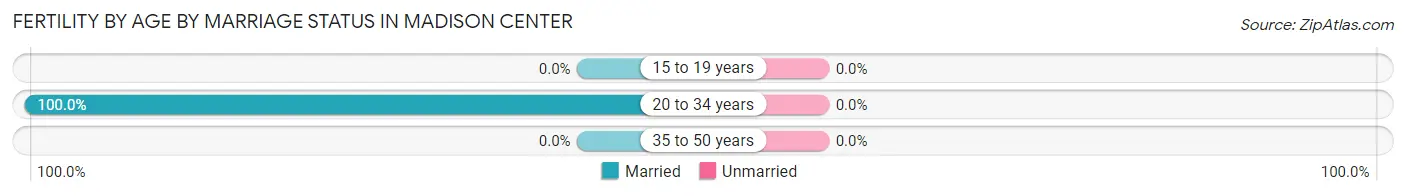
| Age Bracket | Married | Unmarried |
| 15 to 19 years | 0 (0.0%) | 0 (0.0%) |
| 20 to 34 years | 6 (100.0%) | 0 (0.0%) |
| 35 to 50 years | 0 (0.0%) | 0 (0.0%) |
| Total | 6 (100.0%) | 0 (0.0%) |
Fertility by Education in Madison Center
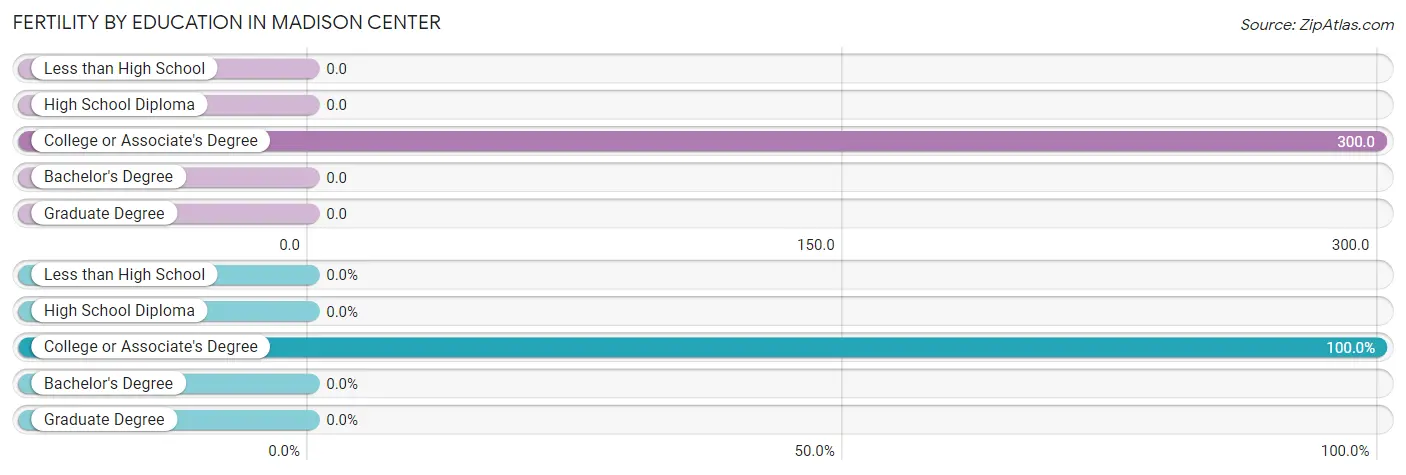
| Educational Attainment | Women with Births | Births / 1,000 Women |
| Less than High School | 0 (0.0%) | 0.0 |
| High School Diploma | 0 (0.0%) | 0.0 |
| College or Associate's Degree | 6 (100.0%) | 300.0 |
| Bachelor's Degree | 0 (0.0%) | 0.0 |
| Graduate Degree | 0 (0.0%) | 0.0 |
| Total | 6 (100.0%) | 36.0 |
Fertility by Education by Marriage Status in Madison Center
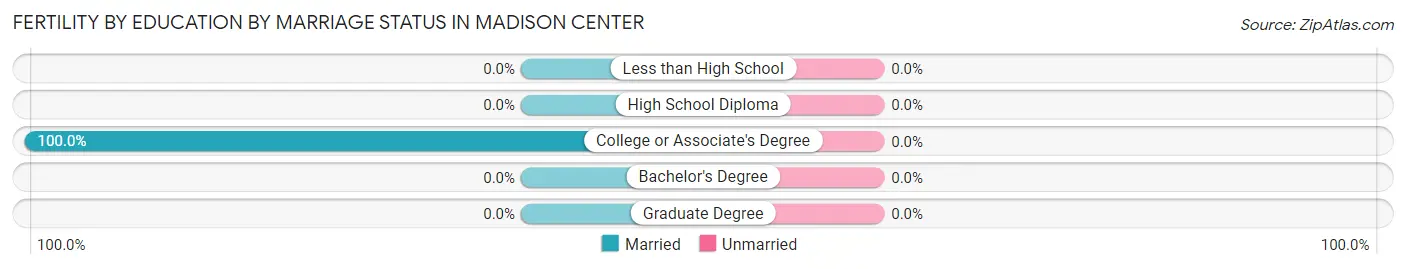
| Educational Attainment | Married | Unmarried |
| Less than High School | 0 (0.0%) | 0 (0.0%) |
| High School Diploma | 0 (0.0%) | 0 (0.0%) |
| College or Associate's Degree | 6 (100.0%) | 0 (0.0%) |
| Bachelor's Degree | 0 (0.0%) | 0 (0.0%) |
| Graduate Degree | 0 (0.0%) | 0 (0.0%) |
| Total | 6 (100.0%) | 0 (0.0%) |
Employment Characteristics in Madison Center
Employment by Class of Employer in Madison Center
Among the 758 employed individuals in Madison Center, private company employees (395 | 52.1%), self-employed (not incorporated) (131 | 17.3%), and not-for-profit organizations (95 | 12.5%) make up the most common classes of employment.
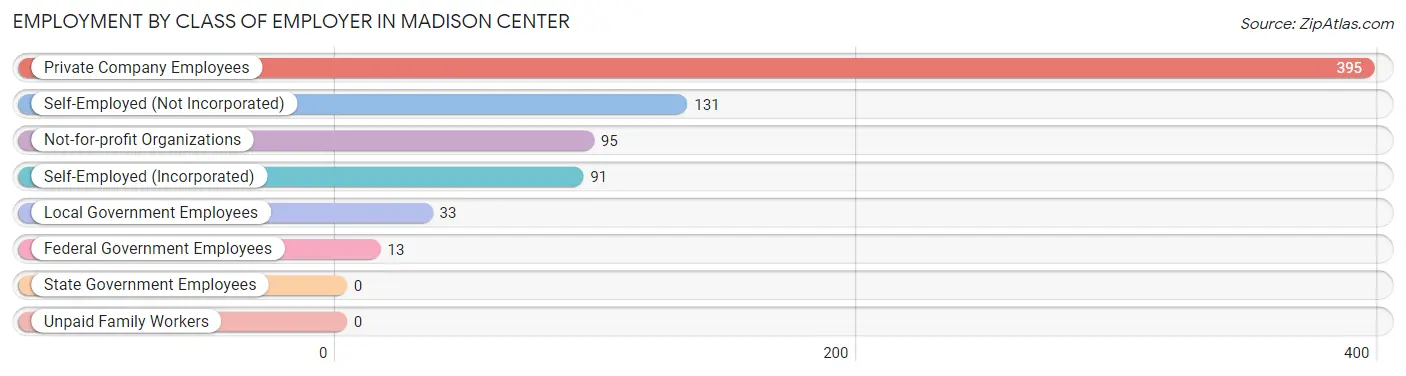
| Employer Class | # Employees | % Employees |
| Private Company Employees | 395 | 52.1% |
| Self-Employed (Incorporated) | 91 | 12.0% |
| Self-Employed (Not Incorporated) | 131 | 17.3% |
| Not-for-profit Organizations | 95 | 12.5% |
| Local Government Employees | 33 | 4.3% |
| State Government Employees | 0 | 0.0% |
| Federal Government Employees | 13 | 1.7% |
| Unpaid Family Workers | 0 | 0.0% |
| Total | 758 | 100.0% |
Employment Status by Age in Madison Center
According to the labor force statistics for Madison Center, out of the total population over 16 years of age (1,461), 57.7% or 843 individuals are in the labor force, with 2.7% or 23 of them unemployed. The age group with the highest labor force participation rate is 45 to 54 years, with 91.5% or 129 individuals in the labor force. Within the labor force, the 30 to 34 years age range has the highest percentage of unemployed individuals, with 65.7% or 23 of them being unemployed.
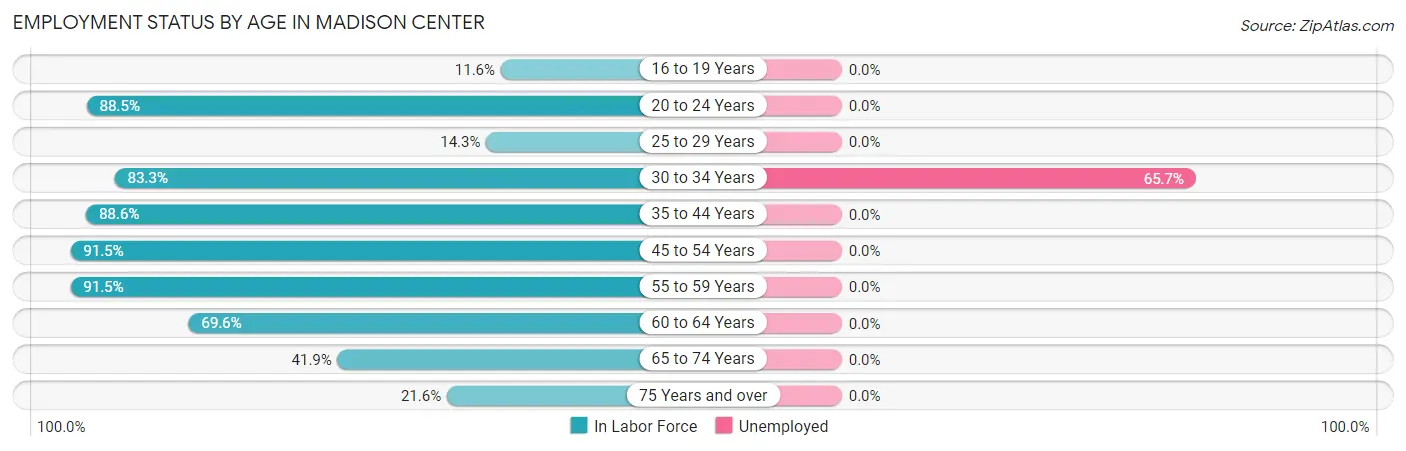
| Age Bracket | In Labor Force | Unemployed |
| 16 to 19 Years | 11 (11.6%) | 0 (0.0%) |
| 20 to 24 Years | 46 (88.5%) | 0 (0.0%) |
| 25 to 29 Years | 1 (14.3%) | 0 (0.0%) |
| 30 to 34 Years | 35 (83.3%) | 23 (65.7%) |
| 35 to 44 Years | 93 (88.6%) | 0 (0.0%) |
| 45 to 54 Years | 129 (91.5%) | 0 (0.0%) |
| 55 to 59 Years | 161 (91.5%) | 0 (0.0%) |
| 60 to 64 Years | 179 (69.6%) | 0 (0.0%) |
| 65 to 74 Years | 127 (41.9%) | 0 (0.0%) |
| 75 Years and over | 61 (21.6%) | 0 (0.0%) |
| Total | 843 (57.7%) | 23 (2.7%) |
Employment Status by Educational Attainment in Madison Center
According to labor force statistics for Madison Center, 82.1% of individuals (598) out of the total population between 25 and 64 years of age (728) are in the labor force, with 3.8% or 23 of them being unemployed. The group with the highest labor force participation rate are those with the educational attainment of less than high school, with 100.0% or 4 individuals in the labor force. Within the labor force, individuals with high school diploma education have the highest percentage of unemployment, with 18.0% or 23 of them being unemployed.
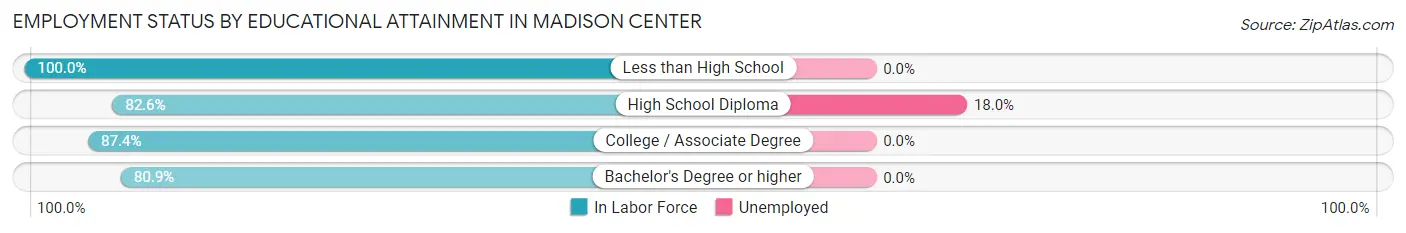
| Educational Attainment | In Labor Force | Unemployed |
| Less than High School | 4 (100.0%) | 0 (0.0%) |
| High School Diploma | 128 (82.6%) | 28 (18.0%) |
| College / Associate Degree | 76 (87.4%) | 0 (0.0%) |
| Bachelor's Degree or higher | 390 (80.9%) | 0 (0.0%) |
| Total | 598 (82.1%) | 28 (3.8%) |
Employment Occupations by Sex in Madison Center
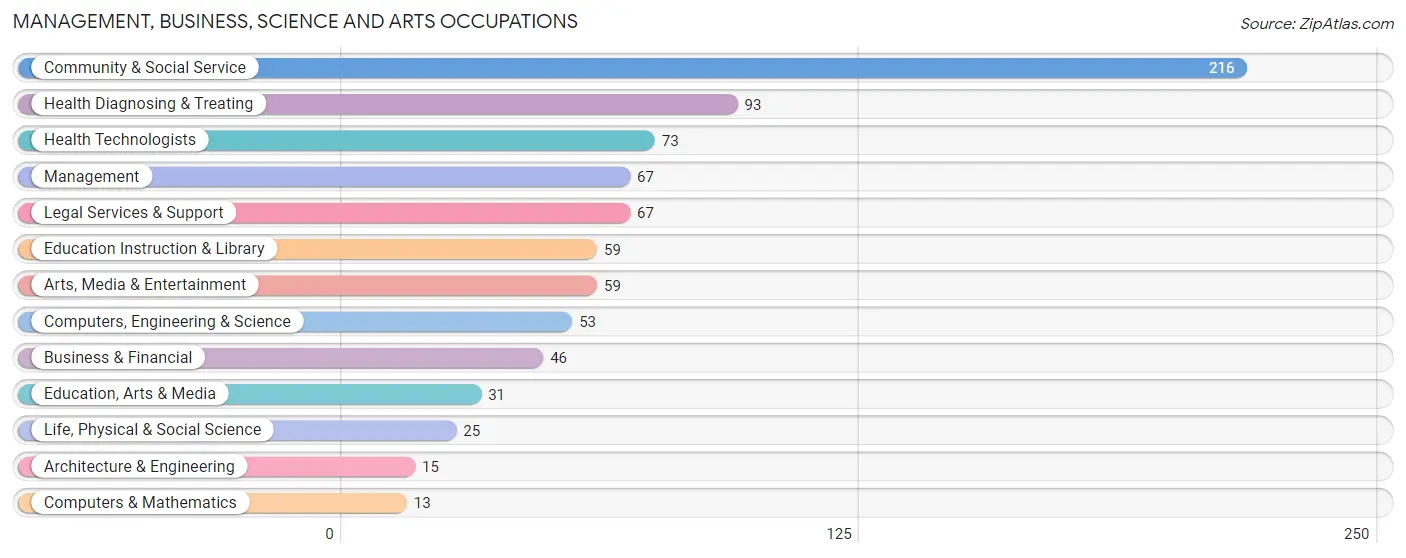
Management, Business, Science and Arts Occupations
The most common Management, Business, Science and Arts occupations in Madison Center are Community & Social Service (216 | 26.3%), Health Diagnosing & Treating (93 | 11.3%), Health Technologists (73 | 8.9%), Management (67 | 8.2%), and Legal Services & Support (67 | 8.2%).
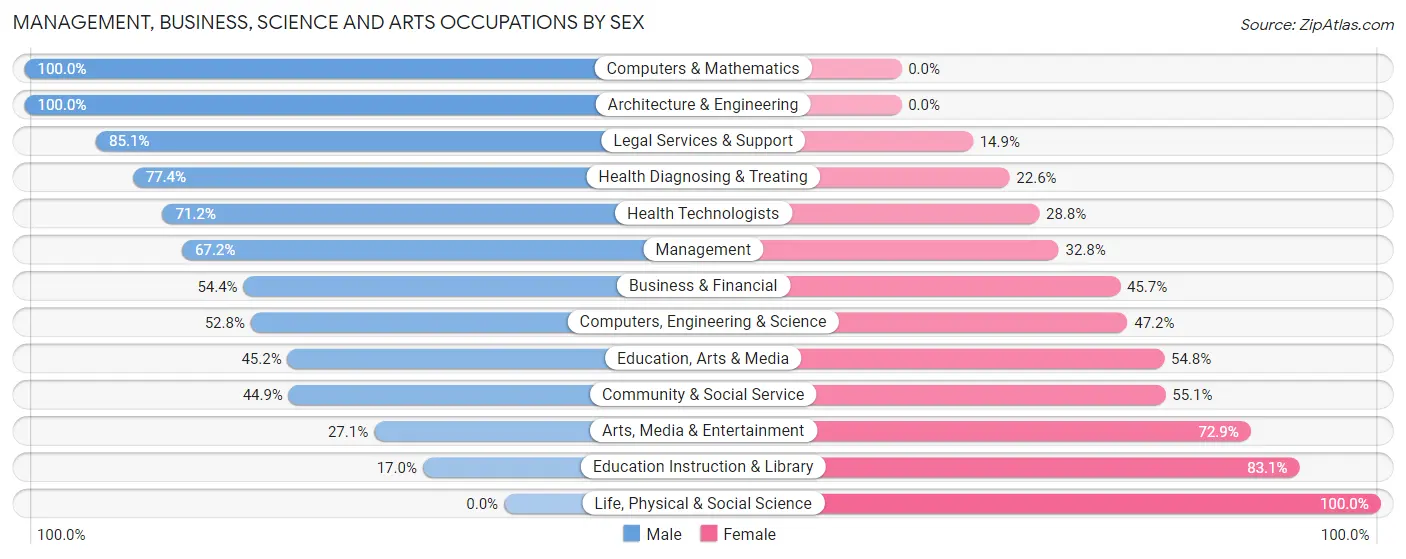
Management, Business, Science and Arts Occupations by Sex
Within the Management, Business, Science and Arts occupations in Madison Center, the most male-oriented occupations are Computers & Mathematics (100.0%), Architecture & Engineering (100.0%), and Legal Services & Support (85.1%), while the most female-oriented occupations are Life, Physical & Social Science (100.0%), Education Instruction & Library (83.1%), and Arts, Media & Entertainment (72.9%).
| Occupation | Male | Female |
| Management | 45 (67.2%) | 22 (32.8%) |
| Business & Financial | 25 (54.3%) | 21 (45.7%) |
| Computers, Engineering & Science | 28 (52.8%) | 25 (47.2%) |
| Computers & Mathematics | 13 (100.0%) | 0 (0.0%) |
| Architecture & Engineering | 15 (100.0%) | 0 (0.0%) |
| Life, Physical & Social Science | 0 (0.0%) | 25 (100.0%) |
| Community & Social Service | 97 (44.9%) | 119 (55.1%) |
| Education, Arts & Media | 14 (45.2%) | 17 (54.8%) |
| Legal Services & Support | 57 (85.1%) | 10 (14.9%) |
| Education Instruction & Library | 10 (17.0%) | 49 (83.1%) |
| Arts, Media & Entertainment | 16 (27.1%) | 43 (72.9%) |
| Health Diagnosing & Treating | 72 (77.4%) | 21 (22.6%) |
| Health Technologists | 52 (71.2%) | 21 (28.8%) |
| Total (Category) | 267 (56.2%) | 208 (43.8%) |
| Total (Overall) | 417 (50.8%) | 403 (49.1%) |
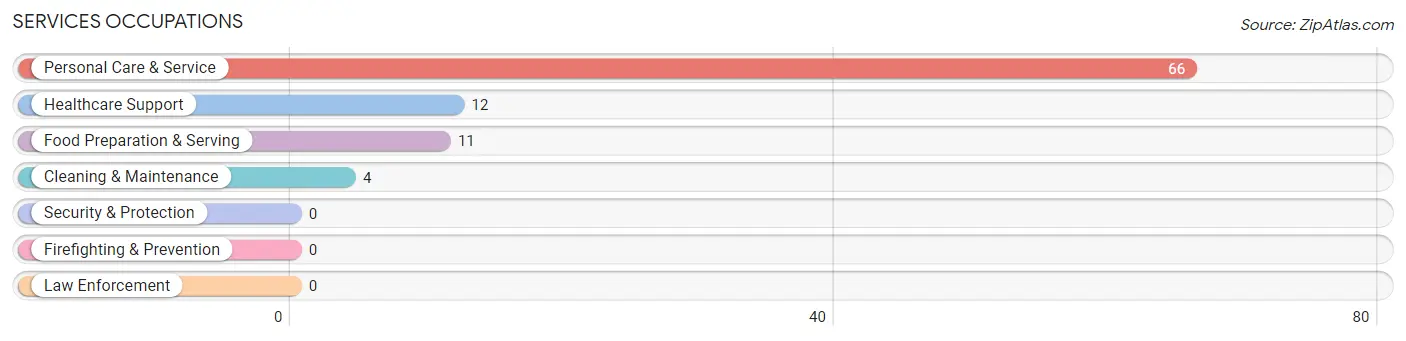
Services Occupations
The most common Services occupations in Madison Center are Personal Care & Service (66 | 8.1%), Healthcare Support (12 | 1.5%), Food Preparation & Serving (11 | 1.3%), and Cleaning & Maintenance (4 | 0.5%).
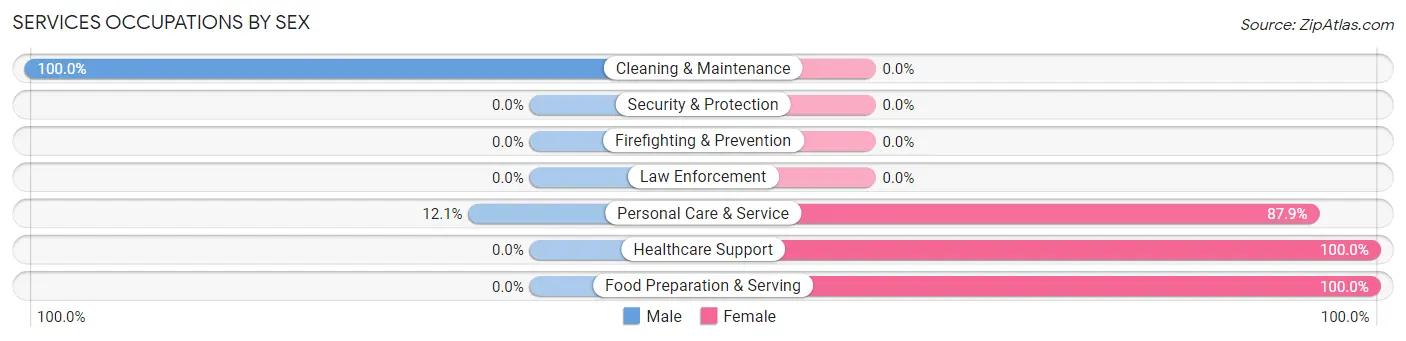
Services Occupations by Sex
Within the Services occupations in Madison Center, the most male-oriented occupations are Cleaning & Maintenance (100.0%), and Personal Care & Service (12.1%), while the most female-oriented occupations are Healthcare Support (100.0%), Food Preparation & Serving (100.0%), and Personal Care & Service (87.9%).
| Occupation | Male | Female |
| Healthcare Support | 0 (0.0%) | 12 (100.0%) |
| Security & Protection | 0 (0.0%) | 0 (0.0%) |
| Firefighting & Prevention | 0 (0.0%) | 0 (0.0%) |
| Law Enforcement | 0 (0.0%) | 0 (0.0%) |
| Food Preparation & Serving | 0 (0.0%) | 11 (100.0%) |
| Cleaning & Maintenance | 4 (100.0%) | 0 (0.0%) |
| Personal Care & Service | 8 (12.1%) | 58 (87.9%) |
| Total (Category) | 12 (12.9%) | 81 (87.1%) |
| Total (Overall) | 417 (50.8%) | 403 (49.1%) |
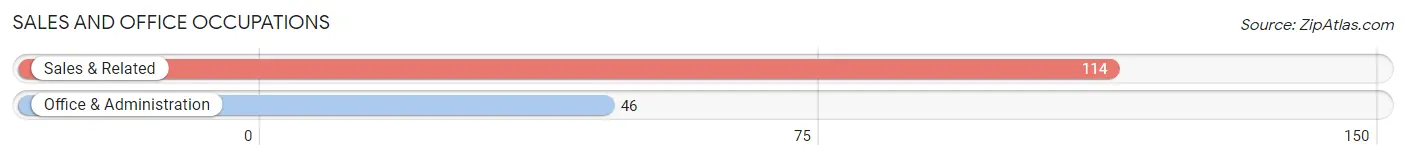
Sales and Office Occupations
The most common Sales and Office occupations in Madison Center are Sales & Related (114 | 13.9%), and Office & Administration (46 | 5.6%).
Sales and Office Occupations by Sex
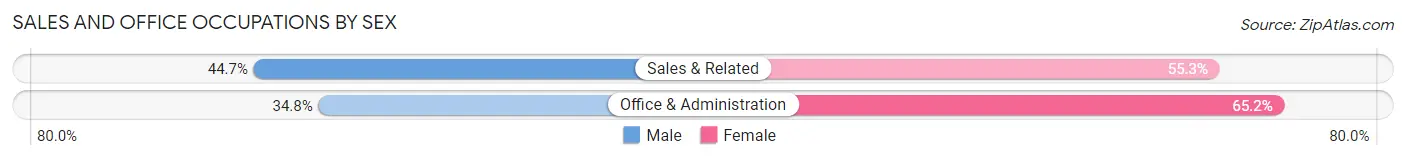
| Occupation | Male | Female |
| Sales & Related | 51 (44.7%) | 63 (55.3%) |
| Office & Administration | 16 (34.8%) | 30 (65.2%) |
| Total (Category) | 67 (41.9%) | 93 (58.1%) |
| Total (Overall) | 417 (50.8%) | 403 (49.1%) |
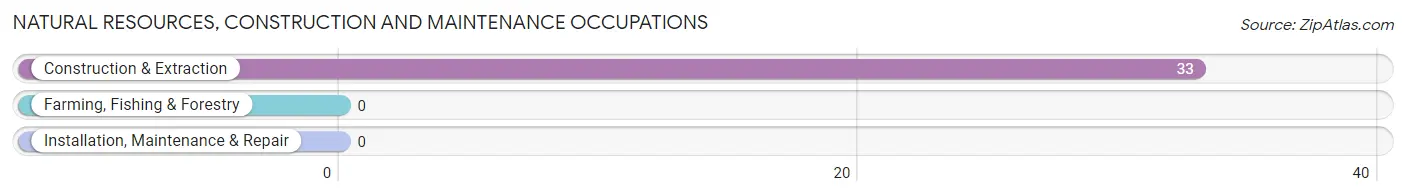
Natural Resources, Construction and Maintenance Occupations
The most common Natural Resources, Construction and Maintenance occupations in Madison Center are , and Construction & Extraction (33 | 4.0%).
Natural Resources, Construction and Maintenance Occupations by Sex
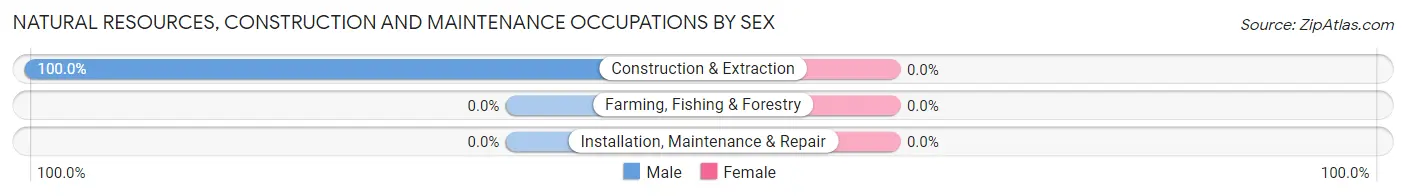
| Occupation | Male | Female |
| Farming, Fishing & Forestry | 0 (0.0%) | 0 (0.0%) |
| Construction & Extraction | 33 (100.0%) | 0 (0.0%) |
| Installation, Maintenance & Repair | 0 (0.0%) | 0 (0.0%) |
| Total (Category) | 33 (100.0%) | 0 (0.0%) |
| Total (Overall) | 417 (50.8%) | 403 (49.1%) |
Production, Transportation and Moving Occupations
The most common Production, Transportation and Moving occupations in Madison Center are Material Moving (34 | 4.2%), and Transportation (25 | 3.0%).
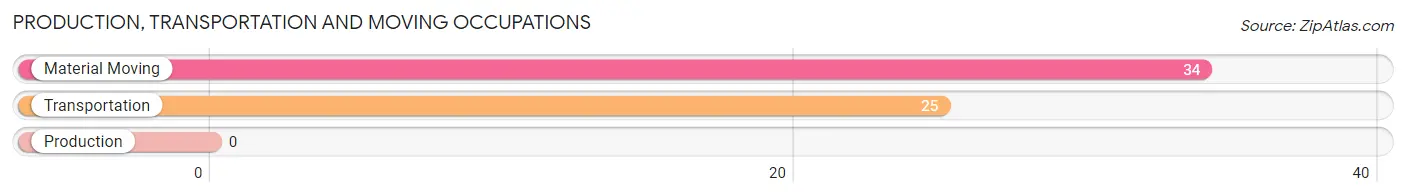
Production, Transportation and Moving Occupations by Sex
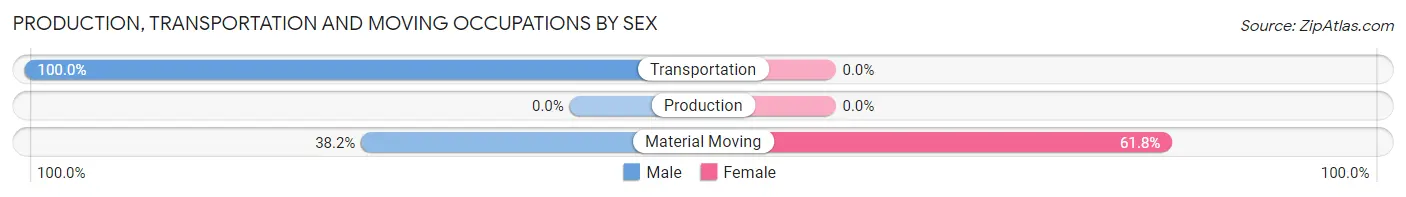
| Occupation | Male | Female |
| Production | 0 (0.0%) | 0 (0.0%) |
| Transportation | 25 (100.0%) | 0 (0.0%) |
| Material Moving | 13 (38.2%) | 21 (61.8%) |
| Total (Category) | 38 (64.4%) | 21 (35.6%) |
| Total (Overall) | 417 (50.8%) | 403 (49.1%) |
Employment Industries by Sex in Madison Center
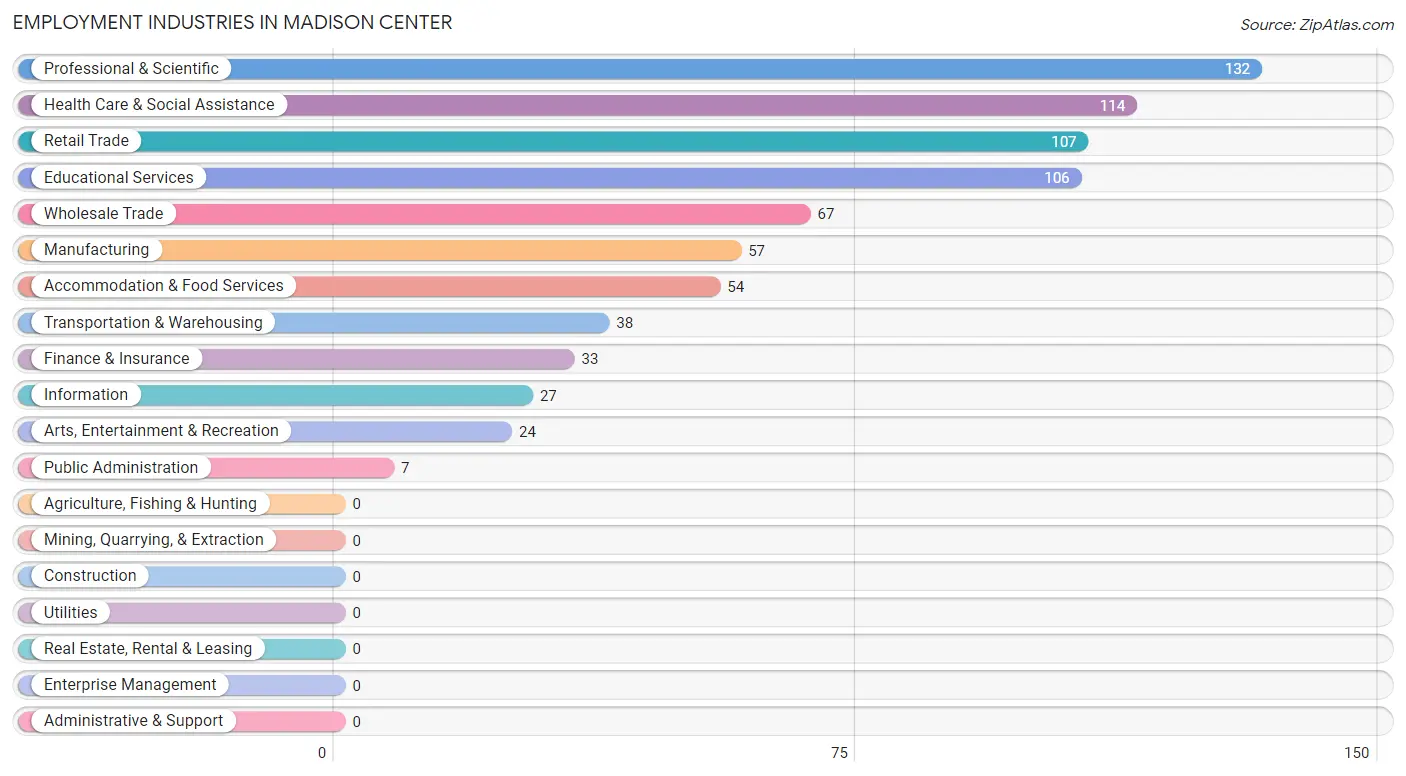
Employment Industries in Madison Center
The major employment industries in Madison Center include Professional & Scientific (132 | 16.1%), Health Care & Social Assistance (114 | 13.9%), Retail Trade (107 | 13.1%), Educational Services (106 | 12.9%), and Wholesale Trade (67 | 8.2%).
Employment Industries by Sex in Madison Center
The Madison Center industries that see more men than women are Transportation & Warehousing (100.0%), Accommodation & Food Services (79.6%), and Finance & Insurance (72.7%), whereas the industries that tend to have a higher number of women are Information (100.0%), Arts, Entertainment & Recreation (100.0%), and Public Administration (100.0%).
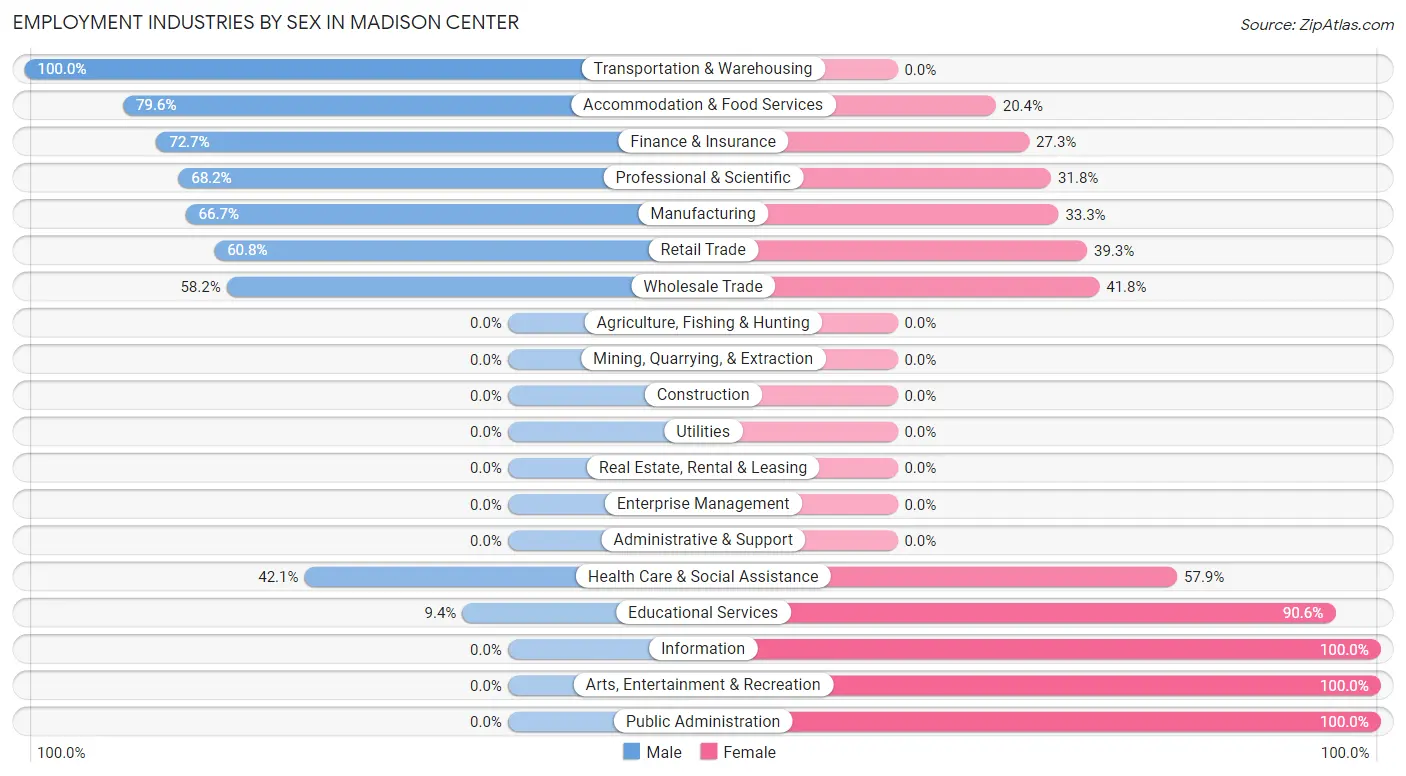
| Industry | Male | Female |
| Agriculture, Fishing & Hunting | 0 (0.0%) | 0 (0.0%) |
| Mining, Quarrying, & Extraction | 0 (0.0%) | 0 (0.0%) |
| Construction | 0 (0.0%) | 0 (0.0%) |
| Manufacturing | 38 (66.7%) | 19 (33.3%) |
| Wholesale Trade | 39 (58.2%) | 28 (41.8%) |
| Retail Trade | 65 (60.8%) | 42 (39.3%) |
| Transportation & Warehousing | 38 (100.0%) | 0 (0.0%) |
| Utilities | 0 (0.0%) | 0 (0.0%) |
| Information | 0 (0.0%) | 27 (100.0%) |
| Finance & Insurance | 24 (72.7%) | 9 (27.3%) |
| Real Estate, Rental & Leasing | 0 (0.0%) | 0 (0.0%) |
| Professional & Scientific | 90 (68.2%) | 42 (31.8%) |
| Enterprise Management | 0 (0.0%) | 0 (0.0%) |
| Administrative & Support | 0 (0.0%) | 0 (0.0%) |
| Educational Services | 10 (9.4%) | 96 (90.6%) |
| Health Care & Social Assistance | 48 (42.1%) | 66 (57.9%) |
| Arts, Entertainment & Recreation | 0 (0.0%) | 24 (100.0%) |
| Accommodation & Food Services | 43 (79.6%) | 11 (20.4%) |
| Public Administration | 0 (0.0%) | 7 (100.0%) |
| Total | 417 (50.8%) | 403 (49.1%) |
Education in Madison Center
School Enrollment in Madison Center
The most common levels of schooling among the 175 students in Madison Center are high school (78 | 44.6%), college / undergraduate (45 | 25.7%), and middle school (44 | 25.1%).
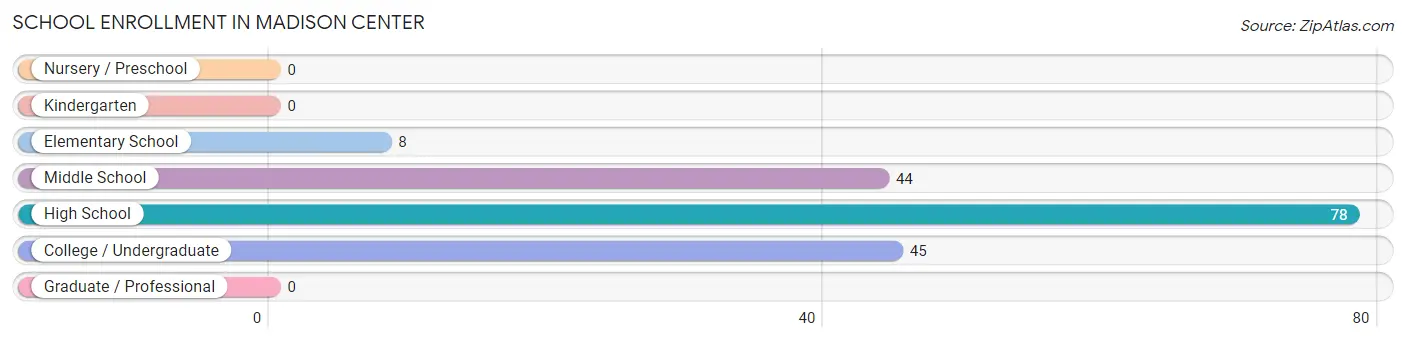
| School Level | # Students | % Students |
| Nursery / Preschool | 0 | 0.0% |
| Kindergarten | 0 | 0.0% |
| Elementary School | 8 | 4.6% |
| Middle School | 44 | 25.1% |
| High School | 78 | 44.6% |
| College / Undergraduate | 45 | 25.7% |
| Graduate / Professional | 0 | 0.0% |
| Total | 175 | 100.0% |
School Enrollment by Age by Funding Source in Madison Center
Out of a total of 175 students who are enrolled in schools in Madison Center, 42 (24.0%) attend a private institution, while the remaining 133 (76.0%) are enrolled in public schools. The age group of 20 to 24 year olds has the highest likelihood of being enrolled in private schools, with 6 (100.0% in the age bracket) enrolled. Conversely, the age group of 5 to 9 year old has the lowest likelihood of being enrolled in a private school, with 8 (100.0% in the age bracket) attending a public institution.
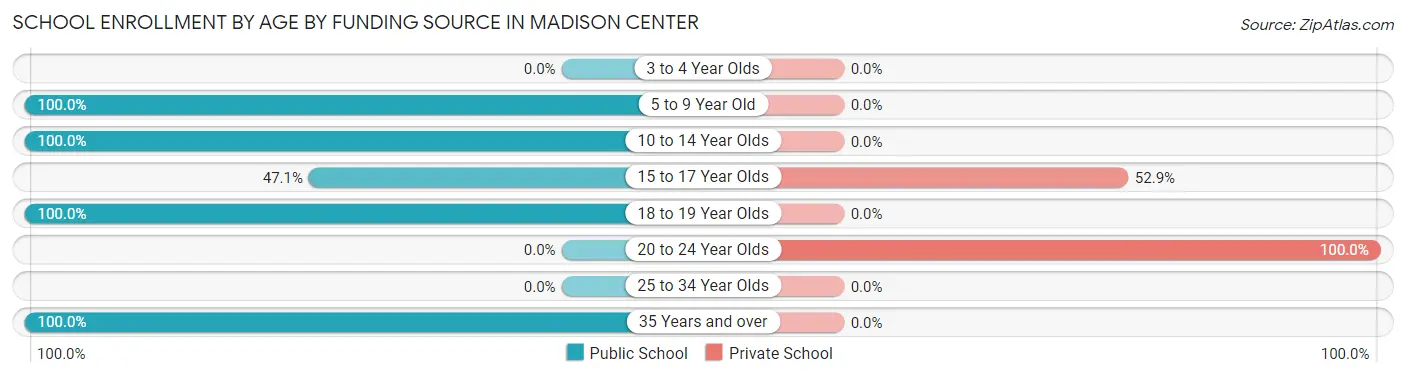
| Age Bracket | Public School | Private School |
| 3 to 4 Year Olds | 0 (0.0%) | 0 (0.0%) |
| 5 to 9 Year Old | 8 (100.0%) | 0 (0.0%) |
| 10 to 14 Year Olds | 54 (100.0%) | 0 (0.0%) |
| 15 to 17 Year Olds | 32 (47.1%) | 36 (52.9%) |
| 18 to 19 Year Olds | 27 (100.0%) | 0 (0.0%) |
| 20 to 24 Year Olds | 0 (0.0%) | 6 (100.0%) |
| 25 to 34 Year Olds | 0 (0.0%) | 0 (0.0%) |
| 35 Years and over | 12 (100.0%) | 0 (0.0%) |
| Total | 133 (76.0%) | 42 (24.0%) |
Educational Attainment by Field of Study in Madison Center
Business (186 | 20.4%), literature & languages (109 | 11.9%), education (97 | 10.6%), liberal arts & history (97 | 10.6%), and social sciences (74 | 8.1%) are the most common fields of study among 913 individuals in Madison Center who have obtained a bachelor's degree or higher.
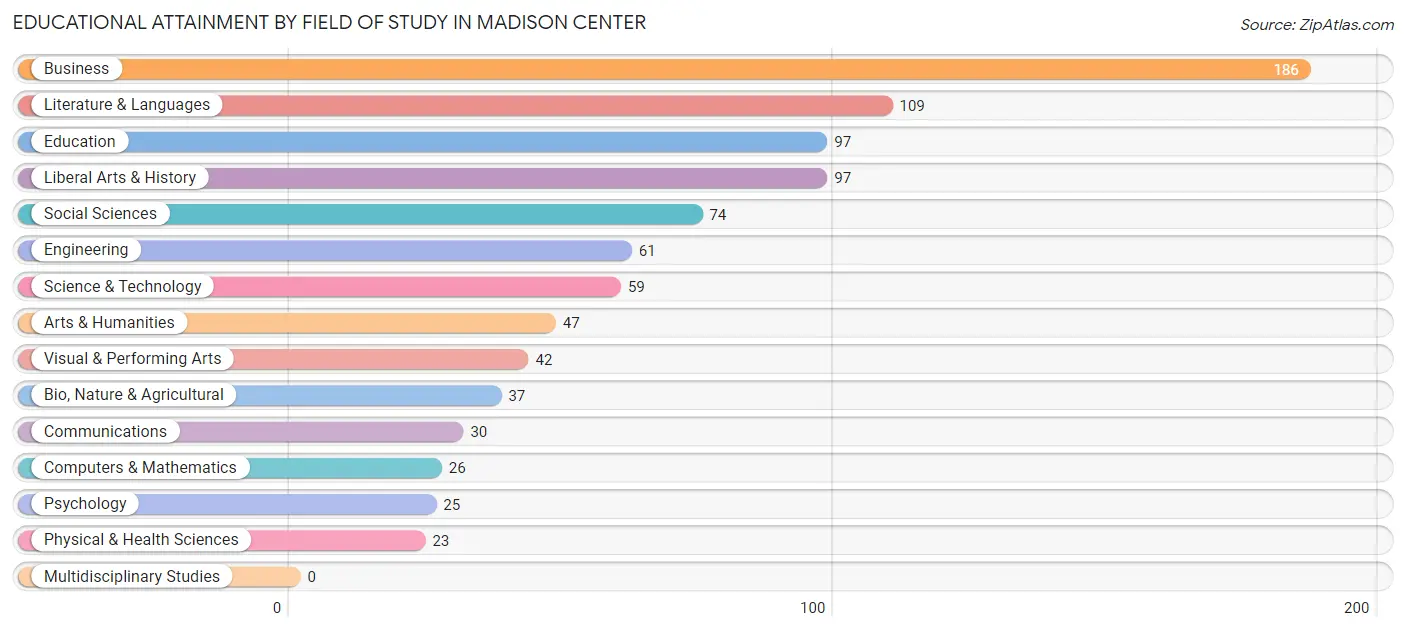
| Field of Study | # Graduates | % Graduates |
| Computers & Mathematics | 26 | 2.9% |
| Bio, Nature & Agricultural | 37 | 4.1% |
| Physical & Health Sciences | 23 | 2.5% |
| Psychology | 25 | 2.7% |
| Social Sciences | 74 | 8.1% |
| Engineering | 61 | 6.7% |
| Multidisciplinary Studies | 0 | 0.0% |
| Science & Technology | 59 | 6.5% |
| Business | 186 | 20.4% |
| Education | 97 | 10.6% |
| Literature & Languages | 109 | 11.9% |
| Liberal Arts & History | 97 | 10.6% |
| Visual & Performing Arts | 42 | 4.6% |
| Communications | 30 | 3.3% |
| Arts & Humanities | 47 | 5.1% |
| Total | 913 | 100.0% |
Transportation & Commute in Madison Center
Vehicle Availability by Sex in Madison Center
The most prevalent vehicle ownership categories in Madison Center are males with 3 vehicles (157, accounting for 40.6%) and females with 3 vehicles (74, making up 44.5%).
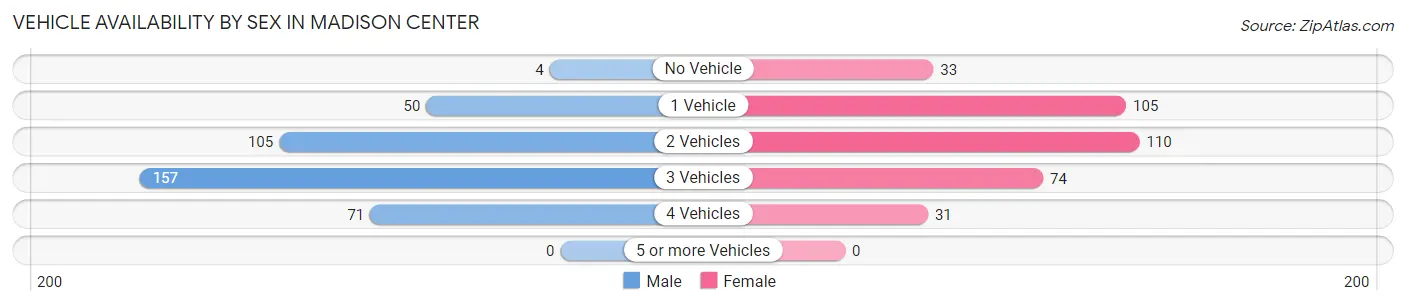
| Vehicles Available | Male | Female |
| No Vehicle | 4 (1.0%) | 33 (9.3%) |
| 1 Vehicle | 50 (12.9%) | 105 (29.7%) |
| 2 Vehicles | 105 (27.1%) | 110 (31.2%) |
| 3 Vehicles | 157 (40.6%) | 74 (21.0%) |
| 4 Vehicles | 71 (18.3%) | 31 (8.8%) |
| 5 or more Vehicles | 0 (0.0%) | 0 (0.0%) |
| Total | 387 (100.0%) | 353 (100.0%) |
Commute Time in Madison Center
The most frequently occuring commute durations in Madison Center are 10 to 14 minutes (85 commuters, 14.4%), 25 to 29 minutes (80 commuters, 13.6%), and 5 to 9 minutes (74 commuters, 12.6%).
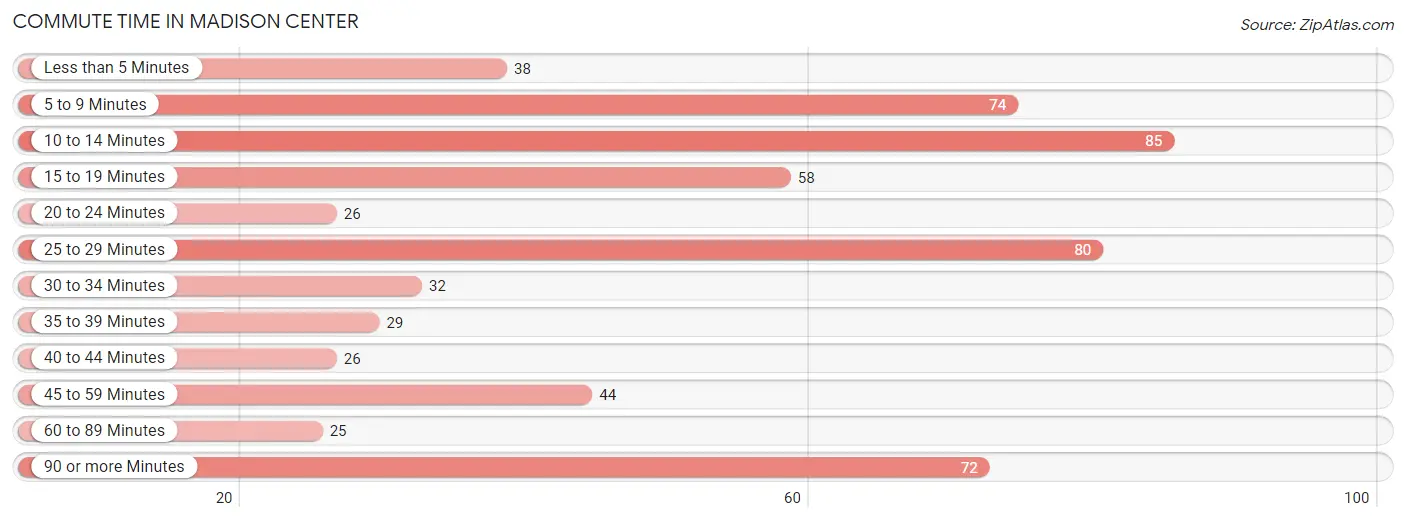
| Commute Time | # Commuters | % Commuters |
| Less than 5 Minutes | 38 | 6.5% |
| 5 to 9 Minutes | 74 | 12.6% |
| 10 to 14 Minutes | 85 | 14.4% |
| 15 to 19 Minutes | 58 | 9.9% |
| 20 to 24 Minutes | 26 | 4.4% |
| 25 to 29 Minutes | 80 | 13.6% |
| 30 to 34 Minutes | 32 | 5.4% |
| 35 to 39 Minutes | 29 | 4.9% |
| 40 to 44 Minutes | 26 | 4.4% |
| 45 to 59 Minutes | 44 | 7.5% |
| 60 to 89 Minutes | 25 | 4.2% |
| 90 or more Minutes | 72 | 12.2% |
Commute Time by Sex in Madison Center
The most common commute times in Madison Center are 10 to 14 minutes (68 commuters, 24.8%) for males and 90 or more minutes (59 commuters, 18.7%) for females.
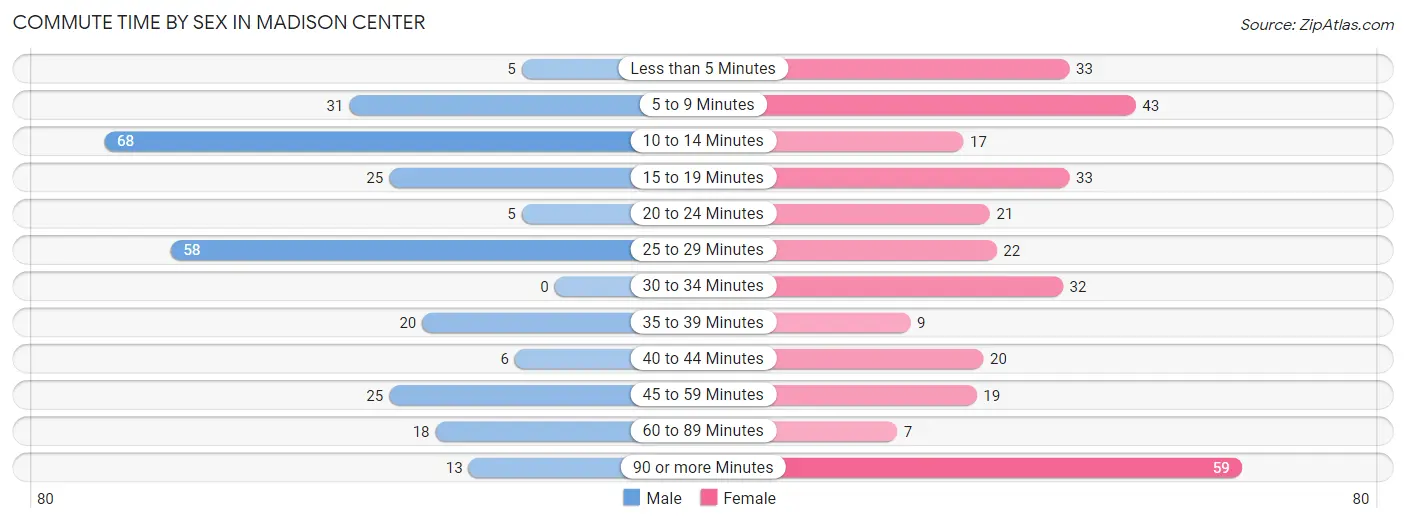
| Commute Time | Male | Female |
| Less than 5 Minutes | 5 (1.8%) | 33 (10.5%) |
| 5 to 9 Minutes | 31 (11.3%) | 43 (13.7%) |
| 10 to 14 Minutes | 68 (24.8%) | 17 (5.4%) |
| 15 to 19 Minutes | 25 (9.1%) | 33 (10.5%) |
| 20 to 24 Minutes | 5 (1.8%) | 21 (6.7%) |
| 25 to 29 Minutes | 58 (21.2%) | 22 (7.0%) |
| 30 to 34 Minutes | 0 (0.0%) | 32 (10.2%) |
| 35 to 39 Minutes | 20 (7.3%) | 9 (2.9%) |
| 40 to 44 Minutes | 6 (2.2%) | 20 (6.4%) |
| 45 to 59 Minutes | 25 (9.1%) | 19 (6.0%) |
| 60 to 89 Minutes | 18 (6.6%) | 7 (2.2%) |
| 90 or more Minutes | 13 (4.7%) | 59 (18.7%) |
Time of Departure to Work by Sex in Madison Center
The most frequent times of departure to work in Madison Center are 7:00 AM to 7:29 AM (70, 25.6%) for males and 8:00 AM to 8:29 AM (104, 33.0%) for females.
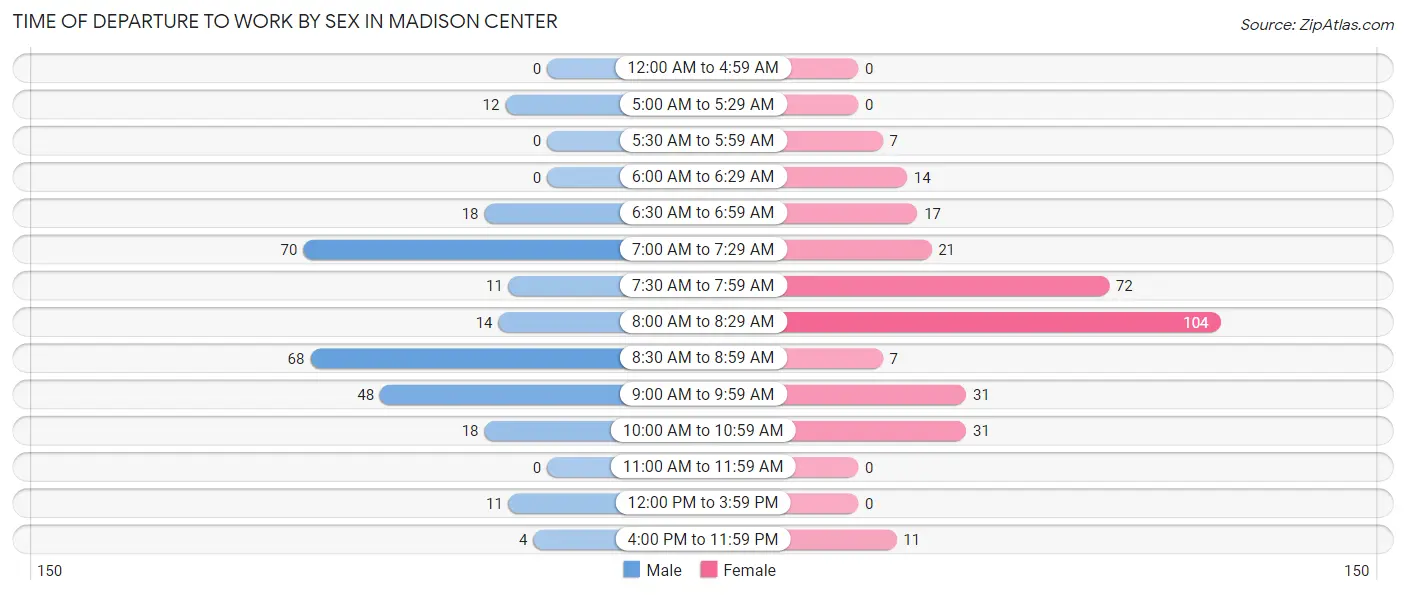
| Time of Departure | Male | Female |
| 12:00 AM to 4:59 AM | 0 (0.0%) | 0 (0.0%) |
| 5:00 AM to 5:29 AM | 12 (4.4%) | 0 (0.0%) |
| 5:30 AM to 5:59 AM | 0 (0.0%) | 7 (2.2%) |
| 6:00 AM to 6:29 AM | 0 (0.0%) | 14 (4.4%) |
| 6:30 AM to 6:59 AM | 18 (6.6%) | 17 (5.4%) |
| 7:00 AM to 7:29 AM | 70 (25.6%) | 21 (6.7%) |
| 7:30 AM to 7:59 AM | 11 (4.0%) | 72 (22.9%) |
| 8:00 AM to 8:29 AM | 14 (5.1%) | 104 (33.0%) |
| 8:30 AM to 8:59 AM | 68 (24.8%) | 7 (2.2%) |
| 9:00 AM to 9:59 AM | 48 (17.5%) | 31 (9.8%) |
| 10:00 AM to 10:59 AM | 18 (6.6%) | 31 (9.8%) |
| 11:00 AM to 11:59 AM | 0 (0.0%) | 0 (0.0%) |
| 12:00 PM to 3:59 PM | 11 (4.0%) | 0 (0.0%) |
| 4:00 PM to 11:59 PM | 4 (1.5%) | 11 (3.5%) |
| Total | 274 (100.0%) | 315 (100.0%) |
Housing Occupancy in Madison Center
Occupancy by Ownership in Madison Center
Of the total 796 dwellings in Madison Center, owner-occupied units account for 483 (60.7%), while renter-occupied units make up 313 (39.3%).
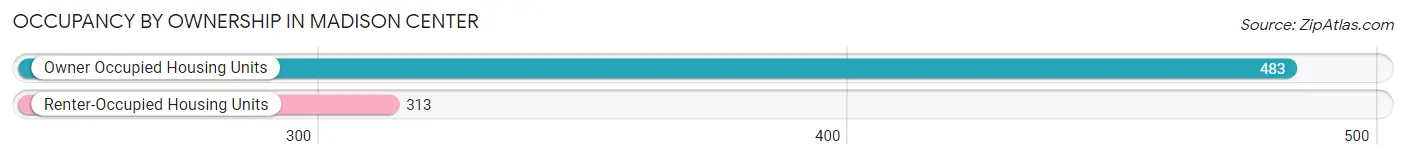
| Occupancy | # Housing Units | % Housing Units |
| Owner Occupied Housing Units | 483 | 60.7% |
| Renter-Occupied Housing Units | 313 | 39.3% |
| Total Occupied Housing Units | 796 | 100.0% |
Occupancy by Household Size in Madison Center
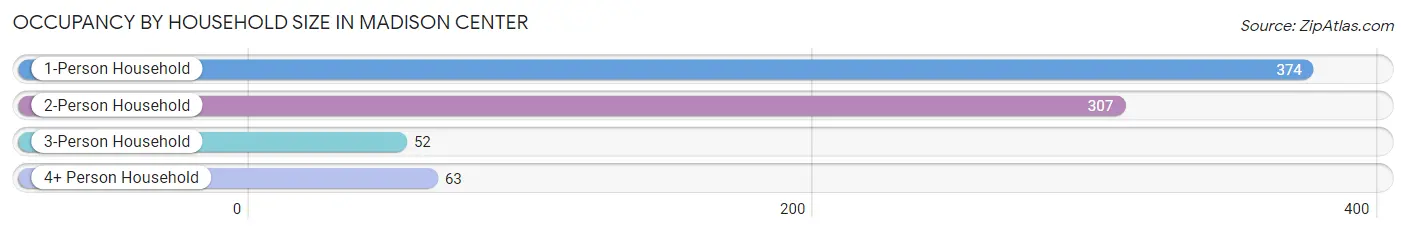
| Household Size | # Housing Units | % Housing Units |
| 1-Person Household | 374 | 47.0% |
| 2-Person Household | 307 | 38.6% |
| 3-Person Household | 52 | 6.5% |
| 4+ Person Household | 63 | 7.9% |
| Total Housing Units | 796 | 100.0% |
Occupancy by Ownership by Household Size in Madison Center
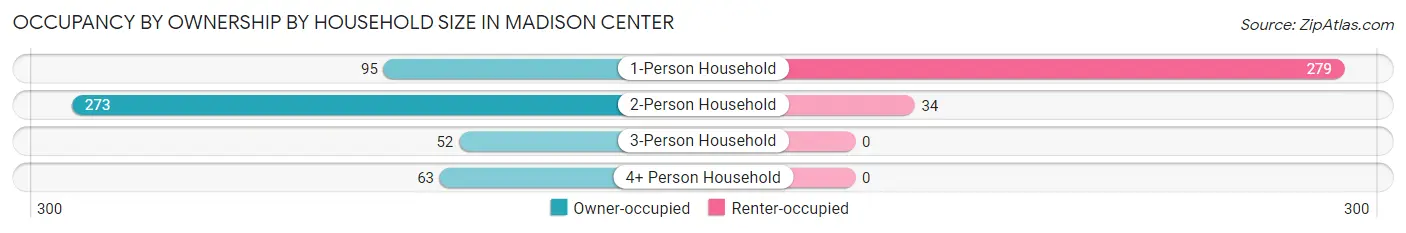
| Household Size | Owner-occupied | Renter-occupied |
| 1-Person Household | 95 (25.4%) | 279 (74.6%) |
| 2-Person Household | 273 (88.9%) | 34 (11.1%) |
| 3-Person Household | 52 (100.0%) | 0 (0.0%) |
| 4+ Person Household | 63 (100.0%) | 0 (0.0%) |
| Total Housing Units | 483 (60.7%) | 313 (39.3%) |
Occupancy by Educational Attainment in Madison Center
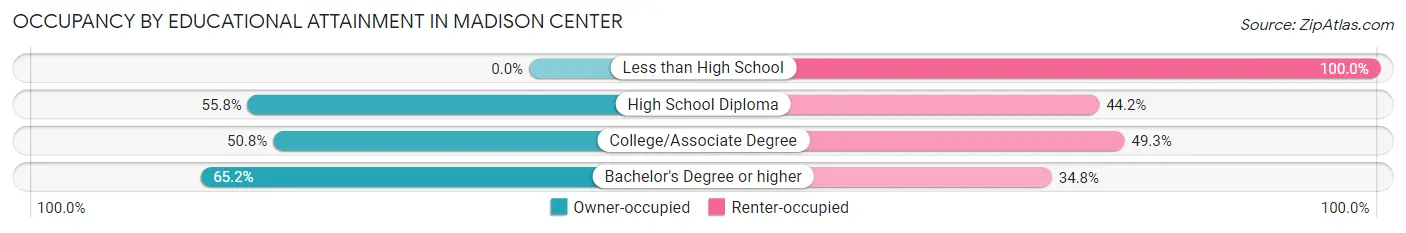
| Household Size | Owner-occupied | Renter-occupied |
| Less than High School | 0 (0.0%) | 4 (100.0%) |
| High School Diploma | 82 (55.8%) | 65 (44.2%) |
| College/Associate Degree | 68 (50.7%) | 66 (49.2%) |
| Bachelor's Degree or higher | 333 (65.2%) | 178 (34.8%) |
Occupancy by Age of Householder in Madison Center
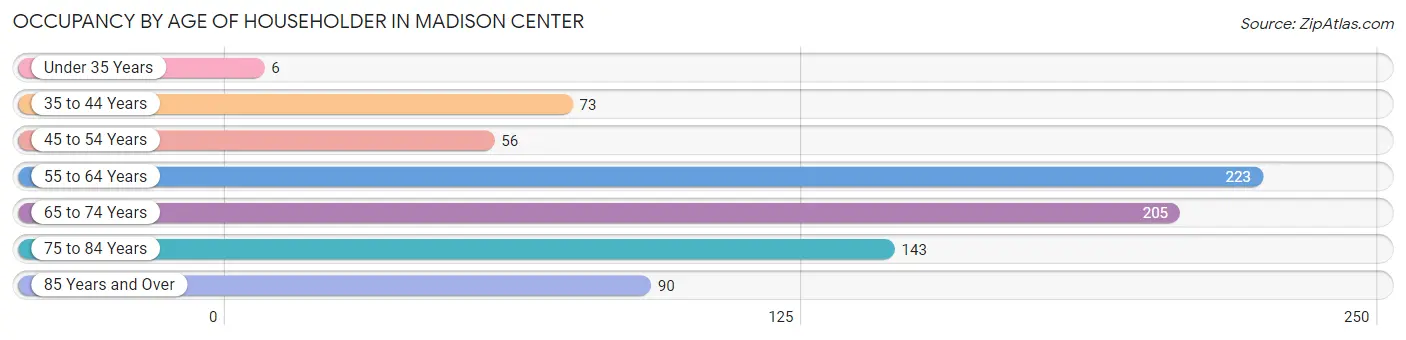
| Age Bracket | # Households | % Households |
| Under 35 Years | 6 | 0.7% |
| 35 to 44 Years | 73 | 9.2% |
| 45 to 54 Years | 56 | 7.0% |
| 55 to 64 Years | 223 | 28.0% |
| 65 to 74 Years | 205 | 25.8% |
| 75 to 84 Years | 143 | 18.0% |
| 85 Years and Over | 90 | 11.3% |
| Total | 796 | 100.0% |
Housing Finances in Madison Center
Median Income by Occupancy in Madison Center
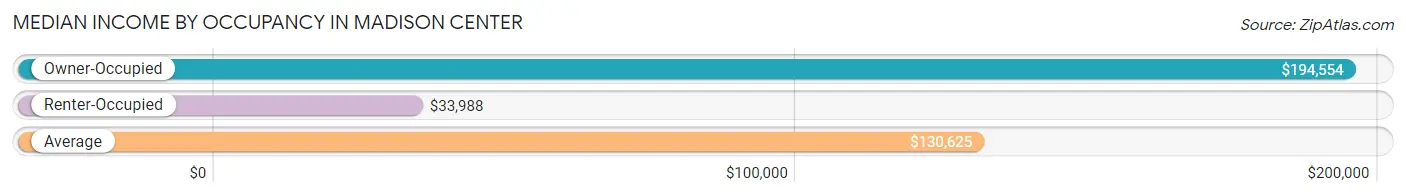
| Occupancy Type | # Households | Median Income |
| Owner-Occupied | 483 (60.7%) | $194,554 |
| Renter-Occupied | 313 (39.3%) | $33,988 |
| Average | 796 (100.0%) | $130,625 |
Occupancy by Householder Income Bracket in Madison Center
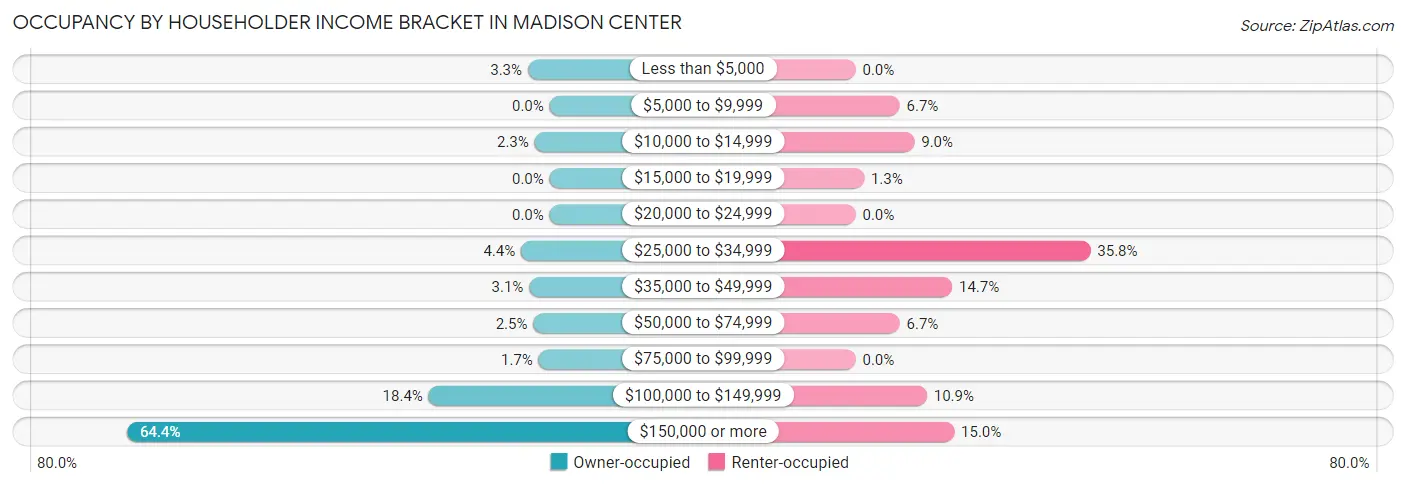
| Income Bracket | Owner-occupied | Renter-occupied |
| Less than $5,000 | 16 (3.3%) | 0 (0.0%) |
| $5,000 to $9,999 | 0 (0.0%) | 21 (6.7%) |
| $10,000 to $14,999 | 11 (2.3%) | 28 (8.9%) |
| $15,000 to $19,999 | 0 (0.0%) | 4 (1.3%) |
| $20,000 to $24,999 | 0 (0.0%) | 0 (0.0%) |
| $25,000 to $34,999 | 21 (4.3%) | 112 (35.8%) |
| $35,000 to $49,999 | 15 (3.1%) | 46 (14.7%) |
| $50,000 to $74,999 | 12 (2.5%) | 21 (6.7%) |
| $75,000 to $99,999 | 8 (1.7%) | 0 (0.0%) |
| $100,000 to $149,999 | 89 (18.4%) | 34 (10.9%) |
| $150,000 or more | 311 (64.4%) | 47 (15.0%) |
| Total | 483 (100.0%) | 313 (100.0%) |
Monthly Housing Cost Tiers in Madison Center
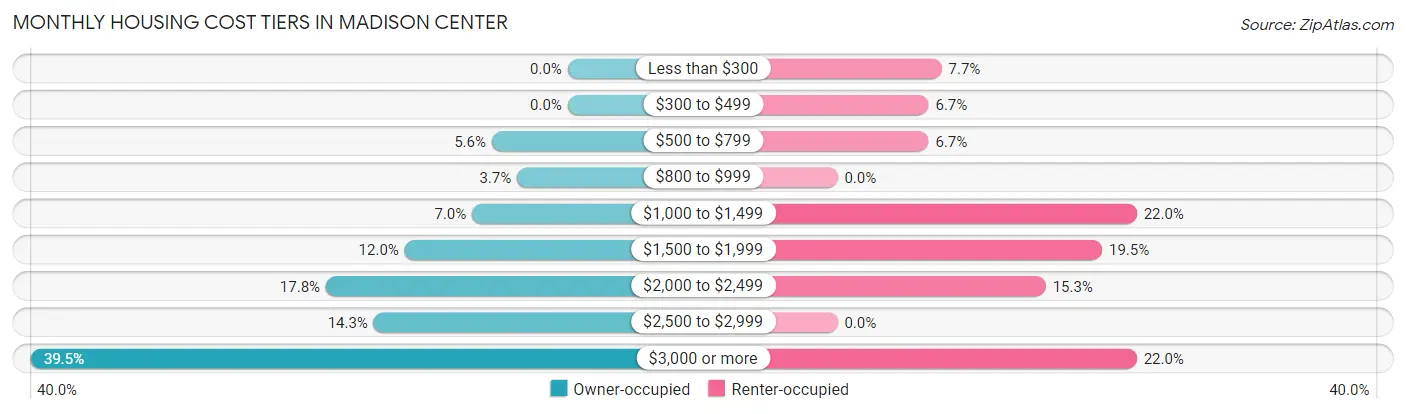
| Monthly Cost | Owner-occupied | Renter-occupied |
| Less than $300 | 0 (0.0%) | 24 (7.7%) |
| $300 to $499 | 0 (0.0%) | 21 (6.7%) |
| $500 to $799 | 27 (5.6%) | 21 (6.7%) |
| $800 to $999 | 18 (3.7%) | 0 (0.0%) |
| $1,000 to $1,499 | 34 (7.0%) | 69 (22.0%) |
| $1,500 to $1,999 | 58 (12.0%) | 61 (19.5%) |
| $2,000 to $2,499 | 86 (17.8%) | 48 (15.3%) |
| $2,500 to $2,999 | 69 (14.3%) | 0 (0.0%) |
| $3,000 or more | 191 (39.5%) | 69 (22.0%) |
| Total | 483 (100.0%) | 313 (100.0%) |
Physical Housing Characteristics in Madison Center
Housing Structures in Madison Center
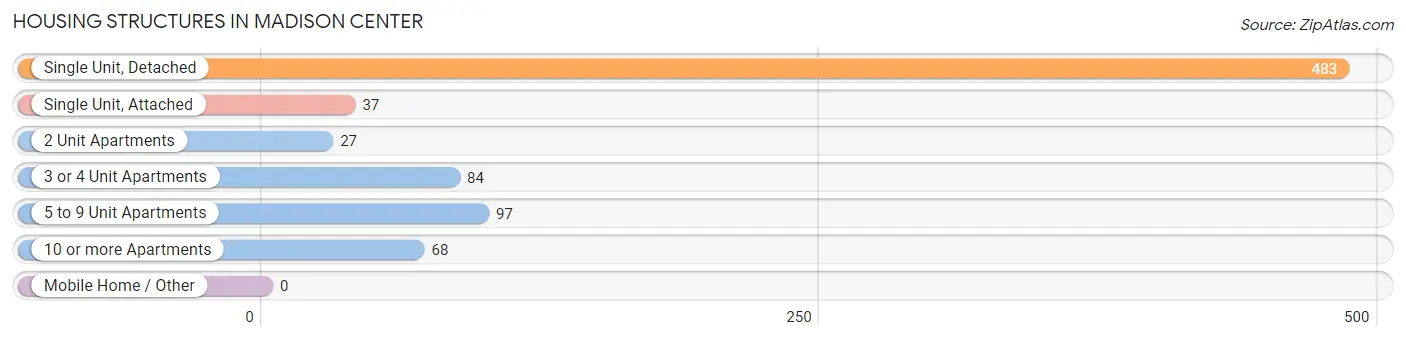
| Structure Type | # Housing Units | % Housing Units |
| Single Unit, Detached | 483 | 60.7% |
| Single Unit, Attached | 37 | 4.6% |
| 2 Unit Apartments | 27 | 3.4% |
| 3 or 4 Unit Apartments | 84 | 10.5% |
| 5 to 9 Unit Apartments | 97 | 12.2% |
| 10 or more Apartments | 68 | 8.5% |
| Mobile Home / Other | 0 | 0.0% |
| Total | 796 | 100.0% |
Housing Structures by Occupancy in Madison Center
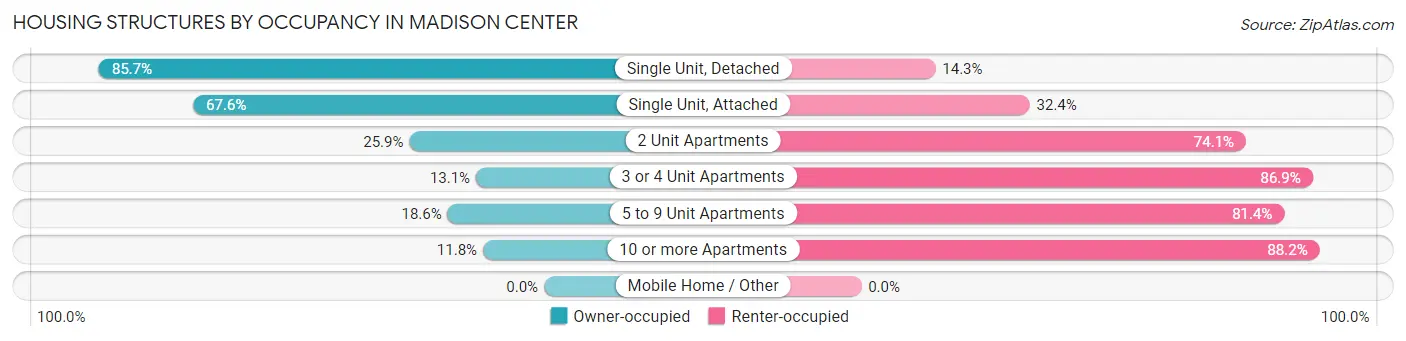
| Structure Type | Owner-occupied | Renter-occupied |
| Single Unit, Detached | 414 (85.7%) | 69 (14.3%) |
| Single Unit, Attached | 25 (67.6%) | 12 (32.4%) |
| 2 Unit Apartments | 7 (25.9%) | 20 (74.1%) |
| 3 or 4 Unit Apartments | 11 (13.1%) | 73 (86.9%) |
| 5 to 9 Unit Apartments | 18 (18.6%) | 79 (81.4%) |
| 10 or more Apartments | 8 (11.8%) | 60 (88.2%) |
| Mobile Home / Other | 0 (0.0%) | 0 (0.0%) |
| Total | 483 (60.7%) | 313 (39.3%) |
Housing Structures by Number of Rooms in Madison Center
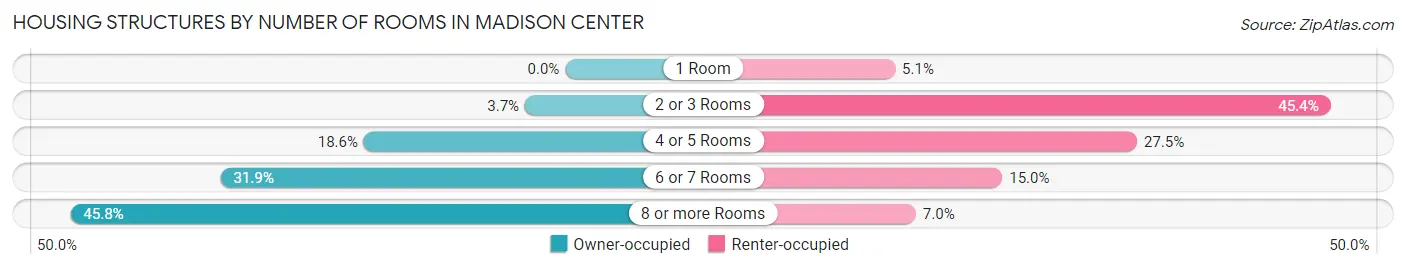
| Number of Rooms | Owner-occupied | Renter-occupied |
| 1 Room | 0 (0.0%) | 16 (5.1%) |
| 2 or 3 Rooms | 18 (3.7%) | 142 (45.4%) |
| 4 or 5 Rooms | 90 (18.6%) | 86 (27.5%) |
| 6 or 7 Rooms | 154 (31.9%) | 47 (15.0%) |
| 8 or more Rooms | 221 (45.8%) | 22 (7.0%) |
| Total | 483 (100.0%) | 313 (100.0%) |
Housing Structure by Heating Type in Madison Center
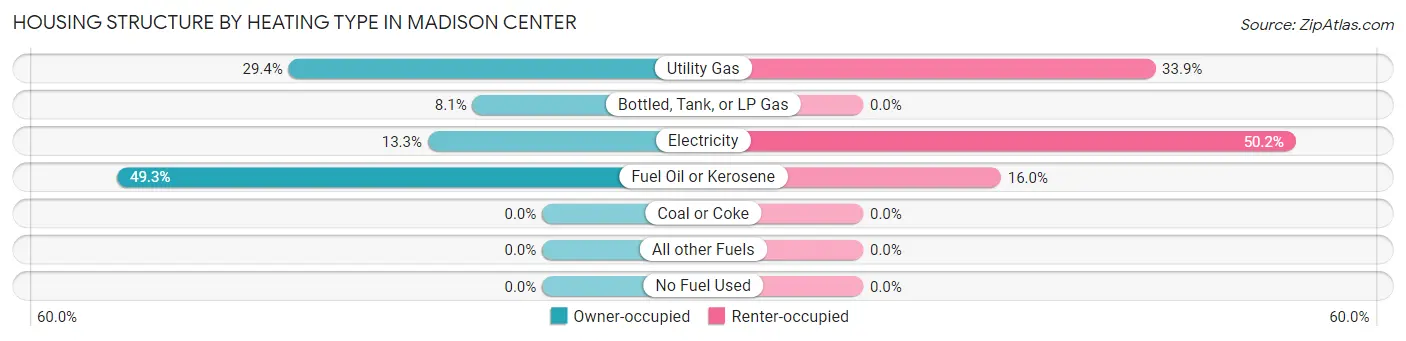
| Heating Type | Owner-occupied | Renter-occupied |
| Utility Gas | 142 (29.4%) | 106 (33.9%) |
| Bottled, Tank, or LP Gas | 39 (8.1%) | 0 (0.0%) |
| Electricity | 64 (13.3%) | 157 (50.2%) |
| Fuel Oil or Kerosene | 238 (49.3%) | 50 (16.0%) |
| Coal or Coke | 0 (0.0%) | 0 (0.0%) |
| All other Fuels | 0 (0.0%) | 0 (0.0%) |
| No Fuel Used | 0 (0.0%) | 0 (0.0%) |
| Total | 483 (100.0%) | 313 (100.0%) |
Household Vehicle Usage in Madison Center
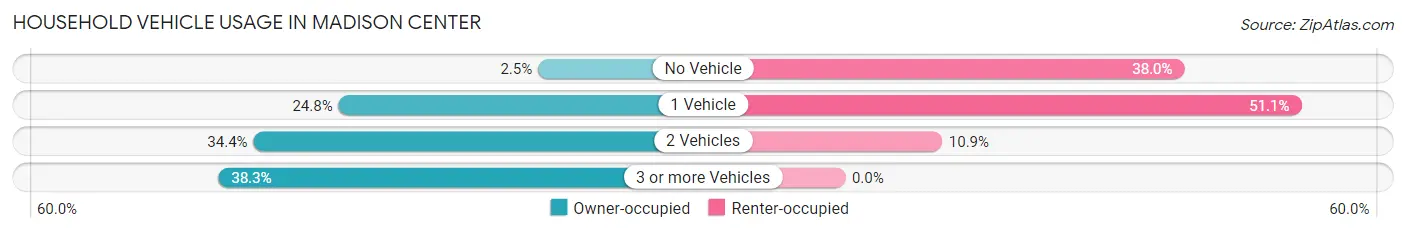
| Vehicles per Household | Owner-occupied | Renter-occupied |
| No Vehicle | 12 (2.5%) | 119 (38.0%) |
| 1 Vehicle | 120 (24.8%) | 160 (51.1%) |
| 2 Vehicles | 166 (34.4%) | 34 (10.9%) |
| 3 or more Vehicles | 185 (38.3%) | 0 (0.0%) |
| Total | 483 (100.0%) | 313 (100.0%) |
Real Estate & Mortgages in Madison Center
Real Estate and Mortgage Overview in Madison Center
| Characteristic | Without Mortgage | With Mortgage |
| Housing Units | 147 | 336 |
| Median Property Value | $607,600 | $654,000 |
| Median Household Income | $155,089 | $237 |
| Monthly Housing Costs | $1,501 | $166 |
| Real Estate Taxes | $10,001 | $0 |
Property Value by Mortgage Status in Madison Center
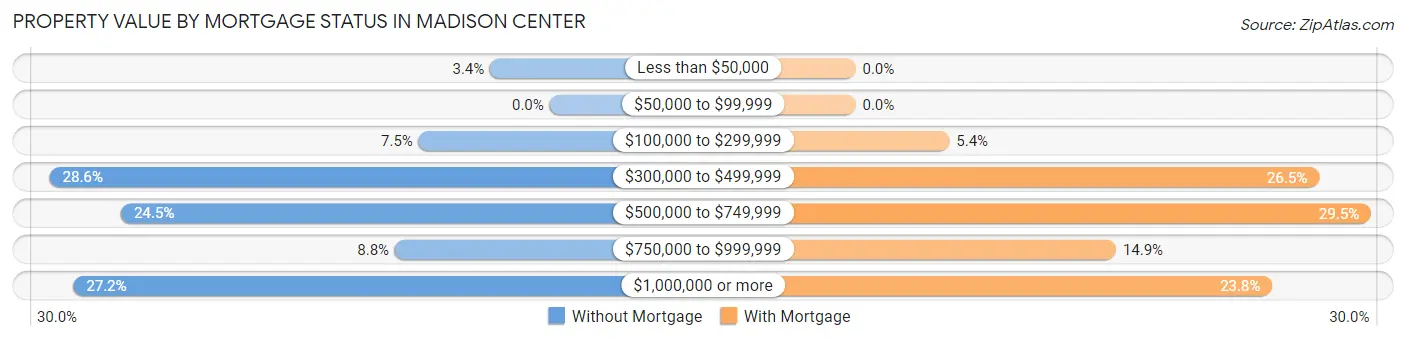
| Property Value | Without Mortgage | With Mortgage |
| Less than $50,000 | 5 (3.4%) | 0 (0.0%) |
| $50,000 to $99,999 | 0 (0.0%) | 0 (0.0%) |
| $100,000 to $299,999 | 11 (7.5%) | 18 (5.4%) |
| $300,000 to $499,999 | 42 (28.6%) | 89 (26.5%) |
| $500,000 to $749,999 | 36 (24.5%) | 99 (29.5%) |
| $750,000 to $999,999 | 13 (8.8%) | 50 (14.9%) |
| $1,000,000 or more | 40 (27.2%) | 80 (23.8%) |
| Total | 147 (100.0%) | 336 (100.0%) |
Household Income by Mortgage Status in Madison Center
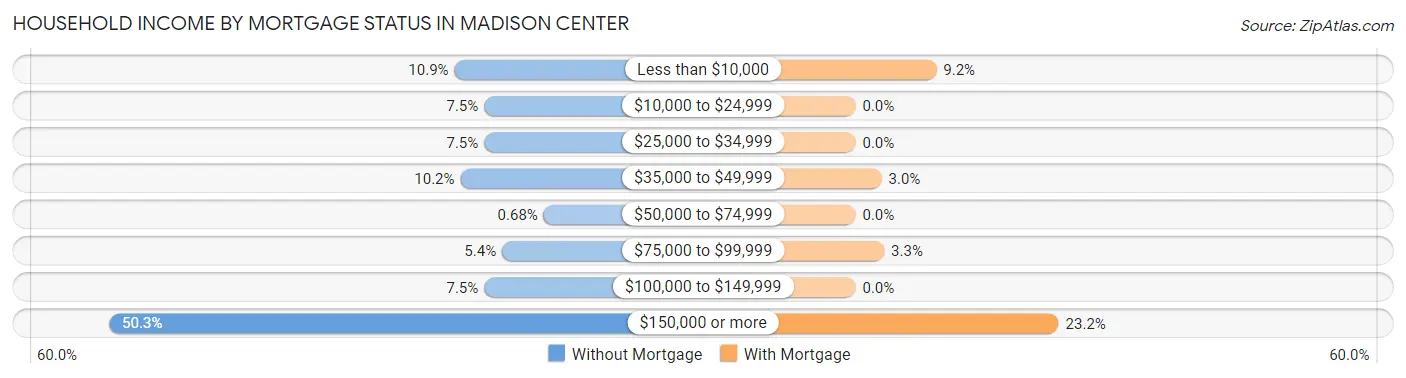
| Household Income | Without Mortgage | With Mortgage |
| Less than $10,000 | 16 (10.9%) | 31 (9.2%) |
| $10,000 to $24,999 | 11 (7.5%) | 0 (0.0%) |
| $25,000 to $34,999 | 11 (7.5%) | 0 (0.0%) |
| $35,000 to $49,999 | 15 (10.2%) | 10 (3.0%) |
| $50,000 to $74,999 | 1 (0.7%) | 0 (0.0%) |
| $75,000 to $99,999 | 8 (5.4%) | 11 (3.3%) |
| $100,000 to $149,999 | 11 (7.5%) | 0 (0.0%) |
| $150,000 or more | 74 (50.3%) | 78 (23.2%) |
| Total | 147 (100.0%) | 336 (100.0%) |
Property Value to Household Income Ratio in Madison Center
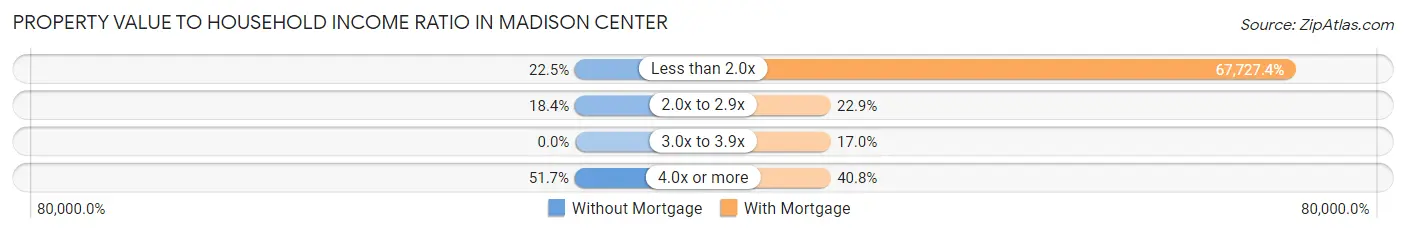
| Value-to-Income Ratio | Without Mortgage | With Mortgage |
| Less than 2.0x | 33 (22.5%) | 227,564 (67,727.4%) |
| 2.0x to 2.9x | 27 (18.4%) | 77 (22.9%) |
| 3.0x to 3.9x | 0 (0.0%) | 57 (17.0%) |
| 4.0x or more | 76 (51.7%) | 137 (40.8%) |
| Total | 147 (100.0%) | 336 (100.0%) |
Real Estate Taxes by Mortgage Status in Madison Center
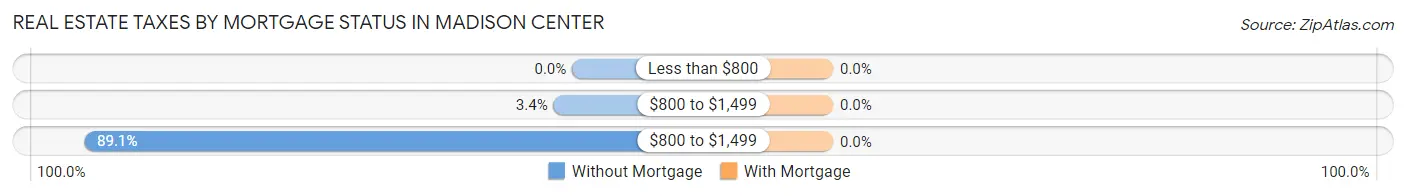
| Property Taxes | Without Mortgage | With Mortgage |
| Less than $800 | 0 (0.0%) | 0 (0.0%) |
| $800 to $1,499 | 5 (3.4%) | 0 (0.0%) |
| $800 to $1,499 | 131 (89.1%) | 0 (0.0%) |
| Total | 147 (100.0%) | 336 (100.0%) |
Health & Disability in Madison Center
Health Insurance Coverage by Age in Madison Center
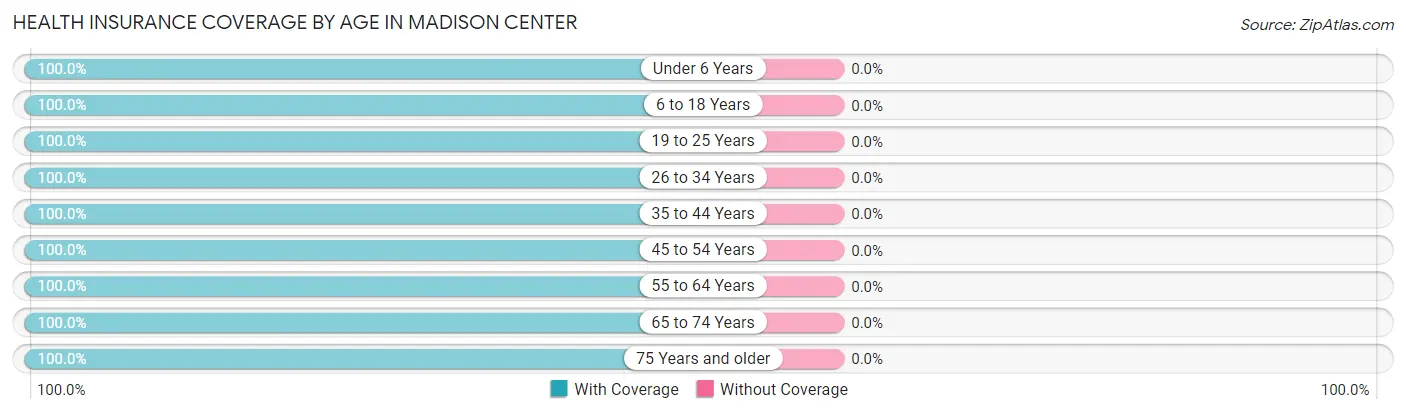
| Age Bracket | With Coverage | Without Coverage |
| Under 6 Years | 13 (100.0%) | 0 (0.0%) |
| 6 to 18 Years | 157 (100.0%) | 0 (0.0%) |
| 19 to 25 Years | 46 (100.0%) | 0 (0.0%) |
| 26 to 34 Years | 49 (100.0%) | 0 (0.0%) |
| 35 to 44 Years | 105 (100.0%) | 0 (0.0%) |
| 45 to 54 Years | 141 (100.0%) | 0 (0.0%) |
| 55 to 64 Years | 433 (100.0%) | 0 (0.0%) |
| 65 to 74 Years | 303 (100.0%) | 0 (0.0%) |
| 75 Years and older | 283 (100.0%) | 0 (0.0%) |
| Total | 1,530 (100.0%) | 0 (0.0%) |
Health Insurance Coverage by Citizenship Status in Madison Center
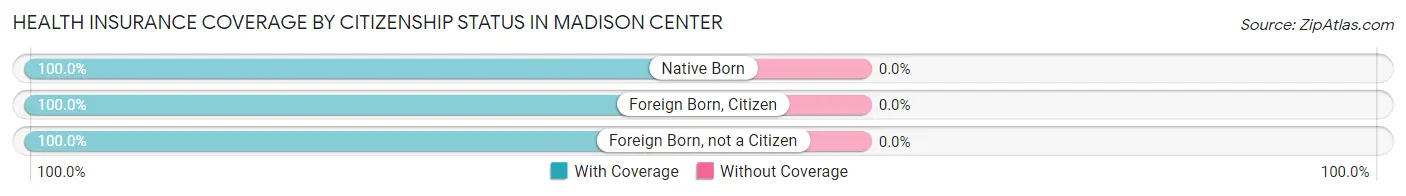
| Citizenship Status | With Coverage | Without Coverage |
| Native Born | 13 (100.0%) | 0 (0.0%) |
| Foreign Born, Citizen | 157 (100.0%) | 0 (0.0%) |
| Foreign Born, not a Citizen | 46 (100.0%) | 0 (0.0%) |
Health Insurance Coverage by Household Income in Madison Center
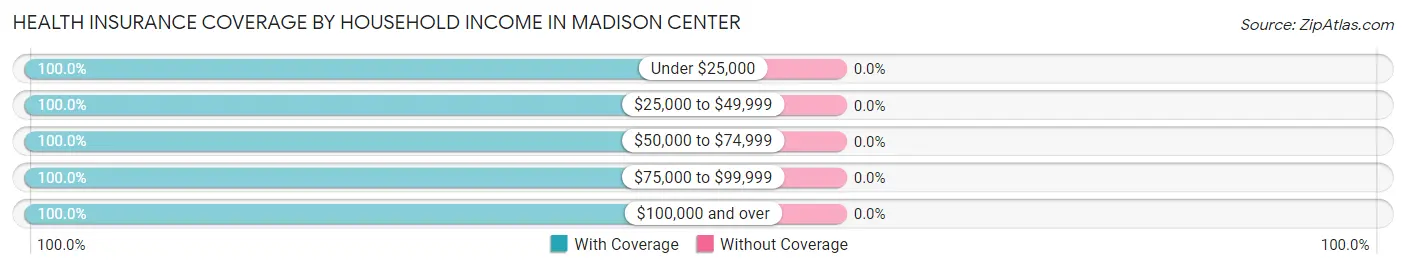
| Household Income | With Coverage | Without Coverage |
| Under $25,000 | 80 (100.0%) | 0 (0.0%) |
| $25,000 to $49,999 | 209 (100.0%) | 0 (0.0%) |
| $50,000 to $74,999 | 46 (100.0%) | 0 (0.0%) |
| $75,000 to $99,999 | 15 (100.0%) | 0 (0.0%) |
| $100,000 and over | 1,126 (100.0%) | 0 (0.0%) |
Public vs Private Health Insurance Coverage by Age in Madison Center
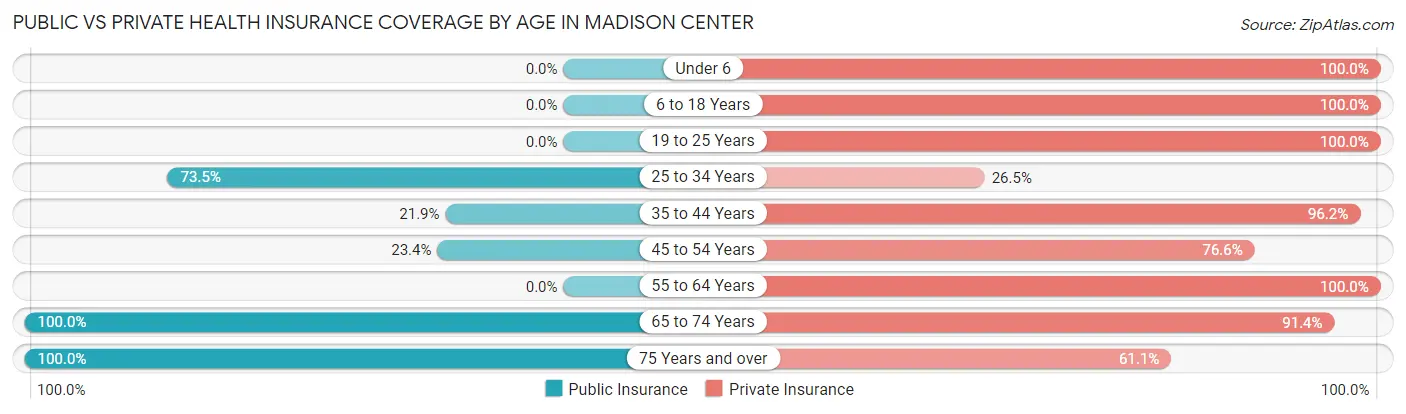
| Age Bracket | Public Insurance | Private Insurance |
| Under 6 | 0 (0.0%) | 13 (100.0%) |
| 6 to 18 Years | 0 (0.0%) | 157 (100.0%) |
| 19 to 25 Years | 0 (0.0%) | 46 (100.0%) |
| 25 to 34 Years | 36 (73.5%) | 13 (26.5%) |
| 35 to 44 Years | 23 (21.9%) | 101 (96.2%) |
| 45 to 54 Years | 33 (23.4%) | 108 (76.6%) |
| 55 to 64 Years | 0 (0.0%) | 433 (100.0%) |
| 65 to 74 Years | 303 (100.0%) | 277 (91.4%) |
| 75 Years and over | 283 (100.0%) | 173 (61.1%) |
| Total | 678 (44.3%) | 1,321 (86.3%) |
Disability Status by Sex by Age in Madison Center
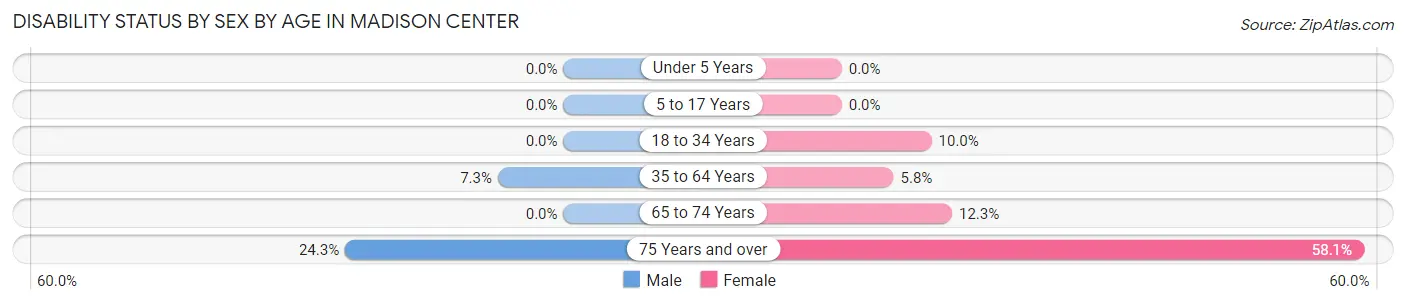
| Age Bracket | Male | Female |
| Under 5 Years | 0 (0.0%) | 0 (0.0%) |
| 5 to 17 Years | 0 (0.0%) | 0 (0.0%) |
| 18 to 34 Years | 0 (0.0%) | 6 (10.0%) |
| 35 to 64 Years | 23 (7.3%) | 21 (5.8%) |
| 65 to 74 Years | 0 (0.0%) | 21 (12.3%) |
| 75 Years and over | 27 (24.3%) | 100 (58.1%) |
Disability Class by Sex by Age in Madison Center
Disability Class: Hearing Difficulty
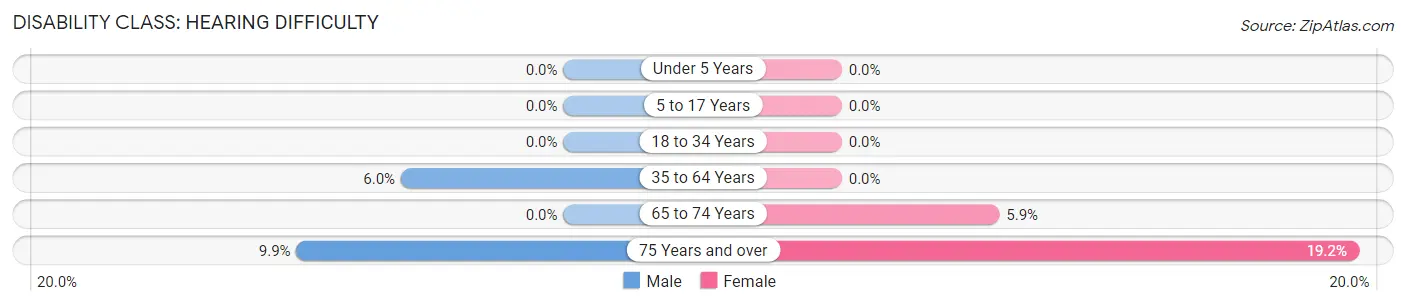
| Age Bracket | Male | Female |
| Under 5 Years | 0 (0.0%) | 0 (0.0%) |
| 5 to 17 Years | 0 (0.0%) | 0 (0.0%) |
| 18 to 34 Years | 0 (0.0%) | 0 (0.0%) |
| 35 to 64 Years | 19 (6.0%) | 0 (0.0%) |
| 65 to 74 Years | 0 (0.0%) | 10 (5.9%) |
| 75 Years and over | 11 (9.9%) | 33 (19.2%) |
Disability Class: Vision Difficulty
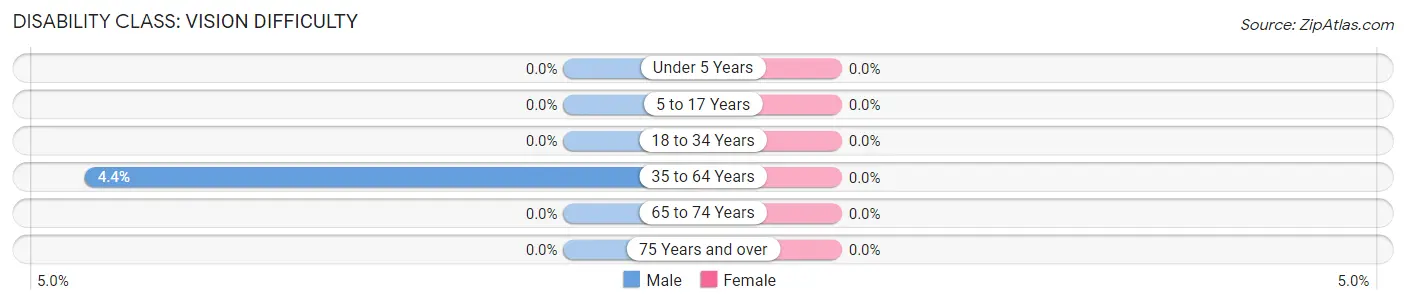
| Age Bracket | Male | Female |
| Under 5 Years | 0 (0.0%) | 0 (0.0%) |
| 5 to 17 Years | 0 (0.0%) | 0 (0.0%) |
| 18 to 34 Years | 0 (0.0%) | 0 (0.0%) |
| 35 to 64 Years | 14 (4.4%) | 0 (0.0%) |
| 65 to 74 Years | 0 (0.0%) | 0 (0.0%) |
| 75 Years and over | 0 (0.0%) | 0 (0.0%) |
Disability Class: Cognitive Difficulty
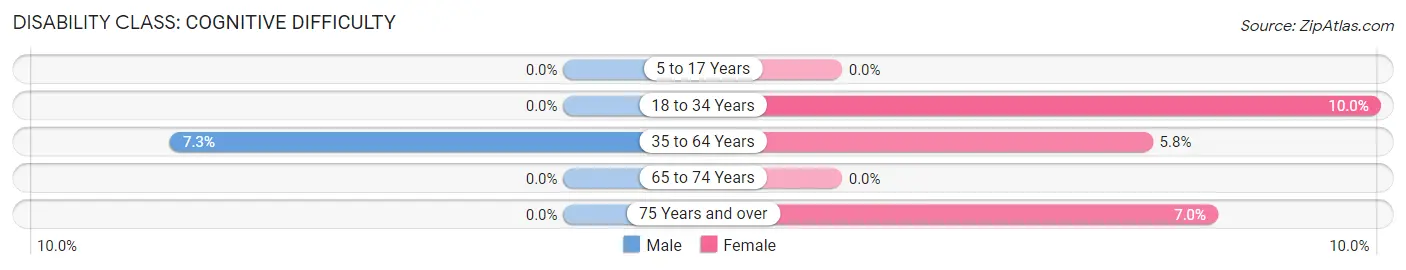
| Age Bracket | Male | Female |
| 5 to 17 Years | 0 (0.0%) | 0 (0.0%) |
| 18 to 34 Years | 0 (0.0%) | 6 (10.0%) |
| 35 to 64 Years | 23 (7.3%) | 21 (5.8%) |
| 65 to 74 Years | 0 (0.0%) | 0 (0.0%) |
| 75 Years and over | 0 (0.0%) | 12 (7.0%) |
Disability Class: Ambulatory Difficulty
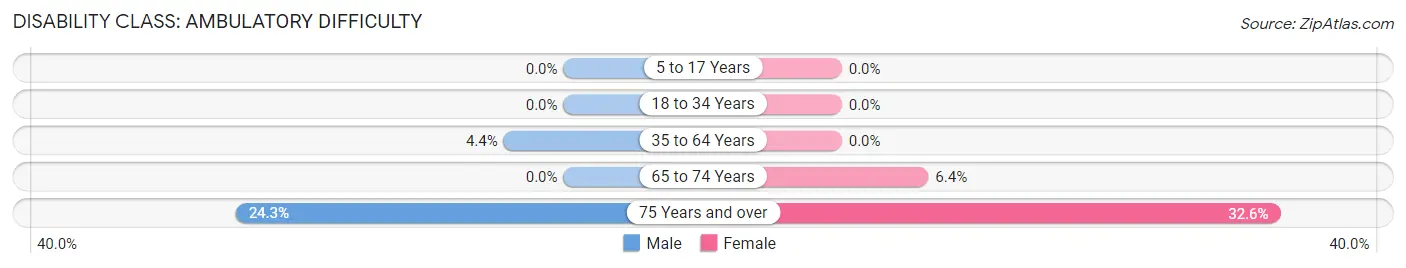
| Age Bracket | Male | Female |
| 5 to 17 Years | 0 (0.0%) | 0 (0.0%) |
| 18 to 34 Years | 0 (0.0%) | 0 (0.0%) |
| 35 to 64 Years | 14 (4.4%) | 0 (0.0%) |
| 65 to 74 Years | 0 (0.0%) | 11 (6.4%) |
| 75 Years and over | 27 (24.3%) | 56 (32.6%) |
Disability Class: Self-Care Difficulty
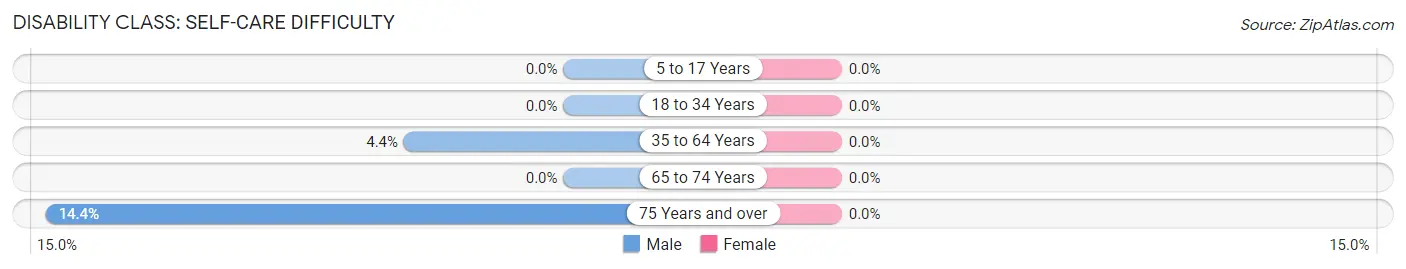
| Age Bracket | Male | Female |
| 5 to 17 Years | 0 (0.0%) | 0 (0.0%) |
| 18 to 34 Years | 0 (0.0%) | 0 (0.0%) |
| 35 to 64 Years | 14 (4.4%) | 0 (0.0%) |
| 65 to 74 Years | 0 (0.0%) | 0 (0.0%) |
| 75 Years and over | 16 (14.4%) | 0 (0.0%) |
Technology Access in Madison Center
Computing Device Access in Madison Center
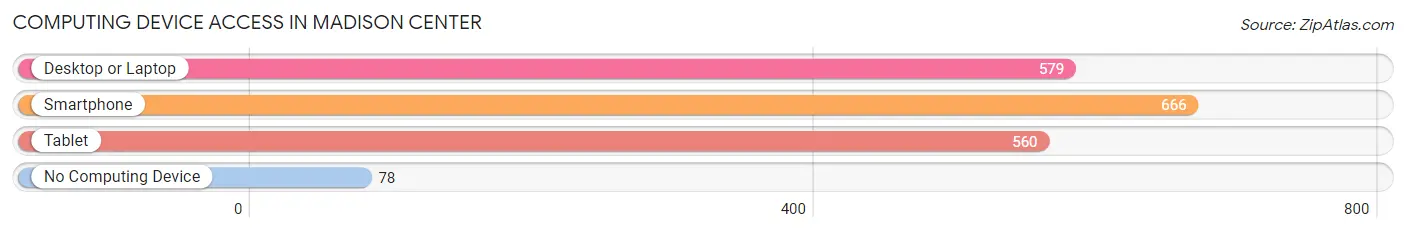
| Device Type | # Households | % Households |
| Desktop or Laptop | 579 | 72.7% |
| Smartphone | 666 | 83.7% |
| Tablet | 560 | 70.4% |
| No Computing Device | 78 | 9.8% |
| Total | 796 | 100.0% |
Internet Access in Madison Center
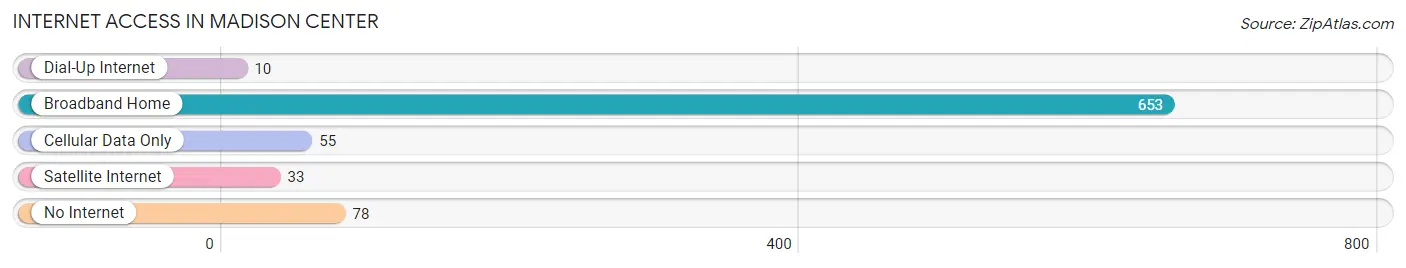
| Internet Type | # Households | % Households |
| Dial-Up Internet | 10 | 1.3% |
| Broadband Home | 653 | 82.0% |
| Cellular Data Only | 55 | 6.9% |
| Satellite Internet | 33 | 4.2% |
| No Internet | 78 | 9.8% |
| Total | 796 | 100.0% |
Madison Center Summary
History
The town of Madison, Connecticut is located in the southeastern corner of the state, and is part of the New Haven metropolitan area. The town was first settled in 1641, and was originally part of the town of Guilford. In 1786, the town was incorporated as Madison, and was named after President James Madison.
The town of Madison has a long and rich history, and has been home to many notable figures throughout its history. The town was home to the first governor of Connecticut, Thomas Fitch, and was also the birthplace of the first African-American to graduate from Yale University, Edward Bouchet.
The town of Madison has also been home to many notable businesses throughout its history. The first paper mill in the United States was established in Madison in 1790, and the first cotton mill in the state was established in Madison in 1810. The town was also home to the first commercial oyster farm in the United States, which was established in 1868.
Geography
Madison is located in the southeastern corner of Connecticut, and is part of the New Haven metropolitan area. The town is bordered by the towns of Guilford to the north, Killingworth to the east, Clinton to the south, and Durham to the west.
The town of Madison is located on the Long Island Sound, and is home to several beaches, including Hammonasset Beach State Park, which is the largest beach in Connecticut. The town is also home to several parks, including the Madison Town Beach, which is located on the Long Island Sound.
The town of Madison is located in a region of Connecticut known as the "Gold Coast," which is known for its affluent communities and beautiful coastline. The town is also home to several historic sites, including the Madison Historical Society, which is located in the town center.
Economy
The town of Madison has a strong and diverse economy, which is largely driven by the tourism industry. The town is home to several popular tourist attractions, including Hammonasset Beach State Park, which is the largest beach in Connecticut. The town is also home to several historic sites, including the Madison Historical Society, which is located in the town center.
The town of Madison is also home to several large employers, including the Madison Square Garden Company, which is the parent company of the New York Knicks and the New York Rangers. The town is also home to several large pharmaceutical companies, including Pfizer and Merck.
Demographics
As of the 2010 census, the town of Madison had a population of 18,269. The population is largely white (90.2%), with a small percentage of African-American (3.2%), Asian (2.7%), and Hispanic (2.2%) residents. The median household income in the town is $90,945, and the median home value is $400,000.
The town of Madison is served by the Madison Public Schools, which consists of four elementary schools, one middle school, and one high school. The town is also home to several private schools, including the Foote School and the Hopkins School.
Conclusion
The town of Madison, Connecticut is a vibrant and diverse community with a long and rich history. The town is home to several popular tourist attractions, including Hammonasset Beach State Park, and is also home to several large employers, including the Madison Square Garden Company. The town is served by the Madison Public Schools, and is home to several private schools. The town has a strong and diverse economy, and has a population that is largely white.
Common Questions
What is Per Capita Income in Madison Center?
Per Capita income in Madison Center is $108,406.
What is the Median Family Income in Madison Center?
Median Family Income in Madison Center is $209,962.
What is the Median Household income in Madison Center?
Median Household Income in Madison Center is $130,625.
What is Inequality or Gini Index in Madison Center?
Inequality or Gini Index in Madison Center is 0.55.
What is the Total Population of Madison Center?
Total Population of Madison Center is 1,536.
What is the Total Male Population of Madison Center?
Total Male Population of Madison Center is 704.
What is the Total Female Population of Madison Center?
Total Female Population of Madison Center is 832.
What is the Ratio of Males per 100 Females in Madison Center?
There are 84.62 Males per 100 Females in Madison Center.
What is the Ratio of Females per 100 Males in Madison Center?
There are 118.18 Females per 100 Males in Madison Center.
What is the Median Population Age in Madison Center?
Median Population Age in Madison Center is 61.8 Years.
What is the Average Family Size in Madison Center
Average Family Size in Madison Center is 2.6 People.
What is the Average Household Size in Madison Center
Average Household Size in Madison Center is 1.9 People.
How Large is the Labor Force in Madison Center?
There are 843 People in the Labor Forcein in Madison Center.
What is the Percentage of People in the Labor Force in Madison Center?
57.7% of People are in the Labor Force in Madison Center.
What is the Unemployment Rate in Madison Center?
Unemployment Rate in Madison Center is 2.7%.