Fenwick borough, CT Map & Demographics
Fenwick borough Overview
$233,490
PER CAPITA INCOME
$194,375
AVG FAMILY INCOME
$167,500
AVG HOUSEHOLD INCOME
0.58
INEQUALITY / GINI INDEX
40
TOTAL POPULATION
18
MALE POPULATION
22
FEMALE POPULATION
81.82
MALES / 100 FEMALES
122.22
FEMALES / 100 MALES
73.3
MEDIAN AGE
1.8
AVG FAMILY SIZE
1.7
AVG HOUSEHOLD SIZE
17
LABOR FORCE [ PEOPLE ]
42.5%
PERCENT IN LABOR FORCE
Income in Fenwick borough
Income Overview in Fenwick borough
Per Capita Income in Fenwick borough is $233,490, while median incomes of families and households are $194,375 and $167,500 respectively.
| Characteristic | Number | Measure |
| Per Capita Income | 40 | $233,490 |
| Median Family Income | 17 | $194,375 |
| Mean Family Income | 17 | $485,794 |
| Median Household Income | 24 | $167,500 |
| Mean Household Income | 24 | $423,225 |
| Income Deficit | 17 | $0 |
| Wage / Income Gap (%) | 40 | 0.00% |
| Wage / Income Gap ($) | 40 | 100.00¢ per $1 |
| Gini / Inequality Index | 40 | 0.58 |
Earnings by Sex in Fenwick borough
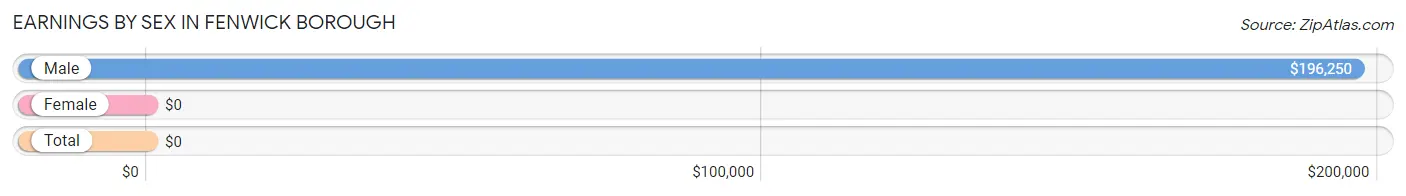
| Sex | Number | Average Earnings |
| Male | 11 (64.7%) | $196,250 |
| Female | 6 (35.3%) | $0 |
| Total | 17 (100.0%) | $0 |
Earnings by Sex by Income Bracket in Fenwick borough
The most common earnings brackets in Fenwick borough are $100,000+ for men (7 | 63.6%) and $100,000+ for women (3 | 50.0%).
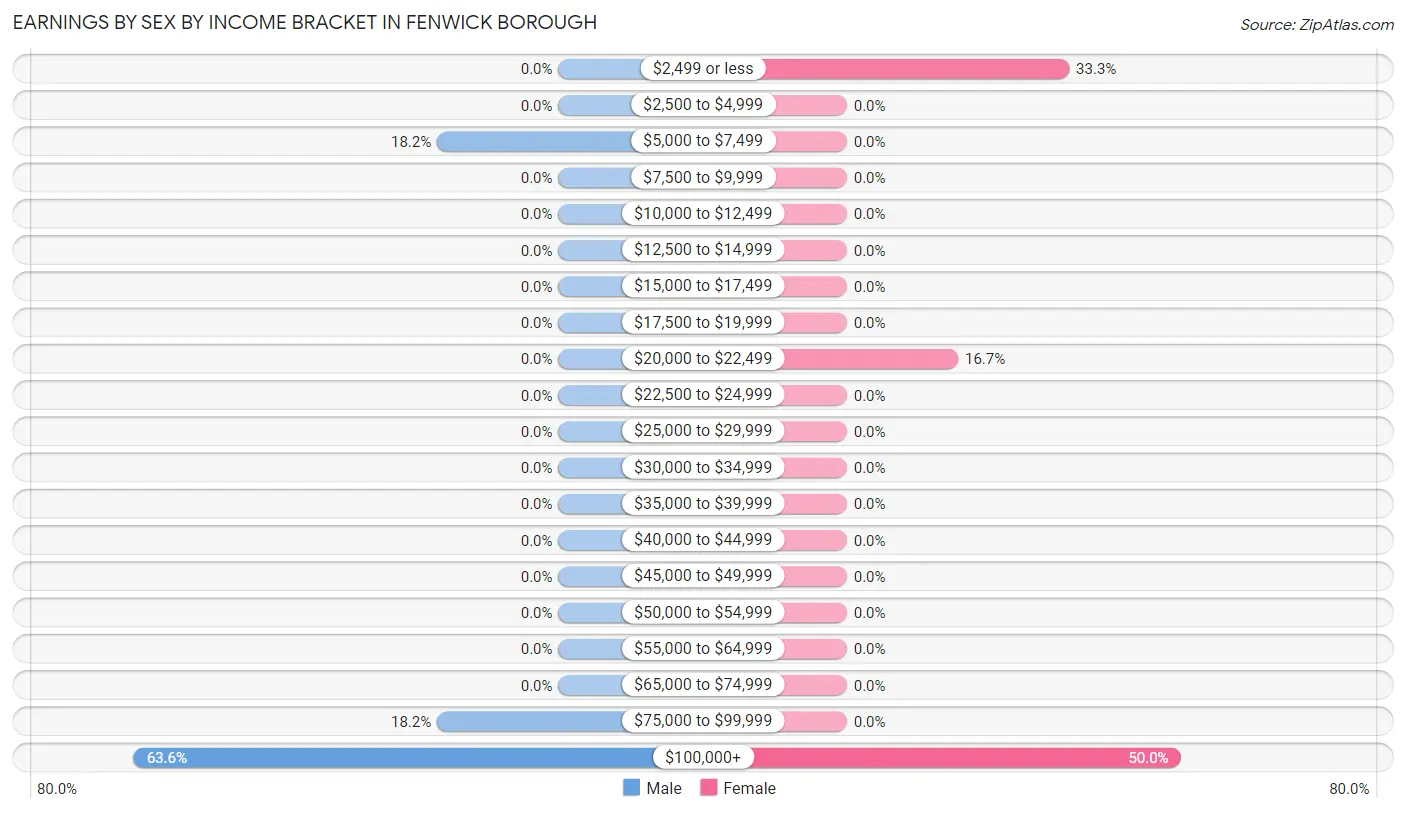
| Income | Male | Female |
| $2,499 or less | 0 (0.0%) | 2 (33.3%) |
| $2,500 to $4,999 | 0 (0.0%) | 0 (0.0%) |
| $5,000 to $7,499 | 2 (18.2%) | 0 (0.0%) |
| $7,500 to $9,999 | 0 (0.0%) | 0 (0.0%) |
| $10,000 to $12,499 | 0 (0.0%) | 0 (0.0%) |
| $12,500 to $14,999 | 0 (0.0%) | 0 (0.0%) |
| $15,000 to $17,499 | 0 (0.0%) | 0 (0.0%) |
| $17,500 to $19,999 | 0 (0.0%) | 0 (0.0%) |
| $20,000 to $22,499 | 0 (0.0%) | 1 (16.7%) |
| $22,500 to $24,999 | 0 (0.0%) | 0 (0.0%) |
| $25,000 to $29,999 | 0 (0.0%) | 0 (0.0%) |
| $30,000 to $34,999 | 0 (0.0%) | 0 (0.0%) |
| $35,000 to $39,999 | 0 (0.0%) | 0 (0.0%) |
| $40,000 to $44,999 | 0 (0.0%) | 0 (0.0%) |
| $45,000 to $49,999 | 0 (0.0%) | 0 (0.0%) |
| $50,000 to $54,999 | 0 (0.0%) | 0 (0.0%) |
| $55,000 to $64,999 | 0 (0.0%) | 0 (0.0%) |
| $65,000 to $74,999 | 0 (0.0%) | 0 (0.0%) |
| $75,000 to $99,999 | 2 (18.2%) | 0 (0.0%) |
| $100,000+ | 7 (63.6%) | 3 (50.0%) |
| Total | 11 (100.0%) | 6 (100.0%) |
Earnings by Sex by Educational Attainment in Fenwick borough
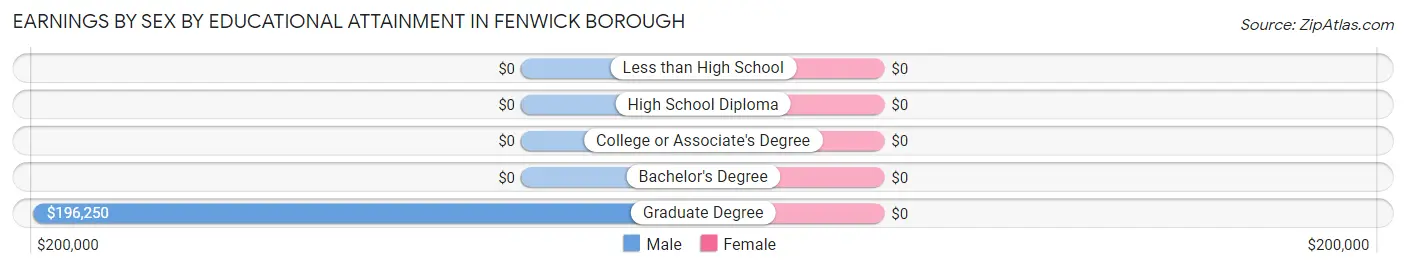
| Educational Attainment | Male Income | Female Income |
| Less than High School | - | - |
| High School Diploma | - | - |
| College or Associate's Degree | - | - |
| Bachelor's Degree | - | - |
| Graduate Degree | $196,250 | $0 |
| Total | $196,250 | $0 |
Family Income in Fenwick borough
Family Income Brackets in Fenwick borough
According to the Fenwick borough family income data, there are 8 families falling into the $200,000+ income range, which is the most common income bracket and makes up 47.1% of all families.
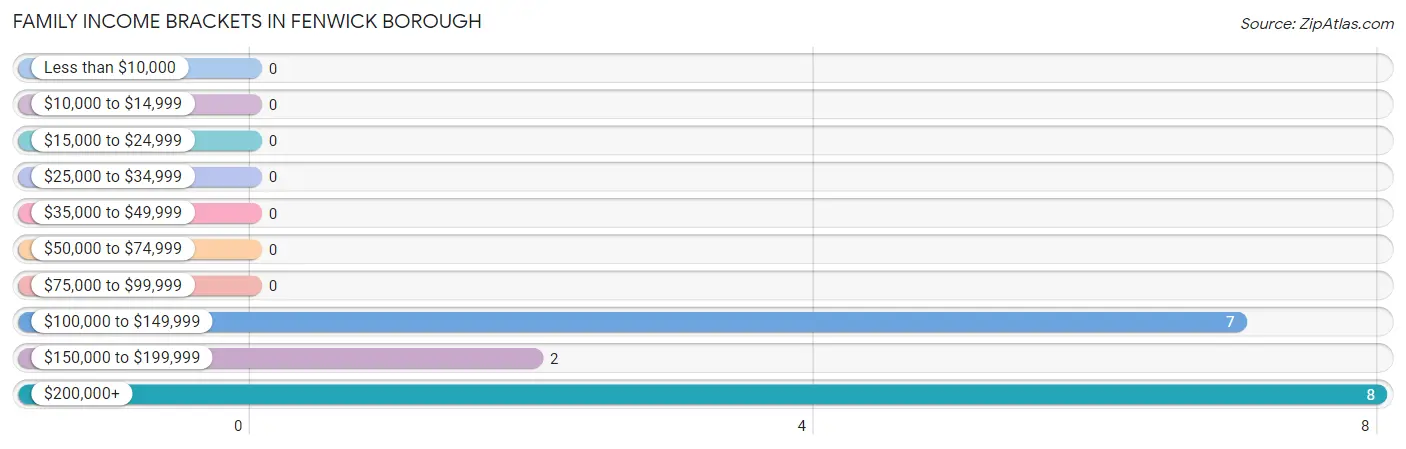
| Income Bracket | # Families | % Families |
| Less than $10,000 | 0 | 0.0% |
| $10,000 to $14,999 | 0 | 0.0% |
| $15,000 to $24,999 | 0 | 0.0% |
| $25,000 to $34,999 | 0 | 0.0% |
| $35,000 to $49,999 | 0 | 0.0% |
| $50,000 to $74,999 | 0 | 0.0% |
| $75,000 to $99,999 | 0 | 0.0% |
| $100,000 to $149,999 | 7 | 41.2% |
| $150,000 to $199,999 | 2 | 11.8% |
| $200,000+ | 8 | 47.1% |
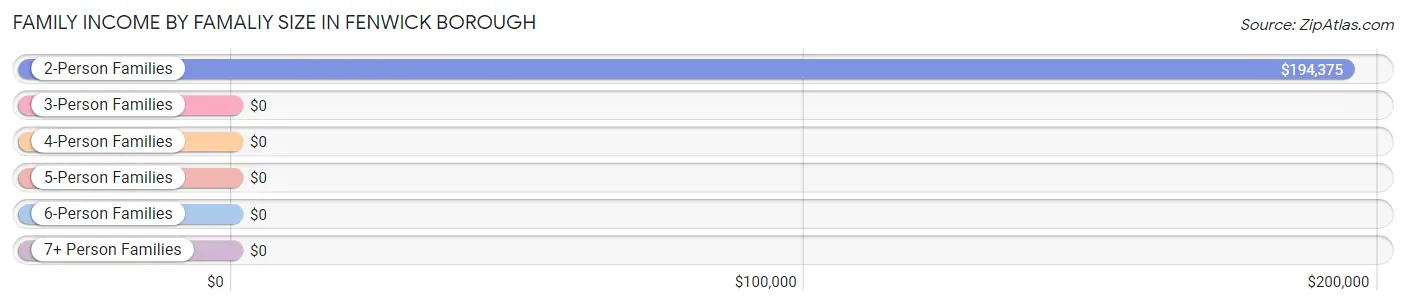
Family Income by Famaliy Size in Fenwick borough
2-person families (17 | 100.0%) account for the highest median family income in Fenwick borough with $194,375 per family, while 2-person families (17 | 100.0%) have the highest median income of $97,188 per family member.
| Income Bracket | # Families | Median Income |
| 2-Person Families | 17 (100.0%) | $194,375 |
| 3-Person Families | 0 (0.0%) | $0 |
| 4-Person Families | 0 (0.0%) | $0 |
| 5-Person Families | 0 (0.0%) | $0 |
| 6-Person Families | 0 (0.0%) | $0 |
| 7+ Person Families | 0 (0.0%) | $0 |
| Total | 17 (100.0%) | $194,375 |
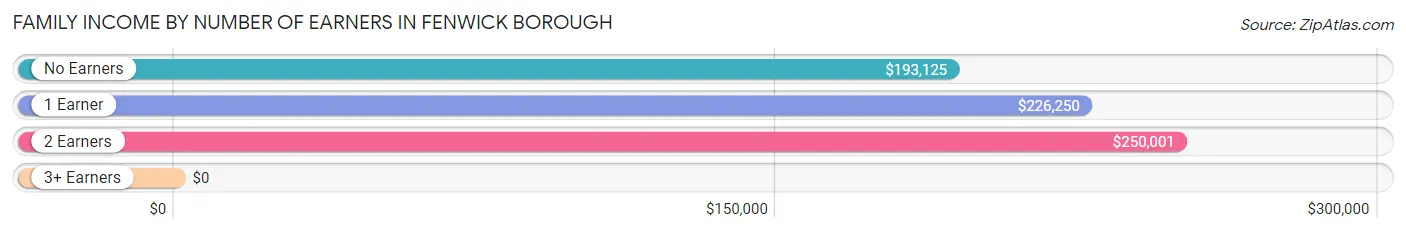
Family Income by Number of Earners in Fenwick borough
| Number of Earners | # Families | Median Income |
| No Earners | 7 (41.2%) | $193,125 |
| 1 Earner | 5 (29.4%) | $226,250 |
| 2 Earners | 5 (29.4%) | $250,001 |
| 3+ Earners | 0 (0.0%) | $0 |
| Total | 17 (100.0%) | $194,375 |
Household Income in Fenwick borough
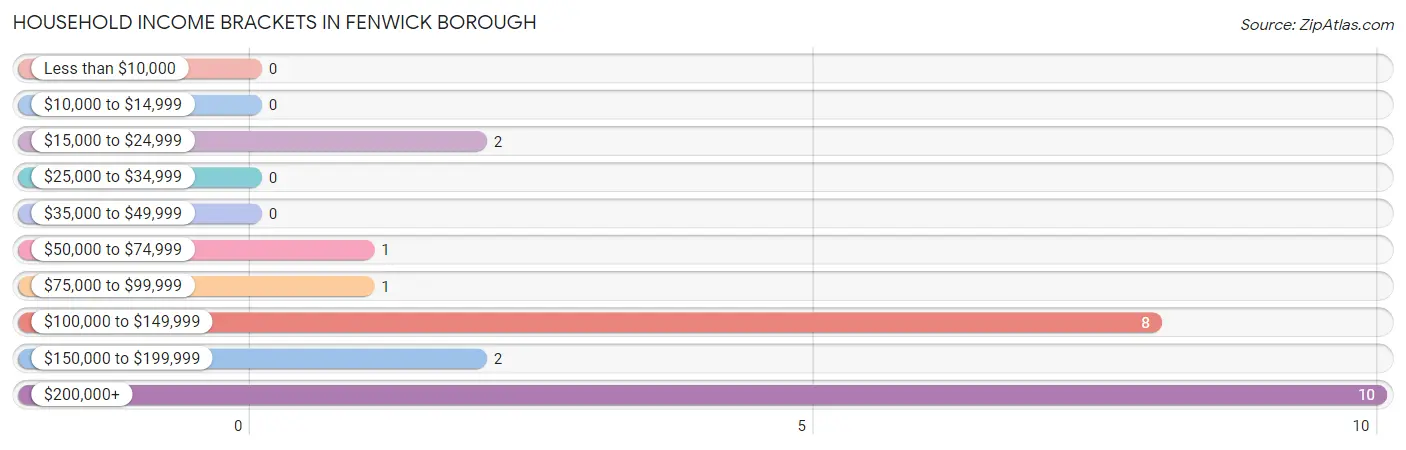
Household Income Brackets in Fenwick borough
With 10 households falling in the category, the $200,000+ income range is the most frequent in Fenwick borough, accounting for 41.7% of all households.
| Income Bracket | # Households | % Households |
| Less than $10,000 | 0 | 0.0% |
| $10,000 to $14,999 | 0 | 0.0% |
| $15,000 to $24,999 | 2 | 8.3% |
| $25,000 to $34,999 | 0 | 0.0% |
| $35,000 to $49,999 | 0 | 0.0% |
| $50,000 to $74,999 | 1 | 4.2% |
| $75,000 to $99,999 | 1 | 4.2% |
| $100,000 to $149,999 | 8 | 33.3% |
| $150,000 to $199,999 | 2 | 8.3% |
| $200,000+ | 10 | 41.7% |
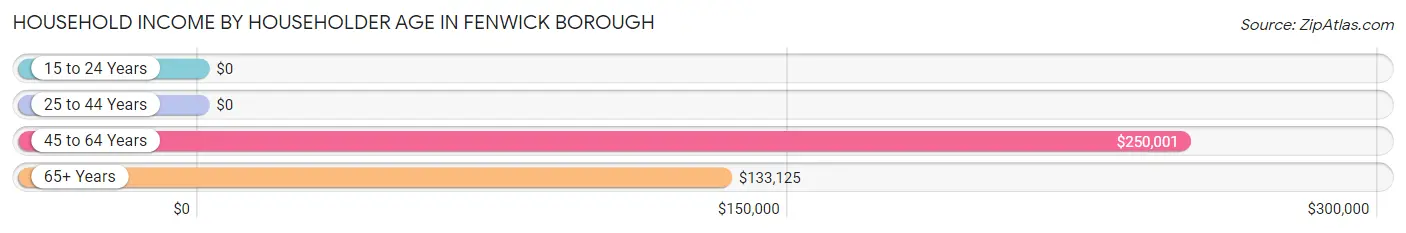
Household Income by Householder Age in Fenwick borough
The median household income in Fenwick borough is $167,500, with the highest median household income of $250,001 found in the 45 to 64 years age bracket for the primary householder. A total of 5 households (20.8%) fall into this category.
| Income Bracket | # Households | Median Income |
| 15 to 24 Years | 0 (0.0%) | $0 |
| 25 to 44 Years | 0 (0.0%) | $0 |
| 45 to 64 Years | 5 (20.8%) | $250,001 |
| 65+ Years | 19 (79.2%) | $133,125 |
| Total | 24 (100.0%) | $167,500 |
Poverty in Fenwick borough
Income Below Poverty by Sex and Age in Fenwick borough
| Age Bracket | Male | Female |
| Under 5 Years | 0 (0.0%) | 0 (0.0%) |
| 5 Years | 0 (0.0%) | 0 (0.0%) |
| 6 to 11 Years | 0 (0.0%) | 0 (0.0%) |
| 12 to 14 Years | 0 (0.0%) | 0 (0.0%) |
| 15 Years | 0 (0.0%) | 0 (0.0%) |
| 16 and 17 Years | 0 (0.0%) | 0 (0.0%) |
| 18 to 24 Years | 0 (0.0%) | 0 (0.0%) |
| 25 to 34 Years | 0 (0.0%) | 0 (0.0%) |
| 35 to 44 Years | 0 (0.0%) | 0 (0.0%) |
| 45 to 54 Years | 0 (0.0%) | 0 (0.0%) |
| 55 to 64 Years | 0 (0.0%) | 0 (0.0%) |
| 65 to 74 Years | 0 (0.0%) | 0 (0.0%) |
| 75 Years and over | 0 (0.0%) | 0 (0.0%) |
| Total | 0 (0.0%) | 0 (0.0%) |
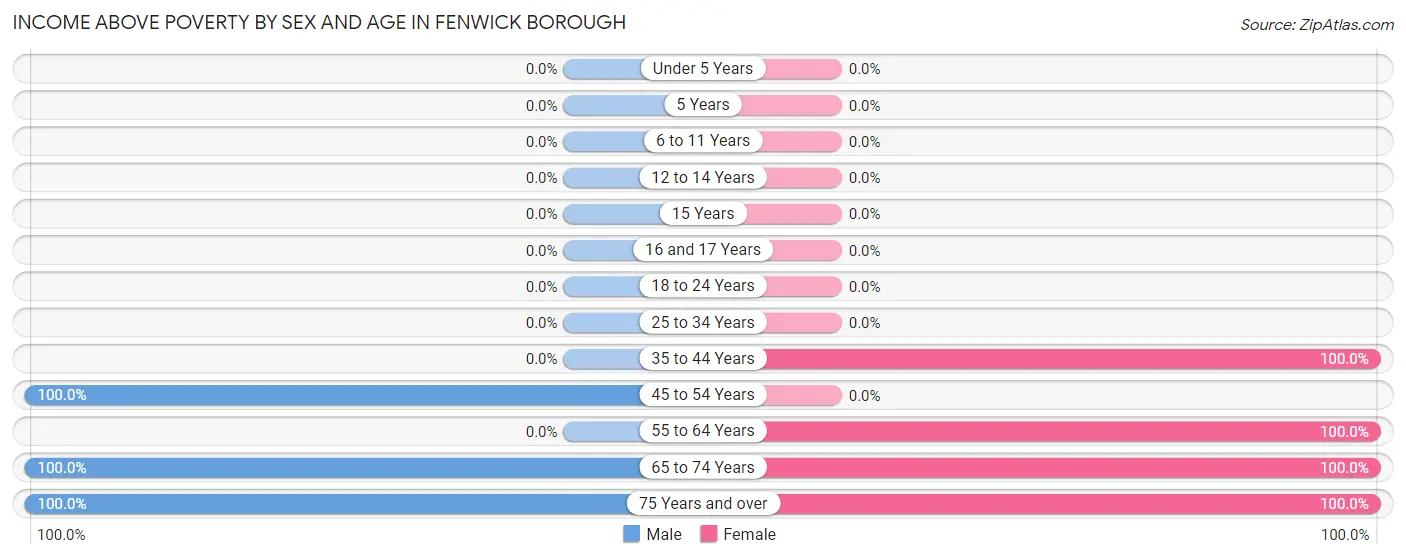
Income Above Poverty by Sex and Age in Fenwick borough
According to the poverty statistics in Fenwick borough, males aged 45 to 54 years and females aged 35 to 44 years are the age groups that are most secure financially, with 100.0% of males and 100.0% of females in these age groups living above the poverty line.
| Age Bracket | Male | Female |
| Under 5 Years | 0 (0.0%) | 0 (0.0%) |
| 5 Years | 0 (0.0%) | 0 (0.0%) |
| 6 to 11 Years | 0 (0.0%) | 0 (0.0%) |
| 12 to 14 Years | 0 (0.0%) | 0 (0.0%) |
| 15 Years | 0 (0.0%) | 0 (0.0%) |
| 16 and 17 Years | 0 (0.0%) | 0 (0.0%) |
| 18 to 24 Years | 0 (0.0%) | 0 (0.0%) |
| 25 to 34 Years | 0 (0.0%) | 0 (0.0%) |
| 35 to 44 Years | 0 (0.0%) | 2 (100.0%) |
| 45 to 54 Years | 2 (100.0%) | 0 (0.0%) |
| 55 to 64 Years | 0 (0.0%) | 4 (100.0%) |
| 65 to 74 Years | 9 (100.0%) | 8 (100.0%) |
| 75 Years and over | 7 (100.0%) | 8 (100.0%) |
| Total | 18 (100.0%) | 22 (100.0%) |
Income Below Poverty Among Married-Couple Families in Fenwick borough
| Children | Above Poverty | Below Poverty |
| No Children | 17 (100.0%) | 0 (0.0%) |
| 1 or 2 Children | 0 (0.0%) | 0 (0.0%) |
| 3 or 4 Children | 0 (0.0%) | 0 (0.0%) |
| 5 or more Children | 0 (0.0%) | 0 (0.0%) |
| Total | 17 (100.0%) | 0 (0.0%) |
Income Below Poverty Among Single-Parent Households in Fenwick borough
| Children | Single Father | Single Mother |
| No Children | 0 (0.0%) | 0 (0.0%) |
| 1 or 2 Children | 0 (0.0%) | 0 (0.0%) |
| 3 or 4 Children | 0 (0.0%) | 0 (0.0%) |
| 5 or more Children | 0 (0.0%) | 0 (0.0%) |
| Total | 0 (0.0%) | 0 (0.0%) |
Income Below Poverty Among Married-Couple vs Single-Parent Households in Fenwick borough
| Children | Married-Couple Families | Single-Parent Households |
| No Children | 0 (0.0%) | 0 (0.0%) |
| 1 or 2 Children | 0 (0.0%) | 0 (0.0%) |
| 3 or 4 Children | 0 (0.0%) | 0 (0.0%) |
| 5 or more Children | 0 (0.0%) | 0 (0.0%) |
| Total | 0 (0.0%) | 0 (0.0%) |
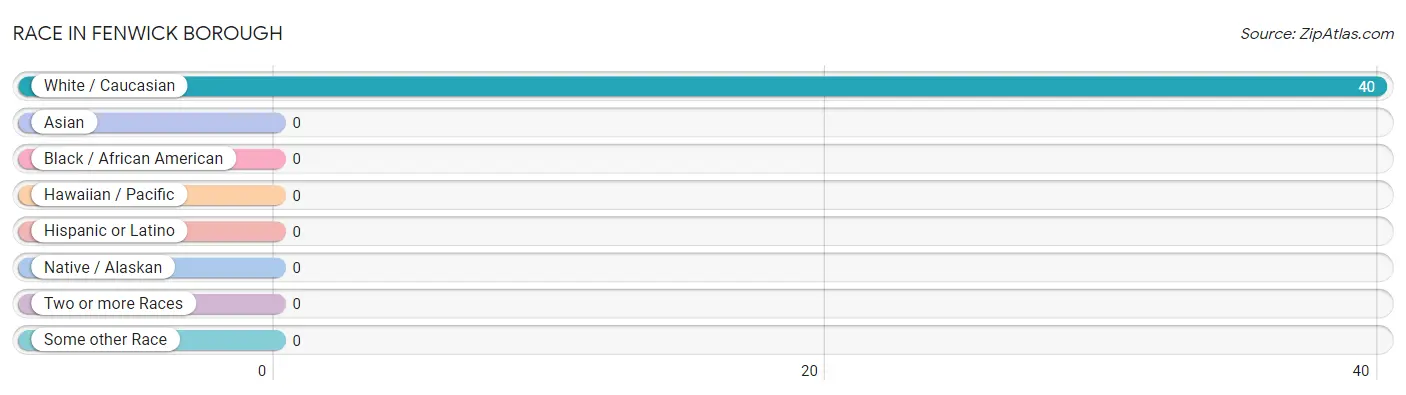
Race in Fenwick borough
The most populous races in Fenwick borough are , and White / Caucasian (40 | 100.0%).
| Race | # Population | % Population |
| Asian | 0 | 0.0% |
| Black / African American | 0 | 0.0% |
| Hawaiian / Pacific | 0 | 0.0% |
| Hispanic or Latino | 0 | 0.0% |
| Native / Alaskan | 0 | 0.0% |
| White / Caucasian | 40 | 100.0% |
| Two or more Races | 0 | 0.0% |
| Some other Race | 0 | 0.0% |
| Total | 40 | 100.0% |
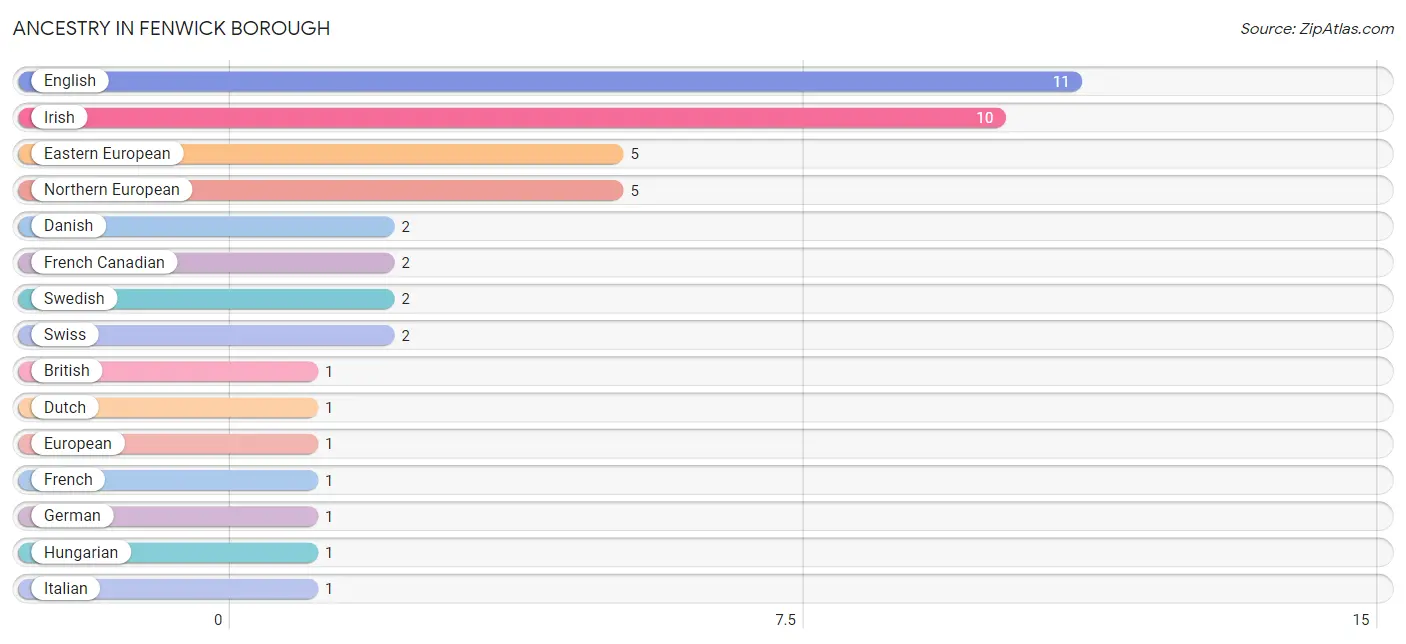
Ancestry in Fenwick borough
The most populous ancestries reported in Fenwick borough are English (11 | 27.5%), Irish (10 | 25.0%), Eastern European (5 | 12.5%), Northern European (5 | 12.5%), and Danish (2 | 5.0%), together accounting for 82.5% of all Fenwick borough residents.
| Ancestry | # Population | % Population |
| British | 1 | 2.5% |
| Danish | 2 | 5.0% |
| Dutch | 1 | 2.5% |
| Eastern European | 5 | 12.5% |
| English | 11 | 27.5% |
| European | 1 | 2.5% |
| French | 1 | 2.5% |
| French Canadian | 2 | 5.0% |
| German | 1 | 2.5% |
| Hungarian | 1 | 2.5% |
| Irish | 10 | 25.0% |
| Italian | 1 | 2.5% |
| Northern European | 5 | 12.5% |
| Polish | 1 | 2.5% |
| Swedish | 2 | 5.0% |
| Swiss | 2 | 5.0% | View All 16 Rows |
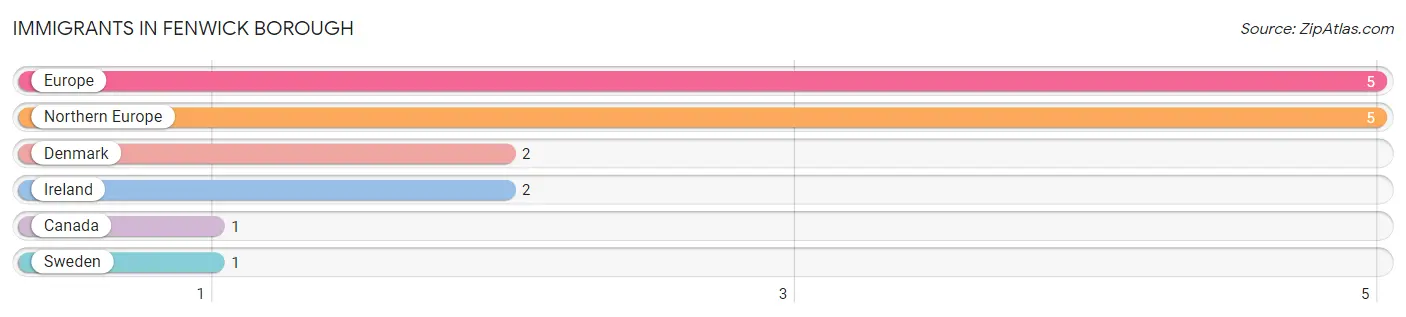
Immigrants in Fenwick borough
The most numerous immigrant groups reported in Fenwick borough came from Europe (5 | 12.5%), Northern Europe (5 | 12.5%), Denmark (2 | 5.0%), Ireland (2 | 5.0%), and Canada (1 | 2.5%), together accounting for 37.5% of all Fenwick borough residents.
| Immigration Origin | # Population | % Population |
| Canada | 1 | 2.5% |
| Denmark | 2 | 5.0% |
| Europe | 5 | 12.5% |
| Ireland | 2 | 5.0% |
| Northern Europe | 5 | 12.5% |
| Sweden | 1 | 2.5% | View All 6 Rows |
Sex and Age in Fenwick borough
Sex and Age in Fenwick borough
The most populous age groups in Fenwick borough are 70 to 74 Years (5 | 27.8%) for men and 70 to 74 Years (6 | 27.3%) for women.
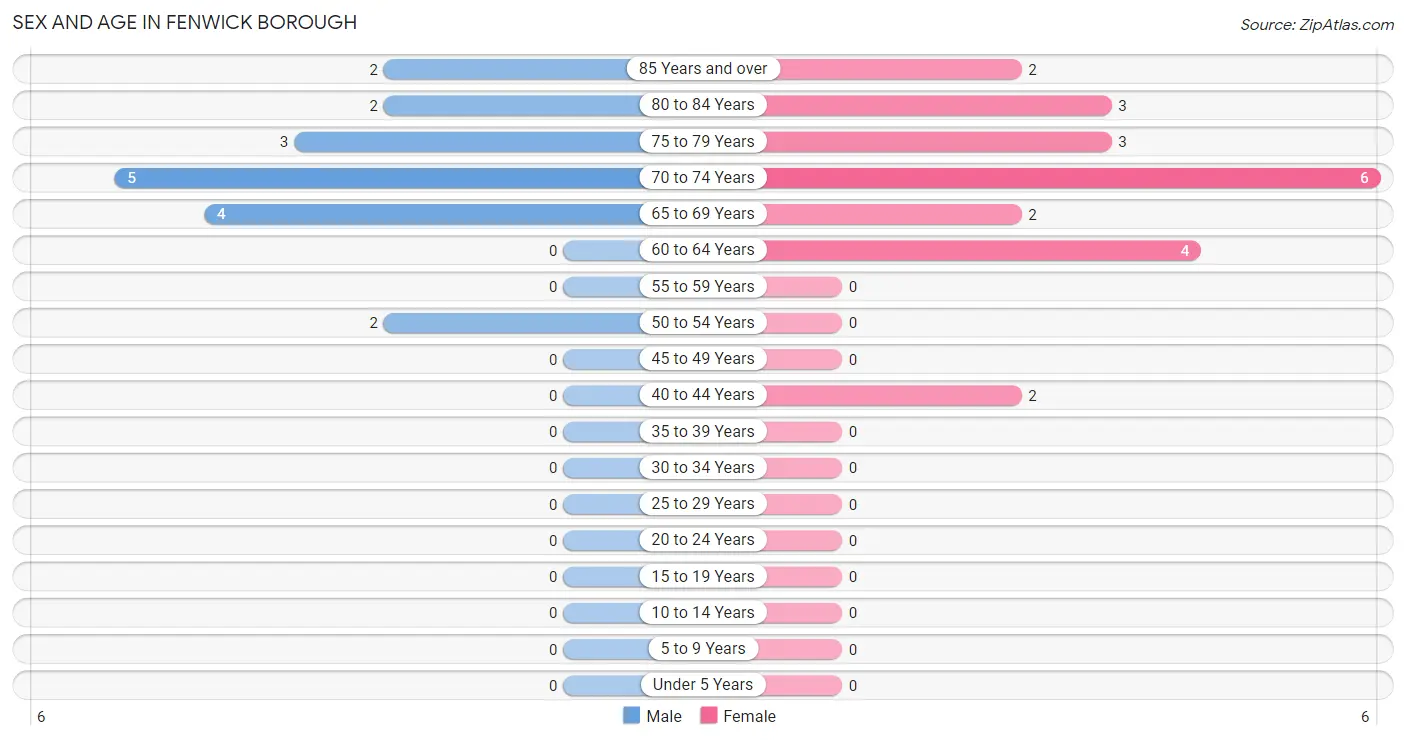
| Age Bracket | Male | Female |
| Under 5 Years | 0 (0.0%) | 0 (0.0%) |
| 5 to 9 Years | 0 (0.0%) | 0 (0.0%) |
| 10 to 14 Years | 0 (0.0%) | 0 (0.0%) |
| 15 to 19 Years | 0 (0.0%) | 0 (0.0%) |
| 20 to 24 Years | 0 (0.0%) | 0 (0.0%) |
| 25 to 29 Years | 0 (0.0%) | 0 (0.0%) |
| 30 to 34 Years | 0 (0.0%) | 0 (0.0%) |
| 35 to 39 Years | 0 (0.0%) | 0 (0.0%) |
| 40 to 44 Years | 0 (0.0%) | 2 (9.1%) |
| 45 to 49 Years | 0 (0.0%) | 0 (0.0%) |
| 50 to 54 Years | 2 (11.1%) | 0 (0.0%) |
| 55 to 59 Years | 0 (0.0%) | 0 (0.0%) |
| 60 to 64 Years | 0 (0.0%) | 4 (18.2%) |
| 65 to 69 Years | 4 (22.2%) | 2 (9.1%) |
| 70 to 74 Years | 5 (27.8%) | 6 (27.3%) |
| 75 to 79 Years | 3 (16.7%) | 3 (13.6%) |
| 80 to 84 Years | 2 (11.1%) | 3 (13.6%) |
| 85 Years and over | 2 (11.1%) | 2 (9.1%) |
| Total | 18 (100.0%) | 22 (100.0%) |
Families and Households in Fenwick borough
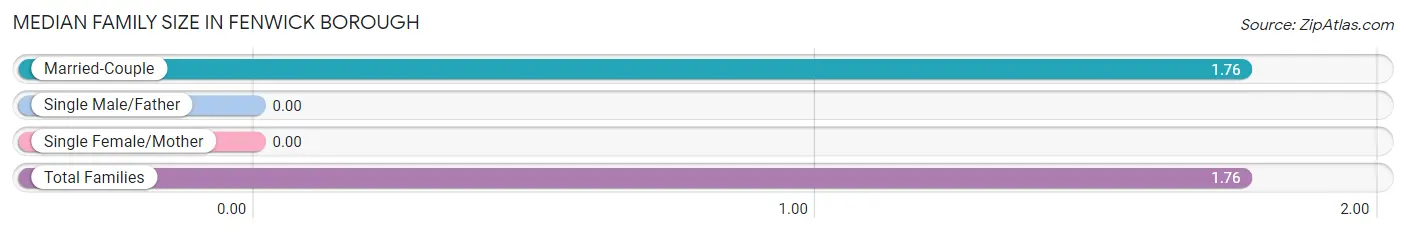
Median Family Size in Fenwick borough
| Family Type | # Families | Family Size |
| Married-Couple | 17 (100.0%) | 1.76 |
| Single Male/Father | 0 (0.0%) | - |
| Single Female/Mother | 0 (0.0%) | - |
| Total Families | 17 (100.0%) | 1.76 |
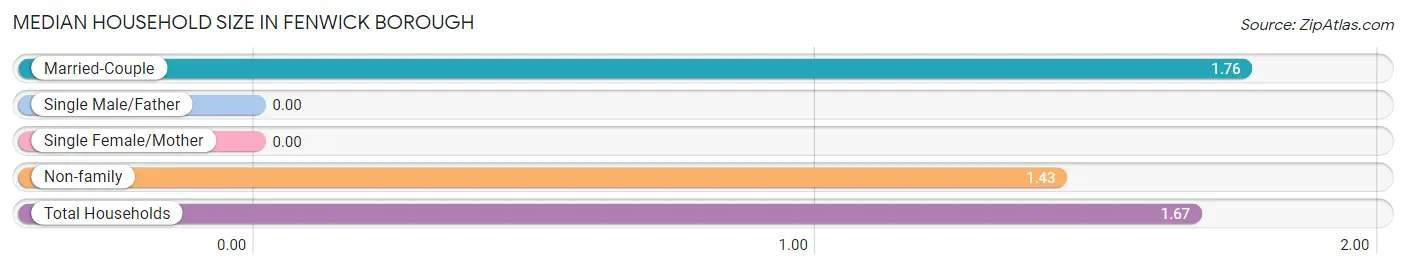
Median Household Size in Fenwick borough
| Household Type | # Households | Household Size |
| Married-Couple | 17 (70.8%) | 1.76 |
| Single Male/Father | 0 (0.0%) | - |
| Single Female/Mother | 0 (0.0%) | - |
| Non-family | 7 (29.2%) | 1.43 |
| Total Households | 24 (100.0%) | 1.67 |
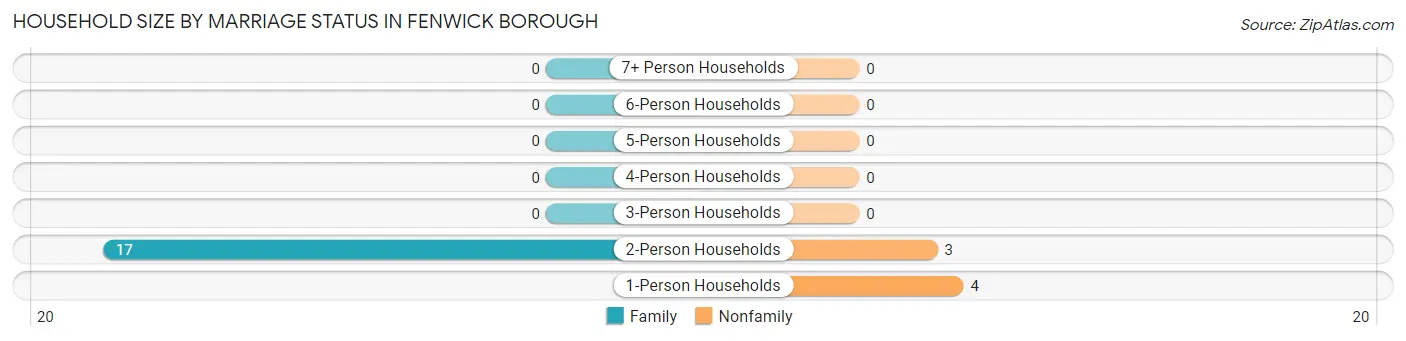
Household Size by Marriage Status in Fenwick borough
Out of a total of 24 households in Fenwick borough, 17 (70.8%) are family households, while 7 (29.2%) are nonfamily households. The most numerous type of family households are 2-person households, comprising 17, and the most common type of nonfamily households are 1-person households, comprising 4.
| Household Size | Family Households | Nonfamily Households |
| 1-Person Households | - | 4 (16.7%) |
| 2-Person Households | 17 (70.8%) | 3 (12.5%) |
| 3-Person Households | 0 (0.0%) | 0 (0.0%) |
| 4-Person Households | 0 (0.0%) | 0 (0.0%) |
| 5-Person Households | 0 (0.0%) | 0 (0.0%) |
| 6-Person Households | 0 (0.0%) | 0 (0.0%) |
| 7+ Person Households | 0 (0.0%) | 0 (0.0%) |
| Total | 17 (70.8%) | 7 (29.2%) |
Female Fertility in Fenwick borough
Fertility by Age in Fenwick borough
| Age Bracket | Women with Births | Births / 1,000 Women |
| 15 to 19 years | 0 (0.0%) | 0.0 |
| 20 to 34 years | 0 (0.0%) | 0.0 |
| 35 to 50 years | 0 (0.0%) | 0.0 |
| Total | 0 (0.0%) | 0.0 |
Fertility by Age by Marriage Status in Fenwick borough
| Age Bracket | Married | Unmarried |
| 15 to 19 years | 0 (0.0%) | 0 (0.0%) |
| 20 to 34 years | 0 (0.0%) | 0 (0.0%) |
| 35 to 50 years | 0 (0.0%) | 0 (0.0%) |
| Total | 0 (0.0%) | 0 (0.0%) |
Fertility by Education in Fenwick borough
| Educational Attainment | Women with Births | Births / 1,000 Women |
| Less than High School | 0 (0.0%) | 0.0 |
| High School Diploma | 0 (0.0%) | 0.0 |
| College or Associate's Degree | 0 (0.0%) | 0.0 |
| Bachelor's Degree | 0 (0.0%) | 0.0 |
| Graduate Degree | 0 (0.0%) | 0.0 |
| Total | 0 (0.0%) | 0.0 |
Fertility by Education by Marriage Status in Fenwick borough
| Educational Attainment | Married | Unmarried |
| Less than High School | 0 (0.0%) | 0 (0.0%) |
| High School Diploma | 0 (0.0%) | 0 (0.0%) |
| College or Associate's Degree | 0 (0.0%) | 0 (0.0%) |
| Bachelor's Degree | 0 (0.0%) | 0 (0.0%) |
| Graduate Degree | 0 (0.0%) | 0 (0.0%) |
| Total | 0 (0.0%) | 0 (0.0%) |
Employment Characteristics in Fenwick borough
Employment by Class of Employer in Fenwick borough
Among the 17 employed individuals in Fenwick borough, private company employees (8 | 47.1%), not-for-profit organizations (5 | 29.4%), and self-employed (not incorporated) (4 | 23.5%) make up the most common classes of employment.
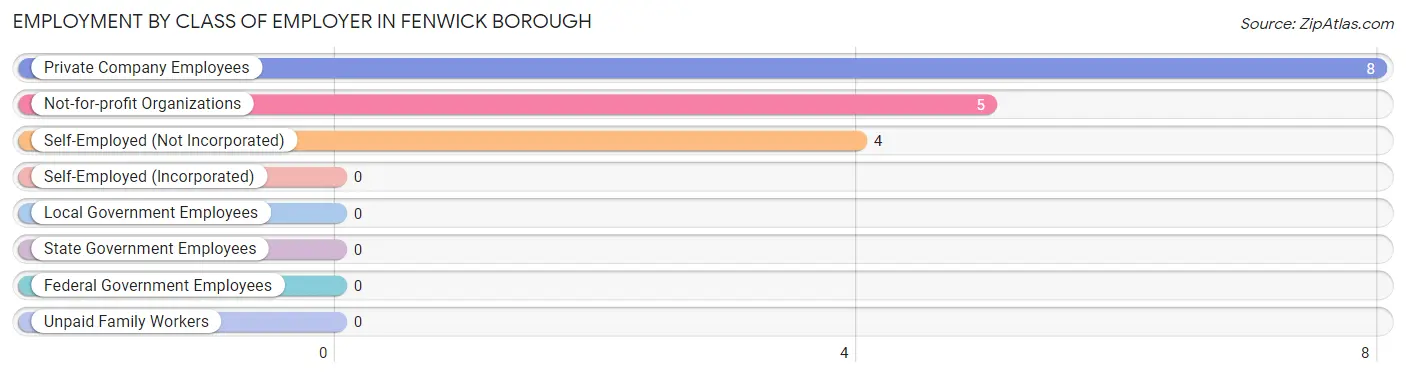
| Employer Class | # Employees | % Employees |
| Private Company Employees | 8 | 47.1% |
| Self-Employed (Incorporated) | 0 | 0.0% |
| Self-Employed (Not Incorporated) | 4 | 23.5% |
| Not-for-profit Organizations | 5 | 29.4% |
| Local Government Employees | 0 | 0.0% |
| State Government Employees | 0 | 0.0% |
| Federal Government Employees | 0 | 0.0% |
| Unpaid Family Workers | 0 | 0.0% |
| Total | 17 | 100.0% |
Employment Status by Age in Fenwick borough
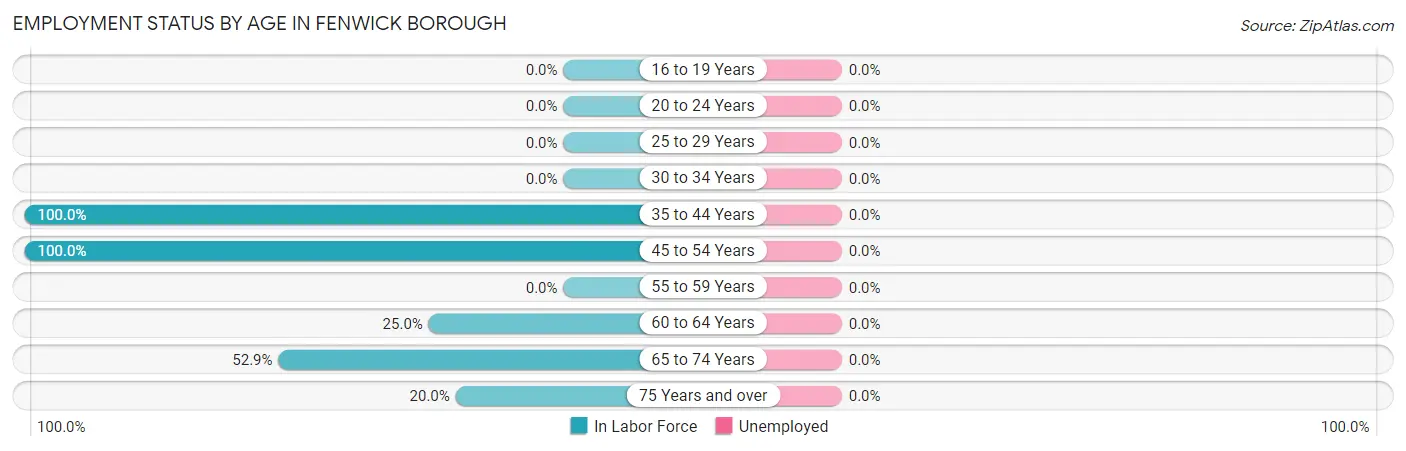
| Age Bracket | In Labor Force | Unemployed |
| 16 to 19 Years | 0 (0.0%) | 0 (0.0%) |
| 20 to 24 Years | 0 (0.0%) | 0 (0.0%) |
| 25 to 29 Years | 0 (0.0%) | 0 (0.0%) |
| 30 to 34 Years | 0 (0.0%) | 0 (0.0%) |
| 35 to 44 Years | 2 (100.0%) | 0 (0.0%) |
| 45 to 54 Years | 2 (100.0%) | 0 (0.0%) |
| 55 to 59 Years | 0 (0.0%) | 0 (0.0%) |
| 60 to 64 Years | 1 (25.0%) | 0 (0.0%) |
| 65 to 74 Years | 9 (52.9%) | 0 (0.0%) |
| 75 Years and over | 3 (20.0%) | 0 (0.0%) |
| Total | 17 (42.5%) | 0 (0.0%) |
Employment Status by Educational Attainment in Fenwick borough
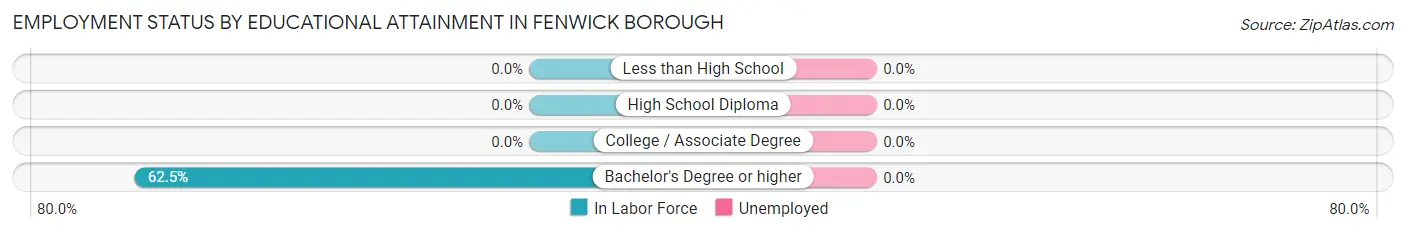
| Educational Attainment | In Labor Force | Unemployed |
| Less than High School | 0 (0.0%) | 0 (0.0%) |
| High School Diploma | 0 (0.0%) | 0 (0.0%) |
| College / Associate Degree | 0 (0.0%) | 0 (0.0%) |
| Bachelor's Degree or higher | 5 (62.5%) | 0 (0.0%) |
| Total | 5 (62.5%) | 0 (0.0%) |
Employment Occupations by Sex in Fenwick borough
Management, Business, Science and Arts Occupations
The most common Management, Business, Science and Arts occupations in Fenwick borough are Management (8 | 47.1%), Business & Financial (3 | 17.6%), Community & Social Service (2 | 11.8%), Arts, Media & Entertainment (2 | 11.8%), and Computers, Engineering & Science (1 | 5.9%).
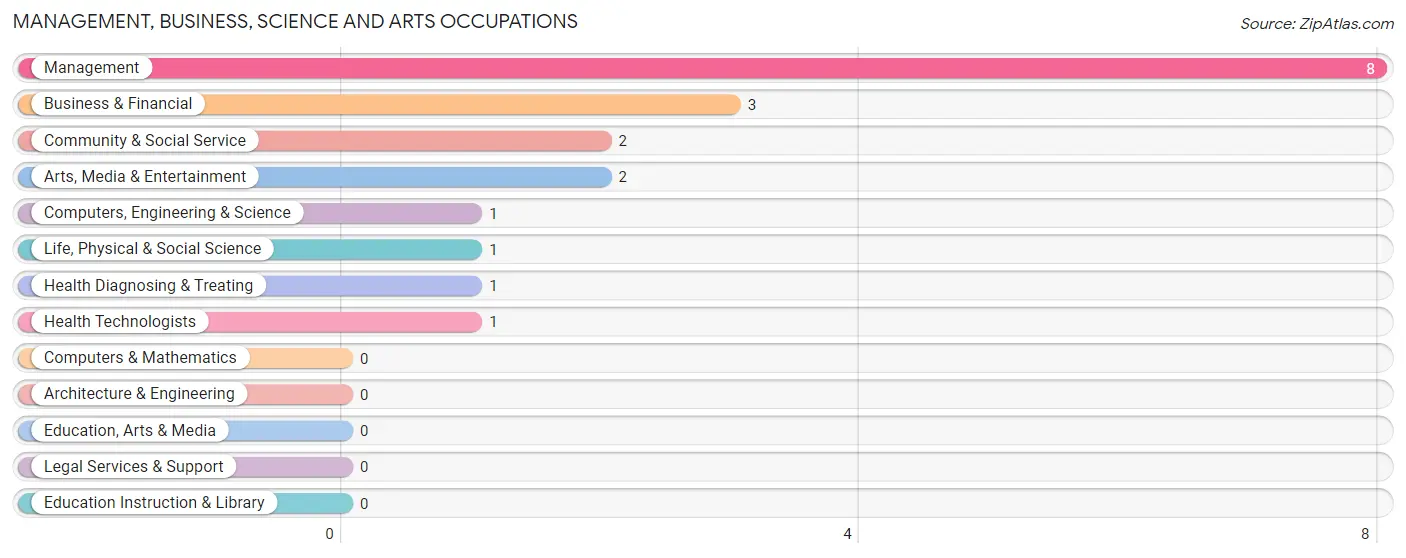
Management, Business, Science and Arts Occupations by Sex
Within the Management, Business, Science and Arts occupations in Fenwick borough, the most male-oriented occupations are Business & Financial (100.0%), Health Diagnosing & Treating (100.0%), and Health Technologists (100.0%), while the most female-oriented occupations are Computers, Engineering & Science (100.0%), Life, Physical & Social Science (100.0%), and Community & Social Service (100.0%).
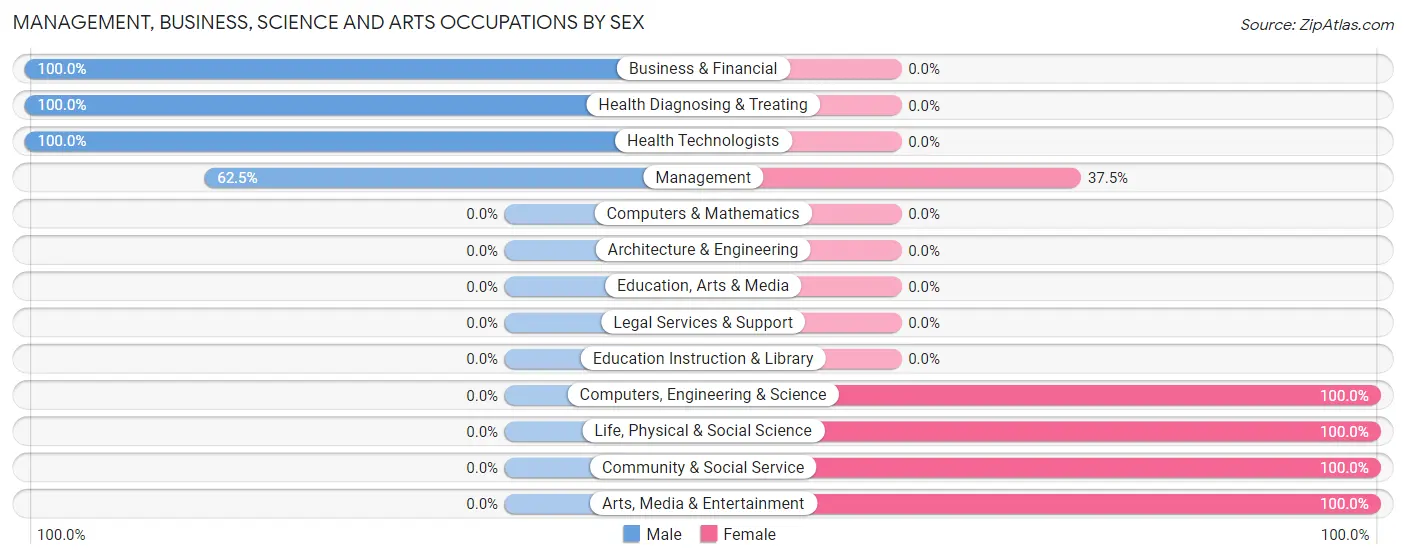
| Occupation | Male | Female |
| Management | 5 (62.5%) | 3 (37.5%) |
| Business & Financial | 3 (100.0%) | 0 (0.0%) |
| Computers, Engineering & Science | 0 (0.0%) | 1 (100.0%) |
| Computers & Mathematics | 0 (0.0%) | 0 (0.0%) |
| Architecture & Engineering | 0 (0.0%) | 0 (0.0%) |
| Life, Physical & Social Science | 0 (0.0%) | 1 (100.0%) |
| Community & Social Service | 0 (0.0%) | 2 (100.0%) |
| Education, Arts & Media | 0 (0.0%) | 0 (0.0%) |
| Legal Services & Support | 0 (0.0%) | 0 (0.0%) |
| Education Instruction & Library | 0 (0.0%) | 0 (0.0%) |
| Arts, Media & Entertainment | 0 (0.0%) | 2 (100.0%) |
| Health Diagnosing & Treating | 1 (100.0%) | 0 (0.0%) |
| Health Technologists | 1 (100.0%) | 0 (0.0%) |
| Total (Category) | 9 (60.0%) | 6 (40.0%) |
| Total (Overall) | 11 (64.7%) | 6 (35.3%) |
Services Occupations
Services Occupations by Sex
| Occupation | Male | Female |
| Healthcare Support | 0 (0.0%) | 0 (0.0%) |
| Security & Protection | 0 (0.0%) | 0 (0.0%) |
| Firefighting & Prevention | 0 (0.0%) | 0 (0.0%) |
| Law Enforcement | 0 (0.0%) | 0 (0.0%) |
| Food Preparation & Serving | 0 (0.0%) | 0 (0.0%) |
| Cleaning & Maintenance | 0 (0.0%) | 0 (0.0%) |
| Personal Care & Service | 0 (0.0%) | 0 (0.0%) |
| Total (Category) | 0 (0.0%) | 0 (0.0%) |
| Total (Overall) | 11 (64.7%) | 6 (35.3%) |
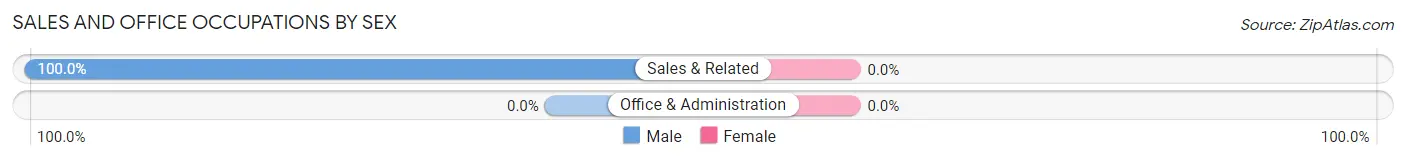
Sales and Office Occupations
The most common Sales and Office occupations in Fenwick borough are , and Sales & Related (2 | 11.8%).
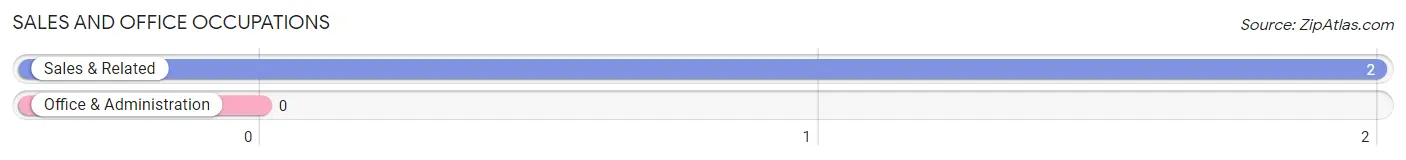
Sales and Office Occupations by Sex
| Occupation | Male | Female |
| Sales & Related | 2 (100.0%) | 0 (0.0%) |
| Office & Administration | 0 (0.0%) | 0 (0.0%) |
| Total (Category) | 2 (100.0%) | 0 (0.0%) |
| Total (Overall) | 11 (64.7%) | 6 (35.3%) |
Natural Resources, Construction and Maintenance Occupations
Natural Resources, Construction and Maintenance Occupations by Sex
| Occupation | Male | Female |
| Farming, Fishing & Forestry | 0 (0.0%) | 0 (0.0%) |
| Construction & Extraction | 0 (0.0%) | 0 (0.0%) |
| Installation, Maintenance & Repair | 0 (0.0%) | 0 (0.0%) |
| Total (Category) | 0 (0.0%) | 0 (0.0%) |
| Total (Overall) | 11 (64.7%) | 6 (35.3%) |
Production, Transportation and Moving Occupations
Production, Transportation and Moving Occupations by Sex
| Occupation | Male | Female |
| Production | 0 (0.0%) | 0 (0.0%) |
| Transportation | 0 (0.0%) | 0 (0.0%) |
| Material Moving | 0 (0.0%) | 0 (0.0%) |
| Total (Category) | 0 (0.0%) | 0 (0.0%) |
| Total (Overall) | 11 (64.7%) | 6 (35.3%) |
Employment Industries by Sex in Fenwick borough
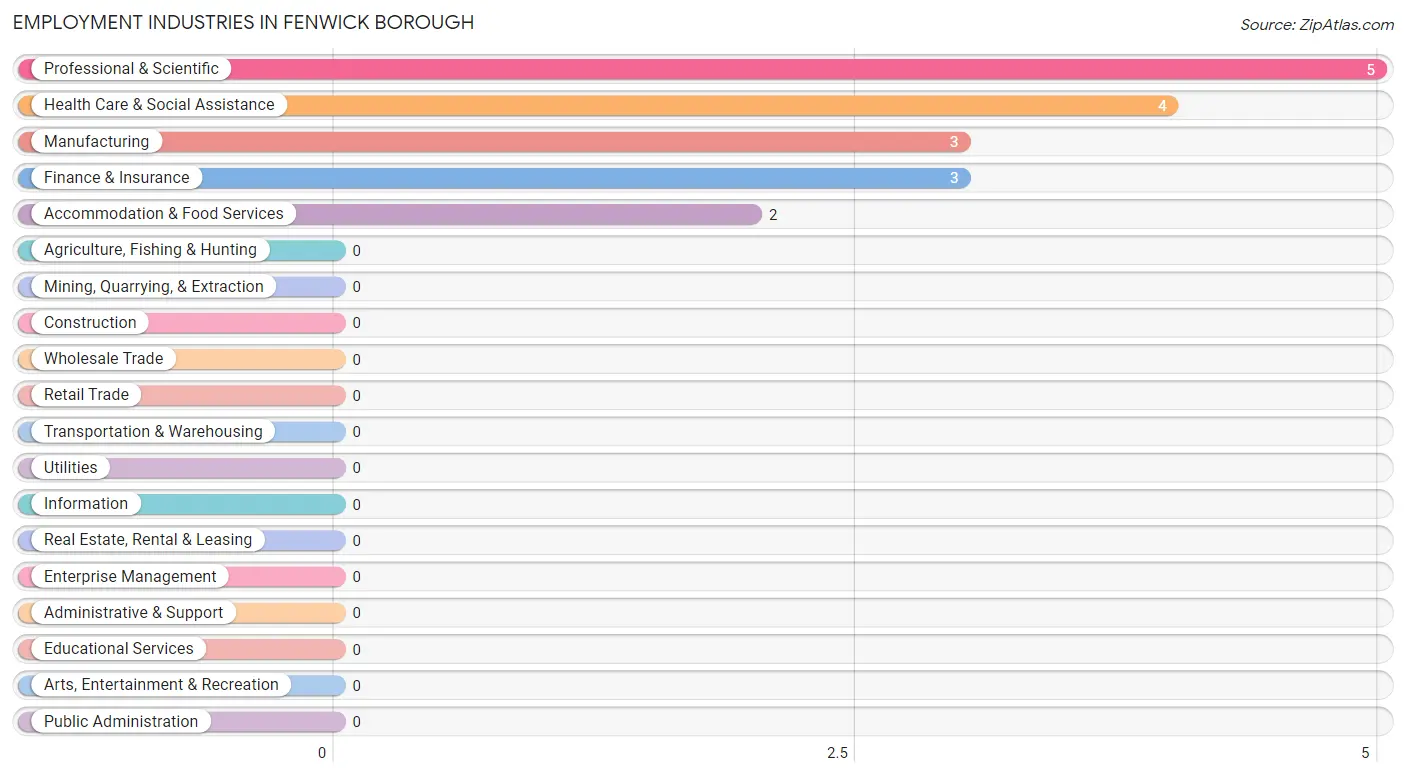
Employment Industries in Fenwick borough
The major employment industries in Fenwick borough include Professional & Scientific (5 | 29.4%), Health Care & Social Assistance (4 | 23.5%), Manufacturing (3 | 17.6%), Finance & Insurance (3 | 17.6%), and Accommodation & Food Services (2 | 11.8%).
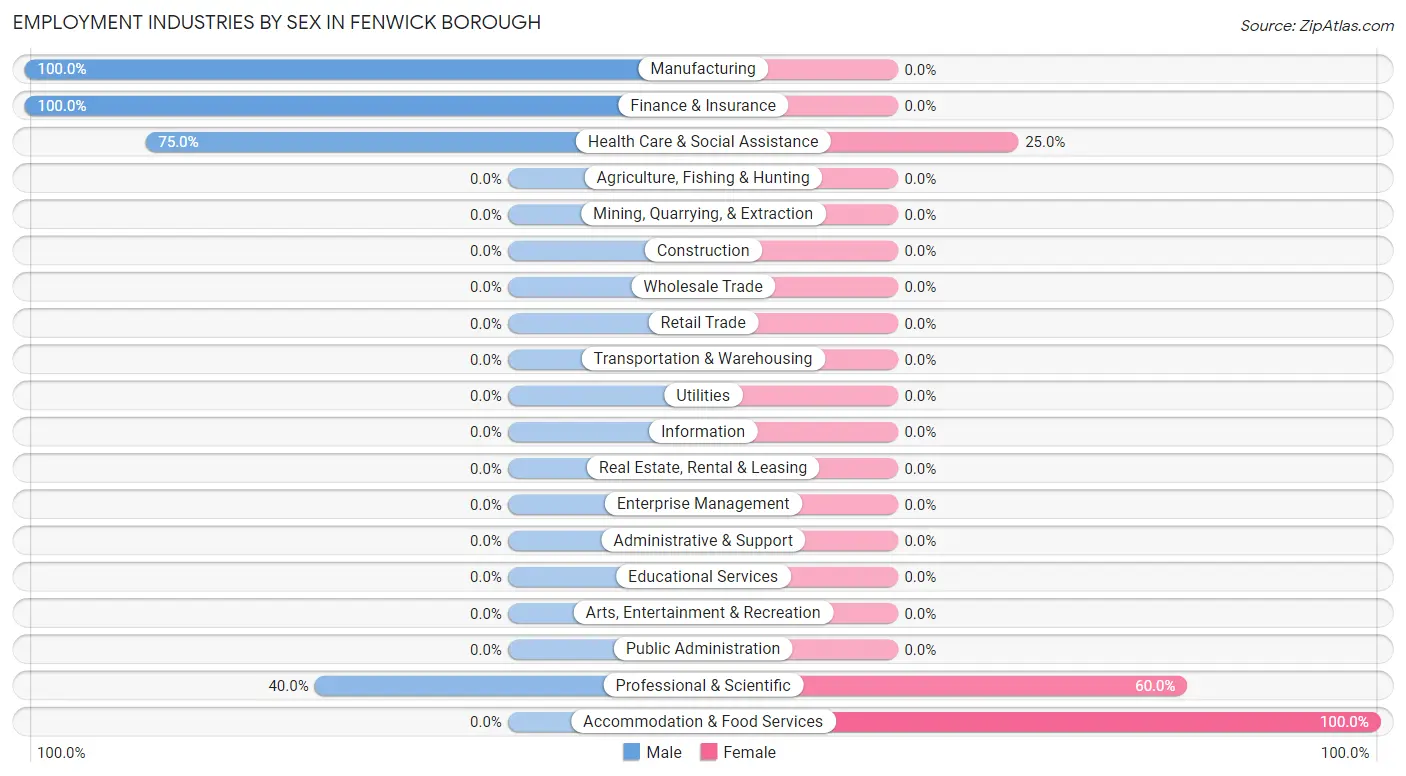
Employment Industries by Sex in Fenwick borough
The Fenwick borough industries that see more men than women are Manufacturing (100.0%), Finance & Insurance (100.0%), and Health Care & Social Assistance (75.0%), whereas the industries that tend to have a higher number of women are Accommodation & Food Services (100.0%), Professional & Scientific (60.0%), and Health Care & Social Assistance (25.0%).
| Industry | Male | Female |
| Agriculture, Fishing & Hunting | 0 (0.0%) | 0 (0.0%) |
| Mining, Quarrying, & Extraction | 0 (0.0%) | 0 (0.0%) |
| Construction | 0 (0.0%) | 0 (0.0%) |
| Manufacturing | 3 (100.0%) | 0 (0.0%) |
| Wholesale Trade | 0 (0.0%) | 0 (0.0%) |
| Retail Trade | 0 (0.0%) | 0 (0.0%) |
| Transportation & Warehousing | 0 (0.0%) | 0 (0.0%) |
| Utilities | 0 (0.0%) | 0 (0.0%) |
| Information | 0 (0.0%) | 0 (0.0%) |
| Finance & Insurance | 3 (100.0%) | 0 (0.0%) |
| Real Estate, Rental & Leasing | 0 (0.0%) | 0 (0.0%) |
| Professional & Scientific | 2 (40.0%) | 3 (60.0%) |
| Enterprise Management | 0 (0.0%) | 0 (0.0%) |
| Administrative & Support | 0 (0.0%) | 0 (0.0%) |
| Educational Services | 0 (0.0%) | 0 (0.0%) |
| Health Care & Social Assistance | 3 (75.0%) | 1 (25.0%) |
| Arts, Entertainment & Recreation | 0 (0.0%) | 0 (0.0%) |
| Accommodation & Food Services | 0 (0.0%) | 2 (100.0%) |
| Public Administration | 0 (0.0%) | 0 (0.0%) |
| Total | 11 (64.7%) | 6 (35.3%) |
Education in Fenwick borough
School Enrollment in Fenwick borough
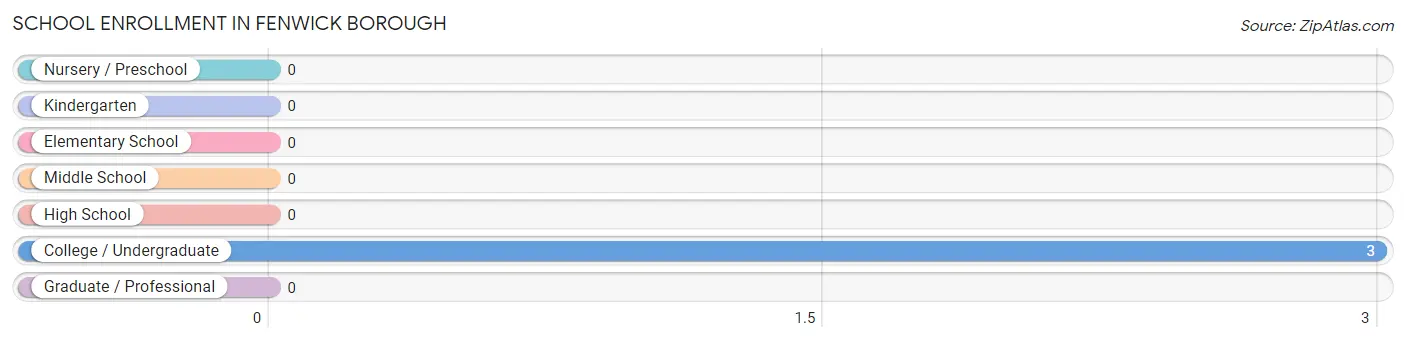
| School Level | # Students | % Students |
| Nursery / Preschool | 0 | 0.0% |
| Kindergarten | 0 | 0.0% |
| Elementary School | 0 | 0.0% |
| Middle School | 0 | 0.0% |
| High School | 0 | 0.0% |
| College / Undergraduate | 3 | 100.0% |
| Graduate / Professional | 0 | 0.0% |
| Total | 3 | 100.0% |
School Enrollment by Age by Funding Source in Fenwick borough
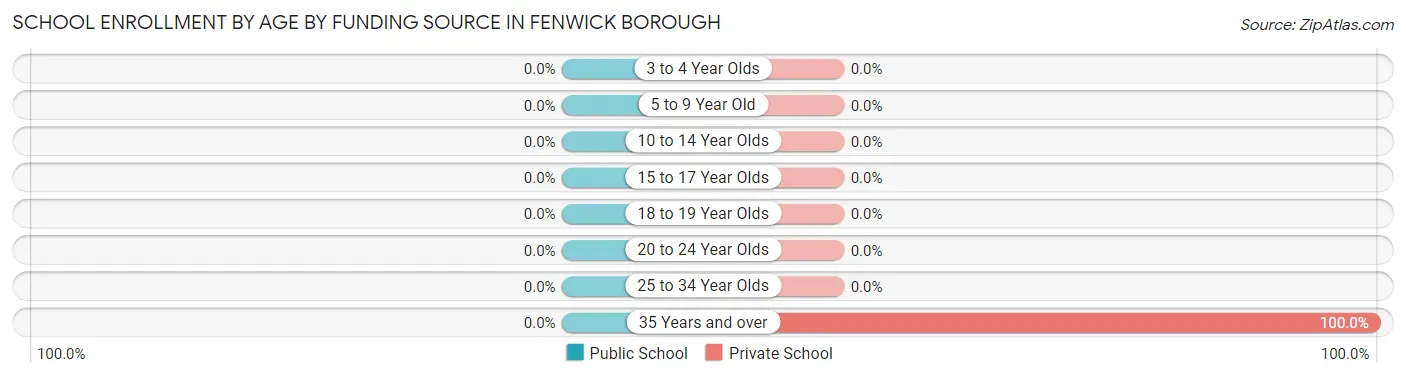
| Age Bracket | Public School | Private School |
| 3 to 4 Year Olds | 0 (0.0%) | 0 (0.0%) |
| 5 to 9 Year Old | 0 (0.0%) | 0 (0.0%) |
| 10 to 14 Year Olds | 0 (0.0%) | 0 (0.0%) |
| 15 to 17 Year Olds | 0 (0.0%) | 0 (0.0%) |
| 18 to 19 Year Olds | 0 (0.0%) | 0 (0.0%) |
| 20 to 24 Year Olds | 0 (0.0%) | 0 (0.0%) |
| 25 to 34 Year Olds | 0 (0.0%) | 0 (0.0%) |
| 35 Years and over | 0 (0.0%) | 3 (100.0%) |
| Total | 0 (0.0%) | 3 (100.0%) |
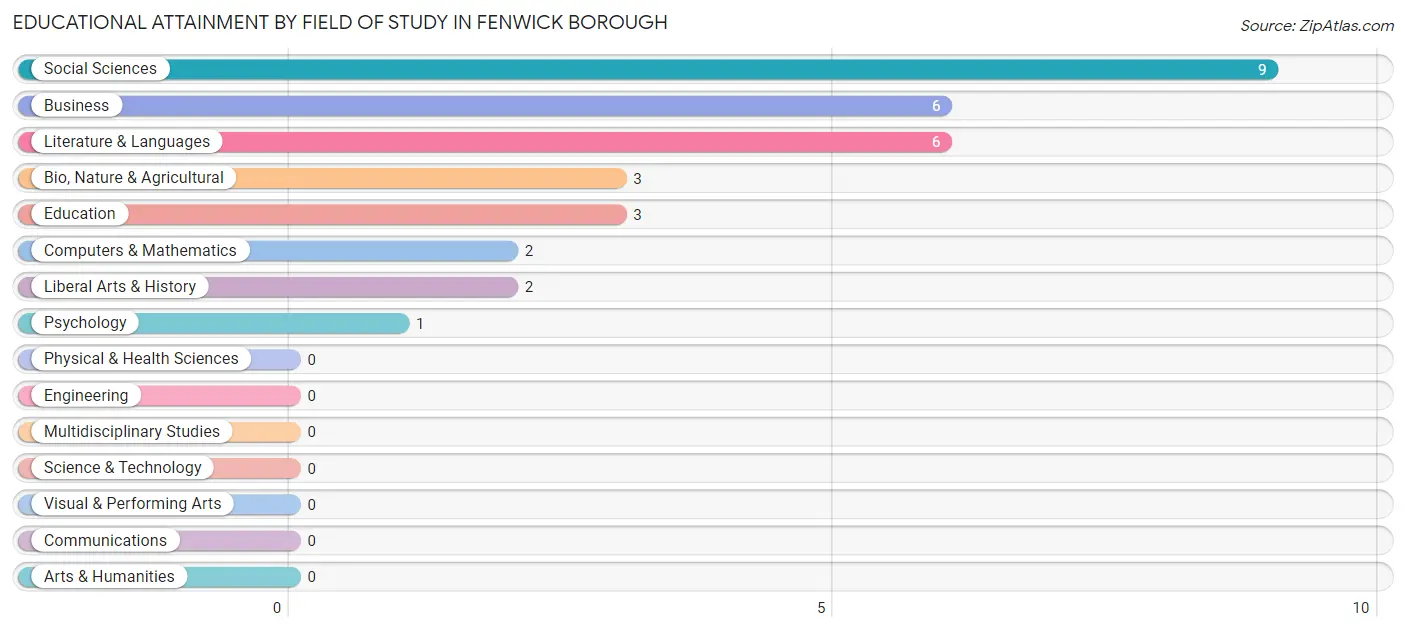
Educational Attainment by Field of Study in Fenwick borough
Social sciences (9 | 28.1%), business (6 | 18.8%), literature & languages (6 | 18.8%), bio, nature & agricultural (3 | 9.4%), and education (3 | 9.4%) are the most common fields of study among 32 individuals in Fenwick borough who have obtained a bachelor's degree or higher.
| Field of Study | # Graduates | % Graduates |
| Computers & Mathematics | 2 | 6.2% |
| Bio, Nature & Agricultural | 3 | 9.4% |
| Physical & Health Sciences | 0 | 0.0% |
| Psychology | 1 | 3.1% |
| Social Sciences | 9 | 28.1% |
| Engineering | 0 | 0.0% |
| Multidisciplinary Studies | 0 | 0.0% |
| Science & Technology | 0 | 0.0% |
| Business | 6 | 18.8% |
| Education | 3 | 9.4% |
| Literature & Languages | 6 | 18.8% |
| Liberal Arts & History | 2 | 6.2% |
| Visual & Performing Arts | 0 | 0.0% |
| Communications | 0 | 0.0% |
| Arts & Humanities | 0 | 0.0% |
| Total | 32 | 100.0% |
Transportation & Commute in Fenwick borough
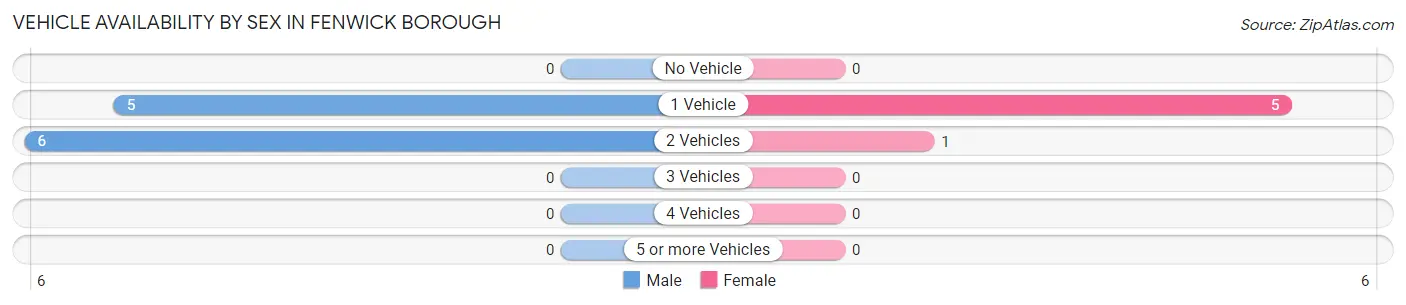
Vehicle Availability by Sex in Fenwick borough
The most prevalent vehicle ownership categories in Fenwick borough are males with 2 vehicles (6, accounting for 54.5%) and females with 2 vehicles (1, making up 100.0%).
| Vehicles Available | Male | Female |
| No Vehicle | 0 (0.0%) | 0 (0.0%) |
| 1 Vehicle | 5 (45.5%) | 5 (83.3%) |
| 2 Vehicles | 6 (54.5%) | 1 (16.7%) |
| 3 Vehicles | 0 (0.0%) | 0 (0.0%) |
| 4 Vehicles | 0 (0.0%) | 0 (0.0%) |
| 5 or more Vehicles | 0 (0.0%) | 0 (0.0%) |
| Total | 11 (100.0%) | 6 (100.0%) |
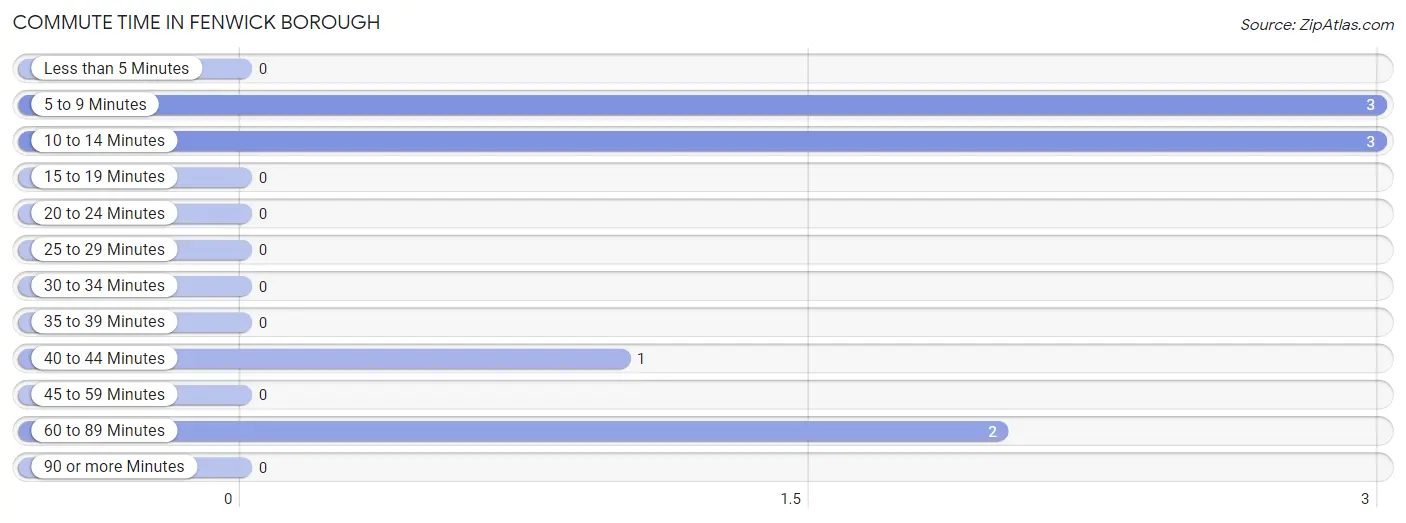
Commute Time in Fenwick borough
The most frequently occuring commute durations in Fenwick borough are 5 to 9 minutes (3 commuters, 33.3%), 10 to 14 minutes (3 commuters, 33.3%), and 60 to 89 minutes (2 commuters, 22.2%).
| Commute Time | # Commuters | % Commuters |
| Less than 5 Minutes | 0 | 0.0% |
| 5 to 9 Minutes | 3 | 33.3% |
| 10 to 14 Minutes | 3 | 33.3% |
| 15 to 19 Minutes | 0 | 0.0% |
| 20 to 24 Minutes | 0 | 0.0% |
| 25 to 29 Minutes | 0 | 0.0% |
| 30 to 34 Minutes | 0 | 0.0% |
| 35 to 39 Minutes | 0 | 0.0% |
| 40 to 44 Minutes | 1 | 11.1% |
| 45 to 59 Minutes | 0 | 0.0% |
| 60 to 89 Minutes | 2 | 22.2% |
| 90 or more Minutes | 0 | 0.0% |
Commute Time by Sex in Fenwick borough
The most common commute times in Fenwick borough are 5 to 9 minutes (2 commuters, 40.0%) for males and 60 to 89 minutes (2 commuters, 50.0%) for females.
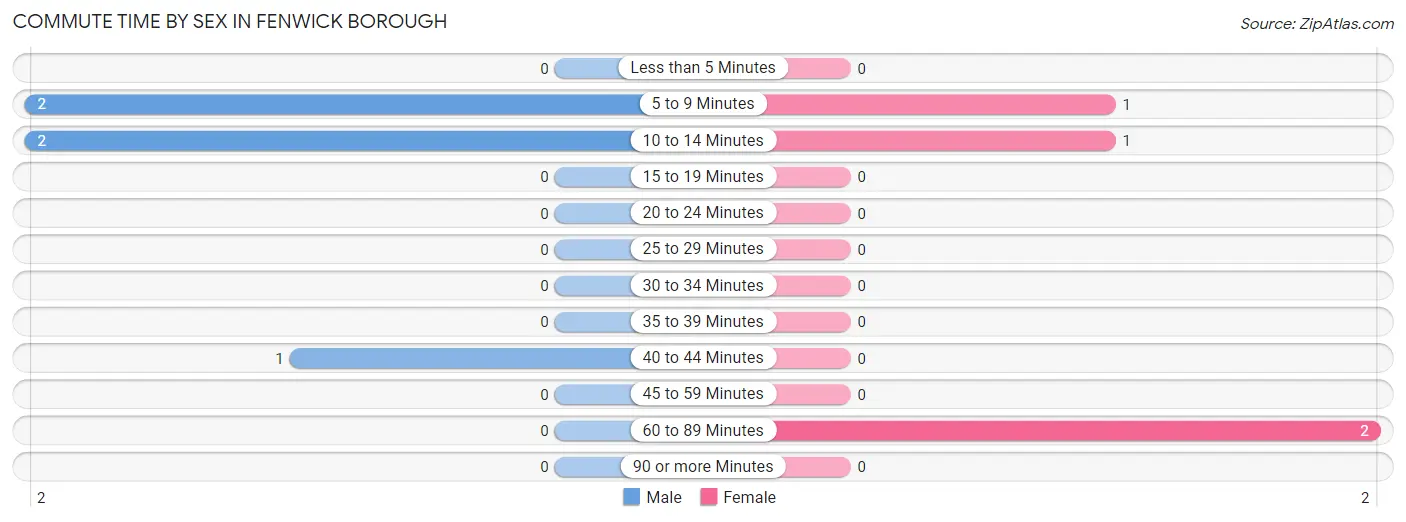
| Commute Time | Male | Female |
| Less than 5 Minutes | 0 (0.0%) | 0 (0.0%) |
| 5 to 9 Minutes | 2 (40.0%) | 1 (25.0%) |
| 10 to 14 Minutes | 2 (40.0%) | 1 (25.0%) |
| 15 to 19 Minutes | 0 (0.0%) | 0 (0.0%) |
| 20 to 24 Minutes | 0 (0.0%) | 0 (0.0%) |
| 25 to 29 Minutes | 0 (0.0%) | 0 (0.0%) |
| 30 to 34 Minutes | 0 (0.0%) | 0 (0.0%) |
| 35 to 39 Minutes | 0 (0.0%) | 0 (0.0%) |
| 40 to 44 Minutes | 1 (20.0%) | 0 (0.0%) |
| 45 to 59 Minutes | 0 (0.0%) | 0 (0.0%) |
| 60 to 89 Minutes | 0 (0.0%) | 2 (50.0%) |
| 90 or more Minutes | 0 (0.0%) | 0 (0.0%) |
Time of Departure to Work by Sex in Fenwick borough
The most frequent times of departure to work in Fenwick borough are 8:00 AM to 8:29 AM (5, 100.0%) for males and 7:30 AM to 7:59 AM (2, 50.0%) for females.
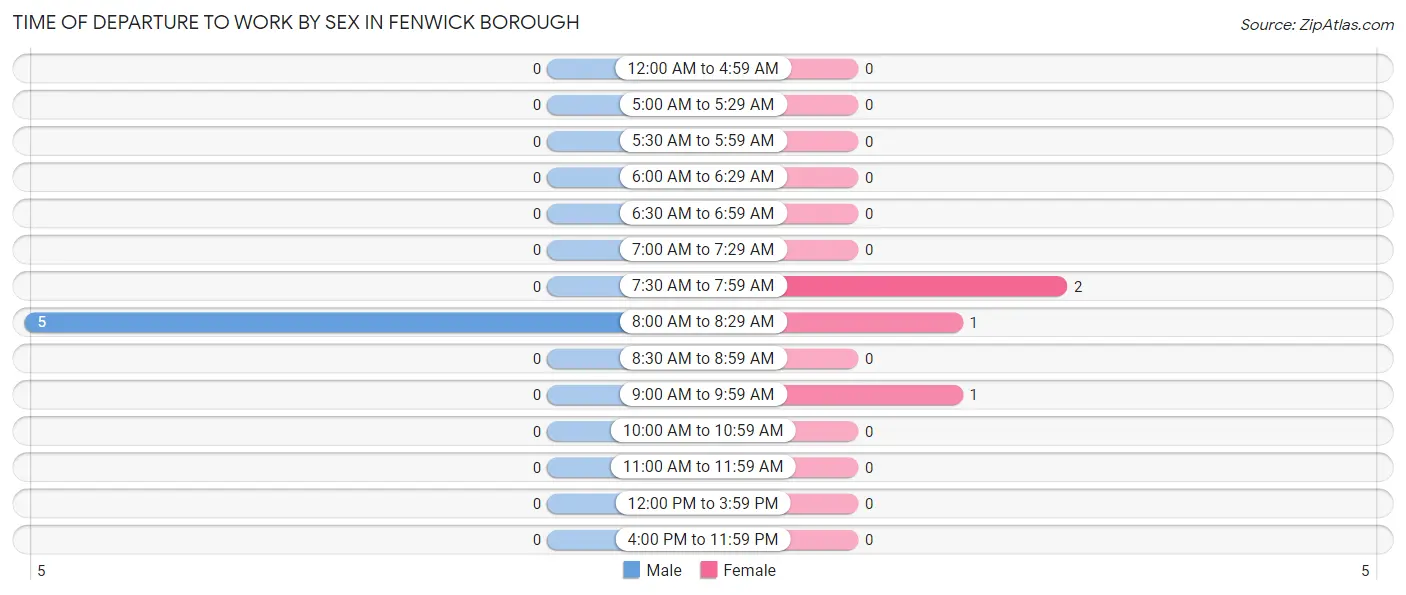
| Time of Departure | Male | Female |
| 12:00 AM to 4:59 AM | 0 (0.0%) | 0 (0.0%) |
| 5:00 AM to 5:29 AM | 0 (0.0%) | 0 (0.0%) |
| 5:30 AM to 5:59 AM | 0 (0.0%) | 0 (0.0%) |
| 6:00 AM to 6:29 AM | 0 (0.0%) | 0 (0.0%) |
| 6:30 AM to 6:59 AM | 0 (0.0%) | 0 (0.0%) |
| 7:00 AM to 7:29 AM | 0 (0.0%) | 0 (0.0%) |
| 7:30 AM to 7:59 AM | 0 (0.0%) | 2 (50.0%) |
| 8:00 AM to 8:29 AM | 5 (100.0%) | 1 (25.0%) |
| 8:30 AM to 8:59 AM | 0 (0.0%) | 0 (0.0%) |
| 9:00 AM to 9:59 AM | 0 (0.0%) | 1 (25.0%) |
| 10:00 AM to 10:59 AM | 0 (0.0%) | 0 (0.0%) |
| 11:00 AM to 11:59 AM | 0 (0.0%) | 0 (0.0%) |
| 12:00 PM to 3:59 PM | 0 (0.0%) | 0 (0.0%) |
| 4:00 PM to 11:59 PM | 0 (0.0%) | 0 (0.0%) |
| Total | 5 (100.0%) | 4 (100.0%) |
Housing Occupancy in Fenwick borough
Occupancy by Ownership in Fenwick borough
Of the total 24 dwellings in Fenwick borough, owner-occupied units account for 23 (95.8%), while renter-occupied units make up 1 (4.2%).
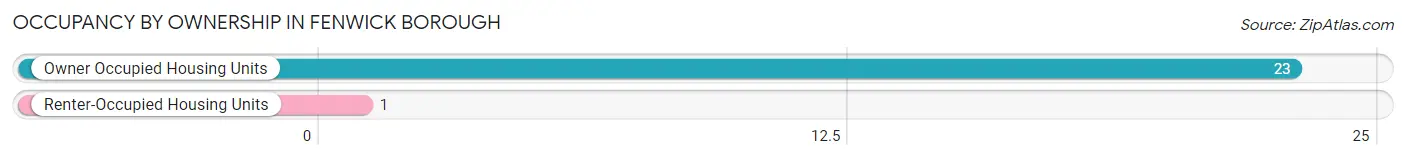
| Occupancy | # Housing Units | % Housing Units |
| Owner Occupied Housing Units | 23 | 95.8% |
| Renter-Occupied Housing Units | 1 | 4.2% |
| Total Occupied Housing Units | 24 | 100.0% |
Occupancy by Household Size in Fenwick borough
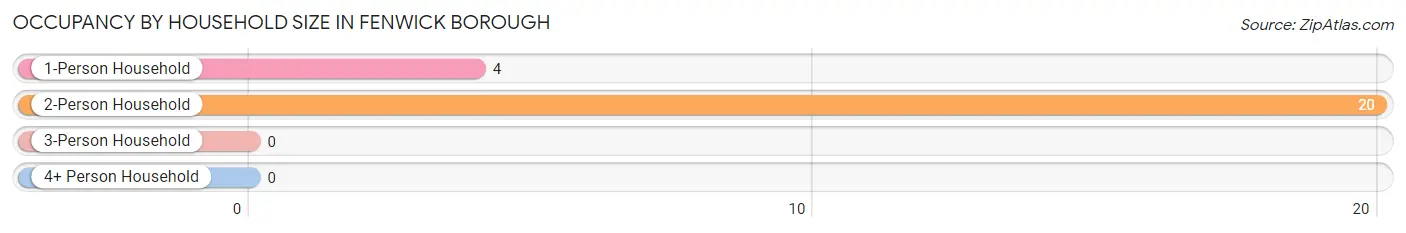
| Household Size | # Housing Units | % Housing Units |
| 1-Person Household | 4 | 16.7% |
| 2-Person Household | 20 | 83.3% |
| 3-Person Household | 0 | 0.0% |
| 4+ Person Household | 0 | 0.0% |
| Total Housing Units | 24 | 100.0% |
Occupancy by Ownership by Household Size in Fenwick borough
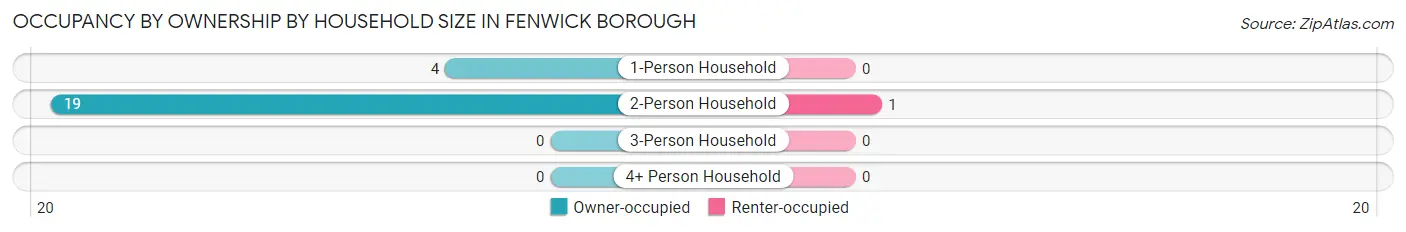
| Household Size | Owner-occupied | Renter-occupied |
| 1-Person Household | 4 (100.0%) | 0 (0.0%) |
| 2-Person Household | 19 (95.0%) | 1 (5.0%) |
| 3-Person Household | 0 (0.0%) | 0 (0.0%) |
| 4+ Person Household | 0 (0.0%) | 0 (0.0%) |
| Total Housing Units | 23 (95.8%) | 1 (4.2%) |
Occupancy by Educational Attainment in Fenwick borough
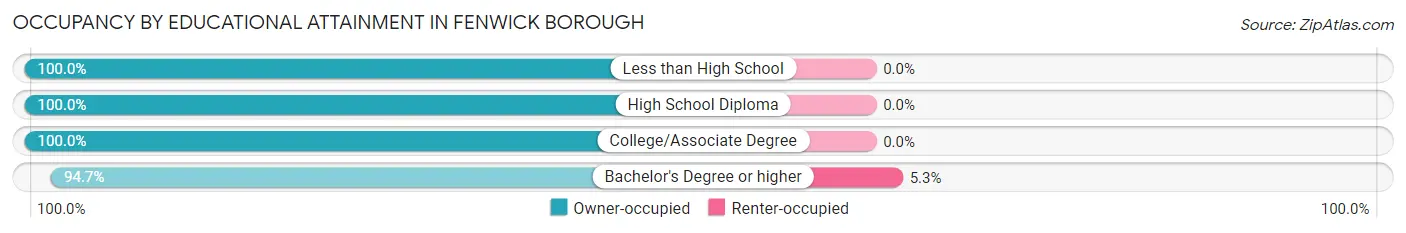
| Household Size | Owner-occupied | Renter-occupied |
| Less than High School | 2 (100.0%) | 0 (0.0%) |
| High School Diploma | 1 (100.0%) | 0 (0.0%) |
| College/Associate Degree | 2 (100.0%) | 0 (0.0%) |
| Bachelor's Degree or higher | 18 (94.7%) | 1 (5.3%) |
Occupancy by Age of Householder in Fenwick borough
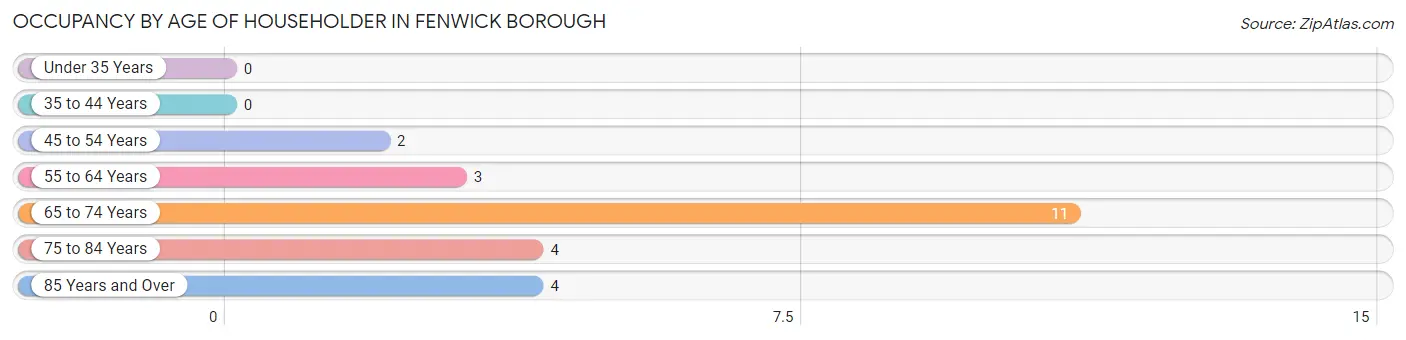
| Age Bracket | # Households | % Households |
| Under 35 Years | 0 | 0.0% |
| 35 to 44 Years | 0 | 0.0% |
| 45 to 54 Years | 2 | 8.3% |
| 55 to 64 Years | 3 | 12.5% |
| 65 to 74 Years | 11 | 45.8% |
| 75 to 84 Years | 4 | 16.7% |
| 85 Years and Over | 4 | 16.7% |
| Total | 24 | 100.0% |
Housing Finances in Fenwick borough
Median Income by Occupancy in Fenwick borough
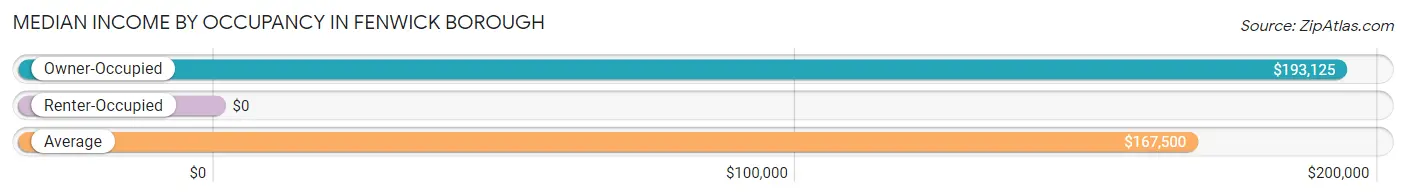
| Occupancy Type | # Households | Median Income |
| Owner-Occupied | 23 (95.8%) | $193,125 |
| Renter-Occupied | 1 (4.2%) | $0 |
| Average | 24 (100.0%) | $167,500 |
Occupancy by Householder Income Bracket in Fenwick borough
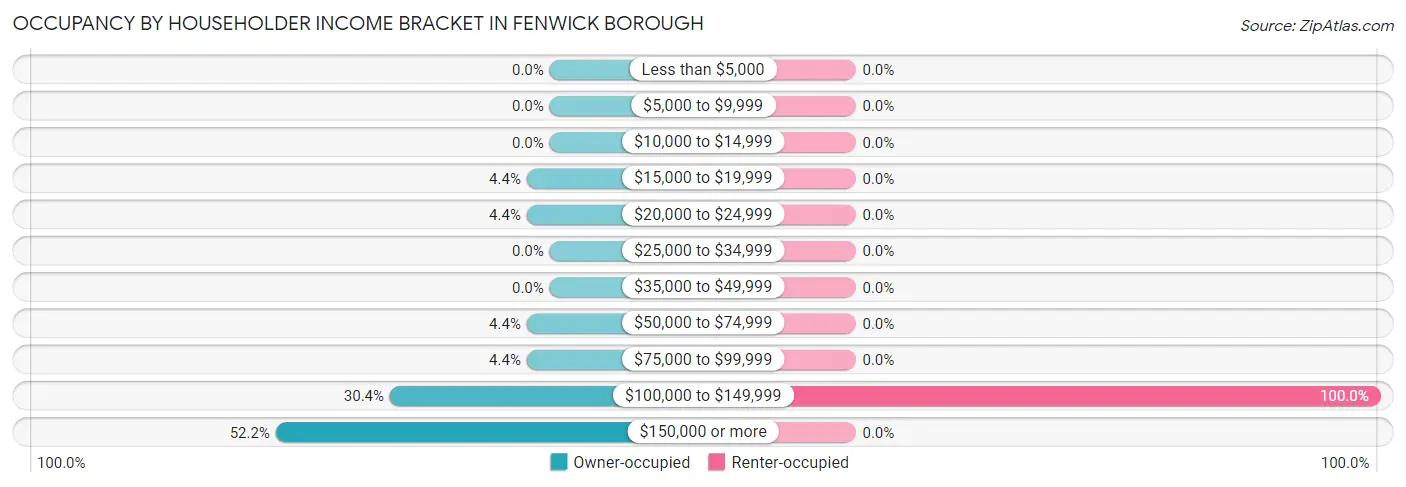
| Income Bracket | Owner-occupied | Renter-occupied |
| Less than $5,000 | 0 (0.0%) | 0 (0.0%) |
| $5,000 to $9,999 | 0 (0.0%) | 0 (0.0%) |
| $10,000 to $14,999 | 0 (0.0%) | 0 (0.0%) |
| $15,000 to $19,999 | 1 (4.3%) | 0 (0.0%) |
| $20,000 to $24,999 | 1 (4.3%) | 0 (0.0%) |
| $25,000 to $34,999 | 0 (0.0%) | 0 (0.0%) |
| $35,000 to $49,999 | 0 (0.0%) | 0 (0.0%) |
| $50,000 to $74,999 | 1 (4.3%) | 0 (0.0%) |
| $75,000 to $99,999 | 1 (4.3%) | 0 (0.0%) |
| $100,000 to $149,999 | 7 (30.4%) | 1 (100.0%) |
| $150,000 or more | 12 (52.2%) | 0 (0.0%) |
| Total | 23 (100.0%) | 1 (100.0%) |
Monthly Housing Cost Tiers in Fenwick borough
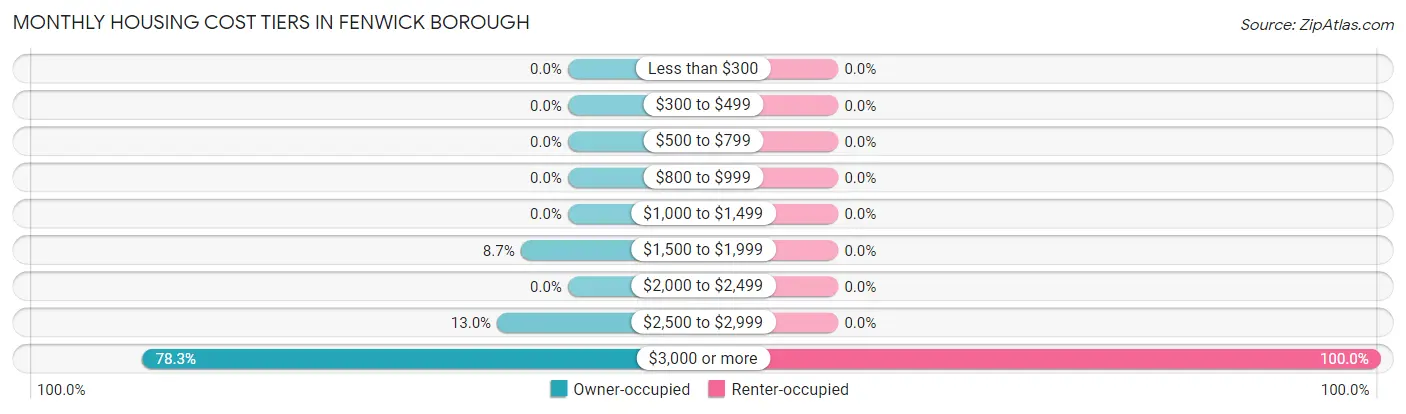
| Monthly Cost | Owner-occupied | Renter-occupied |
| Less than $300 | 0 (0.0%) | 0 (0.0%) |
| $300 to $499 | 0 (0.0%) | 0 (0.0%) |
| $500 to $799 | 0 (0.0%) | 0 (0.0%) |
| $800 to $999 | 0 (0.0%) | 0 (0.0%) |
| $1,000 to $1,499 | 0 (0.0%) | 0 (0.0%) |
| $1,500 to $1,999 | 2 (8.7%) | 0 (0.0%) |
| $2,000 to $2,499 | 0 (0.0%) | 0 (0.0%) |
| $2,500 to $2,999 | 3 (13.0%) | 0 (0.0%) |
| $3,000 or more | 18 (78.3%) | 1 (100.0%) |
| Total | 23 (100.0%) | 1 (100.0%) |
Physical Housing Characteristics in Fenwick borough
Housing Structures in Fenwick borough
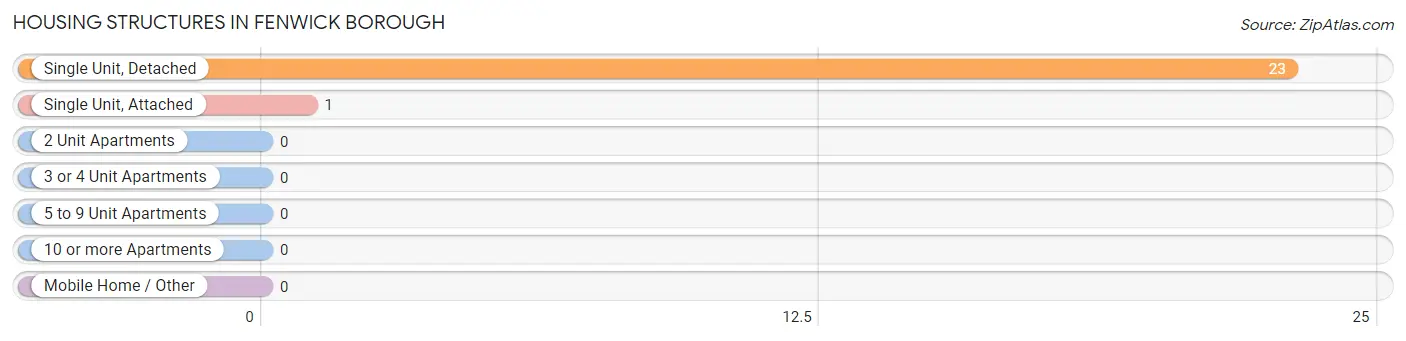
| Structure Type | # Housing Units | % Housing Units |
| Single Unit, Detached | 23 | 95.8% |
| Single Unit, Attached | 1 | 4.2% |
| 2 Unit Apartments | 0 | 0.0% |
| 3 or 4 Unit Apartments | 0 | 0.0% |
| 5 to 9 Unit Apartments | 0 | 0.0% |
| 10 or more Apartments | 0 | 0.0% |
| Mobile Home / Other | 0 | 0.0% |
| Total | 24 | 100.0% |
Housing Structures by Occupancy in Fenwick borough
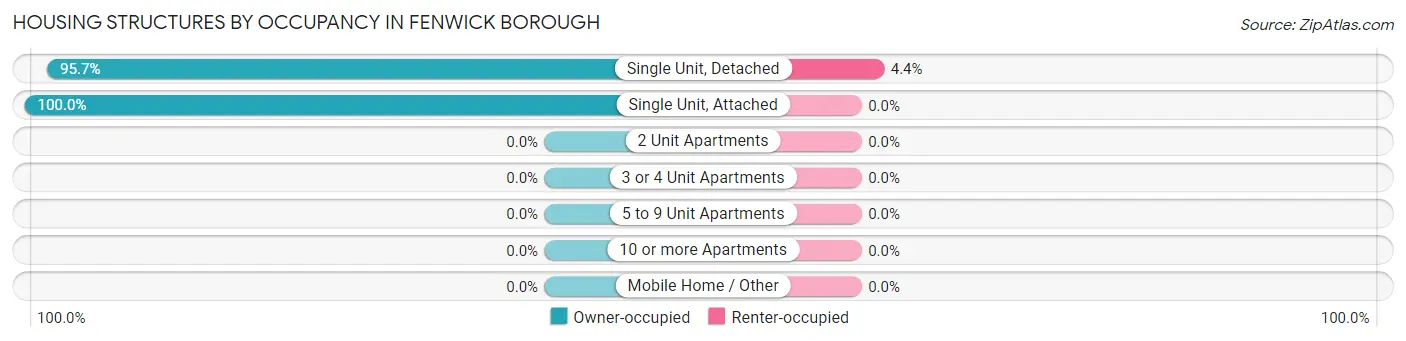
| Structure Type | Owner-occupied | Renter-occupied |
| Single Unit, Detached | 22 (95.7%) | 1 (4.3%) |
| Single Unit, Attached | 1 (100.0%) | 0 (0.0%) |
| 2 Unit Apartments | 0 (0.0%) | 0 (0.0%) |
| 3 or 4 Unit Apartments | 0 (0.0%) | 0 (0.0%) |
| 5 to 9 Unit Apartments | 0 (0.0%) | 0 (0.0%) |
| 10 or more Apartments | 0 (0.0%) | 0 (0.0%) |
| Mobile Home / Other | 0 (0.0%) | 0 (0.0%) |
| Total | 23 (95.8%) | 1 (4.2%) |
Housing Structures by Number of Rooms in Fenwick borough
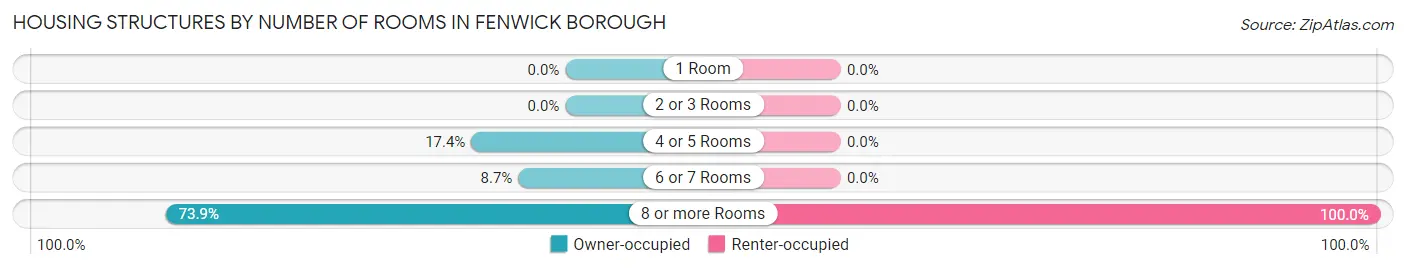
| Number of Rooms | Owner-occupied | Renter-occupied |
| 1 Room | 0 (0.0%) | 0 (0.0%) |
| 2 or 3 Rooms | 0 (0.0%) | 0 (0.0%) |
| 4 or 5 Rooms | 4 (17.4%) | 0 (0.0%) |
| 6 or 7 Rooms | 2 (8.7%) | 0 (0.0%) |
| 8 or more Rooms | 17 (73.9%) | 1 (100.0%) |
| Total | 23 (100.0%) | 1 (100.0%) |
Housing Structure by Heating Type in Fenwick borough
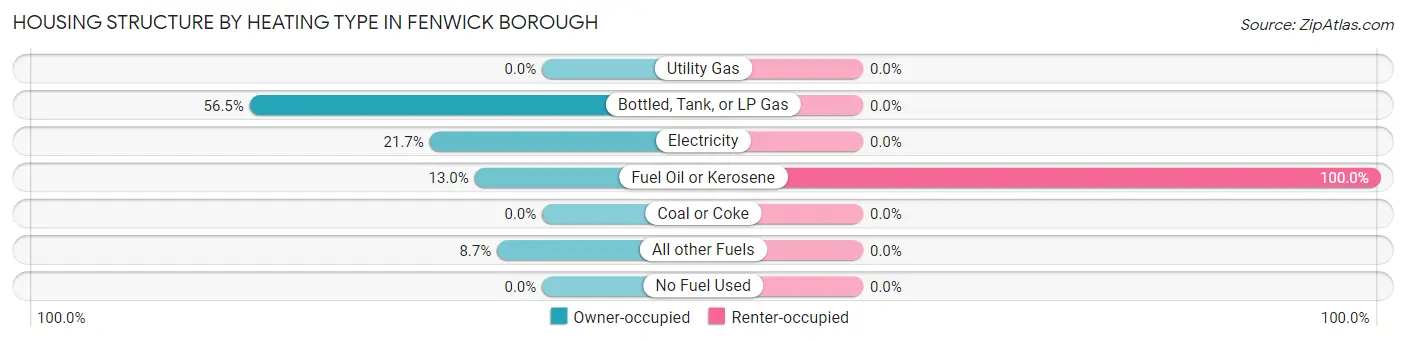
| Heating Type | Owner-occupied | Renter-occupied |
| Utility Gas | 0 (0.0%) | 0 (0.0%) |
| Bottled, Tank, or LP Gas | 13 (56.5%) | 0 (0.0%) |
| Electricity | 5 (21.7%) | 0 (0.0%) |
| Fuel Oil or Kerosene | 3 (13.0%) | 1 (100.0%) |
| Coal or Coke | 0 (0.0%) | 0 (0.0%) |
| All other Fuels | 2 (8.7%) | 0 (0.0%) |
| No Fuel Used | 0 (0.0%) | 0 (0.0%) |
| Total | 23 (100.0%) | 1 (100.0%) |
Household Vehicle Usage in Fenwick borough
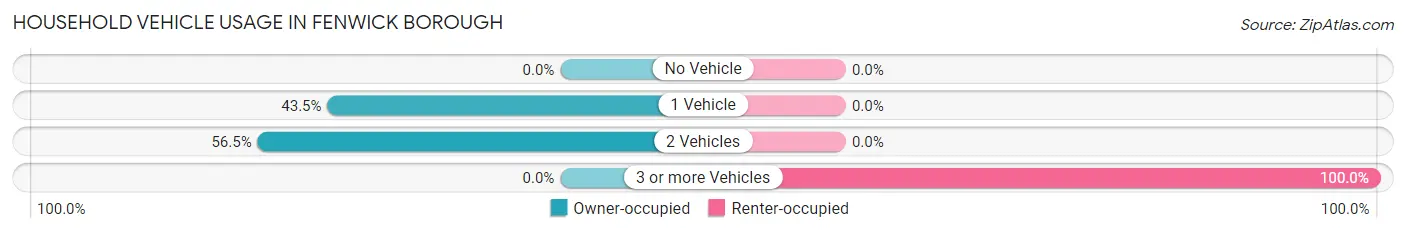
| Vehicles per Household | Owner-occupied | Renter-occupied |
| No Vehicle | 0 (0.0%) | 0 (0.0%) |
| 1 Vehicle | 10 (43.5%) | 0 (0.0%) |
| 2 Vehicles | 13 (56.5%) | 0 (0.0%) |
| 3 or more Vehicles | 0 (0.0%) | 1 (100.0%) |
| Total | 23 (100.0%) | 1 (100.0%) |
Real Estate & Mortgages in Fenwick borough
Real Estate and Mortgage Overview in Fenwick borough
| Characteristic | Without Mortgage | With Mortgage |
| Housing Units | 16 | 7 |
| Median Property Value | $2,000,001 | $2,000,001 |
| Median Household Income | $167,500 | $4 |
| Monthly Housing Costs | $1,501 | $6 |
| Real Estate Taxes | $10,001 | $0 |
Property Value by Mortgage Status in Fenwick borough
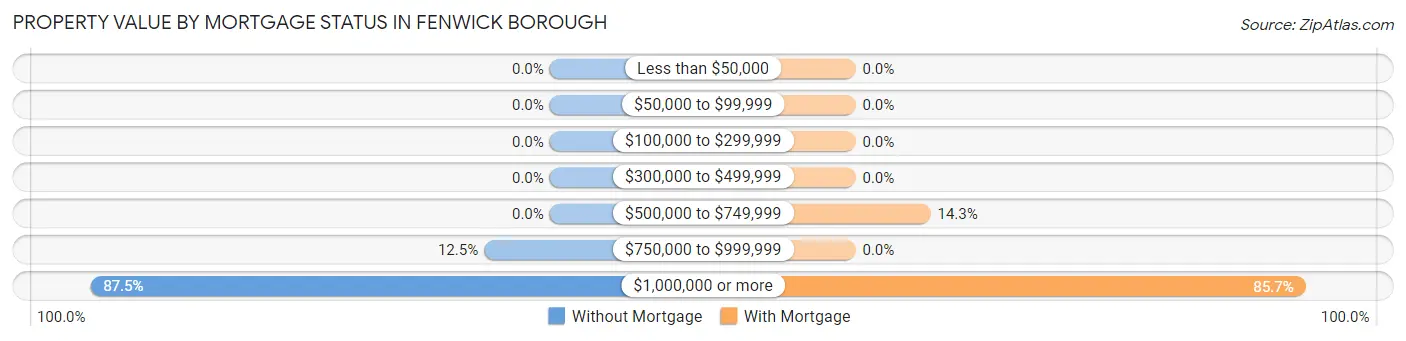
| Property Value | Without Mortgage | With Mortgage |
| Less than $50,000 | 0 (0.0%) | 0 (0.0%) |
| $50,000 to $99,999 | 0 (0.0%) | 0 (0.0%) |
| $100,000 to $299,999 | 0 (0.0%) | 0 (0.0%) |
| $300,000 to $499,999 | 0 (0.0%) | 0 (0.0%) |
| $500,000 to $749,999 | 0 (0.0%) | 1 (14.3%) |
| $750,000 to $999,999 | 2 (12.5%) | 0 (0.0%) |
| $1,000,000 or more | 14 (87.5%) | 6 (85.7%) |
| Total | 16 (100.0%) | 7 (100.0%) |
Household Income by Mortgage Status in Fenwick borough
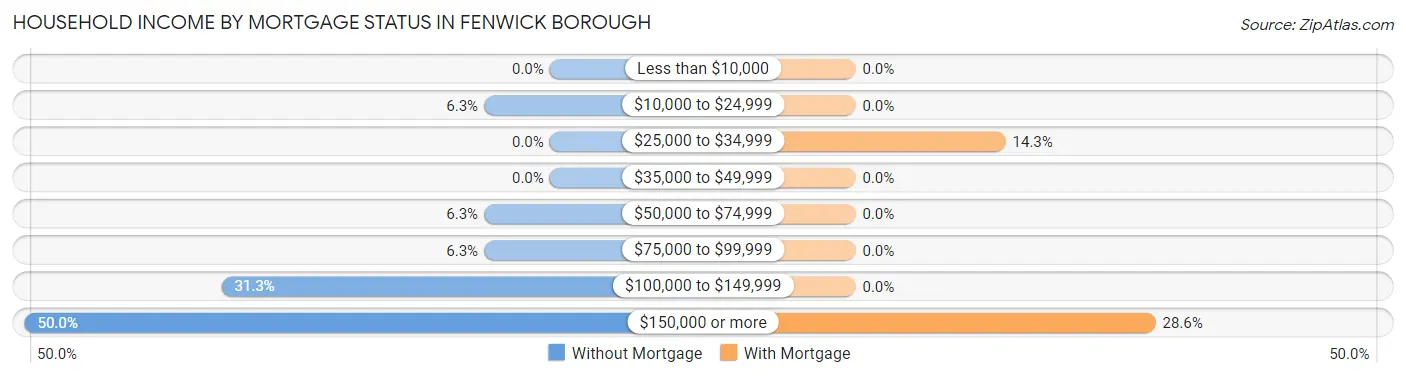
| Household Income | Without Mortgage | With Mortgage |
| Less than $10,000 | 0 (0.0%) | 0 (0.0%) |
| $10,000 to $24,999 | 1 (6.2%) | 0 (0.0%) |
| $25,000 to $34,999 | 0 (0.0%) | 1 (14.3%) |
| $35,000 to $49,999 | 0 (0.0%) | 0 (0.0%) |
| $50,000 to $74,999 | 1 (6.2%) | 0 (0.0%) |
| $75,000 to $99,999 | 1 (6.2%) | 0 (0.0%) |
| $100,000 to $149,999 | 5 (31.2%) | 0 (0.0%) |
| $150,000 or more | 8 (50.0%) | 2 (28.6%) |
| Total | 16 (100.0%) | 7 (100.0%) |
Property Value to Household Income Ratio in Fenwick borough
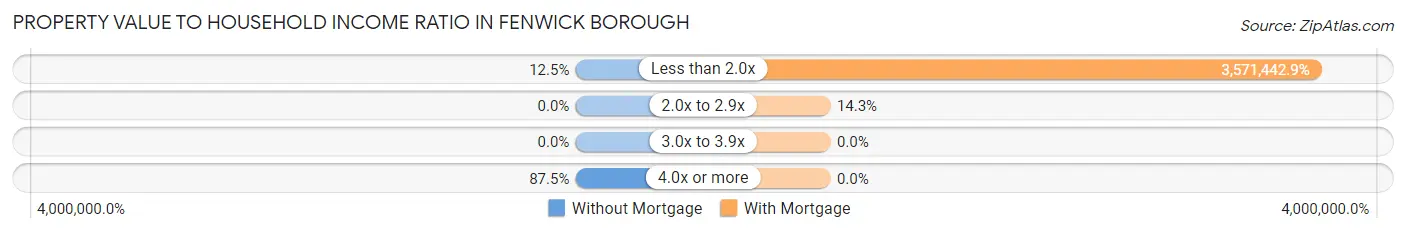
| Value-to-Income Ratio | Without Mortgage | With Mortgage |
| Less than 2.0x | 2 (12.5%) | 250,001 (3,571,442.9%) |
| 2.0x to 2.9x | 0 (0.0%) | 1 (14.3%) |
| 3.0x to 3.9x | 0 (0.0%) | 0 (0.0%) |
| 4.0x or more | 14 (87.5%) | 0 (0.0%) |
| Total | 16 (100.0%) | 7 (100.0%) |
Real Estate Taxes by Mortgage Status in Fenwick borough
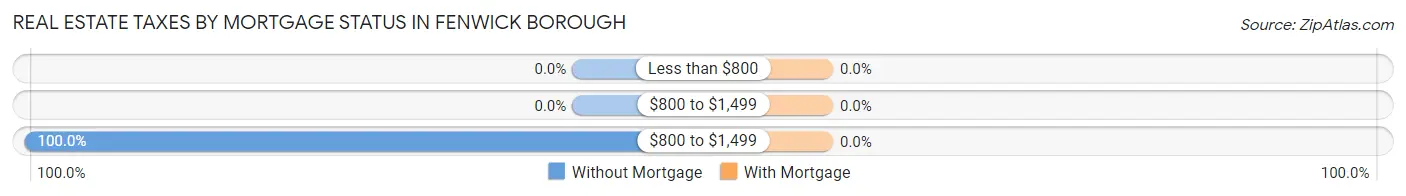
| Property Taxes | Without Mortgage | With Mortgage |
| Less than $800 | 0 (0.0%) | 0 (0.0%) |
| $800 to $1,499 | 0 (0.0%) | 0 (0.0%) |
| $800 to $1,499 | 16 (100.0%) | 0 (0.0%) |
| Total | 16 (100.0%) | 7 (100.0%) |
Health & Disability in Fenwick borough
Health Insurance Coverage by Age in Fenwick borough
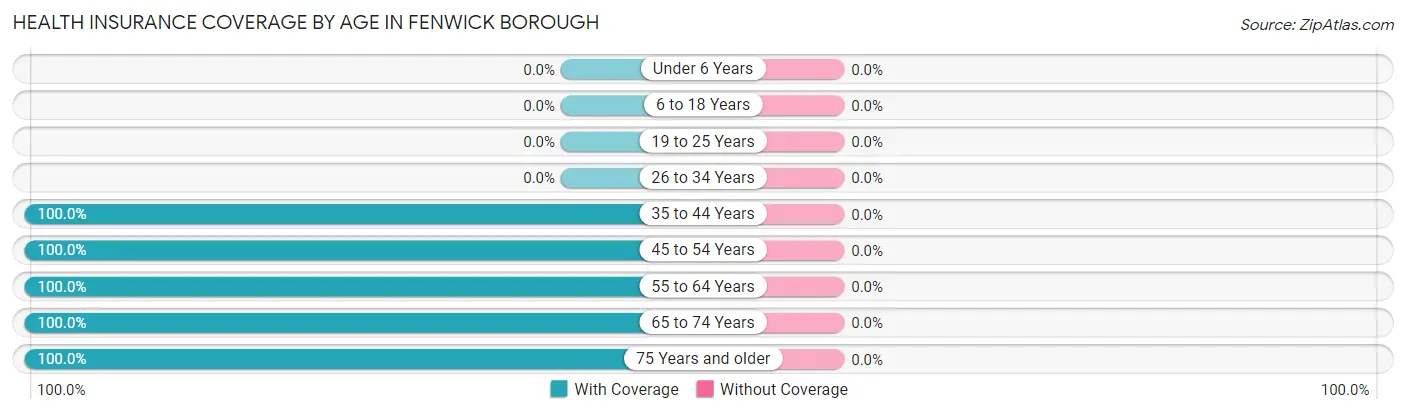
| Age Bracket | With Coverage | Without Coverage |
| Under 6 Years | 0 (0.0%) | 0 (0.0%) |
| 6 to 18 Years | 0 (0.0%) | 0 (0.0%) |
| 19 to 25 Years | 0 (0.0%) | 0 (0.0%) |
| 26 to 34 Years | 0 (0.0%) | 0 (0.0%) |
| 35 to 44 Years | 2 (100.0%) | 0 (0.0%) |
| 45 to 54 Years | 2 (100.0%) | 0 (0.0%) |
| 55 to 64 Years | 4 (100.0%) | 0 (0.0%) |
| 65 to 74 Years | 17 (100.0%) | 0 (0.0%) |
| 75 Years and older | 15 (100.0%) | 0 (0.0%) |
| Total | 40 (100.0%) | 0 (0.0%) |
Health Insurance Coverage by Citizenship Status in Fenwick borough
| Citizenship Status | With Coverage | Without Coverage |
| Native Born | 0 (0.0%) | 0 (0.0%) |
| Foreign Born, Citizen | 0 (0.0%) | 0 (0.0%) |
| Foreign Born, not a Citizen | 0 (0.0%) | 0 (0.0%) |
Health Insurance Coverage by Household Income in Fenwick borough
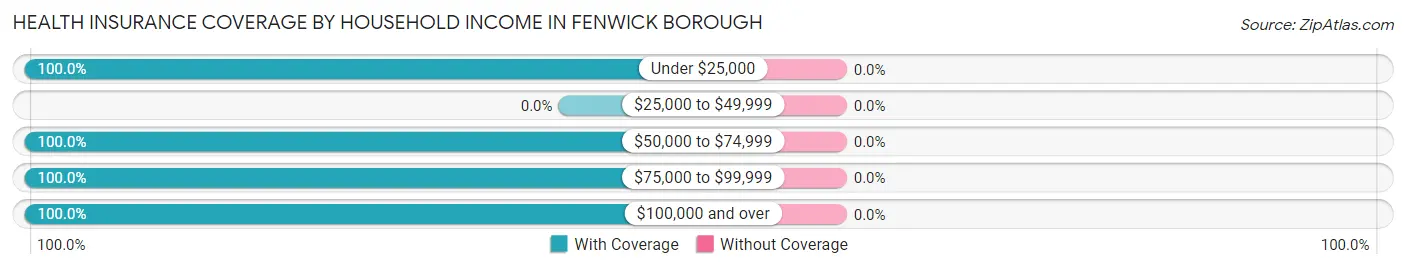
| Household Income | With Coverage | Without Coverage |
| Under $25,000 | 2 (100.0%) | 0 (0.0%) |
| $25,000 to $49,999 | 0 (0.0%) | 0 (0.0%) |
| $50,000 to $74,999 | 1 (100.0%) | 0 (0.0%) |
| $75,000 to $99,999 | 2 (100.0%) | 0 (0.0%) |
| $100,000 and over | 35 (100.0%) | 0 (0.0%) |
Public vs Private Health Insurance Coverage by Age in Fenwick borough
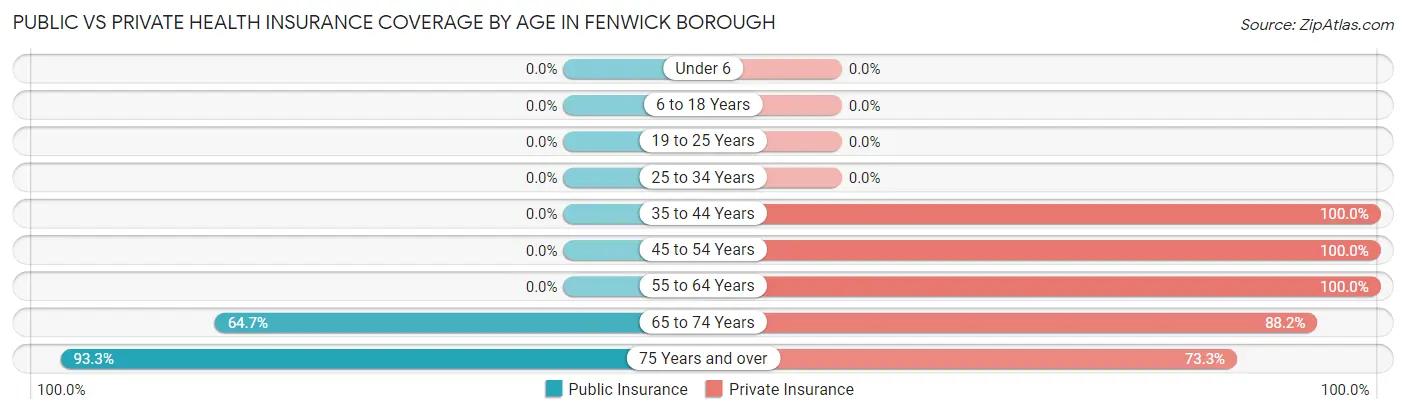
| Age Bracket | Public Insurance | Private Insurance |
| Under 6 | 0 (0.0%) | 0 (0.0%) |
| 6 to 18 Years | 0 (0.0%) | 0 (0.0%) |
| 19 to 25 Years | 0 (0.0%) | 0 (0.0%) |
| 25 to 34 Years | 0 (0.0%) | 0 (0.0%) |
| 35 to 44 Years | 0 (0.0%) | 2 (100.0%) |
| 45 to 54 Years | 0 (0.0%) | 2 (100.0%) |
| 55 to 64 Years | 0 (0.0%) | 4 (100.0%) |
| 65 to 74 Years | 11 (64.7%) | 15 (88.2%) |
| 75 Years and over | 14 (93.3%) | 11 (73.3%) |
| Total | 25 (62.5%) | 34 (85.0%) |
Disability Status by Sex by Age in Fenwick borough
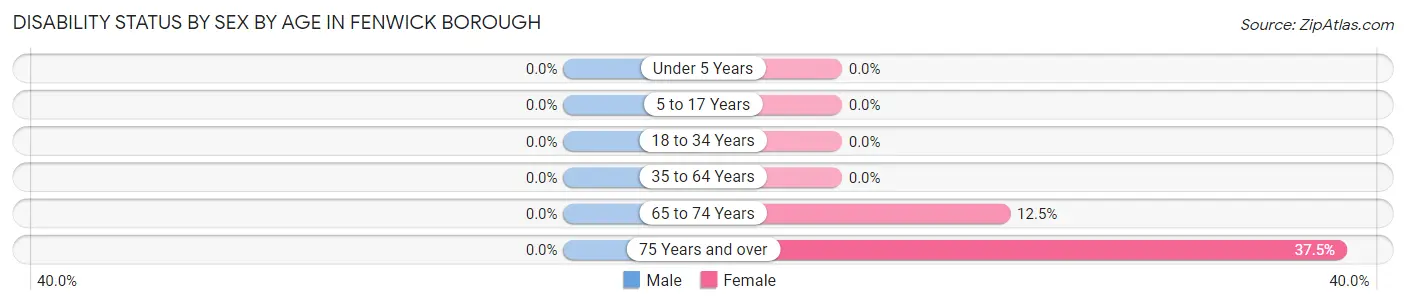
| Age Bracket | Male | Female |
| Under 5 Years | 0 (0.0%) | 0 (0.0%) |
| 5 to 17 Years | 0 (0.0%) | 0 (0.0%) |
| 18 to 34 Years | 0 (0.0%) | 0 (0.0%) |
| 35 to 64 Years | 0 (0.0%) | 0 (0.0%) |
| 65 to 74 Years | 0 (0.0%) | 1 (12.5%) |
| 75 Years and over | 0 (0.0%) | 3 (37.5%) |
Disability Class by Sex by Age in Fenwick borough
Disability Class: Hearing Difficulty
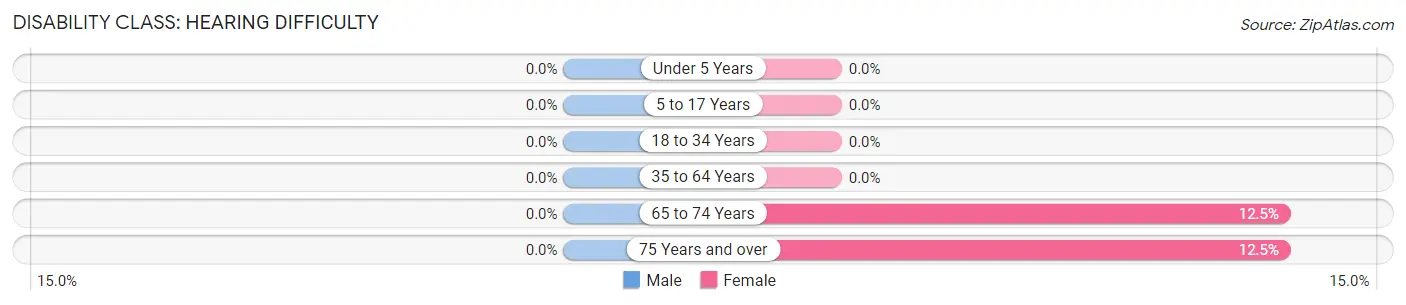
| Age Bracket | Male | Female |
| Under 5 Years | 0 (0.0%) | 0 (0.0%) |
| 5 to 17 Years | 0 (0.0%) | 0 (0.0%) |
| 18 to 34 Years | 0 (0.0%) | 0 (0.0%) |
| 35 to 64 Years | 0 (0.0%) | 0 (0.0%) |
| 65 to 74 Years | 0 (0.0%) | 1 (12.5%) |
| 75 Years and over | 0 (0.0%) | 1 (12.5%) |
Disability Class: Vision Difficulty
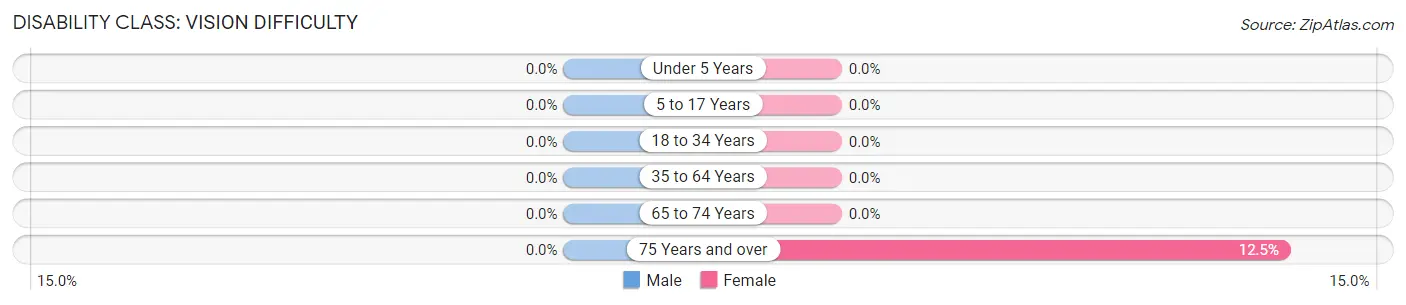
| Age Bracket | Male | Female |
| Under 5 Years | 0 (0.0%) | 0 (0.0%) |
| 5 to 17 Years | 0 (0.0%) | 0 (0.0%) |
| 18 to 34 Years | 0 (0.0%) | 0 (0.0%) |
| 35 to 64 Years | 0 (0.0%) | 0 (0.0%) |
| 65 to 74 Years | 0 (0.0%) | 0 (0.0%) |
| 75 Years and over | 0 (0.0%) | 1 (12.5%) |
Disability Class: Cognitive Difficulty
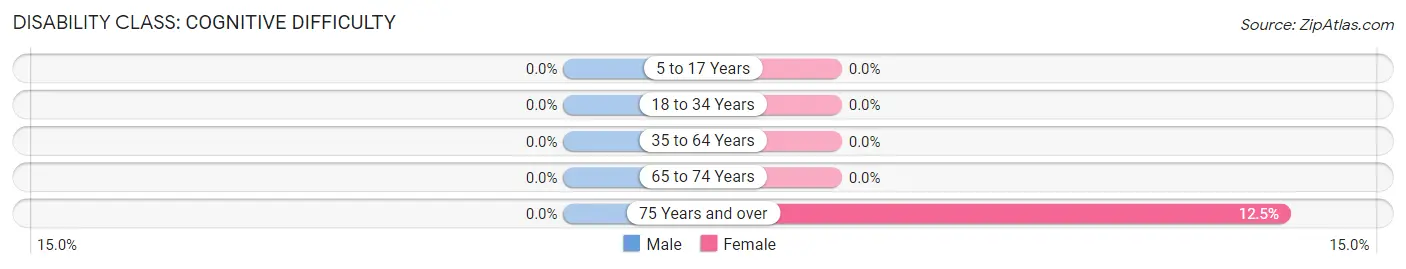
| Age Bracket | Male | Female |
| 5 to 17 Years | 0 (0.0%) | 0 (0.0%) |
| 18 to 34 Years | 0 (0.0%) | 0 (0.0%) |
| 35 to 64 Years | 0 (0.0%) | 0 (0.0%) |
| 65 to 74 Years | 0 (0.0%) | 0 (0.0%) |
| 75 Years and over | 0 (0.0%) | 1 (12.5%) |
Disability Class: Ambulatory Difficulty
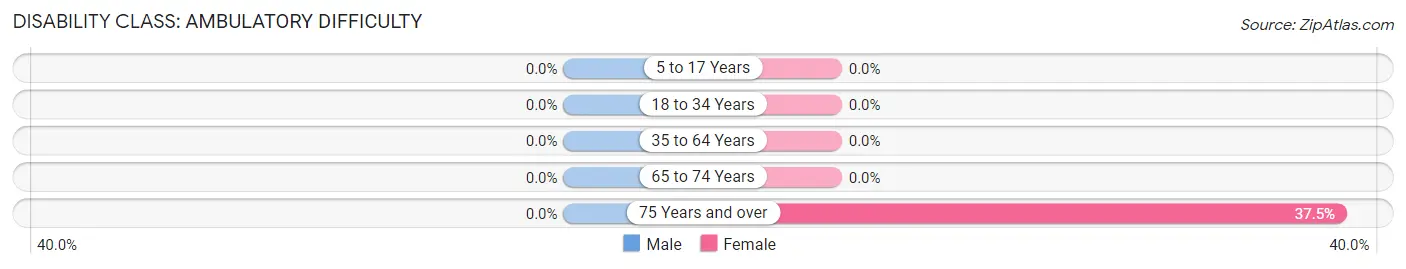
| Age Bracket | Male | Female |
| 5 to 17 Years | 0 (0.0%) | 0 (0.0%) |
| 18 to 34 Years | 0 (0.0%) | 0 (0.0%) |
| 35 to 64 Years | 0 (0.0%) | 0 (0.0%) |
| 65 to 74 Years | 0 (0.0%) | 0 (0.0%) |
| 75 Years and over | 0 (0.0%) | 3 (37.5%) |
Disability Class: Self-Care Difficulty
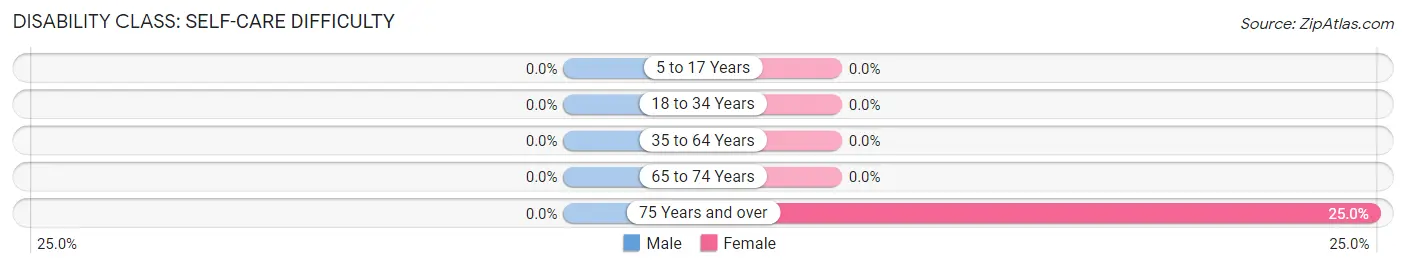
| Age Bracket | Male | Female |
| 5 to 17 Years | 0 (0.0%) | 0 (0.0%) |
| 18 to 34 Years | 0 (0.0%) | 0 (0.0%) |
| 35 to 64 Years | 0 (0.0%) | 0 (0.0%) |
| 65 to 74 Years | 0 (0.0%) | 0 (0.0%) |
| 75 Years and over | 0 (0.0%) | 2 (25.0%) |
Technology Access in Fenwick borough
Computing Device Access in Fenwick borough
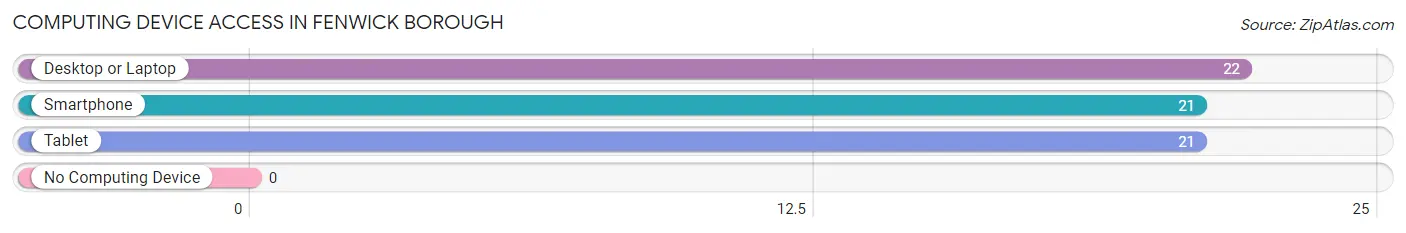
| Device Type | # Households | % Households |
| Desktop or Laptop | 22 | 91.7% |
| Smartphone | 21 | 87.5% |
| Tablet | 21 | 87.5% |
| No Computing Device | 0 | 0.0% |
| Total | 24 | 100.0% |
Internet Access in Fenwick borough
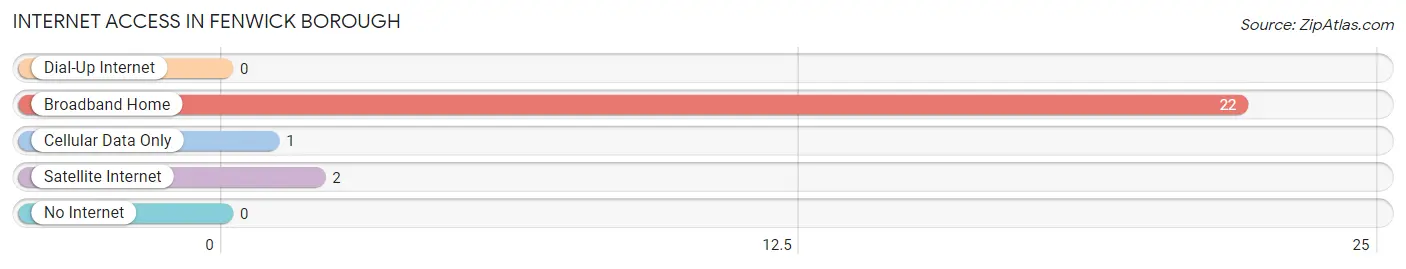
| Internet Type | # Households | % Households |
| Dial-Up Internet | 0 | 0.0% |
| Broadband Home | 22 | 91.7% |
| Cellular Data Only | 1 | 4.2% |
| Satellite Internet | 2 | 8.3% |
| No Internet | 0 | 0.0% |
| Total | 24 | 100.0% |
Fenwick borough Summary
Fenwick Borough is a small town located in New Haven County, Connecticut. It is situated on the Long Island Sound, and is bordered by the towns of East Haven, Branford, and North Branford. The town was incorporated in 1871 and has a population of approximately 2,500 people.
Geography
Fenwick Borough is located in the southeastern corner of Connecticut, and is bordered by the towns of East Haven, Branford, and North Branford. The town is situated on the Long Island Sound, and is approximately 8 miles from New Haven. The town is made up of two distinct sections, the “Upper” and “Lower” sections. The Upper section is located on the east side of the town and is made up of mostly residential neighborhoods. The Lower section is located on the west side of the town and is made up of mostly commercial and industrial areas. The town is also home to a number of parks and recreational areas, including the Fenwick Beach State Park, which is located on the Long Island Sound.
History
Fenwick Borough was originally part of the town of Branford, and was known as “Fenwick’s Farms”. The area was first settled in the early 1700s by the Fenwick family, who were among the first settlers in the area. The town was officially incorporated in 1871, and was named after the Fenwick family. The town was originally a farming community, but in the late 1800s, the town began to develop into a more industrial area. The town was home to a number of factories, including a paper mill, a brickyard, and a tannery. The town also had a number of stores and businesses, including a post office, a bank, and a hotel.
Economy
Fenwick Borough’s economy is largely based on the service industry. The town is home to a number of restaurants, retail stores, and other businesses. The town is also home to a number of manufacturing companies, including a paper mill, a brickyard, and a tannery. The town is also home to a number of medical facilities, including a hospital and a number of medical offices.
Demographics
As of the 2010 census, Fenwick Borough had a population of 2,500 people. The racial makeup of the town was 94.2% White, 2.2% African American, 0.4% Native American, 0.8% Asian, 0.2% Pacific Islander, and 1.4% from other races. The median household income in the town was $60,000, and the median family income was $68,000. The town also had a poverty rate of 8.3%.
Conclusion
Fenwick Borough is a small town located in New Haven County, Connecticut. It is situated on the Long Island Sound, and is bordered by the towns of East Haven, Branford, and North Branford. The town was incorporated in 1871 and has a population of approximately 2,500 people. The town’s economy is largely based on the service industry, and it is home to a number of manufacturing companies, medical facilities, and other businesses. The town has a diverse population, with a median household income of $60,000 and a poverty rate of 8.3%.
Common Questions
What is Per Capita Income in Fenwick borough?
Per Capita income in Fenwick borough is $233,490.
What is the Median Family Income in Fenwick borough?
Median Family Income in Fenwick borough is $194,375.
What is the Median Household income in Fenwick borough?
Median Household Income in Fenwick borough is $167,500.
What is Inequality or Gini Index in Fenwick borough?
Inequality or Gini Index in Fenwick borough is 0.58.
What is the Total Population of Fenwick borough?
Total Population of Fenwick borough is 40.
What is the Total Male Population of Fenwick borough?
Total Male Population of Fenwick borough is 18.
What is the Total Female Population of Fenwick borough?
Total Female Population of Fenwick borough is 22.
What is the Ratio of Males per 100 Females in Fenwick borough?
There are 81.82 Males per 100 Females in Fenwick borough.
What is the Ratio of Females per 100 Males in Fenwick borough?
There are 122.22 Females per 100 Males in Fenwick borough.
What is the Median Population Age in Fenwick borough?
Median Population Age in Fenwick borough is 73.3 Years.
What is the Average Family Size in Fenwick borough
Average Family Size in Fenwick borough is 1.8 People.
What is the Average Household Size in Fenwick borough
Average Household Size in Fenwick borough is 1.7 People.
How Large is the Labor Force in Fenwick borough?
There are 17 People in the Labor Forcein in Fenwick borough.
What is the Percentage of People in the Labor Force in Fenwick borough?
42.5% of People are in the Labor Force in Fenwick borough.