Zip Codes with the Highest Percentage of Population Employed in Computer, Engineering & Science in Connecticut
RELATED REPORTS & OPTIONS
Computer, Engineering & Science
Connecticut
Compare Zip Codes
Map of Zip Codes with the Highest Percentage of Population Employed in Computer, Engineering & Science in Connecticut
0.0%
40.0%
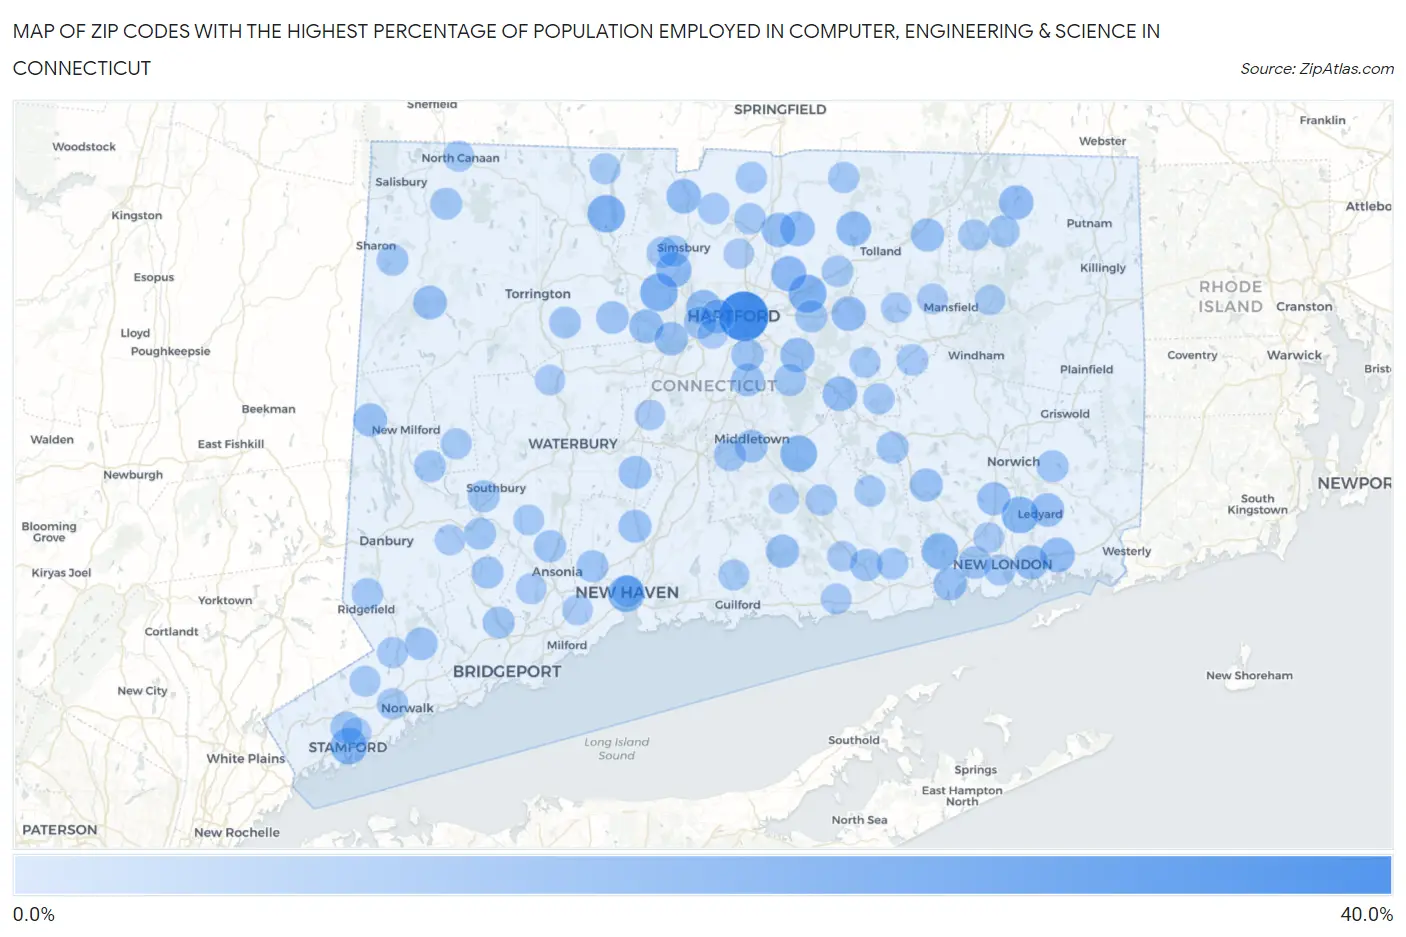
Zip Codes with the Highest Percentage of Population Employed in Computer, Engineering & Science in Connecticut
| Zip Code | % Employed | vs State | vs National | |
| 1. | 06103 | 32.7% | 7.2% (+25.5)#1 | 6.8% (+26.0)#148 |
| 2. | 06042 | 17.4% | 7.2% (+10.2)#2 | 6.8% (+10.7)#758 |
| 3. | 06001 | 17.2% | 7.2% (+9.99)#3 | 6.8% (+10.5)#790 |
| 4. | 06063 | 17.0% | 7.2% (+9.81)#4 | 6.8% (+10.3)#808 |
| 5. | 06456 | 15.8% | 7.2% (+8.60)#5 | 6.8% (+9.06)#986 |
| 6. | 06901 | 15.8% | 7.2% (+8.58)#6 | 6.8% (+9.05)#987 |
| 7. | 06335 | 15.8% | 7.2% (+8.54)#7 | 6.8% (+9.01)#997 |
| 8. | 06510 | 15.7% | 7.2% (+8.51)#8 | 6.8% (+8.97)#1,001 |
| 9. | 06333 | 15.5% | 7.2% (+8.29)#9 | 6.8% (+8.76)#1,024 |
| 10. | 06089 | 14.1% | 7.2% (+6.90)#10 | 6.8% (+7.37)#1,306 |
| 11. | 06074 | 14.1% | 7.2% (+6.83)#11 | 6.8% (+7.30)#1,321 |
| 12. | 06117 | 13.9% | 7.2% (+6.65)#12 | 6.8% (+7.11)#1,382 |
| 13. | 06029 | 13.6% | 7.2% (+6.34)#13 | 6.8% (+6.81)#1,456 |
| 14. | 06355 | 13.4% | 7.2% (+6.22)#14 | 6.8% (+6.68)#1,495 |
| 15. | 06016 | 13.4% | 7.2% (+6.21)#15 | 6.8% (+6.68)#1,498 |
| 16. | 06447 | 13.2% | 7.2% (+6.00)#16 | 6.8% (+6.47)#1,560 |
| 17. | 06043 | 13.2% | 7.2% (+5.96)#17 | 6.8% (+6.43)#1,571 |
| 18. | 06035 | 13.1% | 7.2% (+5.88)#18 | 6.8% (+6.35)#1,596 |
| 19. | 06282 | 13.1% | 7.2% (+5.82)#19 | 6.8% (+6.29)#1,633 |
| 20. | 06033 | 12.9% | 7.2% (+5.64)#20 | 6.8% (+6.11)#1,689 |
| 21. | 06088 | 12.9% | 7.2% (+5.63)#21 | 6.8% (+6.09)#1,693 |
| 22. | 06340 | 12.7% | 7.2% (+5.50)#22 | 6.8% (+5.97)#1,735 |
| 23. | 06085 | 12.5% | 7.2% (+5.29)#23 | 6.8% (+5.75)#1,812 |
| 24. | 06754 | 12.1% | 7.2% (+4.92)#24 | 6.8% (+5.38)#1,965 |
| 25. | 06119 | 12.1% | 7.2% (+4.87)#25 | 6.8% (+5.34)#1,990 |
| 26. | 06339 | 11.9% | 7.2% (+4.72)#26 | 6.8% (+5.18)#2,056 |
| 27. | 06032 | 11.9% | 7.2% (+4.64)#27 | 6.8% (+5.11)#2,097 |
| 28. | 06784 | 11.7% | 7.2% (+4.44)#28 | 6.8% (+4.91)#2,196 |
| 29. | 06357 | 11.7% | 7.2% (+4.42)#29 | 6.8% (+4.89)#2,207 |
| 30. | 06419 | 11.5% | 7.2% (+4.29)#30 | 6.8% (+4.76)#2,287 |
| 31. | 06382 | 11.5% | 7.2% (+4.26)#31 | 6.8% (+4.72)#2,305 |
| 32. | 06279 | 11.4% | 7.2% (+4.22)#32 | 6.8% (+4.68)#2,328 |
| 33. | 06420 | 11.4% | 7.2% (+4.20)#33 | 6.8% (+4.66)#2,339 |
| 34. | 06518 | 11.3% | 7.2% (+4.04)#34 | 6.8% (+4.51)#2,426 |
| 35. | 06410 | 11.2% | 7.2% (+3.94)#35 | 6.8% (+4.41)#2,473 |
| 36. | 06067 | 10.9% | 7.2% (+3.68)#36 | 6.8% (+4.15)#2,622 |
| 37. | 06385 | 10.9% | 7.2% (+3.65)#37 | 6.8% (+4.11)#2,639 |
| 38. | 06457 | 10.9% | 7.2% (+3.63)#38 | 6.8% (+4.10)#2,647 |
| 39. | 06013 | 10.8% | 7.2% (+3.61)#39 | 6.8% (+4.07)#2,657 |
| 40. | 06883 | 10.8% | 7.2% (+3.53)#40 | 6.8% (+3.99)#2,701 |
| 41. | 06109 | 10.6% | 7.2% (+3.42)#41 | 6.8% (+3.88)#2,764 |
| 42. | 06426 | 10.5% | 7.2% (+3.22)#42 | 6.8% (+3.69)#2,899 |
| 43. | 06107 | 10.4% | 7.2% (+3.16)#43 | 6.8% (+3.62)#2,941 |
| 44. | 06415 | 10.2% | 7.2% (+2.97)#44 | 6.8% (+3.44)#3,070 |
| 45. | 06483 | 10.2% | 7.2% (+2.97)#45 | 6.8% (+3.43)#3,076 |
| 46. | 06040 | 10.2% | 7.2% (+2.97)#46 | 6.8% (+3.43)#3,077 |
| 47. | 06073 | 10.2% | 7.2% (+2.96)#47 | 6.8% (+3.42)#3,083 |
| 48. | 06468 | 10.1% | 7.2% (+2.91)#48 | 6.8% (+3.38)#3,114 |
| 49. | 06482 | 10.1% | 7.2% (+2.90)#49 | 6.8% (+3.37)#3,126 |
| 50. | 06481 | 10.1% | 7.2% (+2.86)#50 | 6.8% (+3.33)#3,157 |
| 51. | 06525 | 10.0% | 7.2% (+2.81)#51 | 6.8% (+3.28)#3,180 |
| 52. | 06365 | 10.0% | 7.2% (+2.79)#52 | 6.8% (+3.25)#3,202 |
| 53. | 06752 | 9.9% | 7.2% (+2.67)#53 | 6.8% (+3.14)#3,300 |
| 54. | 06511 | 9.8% | 7.2% (+2.61)#54 | 6.8% (+3.08)#3,337 |
| 55. | 06488 | 9.8% | 7.2% (+2.54)#55 | 6.8% (+3.00)#3,392 |
| 56. | 06611 | 9.8% | 7.2% (+2.53)#56 | 6.8% (+2.99)#3,398 |
| 57. | 06031 | 9.7% | 7.2% (+2.44)#57 | 6.8% (+2.90)#3,465 |
| 58. | 06791 | 9.6% | 7.2% (+2.42)#58 | 6.8% (+2.88)#3,487 |
| 59. | 06242 | 9.6% | 7.2% (+2.42)#59 | 6.8% (+2.88)#3,489 |
| 60. | 06905 | 9.6% | 7.2% (+2.35)#60 | 6.8% (+2.82)#3,538 |
| 61. | 06069 | 9.5% | 7.2% (+2.31)#61 | 6.8% (+2.78)#3,566 |
| 62. | 06066 | 9.4% | 7.2% (+2.20)#62 | 6.8% (+2.67)#3,660 |
| 63. | 06237 | 9.4% | 7.2% (+2.13)#63 | 6.8% (+2.59)#3,732 |
| 64. | 06026 | 9.3% | 7.2% (+2.07)#64 | 6.8% (+2.54)#3,777 |
| 65. | 06092 | 9.3% | 7.2% (+2.07)#65 | 6.8% (+2.53)#3,782 |
| 66. | 06438 | 9.3% | 7.2% (+2.04)#66 | 6.8% (+2.51)#3,806 |
| 67. | 06371 | 9.3% | 7.2% (+2.04)#67 | 6.8% (+2.50)#3,807 |
| 68. | 06096 | 9.2% | 7.2% (+1.96)#68 | 6.8% (+2.42)#3,874 |
| 69. | 06850 | 9.1% | 7.2% (+1.90)#69 | 6.8% (+2.36)#3,934 |
| 70. | 06071 | 9.1% | 7.2% (+1.88)#70 | 6.8% (+2.35)#3,949 |
| 71. | 06070 | 9.1% | 7.2% (+1.88)#71 | 6.8% (+2.35)#3,950 |
| 72. | 06877 | 9.1% | 7.2% (+1.86)#72 | 6.8% (+2.32)#3,977 |
| 73. | 06231 | 9.0% | 7.2% (+1.80)#73 | 6.8% (+2.27)#4,033 |
| 74. | 06078 | 9.0% | 7.2% (+1.80)#74 | 6.8% (+2.26)#4,041 |
| 75. | 06320 | 9.0% | 7.2% (+1.73)#75 | 6.8% (+2.19)#4,109 |
| 76. | 06278 | 8.9% | 7.2% (+1.69)#76 | 6.8% (+2.16)#4,148 |
| 77. | 06091 | 8.9% | 7.2% (+1.66)#77 | 6.8% (+2.12)#4,185 |
| 78. | 06423 | 8.8% | 7.2% (+1.56)#78 | 6.8% (+2.03)#4,269 |
| 79. | 06018 | 8.7% | 7.2% (+1.50)#79 | 6.8% (+1.97)#4,323 |
| 80. | 06783 | 8.7% | 7.2% (+1.49)#80 | 6.8% (+1.96)#4,335 |
| 81. | 06897 | 8.7% | 7.2% (+1.45)#81 | 6.8% (+1.92)#4,393 |
| 82. | 06437 | 8.6% | 7.2% (+1.37)#82 | 6.8% (+1.83)#4,489 |
| 83. | 06840 | 8.6% | 7.2% (+1.35)#83 | 6.8% (+1.82)#4,513 |
| 84. | 06248 | 8.5% | 7.2% (+1.31)#84 | 6.8% (+1.78)#4,559 |
| 85. | 06478 | 8.5% | 7.2% (+1.23)#85 | 6.8% (+1.69)#4,656 |
| 86. | 06498 | 8.4% | 7.2% (+1.18)#86 | 6.8% (+1.64)#4,706 |
| 87. | 06484 | 8.3% | 7.2% (+1.10)#87 | 6.8% (+1.57)#4,801 |
| 88. | 06268 | 8.3% | 7.2% (+1.05)#88 | 6.8% (+1.52)#4,893 |
| 89. | 06417 | 8.3% | 7.2% (+1.04)#89 | 6.8% (+1.51)#4,906 |
| 90. | 06375 | 8.1% | 7.2% (+0.837)#90 | 6.8% (+1.30)#5,181 |
| 91. | 06238 | 8.1% | 7.2% (+0.826)#91 | 6.8% (+1.29)#5,197 |
| 92. | 06477 | 8.1% | 7.2% (+0.825)#92 | 6.8% (+1.29)#5,199 |
| 93. | 06787 | 8.0% | 7.2% (+0.811)#93 | 6.8% (+1.28)#5,220 |
| 94. | 06470 | 8.0% | 7.2% (+0.774)#94 | 6.8% (+1.24)#5,260 |
| 95. | 06489 | 8.0% | 7.2% (+0.740)#95 | 6.8% (+1.21)#5,311 |
| 96. | 06441 | 7.9% | 7.2% (+0.700)#96 | 6.8% (+1.17)#5,366 |
| 97. | 06095 | 7.9% | 7.2% (+0.695)#97 | 6.8% (+1.16)#5,373 |
| 98. | 06906 | 7.7% | 7.2% (+0.486)#98 | 6.8% (+0.952)#5,665 |
| 99. | 06235 | 7.7% | 7.2% (+0.474)#99 | 6.8% (+0.940)#5,677 |
| 100. | 06110 | 7.7% | 7.2% (+0.457)#100 | 6.8% (+0.922)#5,702 |
Common Questions
What are the Top 10 Zip Codes with the Highest Percentage of Population Employed in Computer, Engineering & Science in Connecticut?
Top 10 Zip Codes with the Highest Percentage of Population Employed in Computer, Engineering & Science in Connecticut are:
What zip code has the Highest Percentage of Population Employed in Computer, Engineering & Science in Connecticut?
06103 has the Highest Percentage of Population Employed in Computer, Engineering & Science in Connecticut with 32.7%.
What is the Percentage of Population Employed in Computer, Engineering & Science in the State of Connecticut?
Percentage of Population Employed in Computer, Engineering & Science in Connecticut is 7.2%.
What is the Percentage of Population Employed in Computer, Engineering & Science in the United States?
Percentage of Population Employed in Computer, Engineering & Science in the United States is 6.8%.