Kulpmont borough, PA Map & Demographics
Kulpmont borough Overview
$40,487
PER CAPITA INCOME
$73,056
AVG FAMILY INCOME
$49,534
AVG HOUSEHOLD INCOME
45.5%
WAGE / INCOME GAP [ % ]
54.5¢/ $1
WAGE / INCOME GAP [ $ ]
0.48
INEQUALITY / GINI INDEX
2,758
TOTAL POPULATION
1,540
MALE POPULATION
1,218
FEMALE POPULATION
126.44
MALES / 100 FEMALES
79.09
FEMALES / 100 MALES
49.6
MEDIAN AGE
2.7
AVG FAMILY SIZE
2.0
AVG HOUSEHOLD SIZE
1,408
LABOR FORCE [ PEOPLE ]
56.5%
PERCENT IN LABOR FORCE
4.6%
UNEMPLOYMENT RATE
Income in Kulpmont borough
Income Overview in Kulpmont borough
Per Capita Income in Kulpmont borough is $40,487, while median incomes of families and households are $73,056 and $49,534 respectively.
| Characteristic | Number | Measure |
| Per Capita Income | 2,758 | $40,487 |
| Median Family Income | 750 | $73,056 |
| Mean Family Income | 750 | $110,828 |
| Median Household Income | 1,353 | $49,534 |
| Mean Household Income | 1,353 | $82,108 |
| Income Deficit | 750 | $0 |
| Wage / Income Gap (%) | 2,758 | 45.45% |
| Wage / Income Gap ($) | 2,758 | 54.55¢ per $1 |
| Gini / Inequality Index | 2,758 | 0.48 |
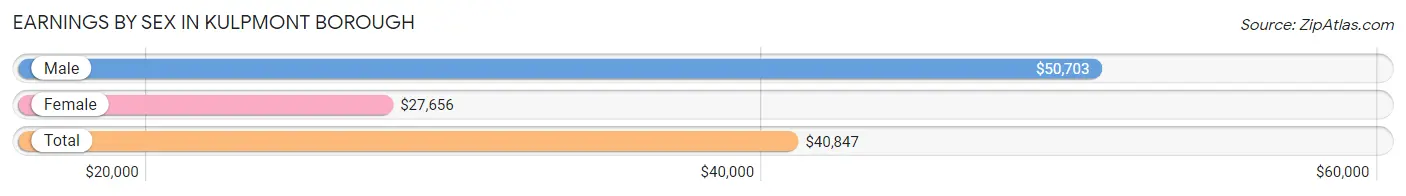
Earnings by Sex in Kulpmont borough
Average Earnings in Kulpmont borough are $40,847, $50,703 for men and $27,656 for women, a difference of 45.5%.
| Sex | Number | Average Earnings |
| Male | 891 (60.5%) | $50,703 |
| Female | 582 (39.5%) | $27,656 |
| Total | 1,473 (100.0%) | $40,847 |
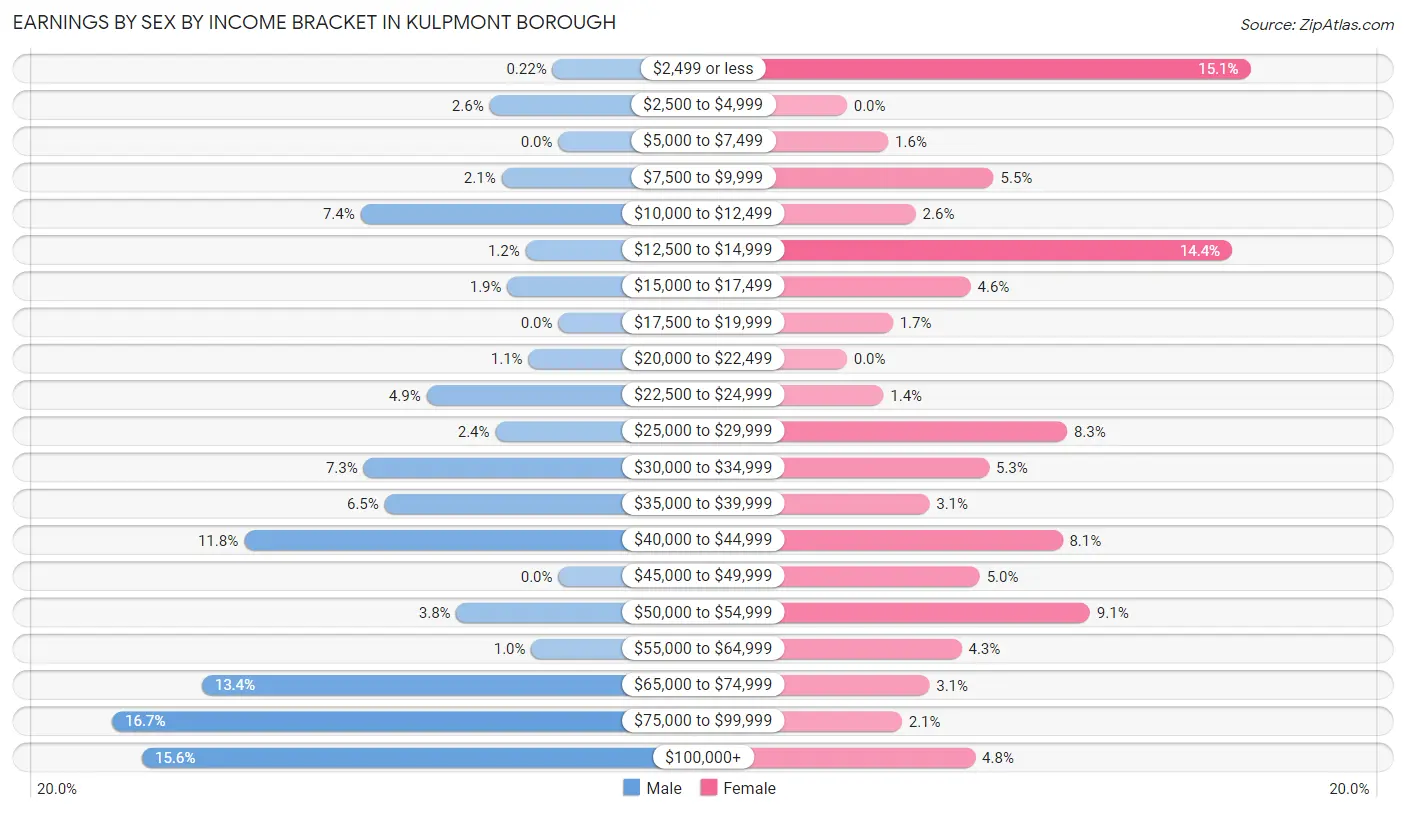
Earnings by Sex by Income Bracket in Kulpmont borough
The most common earnings brackets in Kulpmont borough are $75,000 to $99,999 for men (149 | 16.7%) and $2,499 or less for women (88 | 15.1%).
| Income | Male | Female |
| $2,499 or less | 2 (0.2%) | 88 (15.1%) |
| $2,500 to $4,999 | 23 (2.6%) | 0 (0.0%) |
| $5,000 to $7,499 | 0 (0.0%) | 9 (1.5%) |
| $7,500 to $9,999 | 19 (2.1%) | 32 (5.5%) |
| $10,000 to $12,499 | 66 (7.4%) | 15 (2.6%) |
| $12,500 to $14,999 | 11 (1.2%) | 84 (14.4%) |
| $15,000 to $17,499 | 17 (1.9%) | 27 (4.6%) |
| $17,500 to $19,999 | 0 (0.0%) | 10 (1.7%) |
| $20,000 to $22,499 | 10 (1.1%) | 0 (0.0%) |
| $22,500 to $24,999 | 44 (4.9%) | 8 (1.4%) |
| $25,000 to $29,999 | 21 (2.4%) | 48 (8.3%) |
| $30,000 to $34,999 | 65 (7.3%) | 31 (5.3%) |
| $35,000 to $39,999 | 58 (6.5%) | 18 (3.1%) |
| $40,000 to $44,999 | 105 (11.8%) | 47 (8.1%) |
| $45,000 to $49,999 | 0 (0.0%) | 29 (5.0%) |
| $50,000 to $54,999 | 34 (3.8%) | 53 (9.1%) |
| $55,000 to $64,999 | 9 (1.0%) | 25 (4.3%) |
| $65,000 to $74,999 | 119 (13.4%) | 18 (3.1%) |
| $75,000 to $99,999 | 149 (16.7%) | 12 (2.1%) |
| $100,000+ | 139 (15.6%) | 28 (4.8%) |
| Total | 891 (100.0%) | 582 (100.0%) |
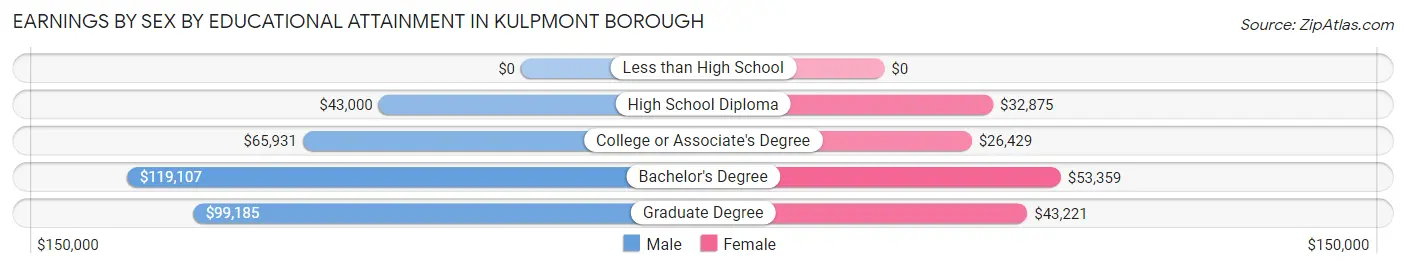
Earnings by Sex by Educational Attainment in Kulpmont borough
Average earnings in Kulpmont borough are $65,691 for men and $32,976 for women, a difference of 49.8%. Men with an educational attainment of bachelor's degree enjoy the highest average annual earnings of $119,107, while those with high school diploma education earn the least with $43,000. Women with an educational attainment of bachelor's degree earn the most with the average annual earnings of $53,359, while those with college or associate's degree education have the smallest earnings of $26,429.
| Educational Attainment | Male Income | Female Income |
| Less than High School | - | - |
| High School Diploma | $43,000 | $32,875 |
| College or Associate's Degree | $65,931 | $26,429 |
| Bachelor's Degree | $119,107 | $53,359 |
| Graduate Degree | $99,185 | $43,221 |
| Total | $65,691 | $32,976 |
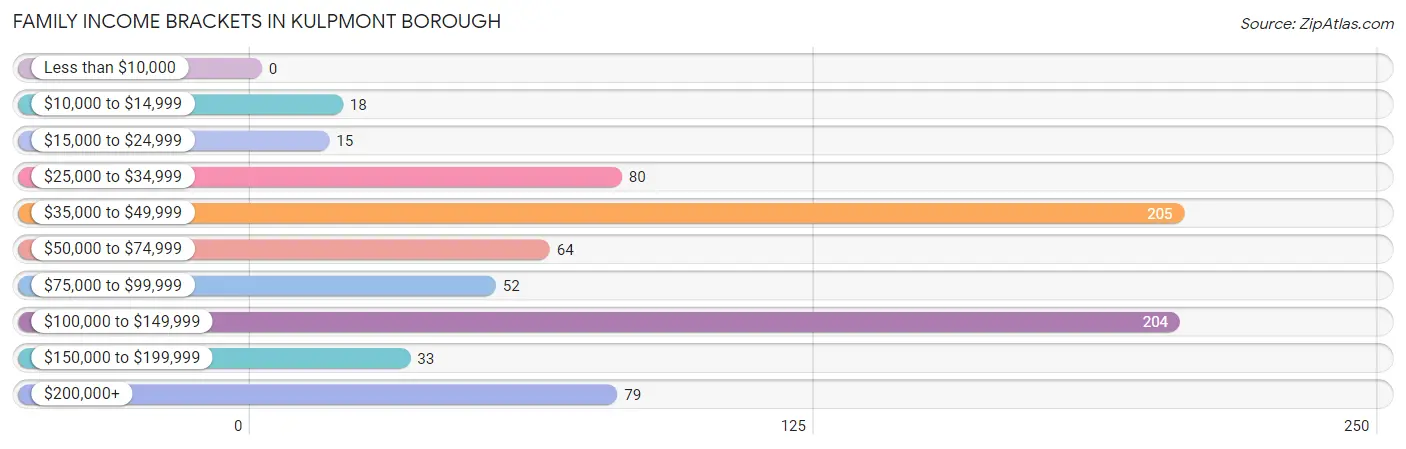
Family Income in Kulpmont borough
Family Income Brackets in Kulpmont borough
According to the Kulpmont borough family income data, there are 205 families falling into the $35,000 to $49,999 income range, which is the most common income bracket and makes up 27.3% of all families.
| Income Bracket | # Families | % Families |
| Less than $10,000 | 0 | 0.0% |
| $10,000 to $14,999 | 18 | 2.4% |
| $15,000 to $24,999 | 15 | 2.0% |
| $25,000 to $34,999 | 80 | 10.7% |
| $35,000 to $49,999 | 205 | 27.3% |
| $50,000 to $74,999 | 64 | 8.5% |
| $75,000 to $99,999 | 52 | 6.9% |
| $100,000 to $149,999 | 204 | 27.2% |
| $150,000 to $199,999 | 33 | 4.4% |
| $200,000+ | 79 | 10.5% |
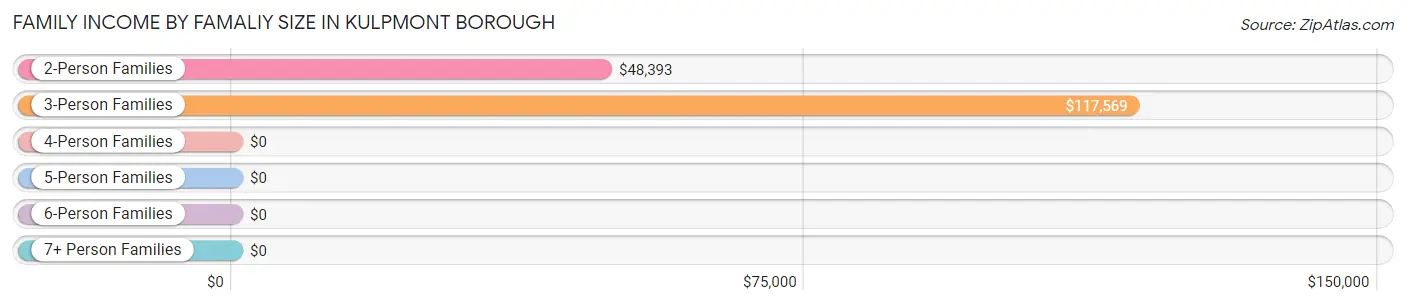
Family Income by Famaliy Size in Kulpmont borough
3-person families (209 | 27.9%) account for the highest median family income in Kulpmont borough with $117,569 per family, while 3-person families (209 | 27.9%) have the highest median income of $39,190 per family member.
| Income Bracket | # Families | Median Income |
| 2-Person Families | 406 (54.1%) | $48,393 |
| 3-Person Families | 209 (27.9%) | $117,569 |
| 4-Person Families | 69 (9.2%) | $0 |
| 5-Person Families | 66 (8.8%) | $0 |
| 6-Person Families | 0 (0.0%) | $0 |
| 7+ Person Families | 0 (0.0%) | $0 |
| Total | 750 (100.0%) | $73,056 |
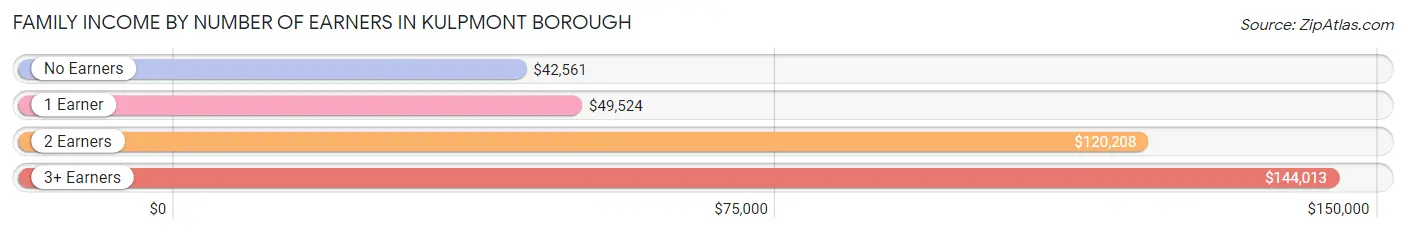
Family Income by Number of Earners in Kulpmont borough
The median family income in Kulpmont borough is $73,056, with families comprising 3+ earners (75) having the highest median family income of $144,013, while families with no earners (160) have the lowest median family income of $42,561, accounting for 10.0% and 21.3% of families, respectively.
| Number of Earners | # Families | Median Income |
| No Earners | 160 (21.3%) | $42,561 |
| 1 Earner | 270 (36.0%) | $49,524 |
| 2 Earners | 245 (32.7%) | $120,208 |
| 3+ Earners | 75 (10.0%) | $144,013 |
| Total | 750 (100.0%) | $73,056 |
Household Income in Kulpmont borough
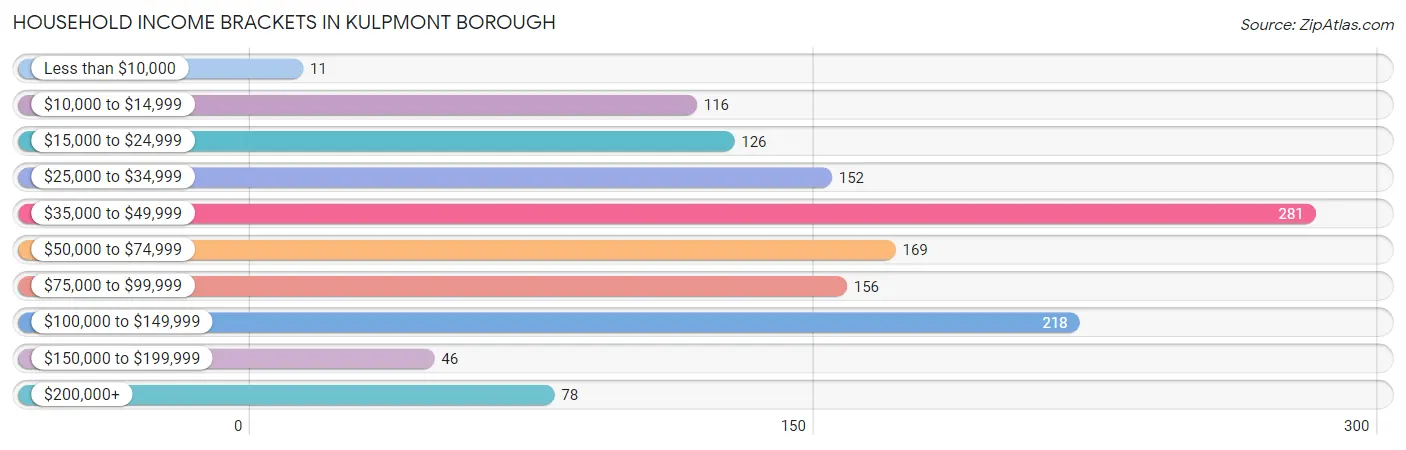
Household Income Brackets in Kulpmont borough
With 281 households falling in the category, the $35,000 to $49,999 income range is the most frequent in Kulpmont borough, accounting for 20.8% of all households. In contrast, only 11 households (0.8%) fall into the less than $10,000 income bracket, making it the least populous group.
| Income Bracket | # Households | % Households |
| Less than $10,000 | 11 | 0.8% |
| $10,000 to $14,999 | 116 | 8.6% |
| $15,000 to $24,999 | 126 | 9.3% |
| $25,000 to $34,999 | 152 | 11.2% |
| $35,000 to $49,999 | 281 | 20.8% |
| $50,000 to $74,999 | 169 | 12.5% |
| $75,000 to $99,999 | 156 | 11.5% |
| $100,000 to $149,999 | 218 | 16.1% |
| $150,000 to $199,999 | 46 | 3.4% |
| $200,000+ | 78 | 5.8% |
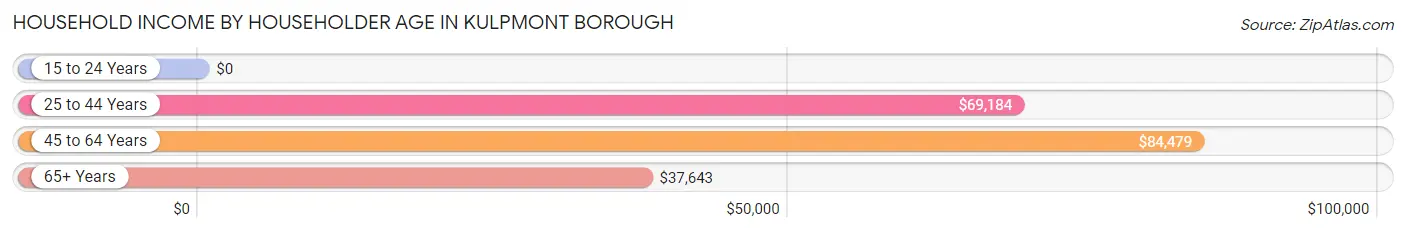
Household Income by Householder Age in Kulpmont borough
The median household income in Kulpmont borough is $49,534, with the highest median household income of $84,479 found in the 45 to 64 years age bracket for the primary householder. A total of 547 households (40.4%) fall into this category. Meanwhile, the 15 to 24 years age bracket for the primary householder has the lowest median household income of $0, with 45 households (3.3%) in this group.
| Income Bracket | # Households | Median Income |
| 15 to 24 Years | 45 (3.3%) | $0 |
| 25 to 44 Years | 319 (23.6%) | $69,184 |
| 45 to 64 Years | 547 (40.4%) | $84,479 |
| 65+ Years | 442 (32.7%) | $37,643 |
| Total | 1,353 (100.0%) | $49,534 |
Poverty in Kulpmont borough
Income Below Poverty by Sex and Age in Kulpmont borough
With 6.4% poverty level for males and 11.1% for females among the residents of Kulpmont borough, 5 year old males and under 5 year old females are the most vulnerable to poverty, with 16 males (100.0%) and 15 females (46.9%) in their respective age groups living below the poverty level.
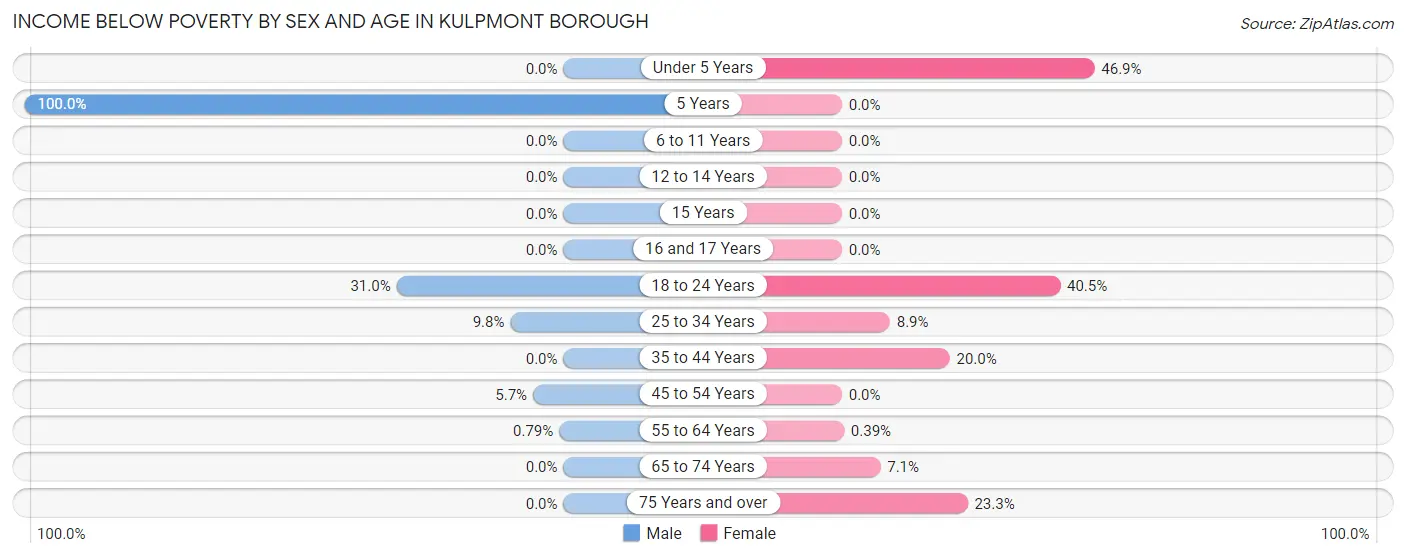
| Age Bracket | Male | Female |
| Under 5 Years | 0 (0.0%) | 15 (46.9%) |
| 5 Years | 16 (100.0%) | 0 (0.0%) |
| 6 to 11 Years | 0 (0.0%) | 0 (0.0%) |
| 12 to 14 Years | 0 (0.0%) | 0 (0.0%) |
| 15 Years | 0 (0.0%) | 0 (0.0%) |
| 16 and 17 Years | 0 (0.0%) | 0 (0.0%) |
| 18 to 24 Years | 48 (31.0%) | 32 (40.5%) |
| 25 to 34 Years | 18 (9.8%) | 18 (8.9%) |
| 35 to 44 Years | 0 (0.0%) | 15 (20.0%) |
| 45 to 54 Years | 14 (5.7%) | 0 (0.0%) |
| 55 to 64 Years | 2 (0.8%) | 1 (0.4%) |
| 65 to 74 Years | 0 (0.0%) | 12 (7.1%) |
| 75 Years and over | 0 (0.0%) | 42 (23.3%) |
| Total | 98 (6.4%) | 135 (11.1%) |
Income Above Poverty by Sex and Age in Kulpmont borough
According to the poverty statistics in Kulpmont borough, males aged under 5 years and females aged 6 to 11 years are the age groups that are most secure financially, with 100.0% of males and 100.0% of females in these age groups living above the poverty line.
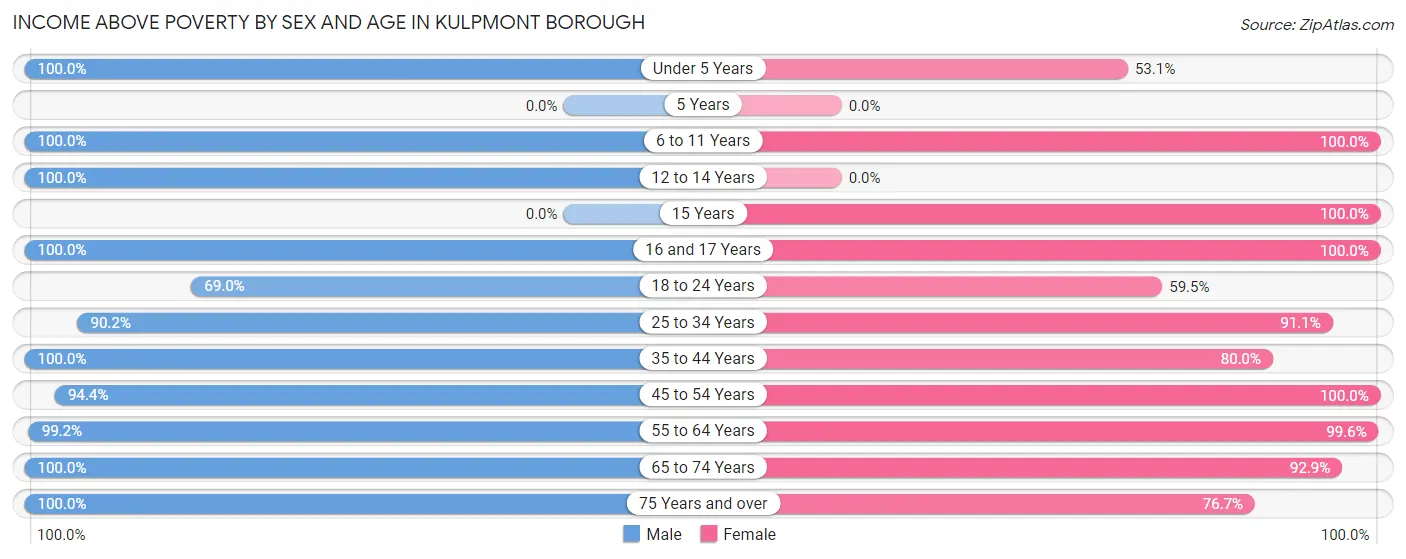
| Age Bracket | Male | Female |
| Under 5 Years | 35 (100.0%) | 17 (53.1%) |
| 5 Years | 0 (0.0%) | 0 (0.0%) |
| 6 to 11 Years | 73 (100.0%) | 28 (100.0%) |
| 12 to 14 Years | 38 (100.0%) | 0 (0.0%) |
| 15 Years | 0 (0.0%) | 44 (100.0%) |
| 16 and 17 Years | 90 (100.0%) | 23 (100.0%) |
| 18 to 24 Years | 107 (69.0%) | 47 (59.5%) |
| 25 to 34 Years | 165 (90.2%) | 184 (91.1%) |
| 35 to 44 Years | 158 (100.0%) | 60 (80.0%) |
| 45 to 54 Years | 234 (94.4%) | 129 (100.0%) |
| 55 to 64 Years | 250 (99.2%) | 257 (99.6%) |
| 65 to 74 Years | 213 (100.0%) | 156 (92.9%) |
| 75 Years and over | 79 (100.0%) | 138 (76.7%) |
| Total | 1,442 (93.6%) | 1,083 (88.9%) |
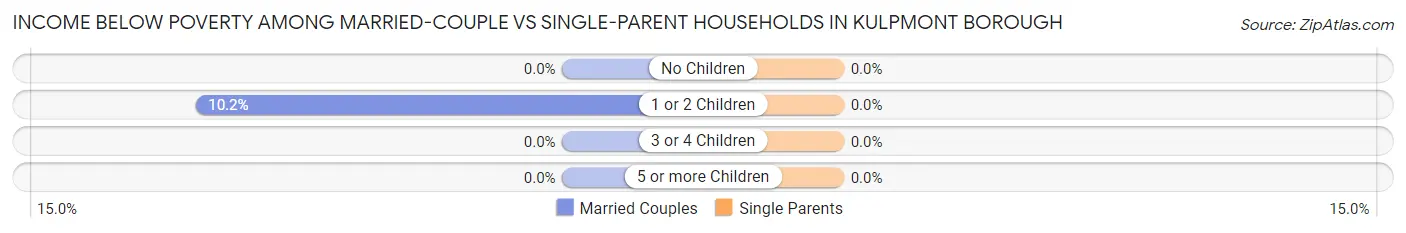
Income Below Poverty Among Married-Couple Families in Kulpmont borough
The poverty statistics for married-couple families in Kulpmont borough show that 3.4% or 18 of the total 534 families live below the poverty line. Families with 1 or 2 children have the highest poverty rate of 10.2%, comprising of 18 families. On the other hand, families with no children have the lowest poverty rate of 0.0%, which includes 0 families.
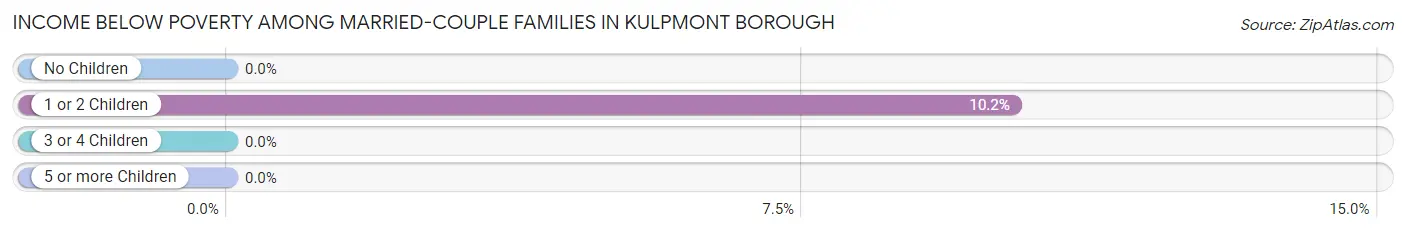
| Children | Above Poverty | Below Poverty |
| No Children | 358 (100.0%) | 0 (0.0%) |
| 1 or 2 Children | 158 (89.8%) | 18 (10.2%) |
| 3 or 4 Children | 0 (0.0%) | 0 (0.0%) |
| 5 or more Children | 0 (0.0%) | 0 (0.0%) |
| Total | 516 (96.6%) | 18 (3.4%) |
Income Below Poverty Among Single-Parent Households in Kulpmont borough
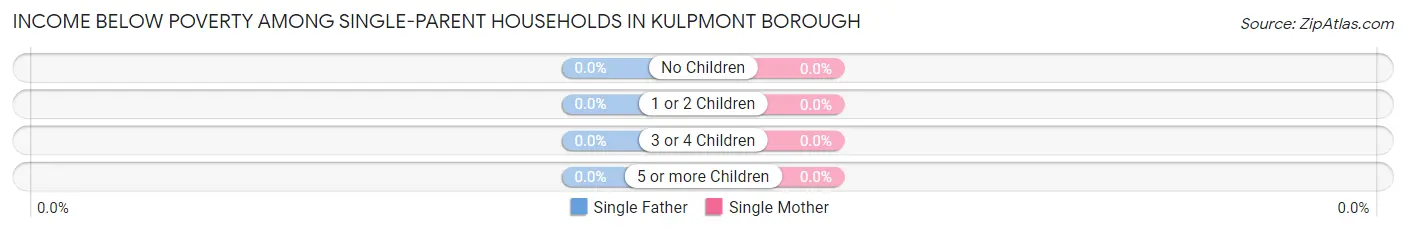
| Children | Single Father | Single Mother |
| No Children | 0 (0.0%) | 0 (0.0%) |
| 1 or 2 Children | 0 (0.0%) | 0 (0.0%) |
| 3 or 4 Children | 0 (0.0%) | 0 (0.0%) |
| 5 or more Children | 0 (0.0%) | 0 (0.0%) |
| Total | 0 (0.0%) | 0 (0.0%) |
Income Below Poverty Among Married-Couple vs Single-Parent Households in Kulpmont borough
| Children | Married-Couple Families | Single-Parent Households |
| No Children | 0 (0.0%) | 0 (0.0%) |
| 1 or 2 Children | 18 (10.2%) | 0 (0.0%) |
| 3 or 4 Children | 0 (0.0%) | 0 (0.0%) |
| 5 or more Children | 0 (0.0%) | 0 (0.0%) |
| Total | 18 (3.4%) | 0 (0.0%) |
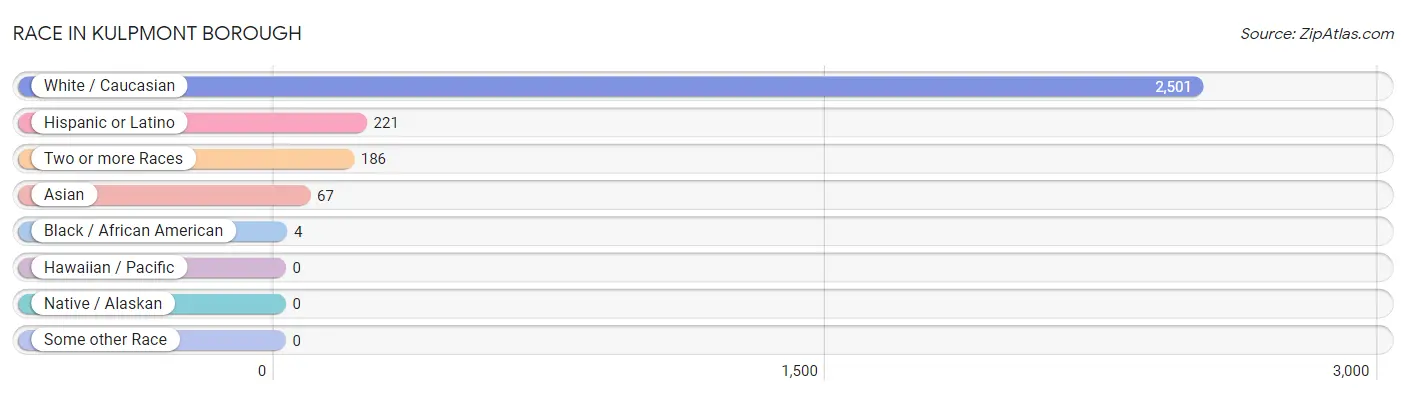
Race in Kulpmont borough
The most populous races in Kulpmont borough are White / Caucasian (2,501 | 90.7%), Hispanic or Latino (221 | 8.0%), and Two or more Races (186 | 6.7%).
| Race | # Population | % Population |
| Asian | 67 | 2.4% |
| Black / African American | 4 | 0.2% |
| Hawaiian / Pacific | 0 | 0.0% |
| Hispanic or Latino | 221 | 8.0% |
| Native / Alaskan | 0 | 0.0% |
| White / Caucasian | 2,501 | 90.7% |
| Two or more Races | 186 | 6.7% |
| Some other Race | 0 | 0.0% |
| Total | 2,758 | 100.0% |
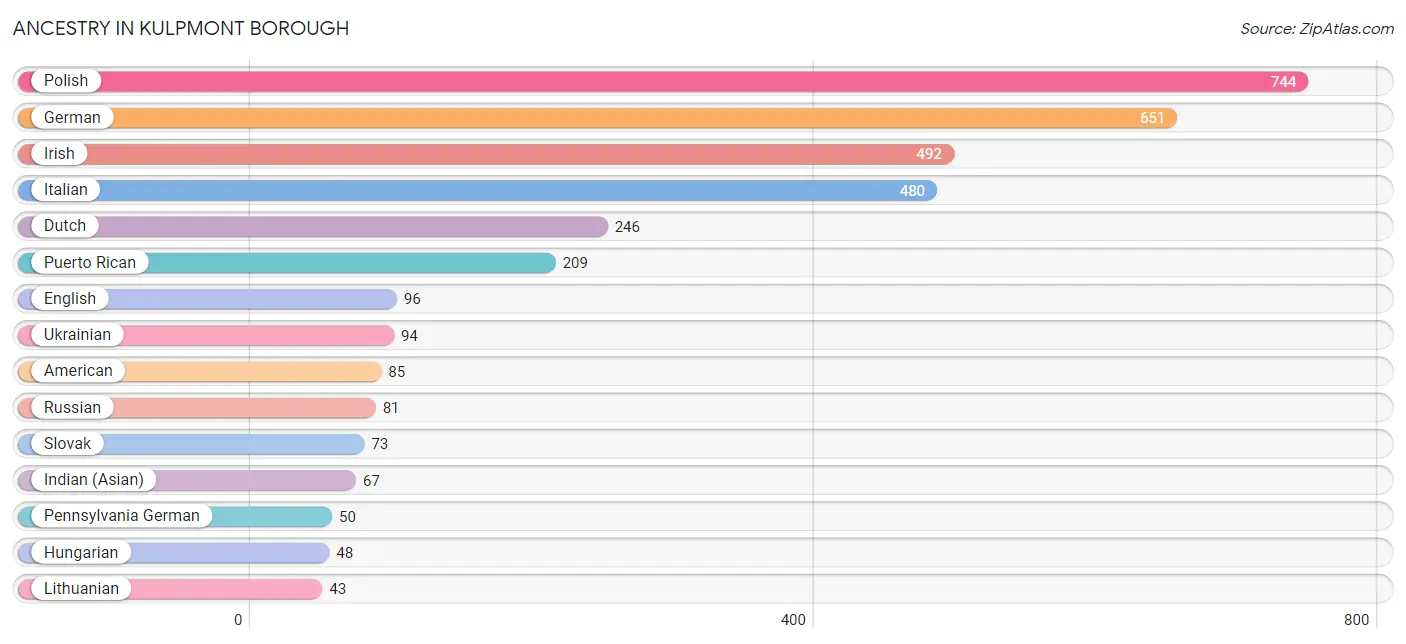
Ancestry in Kulpmont borough
The most populous ancestries reported in Kulpmont borough are Polish (744 | 27.0%), German (651 | 23.6%), Irish (492 | 17.8%), Italian (480 | 17.4%), and Dutch (246 | 8.9%), together accounting for 94.7% of all Kulpmont borough residents.
| Ancestry | # Population | % Population |
| African | 1 | 0.0% |
| American | 85 | 3.1% |
| Austrian | 10 | 0.4% |
| British | 14 | 0.5% |
| Bulgarian | 9 | 0.3% |
| Cherokee | 4 | 0.2% |
| Cuban | 12 | 0.4% |
| Czech | 16 | 0.6% |
| Dutch | 246 | 8.9% |
| English | 96 | 3.5% |
| German | 651 | 23.6% |
| Hungarian | 48 | 1.7% |
| Indian (Asian) | 67 | 2.4% |
| Irish | 492 | 17.8% |
| Italian | 480 | 17.4% |
| Lithuanian | 43 | 1.6% |
| Pennsylvania German | 50 | 1.8% |
| Polish | 744 | 27.0% |
| Puerto Rican | 209 | 7.6% |
| Russian | 81 | 2.9% |
| Scottish | 9 | 0.3% |
| Sioux | 6 | 0.2% |
| Slovak | 73 | 2.6% |
| Subsaharan African | 1 | 0.0% |
| Ukrainian | 94 | 3.4% |
| Welsh | 29 | 1.1% | View All 26 Rows |
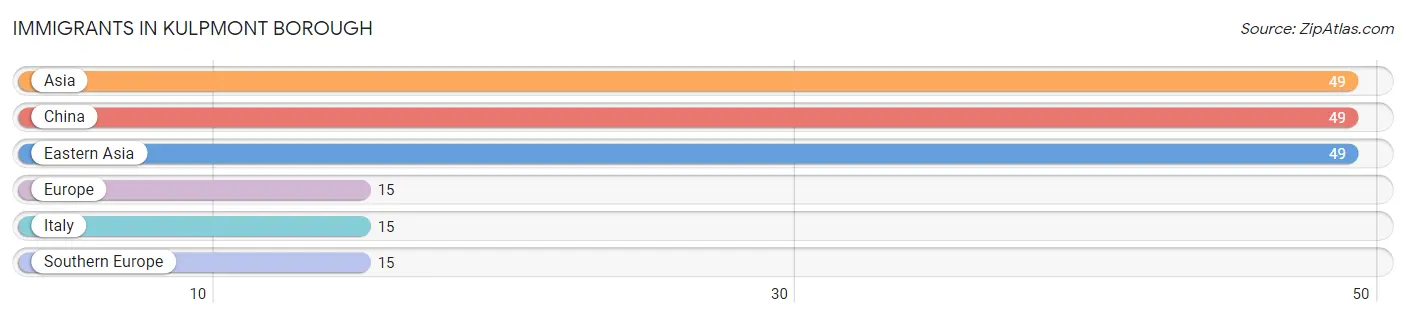
Immigrants in Kulpmont borough
The most numerous immigrant groups reported in Kulpmont borough came from Asia (49 | 1.8%), China (49 | 1.8%), Eastern Asia (49 | 1.8%), Europe (15 | 0.5%), and Italy (15 | 0.5%), together accounting for 6.4% of all Kulpmont borough residents.
| Immigration Origin | # Population | % Population |
| Asia | 49 | 1.8% |
| China | 49 | 1.8% |
| Eastern Asia | 49 | 1.8% |
| Europe | 15 | 0.5% |
| Italy | 15 | 0.5% |
| Southern Europe | 15 | 0.5% | View All 6 Rows |
Sex and Age in Kulpmont borough
Sex and Age in Kulpmont borough
The most populous age groups in Kulpmont borough are 35 to 39 Years (143 | 9.3%) for men and 60 to 64 Years (148 | 12.1%) for women.
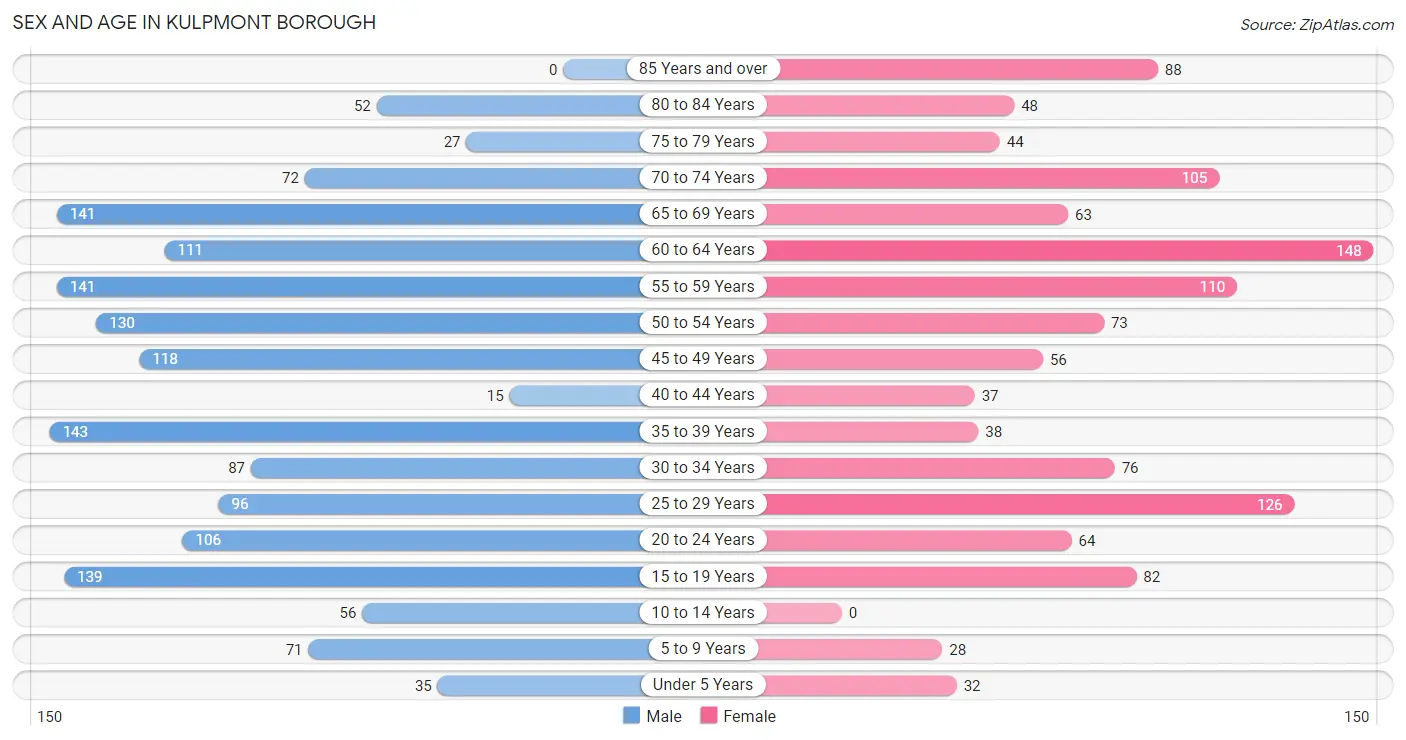
| Age Bracket | Male | Female |
| Under 5 Years | 35 (2.3%) | 32 (2.6%) |
| 5 to 9 Years | 71 (4.6%) | 28 (2.3%) |
| 10 to 14 Years | 56 (3.6%) | 0 (0.0%) |
| 15 to 19 Years | 139 (9.0%) | 82 (6.7%) |
| 20 to 24 Years | 106 (6.9%) | 64 (5.2%) |
| 25 to 29 Years | 96 (6.2%) | 126 (10.3%) |
| 30 to 34 Years | 87 (5.7%) | 76 (6.2%) |
| 35 to 39 Years | 143 (9.3%) | 38 (3.1%) |
| 40 to 44 Years | 15 (1.0%) | 37 (3.0%) |
| 45 to 49 Years | 118 (7.7%) | 56 (4.6%) |
| 50 to 54 Years | 130 (8.4%) | 73 (6.0%) |
| 55 to 59 Years | 141 (9.2%) | 110 (9.0%) |
| 60 to 64 Years | 111 (7.2%) | 148 (12.1%) |
| 65 to 69 Years | 141 (9.2%) | 63 (5.2%) |
| 70 to 74 Years | 72 (4.7%) | 105 (8.6%) |
| 75 to 79 Years | 27 (1.8%) | 44 (3.6%) |
| 80 to 84 Years | 52 (3.4%) | 48 (3.9%) |
| 85 Years and over | 0 (0.0%) | 88 (7.2%) |
| Total | 1,540 (100.0%) | 1,218 (100.0%) |
Families and Households in Kulpmont borough
Median Family Size in Kulpmont borough
The median family size in Kulpmont borough is 2.73 persons per family, with single male/father families (120 | 16.0%) accounting for the largest median family size of 2.88 persons per family. On the other hand, single female/mother families (96 | 12.8%) represent the smallest median family size with 2.32 persons per family.
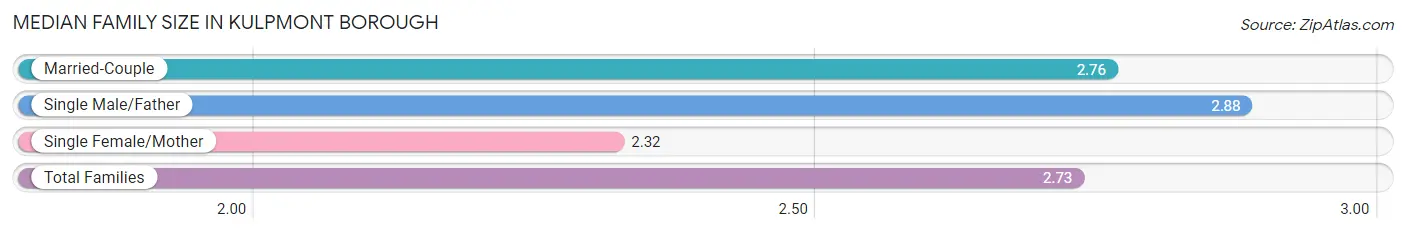
| Family Type | # Families | Family Size |
| Married-Couple | 534 (71.2%) | 2.76 |
| Single Male/Father | 120 (16.0%) | 2.88 |
| Single Female/Mother | 96 (12.8%) | 2.32 |
| Total Families | 750 (100.0%) | 2.73 |
Median Household Size in Kulpmont borough
The median household size in Kulpmont borough is 2.03 persons per household, with single male/father households (120 | 8.9%) accounting for the largest median household size of 2.88 persons per household. non-family households (603 | 44.6%) represent the smallest median household size with 1.11 persons per household.
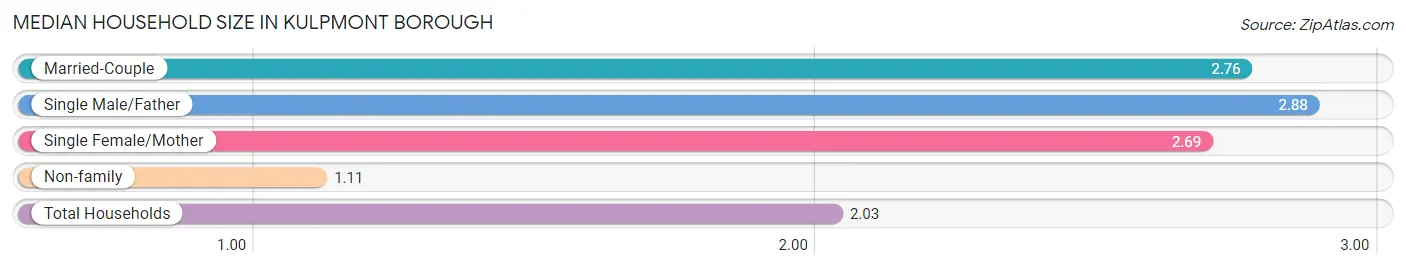
| Household Type | # Households | Household Size |
| Married-Couple | 534 (39.5%) | 2.76 |
| Single Male/Father | 120 (8.9%) | 2.88 |
| Single Female/Mother | 96 (7.1%) | 2.69 |
| Non-family | 603 (44.6%) | 1.11 |
| Total Households | 1,353 (100.0%) | 2.03 |
Household Size by Marriage Status in Kulpmont borough
Out of a total of 1,353 households in Kulpmont borough, 750 (55.4%) are family households, while 603 (44.6%) are nonfamily households. The most numerous type of family households are 2-person households, comprising 376, and the most common type of nonfamily households are 1-person households, comprising 519.
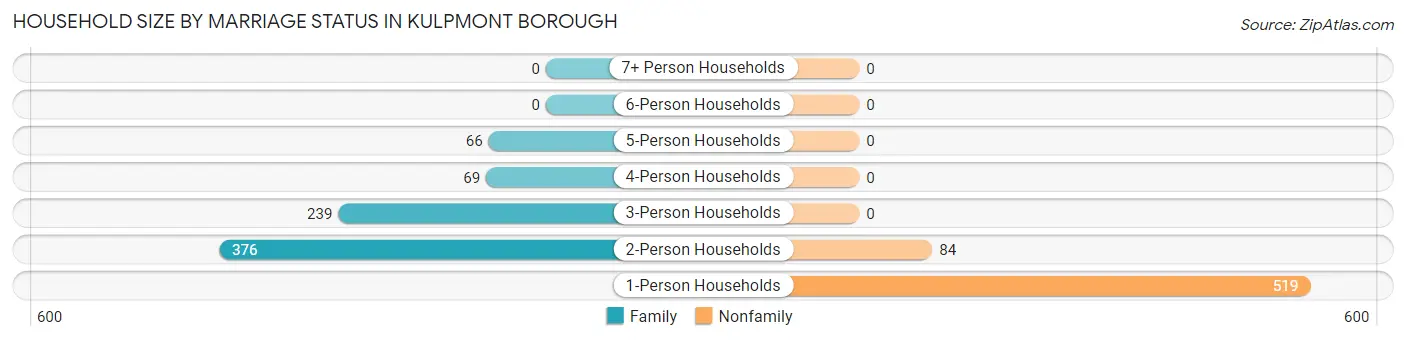
| Household Size | Family Households | Nonfamily Households |
| 1-Person Households | - | 519 (38.4%) |
| 2-Person Households | 376 (27.8%) | 84 (6.2%) |
| 3-Person Households | 239 (17.7%) | 0 (0.0%) |
| 4-Person Households | 69 (5.1%) | 0 (0.0%) |
| 5-Person Households | 66 (4.9%) | 0 (0.0%) |
| 6-Person Households | 0 (0.0%) | 0 (0.0%) |
| 7+ Person Households | 0 (0.0%) | 0 (0.0%) |
| Total | 750 (55.4%) | 603 (44.6%) |
Female Fertility in Kulpmont borough
Fertility by Age in Kulpmont borough
Average fertility rate in Kulpmont borough is 42.0 births per 1,000 women. Women in the age bracket of 20 to 34 years have the highest fertility rate with 75.0 births per 1,000 women. Women in the age bracket of 20 to 34 years acount for 100.0% of all women with births.
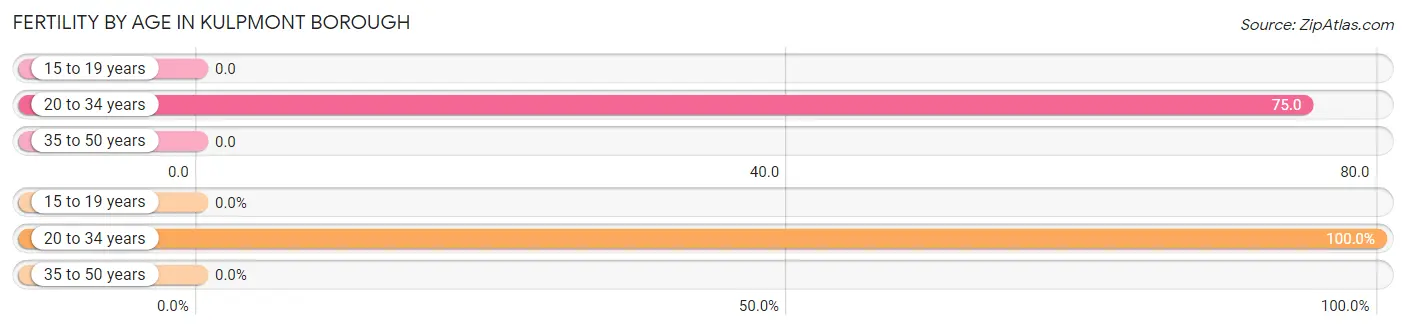
| Age Bracket | Women with Births | Births / 1,000 Women |
| 15 to 19 years | 0 (0.0%) | 0.0 |
| 20 to 34 years | 20 (100.0%) | 75.0 |
| 35 to 50 years | 0 (0.0%) | 0.0 |
| Total | 20 (100.0%) | 42.0 |
Fertility by Age by Marriage Status in Kulpmont borough
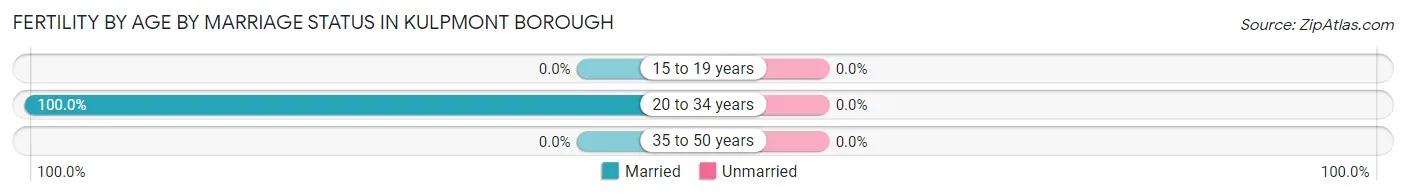
| Age Bracket | Married | Unmarried |
| 15 to 19 years | 0 (0.0%) | 0 (0.0%) |
| 20 to 34 years | 20 (100.0%) | 0 (0.0%) |
| 35 to 50 years | 0 (0.0%) | 0 (0.0%) |
| Total | 20 (100.0%) | 0 (0.0%) |
Fertility by Education in Kulpmont borough
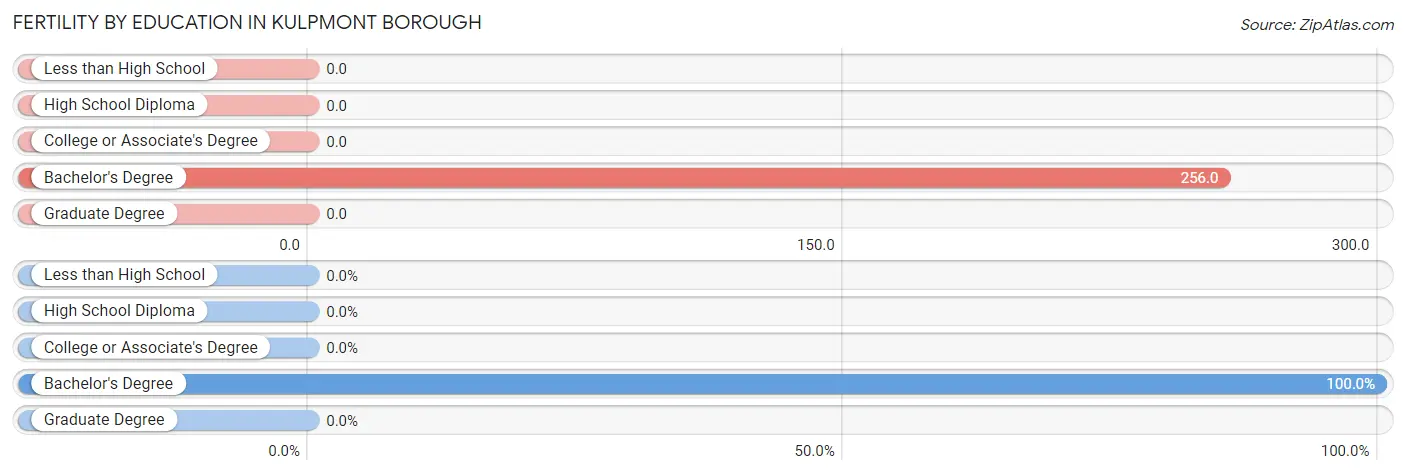
| Educational Attainment | Women with Births | Births / 1,000 Women |
| Less than High School | 0 (0.0%) | 0.0 |
| High School Diploma | 0 (0.0%) | 0.0 |
| College or Associate's Degree | 0 (0.0%) | 0.0 |
| Bachelor's Degree | 20 (100.0%) | 256.0 |
| Graduate Degree | 0 (0.0%) | 0.0 |
| Total | 20 (100.0%) | 42.0 |
Fertility by Education by Marriage Status in Kulpmont borough
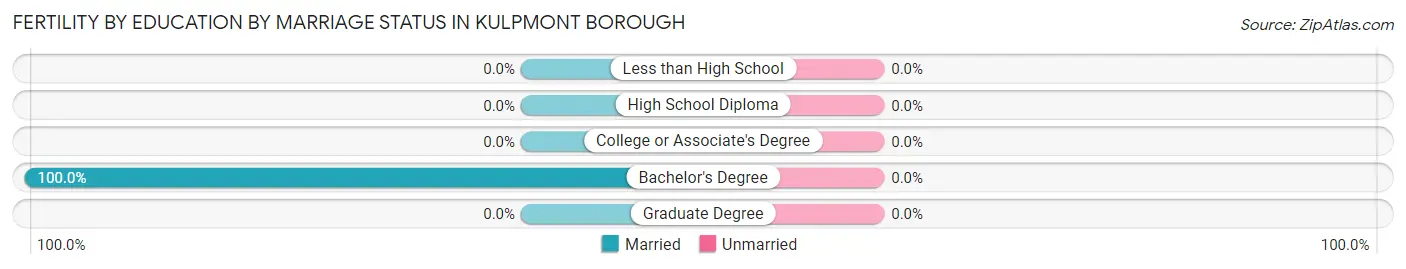
| Educational Attainment | Married | Unmarried |
| Less than High School | 0 (0.0%) | 0 (0.0%) |
| High School Diploma | 0 (0.0%) | 0 (0.0%) |
| College or Associate's Degree | 0 (0.0%) | 0 (0.0%) |
| Bachelor's Degree | 20 (100.0%) | 0 (0.0%) |
| Graduate Degree | 0 (0.0%) | 0 (0.0%) |
| Total | 20 (100.0%) | 0 (0.0%) |
Employment Characteristics in Kulpmont borough
Employment by Class of Employer in Kulpmont borough
Among the 1,256 employed individuals in Kulpmont borough, private company employees (886 | 70.5%), not-for-profit organizations (148 | 11.8%), and local government employees (104 | 8.3%) make up the most common classes of employment.
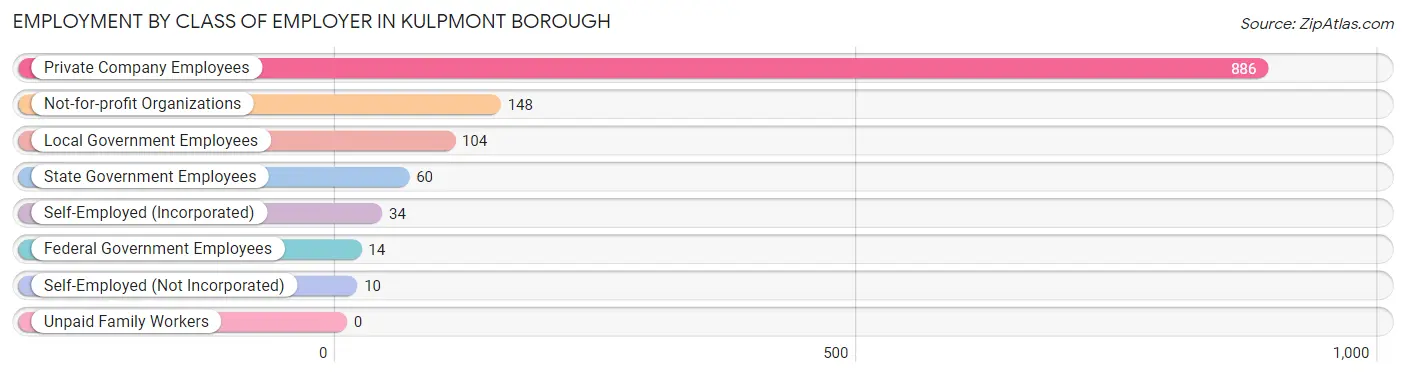
| Employer Class | # Employees | % Employees |
| Private Company Employees | 886 | 70.5% |
| Self-Employed (Incorporated) | 34 | 2.7% |
| Self-Employed (Not Incorporated) | 10 | 0.8% |
| Not-for-profit Organizations | 148 | 11.8% |
| Local Government Employees | 104 | 8.3% |
| State Government Employees | 60 | 4.8% |
| Federal Government Employees | 14 | 1.1% |
| Unpaid Family Workers | 0 | 0.0% |
| Total | 1,256 | 100.0% |
Employment Status by Age in Kulpmont borough
According to the labor force statistics for Kulpmont borough, out of the total population over 16 years of age (2,492), 56.5% or 1,408 individuals are in the labor force, with 4.6% or 65 of them unemployed. The age group with the highest labor force participation rate is 35 to 44 years, with 94.0% or 219 individuals in the labor force. Within the labor force, the 30 to 34 years age range has the highest percentage of unemployed individuals, with 15.7% or 18 of them being unemployed.
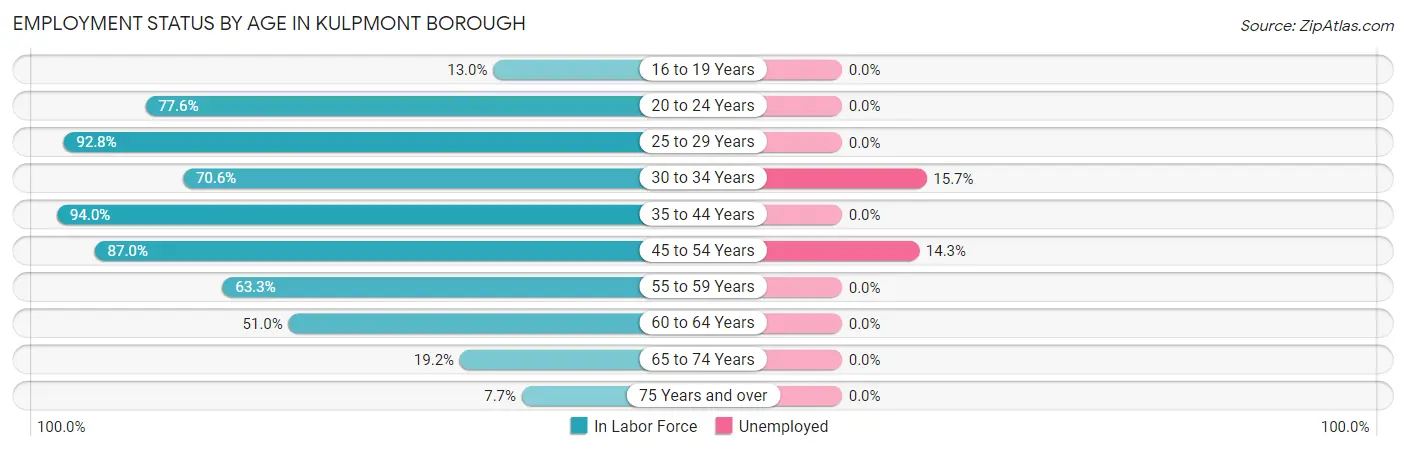
| Age Bracket | In Labor Force | Unemployed |
| 16 to 19 Years | 23 (13.0%) | 0 (0.0%) |
| 20 to 24 Years | 132 (77.6%) | 0 (0.0%) |
| 25 to 29 Years | 206 (92.8%) | 0 (0.0%) |
| 30 to 34 Years | 115 (70.6%) | 18 (15.7%) |
| 35 to 44 Years | 219 (94.0%) | 0 (0.0%) |
| 45 to 54 Years | 328 (87.0%) | 47 (14.3%) |
| 55 to 59 Years | 159 (63.3%) | 0 (0.0%) |
| 60 to 64 Years | 132 (51.0%) | 0 (0.0%) |
| 65 to 74 Years | 73 (19.2%) | 0 (0.0%) |
| 75 Years and over | 20 (7.7%) | 0 (0.0%) |
| Total | 1,408 (56.5%) | 65 (4.6%) |
Employment Status by Educational Attainment in Kulpmont borough
According to labor force statistics for Kulpmont borough, 77.0% of individuals (1,159) out of the total population between 25 and 64 years of age (1,505) are in the labor force, with 5.6% or 65 of them being unemployed. The group with the highest labor force participation rate are those with the educational attainment of bachelor's degree or higher, with 83.7% or 220 individuals in the labor force. Within the labor force, individuals with college / associate degree education have the highest percentage of unemployment, with 14.0% or 65 of them being unemployed.
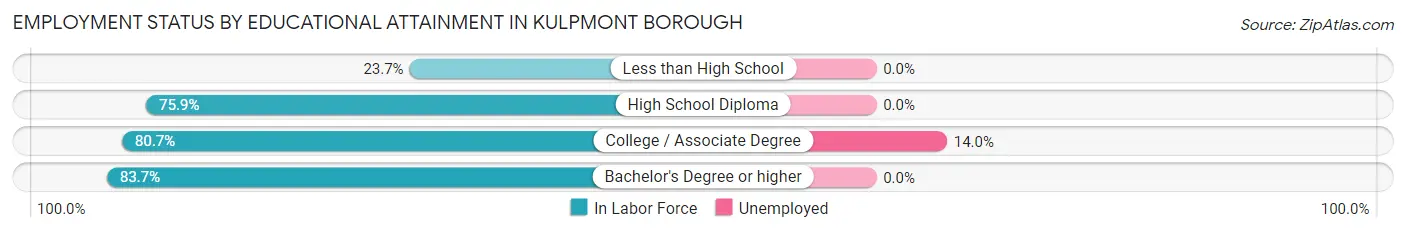
| Educational Attainment | In Labor Force | Unemployed |
| Less than High School | 14 (23.7%) | 0 (0.0%) |
| High School Diploma | 462 (75.9%) | 0 (0.0%) |
| College / Associate Degree | 463 (80.7%) | 80 (14.0%) |
| Bachelor's Degree or higher | 220 (83.7%) | 0 (0.0%) |
| Total | 1,159 (77.0%) | 84 (5.6%) |
Employment Occupations by Sex in Kulpmont borough
Management, Business, Science and Arts Occupations
The most common Management, Business, Science and Arts occupations in Kulpmont borough are Health Diagnosing & Treating (99 | 7.4%), Business & Financial (85 | 6.3%), Community & Social Service (76 | 5.7%), Computers, Engineering & Science (60 | 4.5%), and Health Technologists (60 | 4.5%).

Management, Business, Science and Arts Occupations by Sex
Within the Management, Business, Science and Arts occupations in Kulpmont borough, the most male-oriented occupations are Computers, Engineering & Science (100.0%), Computers & Mathematics (100.0%), and Architecture & Engineering (100.0%), while the most female-oriented occupations are Business & Financial (100.0%), Education, Arts & Media (100.0%), and Arts, Media & Entertainment (100.0%).
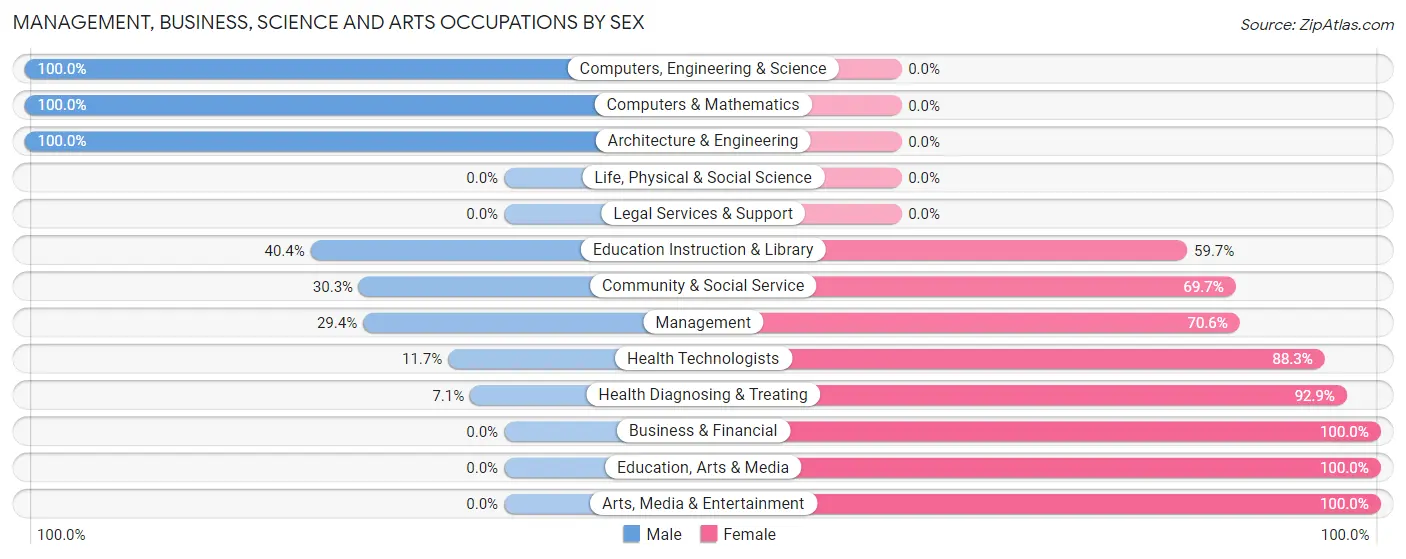
| Occupation | Male | Female |
| Management | 15 (29.4%) | 36 (70.6%) |
| Business & Financial | 0 (0.0%) | 85 (100.0%) |
| Computers, Engineering & Science | 60 (100.0%) | 0 (0.0%) |
| Computers & Mathematics | 18 (100.0%) | 0 (0.0%) |
| Architecture & Engineering | 42 (100.0%) | 0 (0.0%) |
| Life, Physical & Social Science | 0 (0.0%) | 0 (0.0%) |
| Community & Social Service | 23 (30.3%) | 53 (69.7%) |
| Education, Arts & Media | 0 (0.0%) | 10 (100.0%) |
| Legal Services & Support | 0 (0.0%) | 0 (0.0%) |
| Education Instruction & Library | 23 (40.4%) | 34 (59.7%) |
| Arts, Media & Entertainment | 0 (0.0%) | 9 (100.0%) |
| Health Diagnosing & Treating | 7 (7.1%) | 92 (92.9%) |
| Health Technologists | 7 (11.7%) | 53 (88.3%) |
| Total (Category) | 105 (28.3%) | 266 (71.7%) |
| Total (Overall) | 795 (59.2%) | 547 (40.8%) |
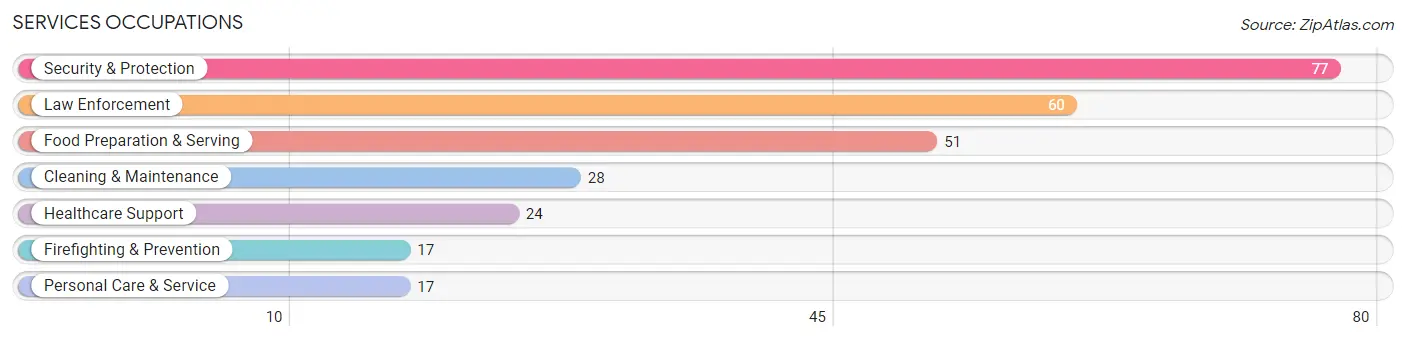
Services Occupations
The most common Services occupations in Kulpmont borough are Security & Protection (77 | 5.7%), Law Enforcement (60 | 4.5%), Food Preparation & Serving (51 | 3.8%), Cleaning & Maintenance (28 | 2.1%), and Healthcare Support (24 | 1.8%).
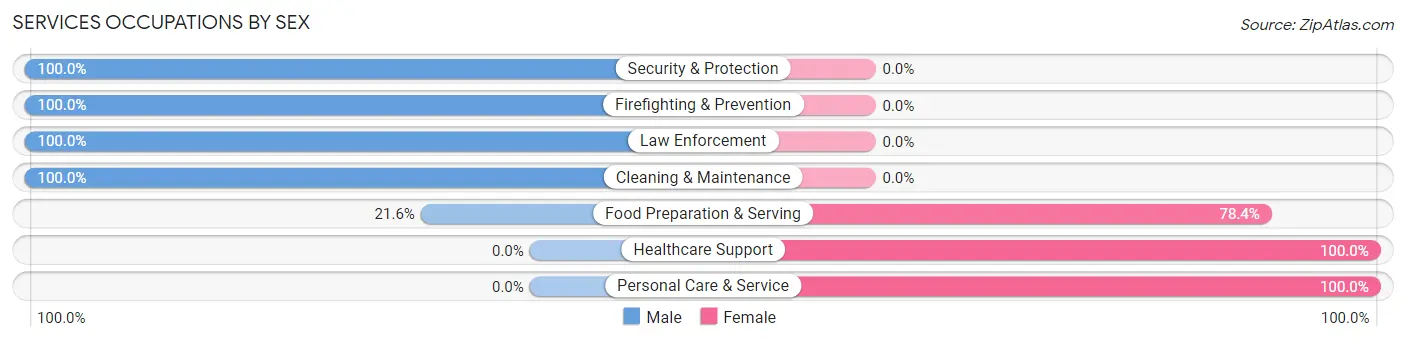
Services Occupations by Sex
Within the Services occupations in Kulpmont borough, the most male-oriented occupations are Security & Protection (100.0%), Firefighting & Prevention (100.0%), and Law Enforcement (100.0%), while the most female-oriented occupations are Healthcare Support (100.0%), Personal Care & Service (100.0%), and Food Preparation & Serving (78.4%).
| Occupation | Male | Female |
| Healthcare Support | 0 (0.0%) | 24 (100.0%) |
| Security & Protection | 77 (100.0%) | 0 (0.0%) |
| Firefighting & Prevention | 17 (100.0%) | 0 (0.0%) |
| Law Enforcement | 60 (100.0%) | 0 (0.0%) |
| Food Preparation & Serving | 11 (21.6%) | 40 (78.4%) |
| Cleaning & Maintenance | 28 (100.0%) | 0 (0.0%) |
| Personal Care & Service | 0 (0.0%) | 17 (100.0%) |
| Total (Category) | 116 (58.9%) | 81 (41.1%) |
| Total (Overall) | 795 (59.2%) | 547 (40.8%) |
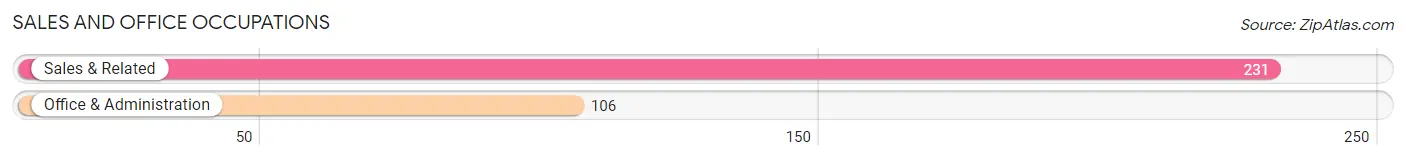
Sales and Office Occupations
The most common Sales and Office occupations in Kulpmont borough are Sales & Related (231 | 17.2%), and Office & Administration (106 | 7.9%).
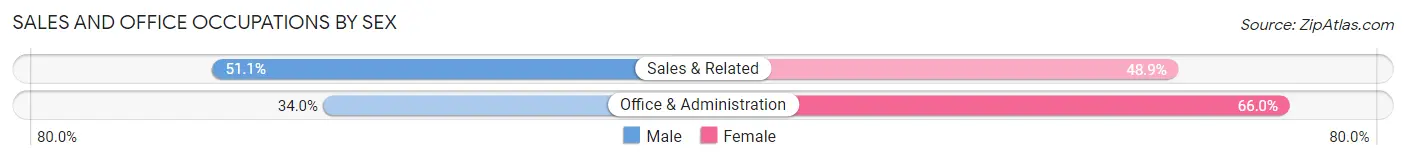
Sales and Office Occupations by Sex
| Occupation | Male | Female |
| Sales & Related | 118 (51.1%) | 113 (48.9%) |
| Office & Administration | 36 (34.0%) | 70 (66.0%) |
| Total (Category) | 154 (45.7%) | 183 (54.3%) |
| Total (Overall) | 795 (59.2%) | 547 (40.8%) |
Natural Resources, Construction and Maintenance Occupations
The most common Natural Resources, Construction and Maintenance occupations in Kulpmont borough are Construction & Extraction (196 | 14.6%), and Installation, Maintenance & Repair (10 | 0.7%).
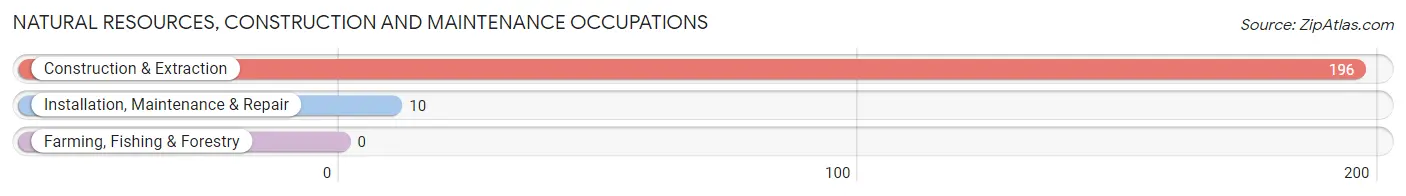
Natural Resources, Construction and Maintenance Occupations by Sex
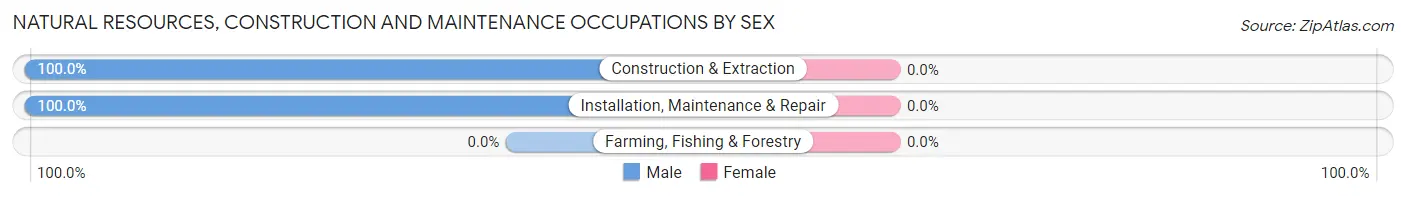
| Occupation | Male | Female |
| Farming, Fishing & Forestry | 0 (0.0%) | 0 (0.0%) |
| Construction & Extraction | 196 (100.0%) | 0 (0.0%) |
| Installation, Maintenance & Repair | 10 (100.0%) | 0 (0.0%) |
| Total (Category) | 206 (100.0%) | 0 (0.0%) |
| Total (Overall) | 795 (59.2%) | 547 (40.8%) |
Production, Transportation and Moving Occupations
The most common Production, Transportation and Moving occupations in Kulpmont borough are Material Moving (107 | 8.0%), Production (74 | 5.5%), and Transportation (50 | 3.7%).
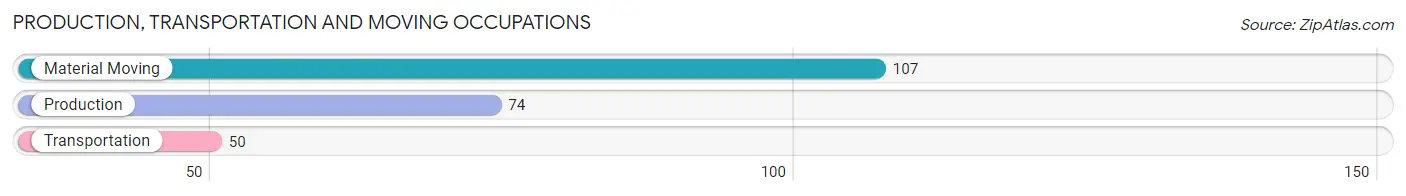
Production, Transportation and Moving Occupations by Sex
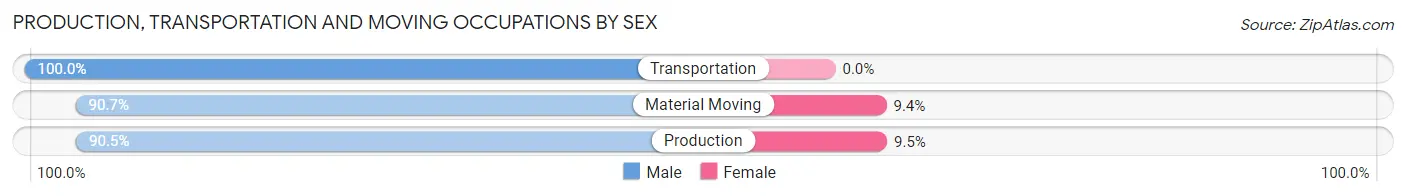
| Occupation | Male | Female |
| Production | 67 (90.5%) | 7 (9.5%) |
| Transportation | 50 (100.0%) | 0 (0.0%) |
| Material Moving | 97 (90.6%) | 10 (9.3%) |
| Total (Category) | 214 (92.6%) | 17 (7.4%) |
| Total (Overall) | 795 (59.2%) | 547 (40.8%) |
Employment Industries by Sex in Kulpmont borough
Employment Industries in Kulpmont borough
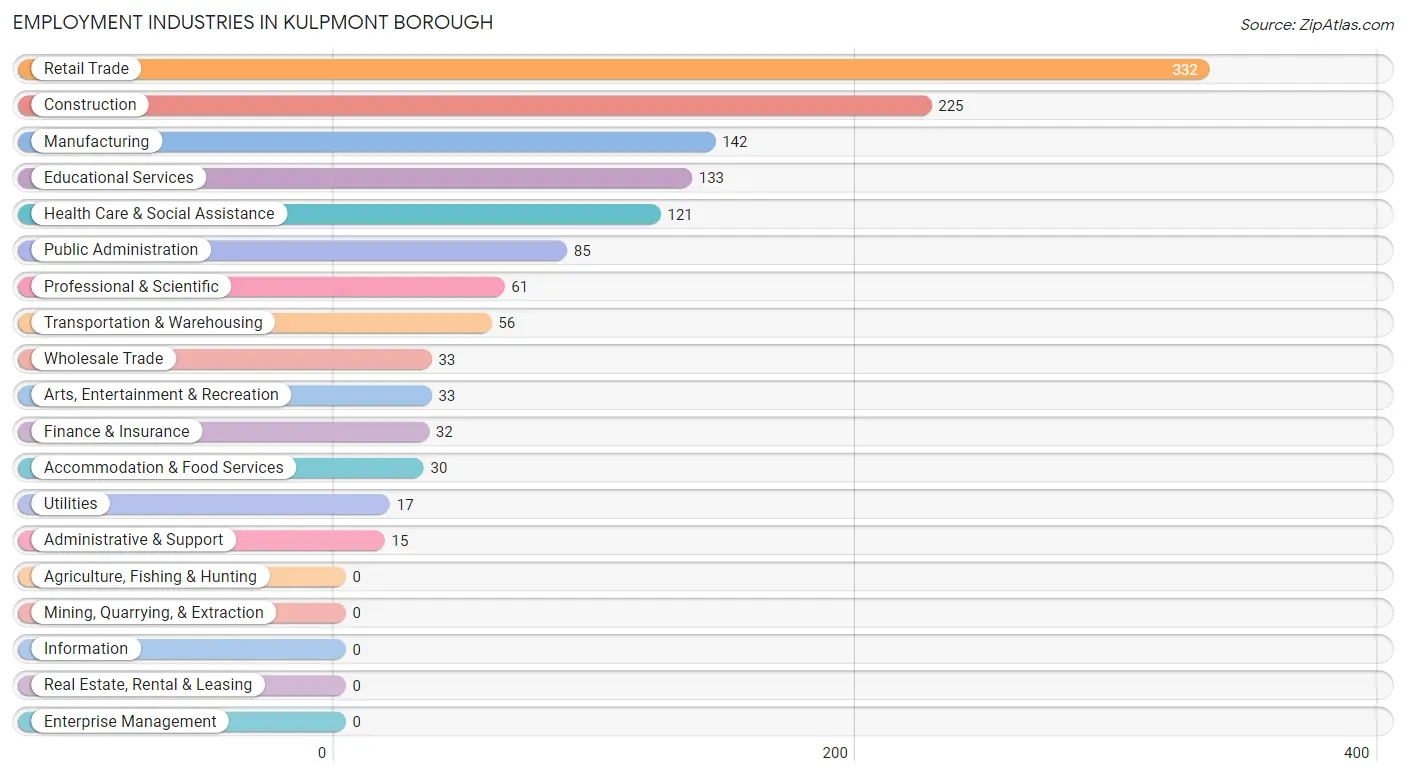
The major employment industries in Kulpmont borough include Retail Trade (332 | 24.7%), Construction (225 | 16.8%), Manufacturing (142 | 10.6%), Educational Services (133 | 9.9%), and Health Care & Social Assistance (121 | 9.0%).
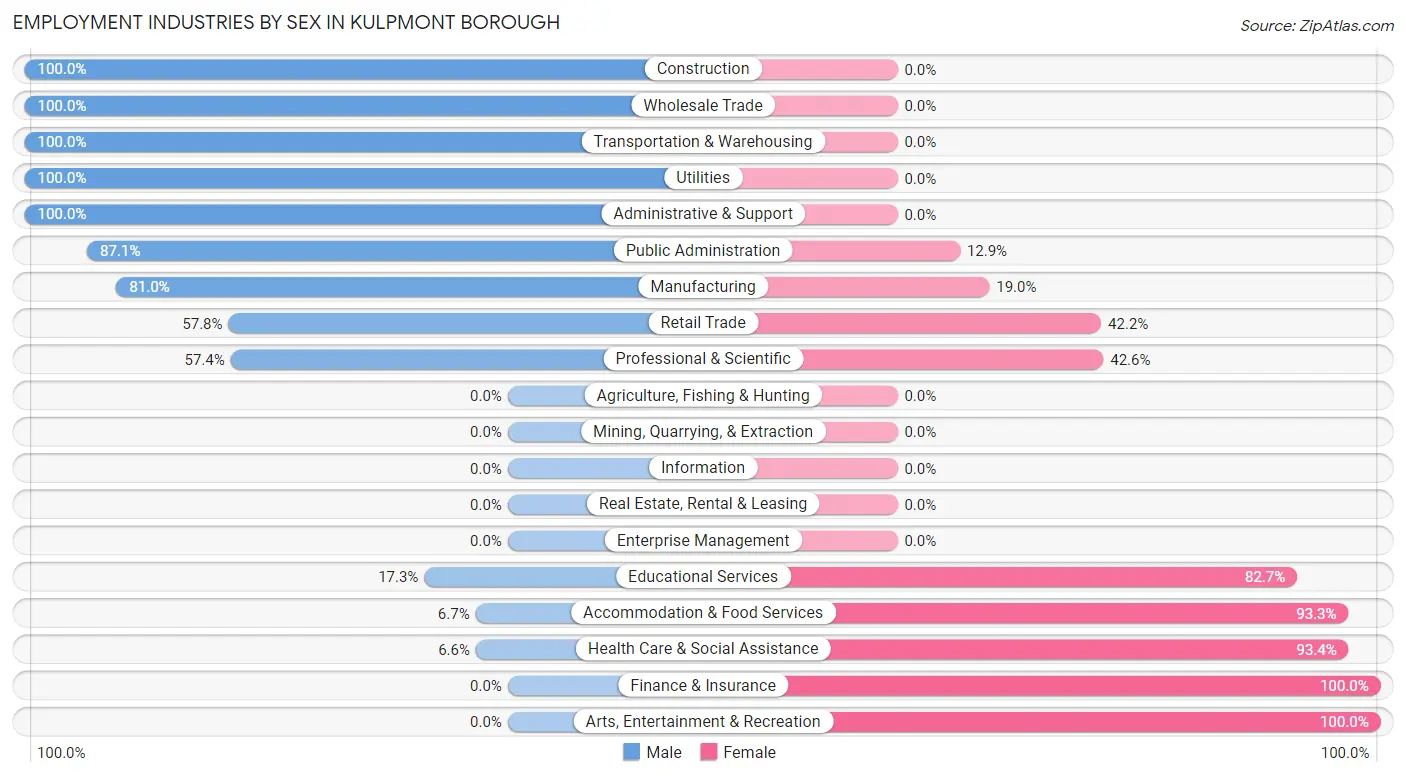
Employment Industries by Sex in Kulpmont borough
The Kulpmont borough industries that see more men than women are Construction (100.0%), Wholesale Trade (100.0%), and Transportation & Warehousing (100.0%), whereas the industries that tend to have a higher number of women are Finance & Insurance (100.0%), Arts, Entertainment & Recreation (100.0%), and Health Care & Social Assistance (93.4%).
| Industry | Male | Female |
| Agriculture, Fishing & Hunting | 0 (0.0%) | 0 (0.0%) |
| Mining, Quarrying, & Extraction | 0 (0.0%) | 0 (0.0%) |
| Construction | 225 (100.0%) | 0 (0.0%) |
| Manufacturing | 115 (81.0%) | 27 (19.0%) |
| Wholesale Trade | 33 (100.0%) | 0 (0.0%) |
| Retail Trade | 192 (57.8%) | 140 (42.2%) |
| Transportation & Warehousing | 56 (100.0%) | 0 (0.0%) |
| Utilities | 17 (100.0%) | 0 (0.0%) |
| Information | 0 (0.0%) | 0 (0.0%) |
| Finance & Insurance | 0 (0.0%) | 32 (100.0%) |
| Real Estate, Rental & Leasing | 0 (0.0%) | 0 (0.0%) |
| Professional & Scientific | 35 (57.4%) | 26 (42.6%) |
| Enterprise Management | 0 (0.0%) | 0 (0.0%) |
| Administrative & Support | 15 (100.0%) | 0 (0.0%) |
| Educational Services | 23 (17.3%) | 110 (82.7%) |
| Health Care & Social Assistance | 8 (6.6%) | 113 (93.4%) |
| Arts, Entertainment & Recreation | 0 (0.0%) | 33 (100.0%) |
| Accommodation & Food Services | 2 (6.7%) | 28 (93.3%) |
| Public Administration | 74 (87.1%) | 11 (12.9%) |
| Total | 795 (59.2%) | 547 (40.8%) |
Education in Kulpmont borough
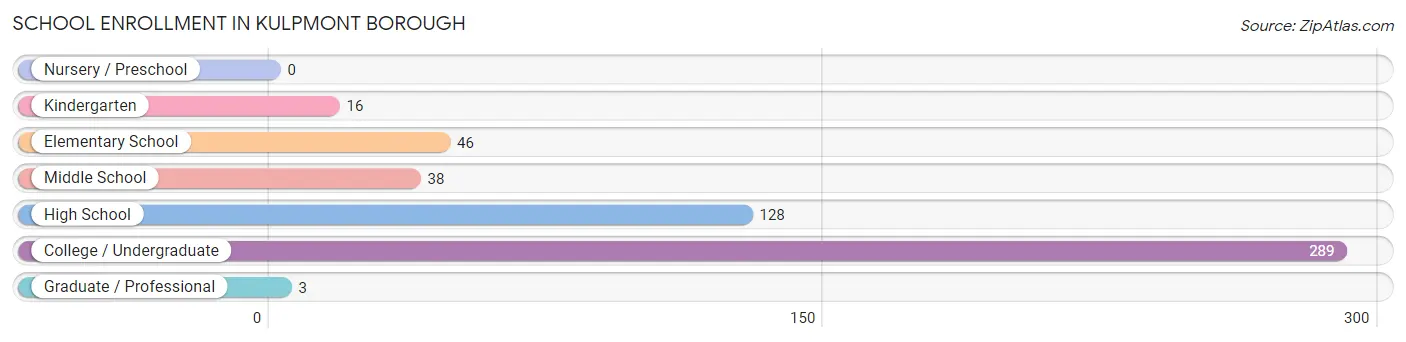
School Enrollment in Kulpmont borough
The most common levels of schooling among the 520 students in Kulpmont borough are college / undergraduate (289 | 55.6%), high school (128 | 24.6%), and elementary school (46 | 8.8%).
| School Level | # Students | % Students |
| Nursery / Preschool | 0 | 0.0% |
| Kindergarten | 16 | 3.1% |
| Elementary School | 46 | 8.8% |
| Middle School | 38 | 7.3% |
| High School | 128 | 24.6% |
| College / Undergraduate | 289 | 55.6% |
| Graduate / Professional | 3 | 0.6% |
| Total | 520 | 100.0% |
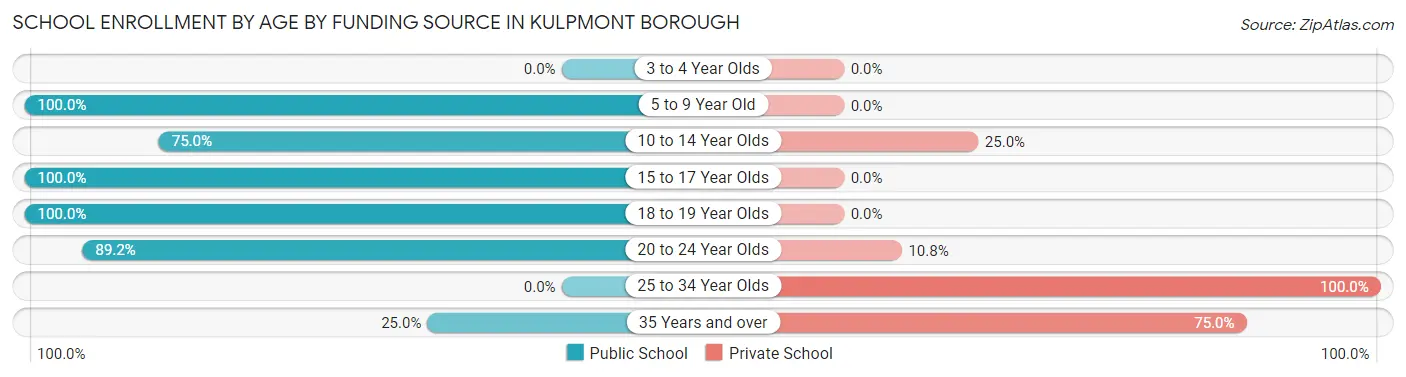
School Enrollment by Age by Funding Source in Kulpmont borough
Out of a total of 520 students who are enrolled in schools in Kulpmont borough, 131 (25.2%) attend a private institution, while the remaining 389 (74.8%) are enrolled in public schools. The age group of 25 to 34 year olds has the highest likelihood of being enrolled in private schools, with 73 (100.0% in the age bracket) enrolled. Conversely, the age group of 5 to 9 year old has the lowest likelihood of being enrolled in a private school, with 44 (100.0% in the age bracket) attending a public institution.
| Age Bracket | Public School | Private School |
| 3 to 4 Year Olds | 0 (0.0%) | 0 (0.0%) |
| 5 to 9 Year Old | 44 (100.0%) | 0 (0.0%) |
| 10 to 14 Year Olds | 42 (75.0%) | 14 (25.0%) |
| 15 to 17 Year Olds | 113 (100.0%) | 0 (0.0%) |
| 18 to 19 Year Olds | 64 (100.0%) | 0 (0.0%) |
| 20 to 24 Year Olds | 116 (89.2%) | 14 (10.8%) |
| 25 to 34 Year Olds | 0 (0.0%) | 73 (100.0%) |
| 35 Years and over | 10 (25.0%) | 30 (75.0%) |
| Total | 389 (74.8%) | 131 (25.2%) |
Educational Attainment by Field of Study in Kulpmont borough
Science & technology (64 | 19.6%), engineering (48 | 14.7%), social sciences (36 | 11.0%), education (33 | 10.1%), and literature & languages (26 | 8.0%) are the most common fields of study among 326 individuals in Kulpmont borough who have obtained a bachelor's degree or higher.
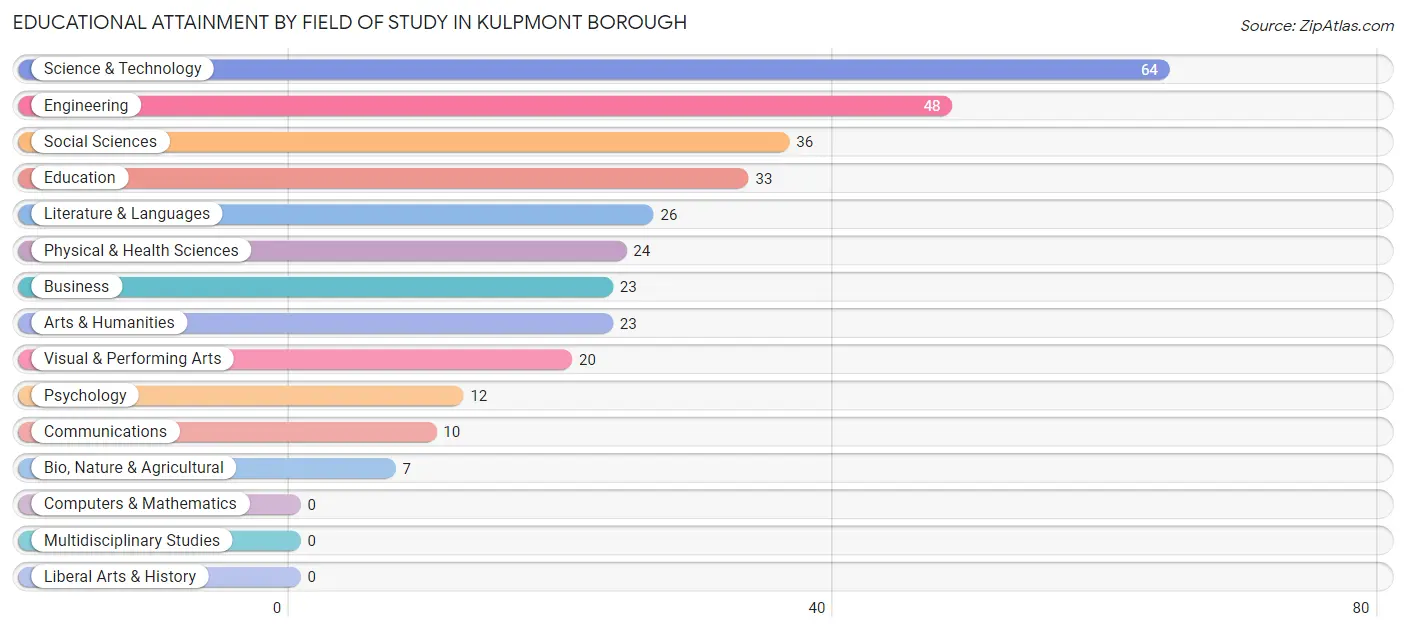
| Field of Study | # Graduates | % Graduates |
| Computers & Mathematics | 0 | 0.0% |
| Bio, Nature & Agricultural | 7 | 2.1% |
| Physical & Health Sciences | 24 | 7.4% |
| Psychology | 12 | 3.7% |
| Social Sciences | 36 | 11.0% |
| Engineering | 48 | 14.7% |
| Multidisciplinary Studies | 0 | 0.0% |
| Science & Technology | 64 | 19.6% |
| Business | 23 | 7.1% |
| Education | 33 | 10.1% |
| Literature & Languages | 26 | 8.0% |
| Liberal Arts & History | 0 | 0.0% |
| Visual & Performing Arts | 20 | 6.1% |
| Communications | 10 | 3.1% |
| Arts & Humanities | 23 | 7.1% |
| Total | 326 | 100.0% |
Transportation & Commute in Kulpmont borough
Vehicle Availability by Sex in Kulpmont borough
The most prevalent vehicle ownership categories in Kulpmont borough are males with 2 vehicles (345, accounting for 48.9%) and females with 2 vehicles (226, making up 63.1%).
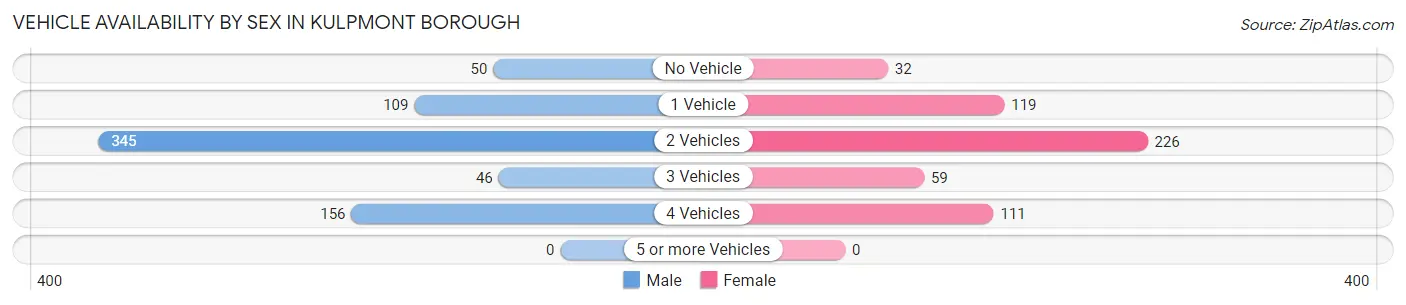
| Vehicles Available | Male | Female |
| No Vehicle | 50 (7.1%) | 32 (5.9%) |
| 1 Vehicle | 109 (15.4%) | 119 (21.8%) |
| 2 Vehicles | 345 (48.9%) | 226 (41.3%) |
| 3 Vehicles | 46 (6.5%) | 59 (10.8%) |
| 4 Vehicles | 156 (22.1%) | 111 (20.3%) |
| 5 or more Vehicles | 0 (0.0%) | 0 (0.0%) |
| Total | 706 (100.0%) | 547 (100.0%) |
Commute Time in Kulpmont borough
The most frequently occuring commute durations in Kulpmont borough are 10 to 14 minutes (213 commuters, 17.4%), 45 to 59 minutes (165 commuters, 13.5%), and 20 to 24 minutes (150 commuters, 12.2%).
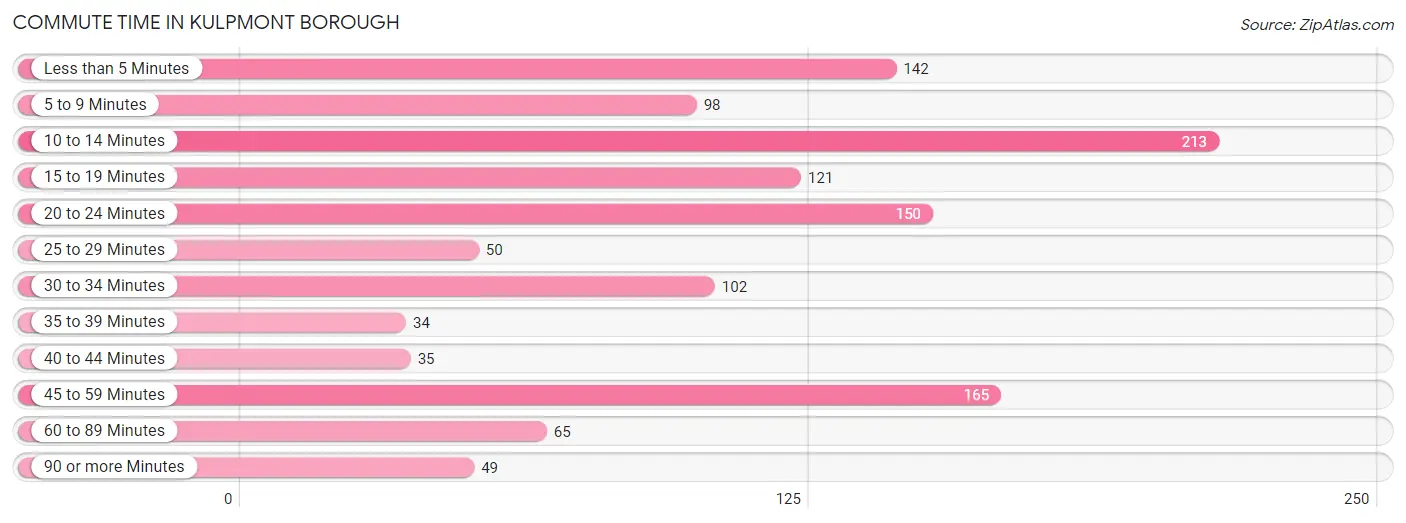
| Commute Time | # Commuters | % Commuters |
| Less than 5 Minutes | 142 | 11.6% |
| 5 to 9 Minutes | 98 | 8.0% |
| 10 to 14 Minutes | 213 | 17.4% |
| 15 to 19 Minutes | 121 | 9.9% |
| 20 to 24 Minutes | 150 | 12.2% |
| 25 to 29 Minutes | 50 | 4.1% |
| 30 to 34 Minutes | 102 | 8.3% |
| 35 to 39 Minutes | 34 | 2.8% |
| 40 to 44 Minutes | 35 | 2.9% |
| 45 to 59 Minutes | 165 | 13.5% |
| 60 to 89 Minutes | 65 | 5.3% |
| 90 or more Minutes | 49 | 4.0% |
Commute Time by Sex in Kulpmont borough
The most common commute times in Kulpmont borough are 45 to 59 minutes (112 commuters, 16.1%) for males and 10 to 14 minutes (128 commuters, 24.2%) for females.
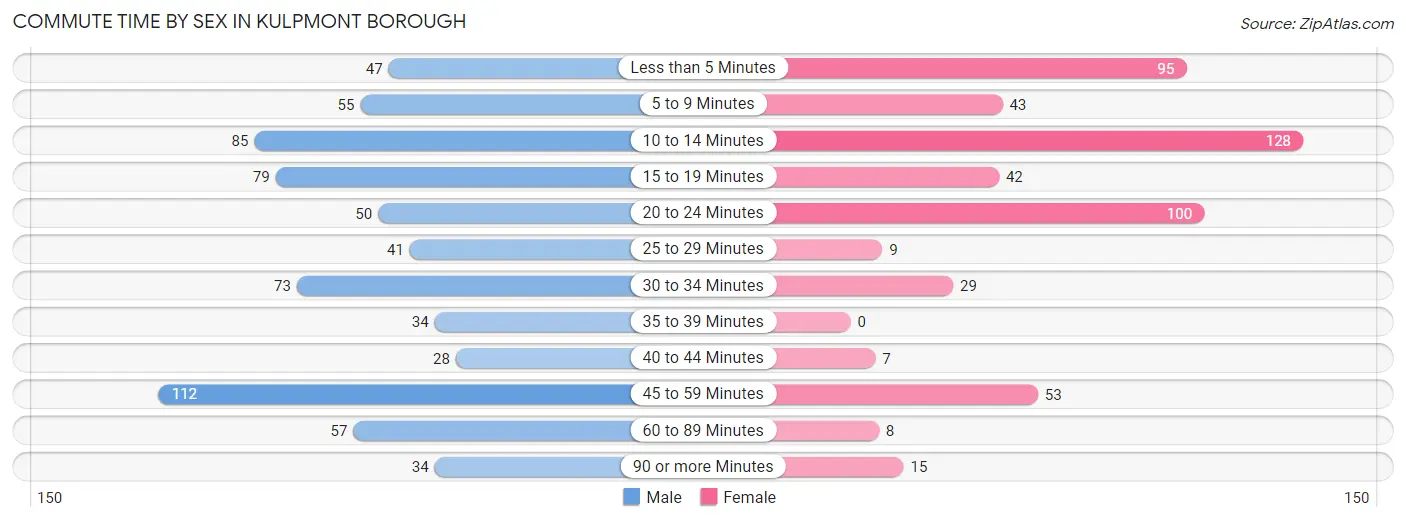
| Commute Time | Male | Female |
| Less than 5 Minutes | 47 (6.8%) | 95 (18.0%) |
| 5 to 9 Minutes | 55 (7.9%) | 43 (8.1%) |
| 10 to 14 Minutes | 85 (12.2%) | 128 (24.2%) |
| 15 to 19 Minutes | 79 (11.4%) | 42 (7.9%) |
| 20 to 24 Minutes | 50 (7.2%) | 100 (18.9%) |
| 25 to 29 Minutes | 41 (5.9%) | 9 (1.7%) |
| 30 to 34 Minutes | 73 (10.5%) | 29 (5.5%) |
| 35 to 39 Minutes | 34 (4.9%) | 0 (0.0%) |
| 40 to 44 Minutes | 28 (4.0%) | 7 (1.3%) |
| 45 to 59 Minutes | 112 (16.1%) | 53 (10.0%) |
| 60 to 89 Minutes | 57 (8.2%) | 8 (1.5%) |
| 90 or more Minutes | 34 (4.9%) | 15 (2.8%) |
Time of Departure to Work by Sex in Kulpmont borough
The most frequent times of departure to work in Kulpmont borough are 4:00 PM to 11:59 PM (109, 15.7%) for males and 8:00 AM to 8:29 AM (99, 18.7%) for females.
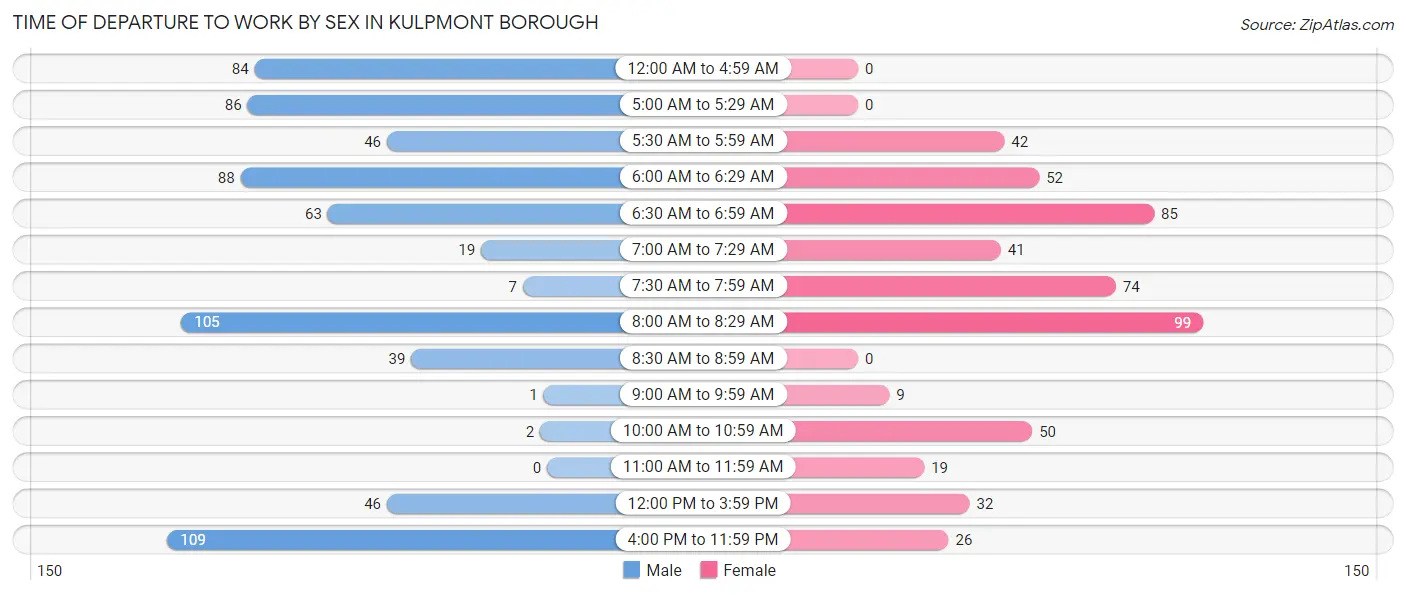
| Time of Departure | Male | Female |
| 12:00 AM to 4:59 AM | 84 (12.1%) | 0 (0.0%) |
| 5:00 AM to 5:29 AM | 86 (12.4%) | 0 (0.0%) |
| 5:30 AM to 5:59 AM | 46 (6.6%) | 42 (7.9%) |
| 6:00 AM to 6:29 AM | 88 (12.7%) | 52 (9.8%) |
| 6:30 AM to 6:59 AM | 63 (9.1%) | 85 (16.1%) |
| 7:00 AM to 7:29 AM | 19 (2.7%) | 41 (7.7%) |
| 7:30 AM to 7:59 AM | 7 (1.0%) | 74 (14.0%) |
| 8:00 AM to 8:29 AM | 105 (15.1%) | 99 (18.7%) |
| 8:30 AM to 8:59 AM | 39 (5.6%) | 0 (0.0%) |
| 9:00 AM to 9:59 AM | 1 (0.1%) | 9 (1.7%) |
| 10:00 AM to 10:59 AM | 2 (0.3%) | 50 (9.5%) |
| 11:00 AM to 11:59 AM | 0 (0.0%) | 19 (3.6%) |
| 12:00 PM to 3:59 PM | 46 (6.6%) | 32 (6.0%) |
| 4:00 PM to 11:59 PM | 109 (15.7%) | 26 (4.9%) |
| Total | 695 (100.0%) | 529 (100.0%) |
Housing Occupancy in Kulpmont borough
Occupancy by Ownership in Kulpmont borough
Of the total 1,353 dwellings in Kulpmont borough, owner-occupied units account for 1,075 (79.4%), while renter-occupied units make up 278 (20.5%).
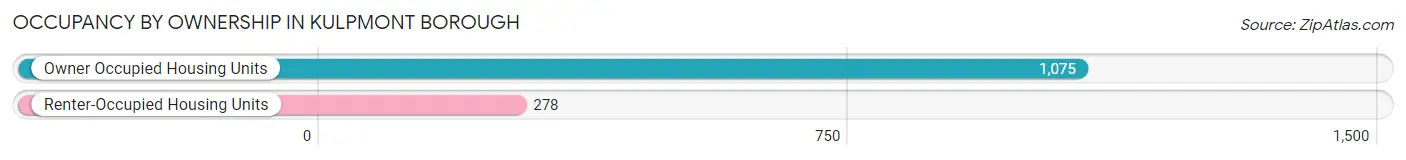
| Occupancy | # Housing Units | % Housing Units |
| Owner Occupied Housing Units | 1,075 | 79.4% |
| Renter-Occupied Housing Units | 278 | 20.5% |
| Total Occupied Housing Units | 1,353 | 100.0% |
Occupancy by Household Size in Kulpmont borough
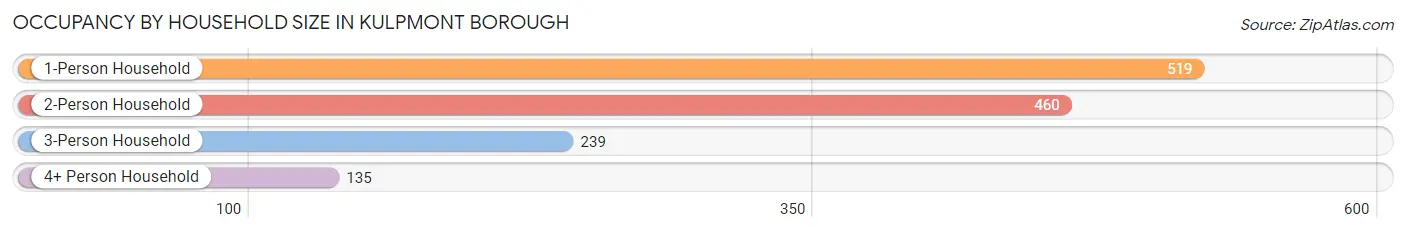
| Household Size | # Housing Units | % Housing Units |
| 1-Person Household | 519 | 38.4% |
| 2-Person Household | 460 | 34.0% |
| 3-Person Household | 239 | 17.7% |
| 4+ Person Household | 135 | 10.0% |
| Total Housing Units | 1,353 | 100.0% |
Occupancy by Ownership by Household Size in Kulpmont borough
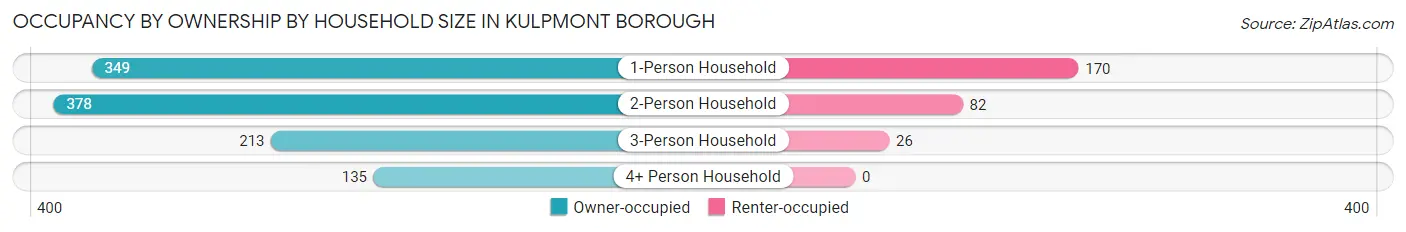
| Household Size | Owner-occupied | Renter-occupied |
| 1-Person Household | 349 (67.2%) | 170 (32.8%) |
| 2-Person Household | 378 (82.2%) | 82 (17.8%) |
| 3-Person Household | 213 (89.1%) | 26 (10.9%) |
| 4+ Person Household | 135 (100.0%) | 0 (0.0%) |
| Total Housing Units | 1,075 (79.4%) | 278 (20.5%) |
Occupancy by Educational Attainment in Kulpmont borough
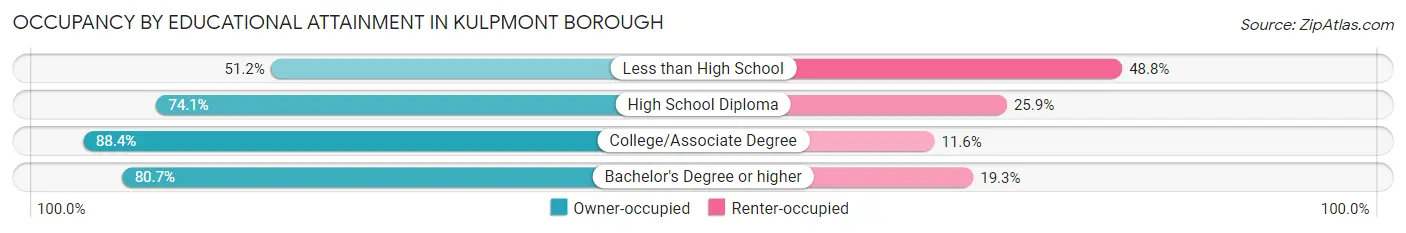
| Household Size | Owner-occupied | Renter-occupied |
| Less than High School | 21 (51.2%) | 20 (48.8%) |
| High School Diploma | 494 (74.1%) | 173 (25.9%) |
| College/Associate Degree | 451 (88.4%) | 59 (11.6%) |
| Bachelor's Degree or higher | 109 (80.7%) | 26 (19.3%) |
Occupancy by Age of Householder in Kulpmont borough
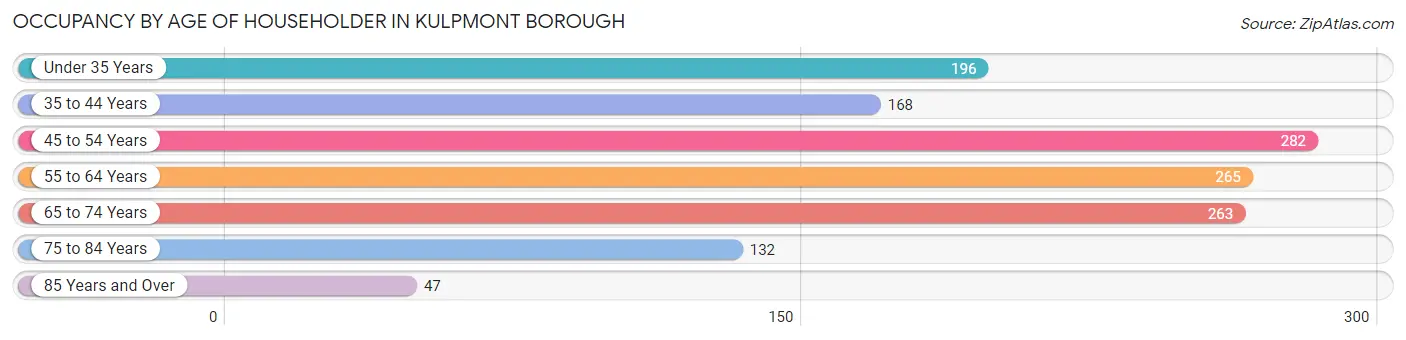
| Age Bracket | # Households | % Households |
| Under 35 Years | 196 | 14.5% |
| 35 to 44 Years | 168 | 12.4% |
| 45 to 54 Years | 282 | 20.8% |
| 55 to 64 Years | 265 | 19.6% |
| 65 to 74 Years | 263 | 19.4% |
| 75 to 84 Years | 132 | 9.8% |
| 85 Years and Over | 47 | 3.5% |
| Total | 1,353 | 100.0% |
Housing Finances in Kulpmont borough
Median Income by Occupancy in Kulpmont borough
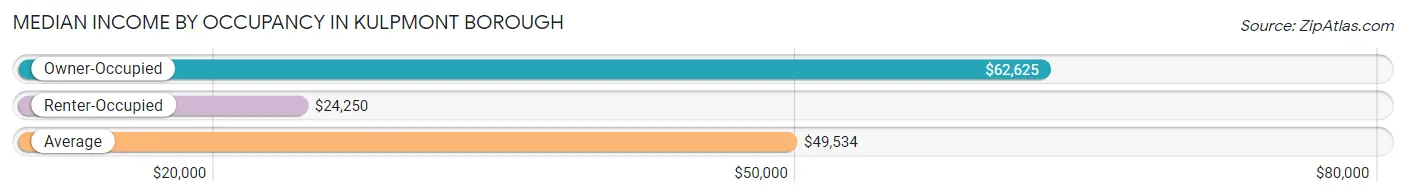
| Occupancy Type | # Households | Median Income |
| Owner-Occupied | 1,075 (79.4%) | $62,625 |
| Renter-Occupied | 278 (20.5%) | $24,250 |
| Average | 1,353 (100.0%) | $49,534 |
Occupancy by Householder Income Bracket in Kulpmont borough
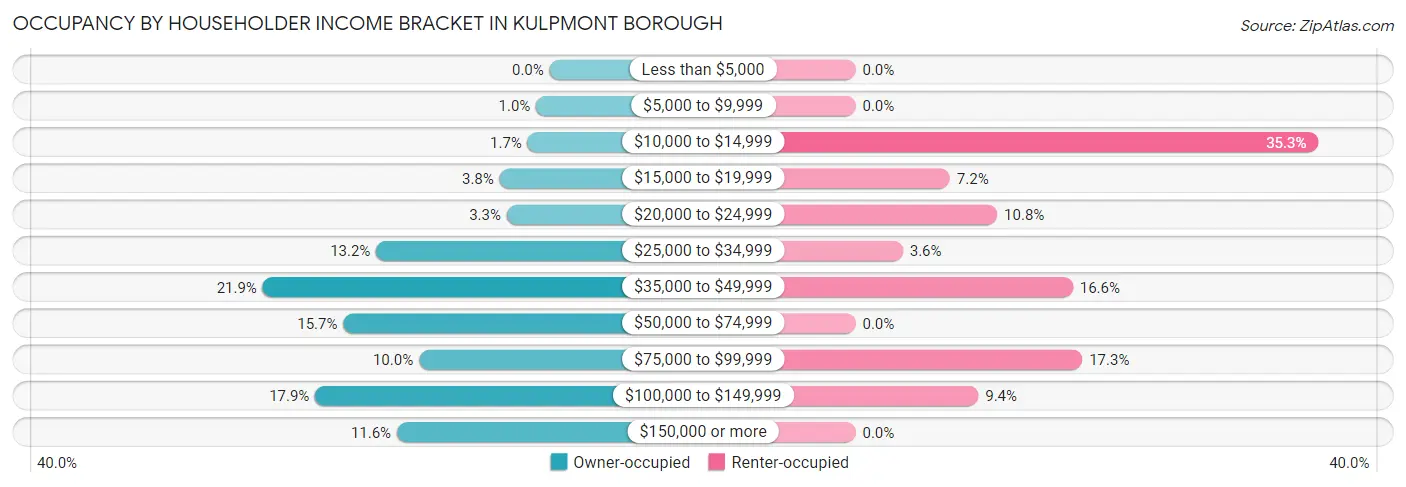
| Income Bracket | Owner-occupied | Renter-occupied |
| Less than $5,000 | 0 (0.0%) | 0 (0.0%) |
| $5,000 to $9,999 | 11 (1.0%) | 0 (0.0%) |
| $10,000 to $14,999 | 18 (1.7%) | 98 (35.2%) |
| $15,000 to $19,999 | 41 (3.8%) | 20 (7.2%) |
| $20,000 to $24,999 | 35 (3.3%) | 30 (10.8%) |
| $25,000 to $34,999 | 142 (13.2%) | 10 (3.6%) |
| $35,000 to $49,999 | 235 (21.9%) | 46 (16.6%) |
| $50,000 to $74,999 | 169 (15.7%) | 0 (0.0%) |
| $75,000 to $99,999 | 107 (10.0%) | 48 (17.3%) |
| $100,000 to $149,999 | 192 (17.9%) | 26 (9.3%) |
| $150,000 or more | 125 (11.6%) | 0 (0.0%) |
| Total | 1,075 (100.0%) | 278 (100.0%) |
Monthly Housing Cost Tiers in Kulpmont borough
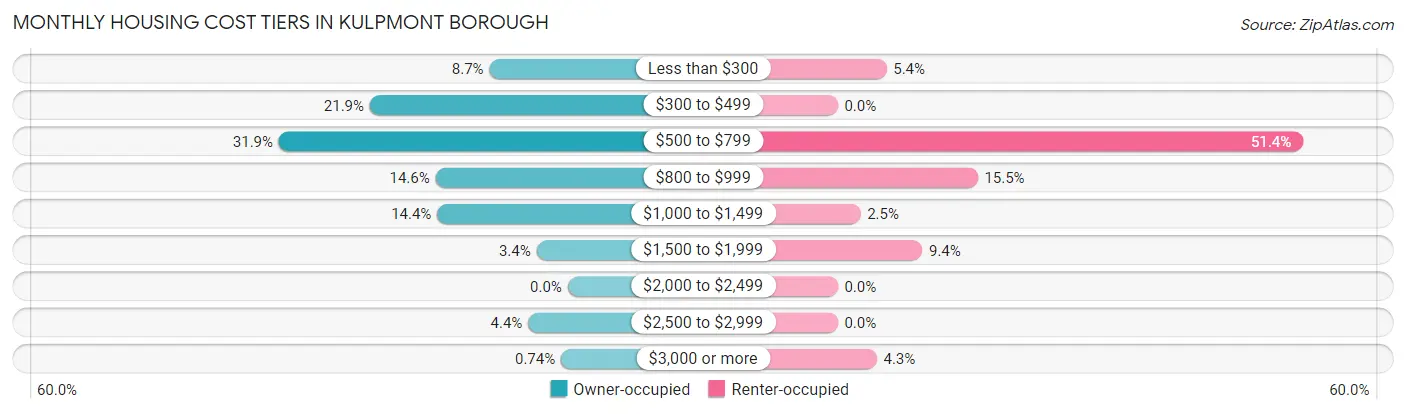
| Monthly Cost | Owner-occupied | Renter-occupied |
| Less than $300 | 93 (8.6%) | 15 (5.4%) |
| $300 to $499 | 235 (21.9%) | 0 (0.0%) |
| $500 to $799 | 343 (31.9%) | 143 (51.4%) |
| $800 to $999 | 157 (14.6%) | 43 (15.5%) |
| $1,000 to $1,499 | 155 (14.4%) | 7 (2.5%) |
| $1,500 to $1,999 | 37 (3.4%) | 26 (9.3%) |
| $2,000 to $2,499 | 0 (0.0%) | 0 (0.0%) |
| $2,500 to $2,999 | 47 (4.4%) | 0 (0.0%) |
| $3,000 or more | 8 (0.7%) | 12 (4.3%) |
| Total | 1,075 (100.0%) | 278 (100.0%) |
Physical Housing Characteristics in Kulpmont borough
Housing Structures in Kulpmont borough
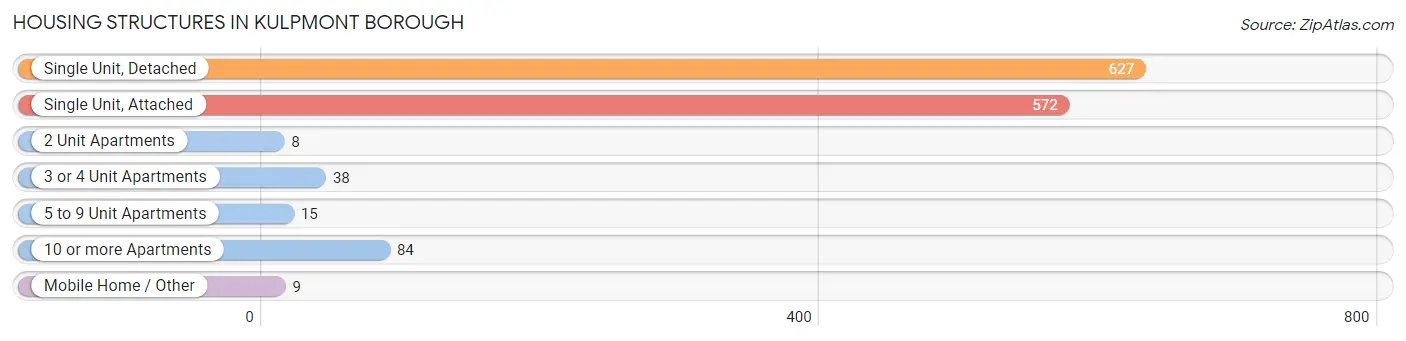
| Structure Type | # Housing Units | % Housing Units |
| Single Unit, Detached | 627 | 46.3% |
| Single Unit, Attached | 572 | 42.3% |
| 2 Unit Apartments | 8 | 0.6% |
| 3 or 4 Unit Apartments | 38 | 2.8% |
| 5 to 9 Unit Apartments | 15 | 1.1% |
| 10 or more Apartments | 84 | 6.2% |
| Mobile Home / Other | 9 | 0.7% |
| Total | 1,353 | 100.0% |
Housing Structures by Occupancy in Kulpmont borough
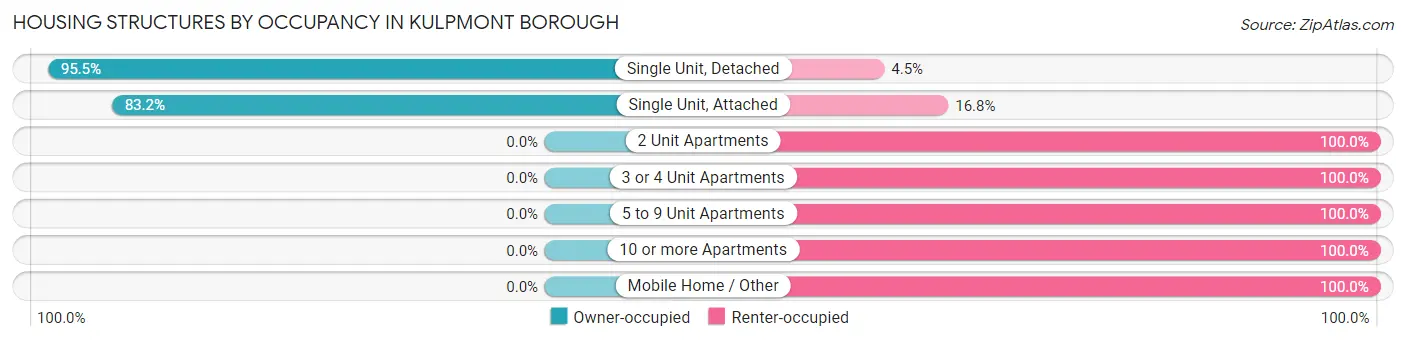
| Structure Type | Owner-occupied | Renter-occupied |
| Single Unit, Detached | 599 (95.5%) | 28 (4.5%) |
| Single Unit, Attached | 476 (83.2%) | 96 (16.8%) |
| 2 Unit Apartments | 0 (0.0%) | 8 (100.0%) |
| 3 or 4 Unit Apartments | 0 (0.0%) | 38 (100.0%) |
| 5 to 9 Unit Apartments | 0 (0.0%) | 15 (100.0%) |
| 10 or more Apartments | 0 (0.0%) | 84 (100.0%) |
| Mobile Home / Other | 0 (0.0%) | 9 (100.0%) |
| Total | 1,075 (79.4%) | 278 (20.5%) |
Housing Structures by Number of Rooms in Kulpmont borough
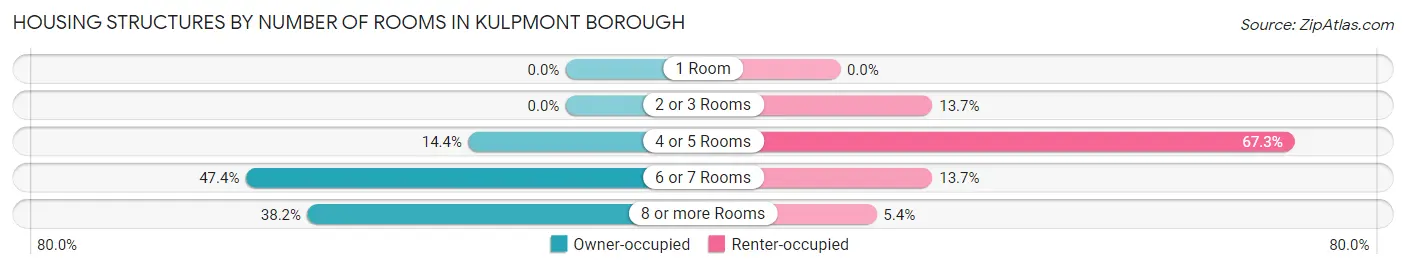
| Number of Rooms | Owner-occupied | Renter-occupied |
| 1 Room | 0 (0.0%) | 0 (0.0%) |
| 2 or 3 Rooms | 0 (0.0%) | 38 (13.7%) |
| 4 or 5 Rooms | 155 (14.4%) | 187 (67.3%) |
| 6 or 7 Rooms | 509 (47.3%) | 38 (13.7%) |
| 8 or more Rooms | 411 (38.2%) | 15 (5.4%) |
| Total | 1,075 (100.0%) | 278 (100.0%) |
Housing Structure by Heating Type in Kulpmont borough
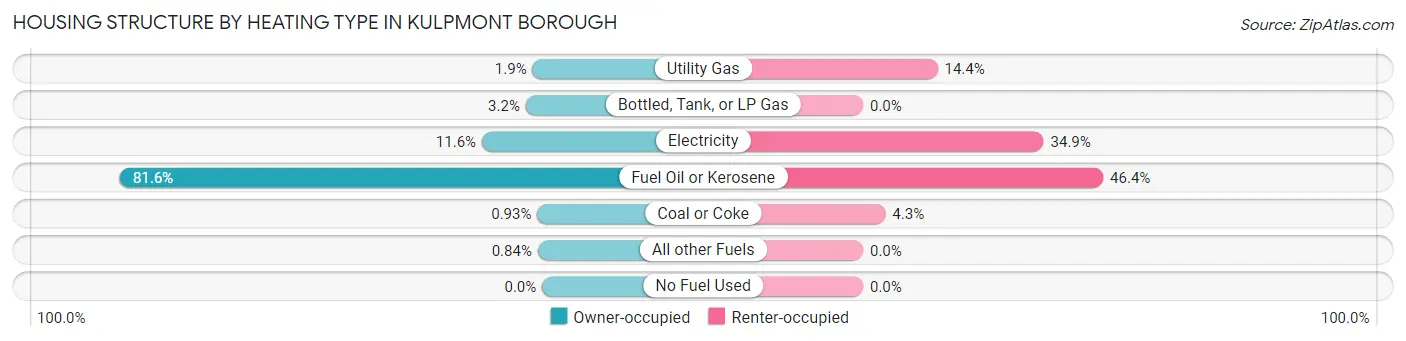
| Heating Type | Owner-occupied | Renter-occupied |
| Utility Gas | 20 (1.9%) | 40 (14.4%) |
| Bottled, Tank, or LP Gas | 34 (3.2%) | 0 (0.0%) |
| Electricity | 125 (11.6%) | 97 (34.9%) |
| Fuel Oil or Kerosene | 877 (81.6%) | 129 (46.4%) |
| Coal or Coke | 10 (0.9%) | 12 (4.3%) |
| All other Fuels | 9 (0.8%) | 0 (0.0%) |
| No Fuel Used | 0 (0.0%) | 0 (0.0%) |
| Total | 1,075 (100.0%) | 278 (100.0%) |
Household Vehicle Usage in Kulpmont borough
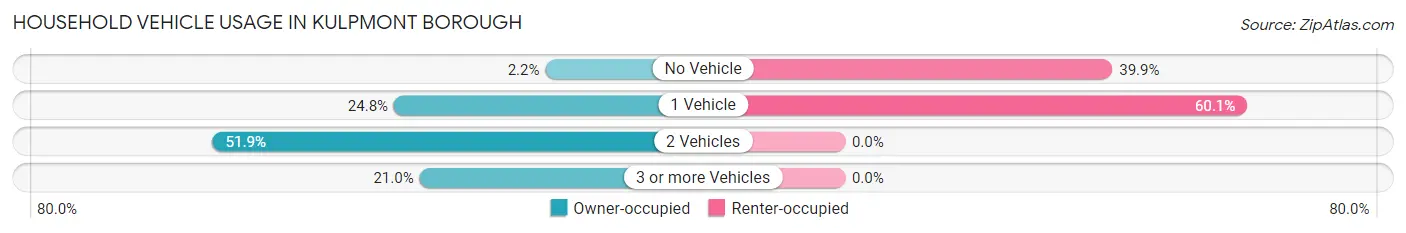
| Vehicles per Household | Owner-occupied | Renter-occupied |
| No Vehicle | 24 (2.2%) | 111 (39.9%) |
| 1 Vehicle | 267 (24.8%) | 167 (60.1%) |
| 2 Vehicles | 558 (51.9%) | 0 (0.0%) |
| 3 or more Vehicles | 226 (21.0%) | 0 (0.0%) |
| Total | 1,075 (100.0%) | 278 (100.0%) |
Real Estate & Mortgages in Kulpmont borough
Real Estate and Mortgage Overview in Kulpmont borough
| Characteristic | Without Mortgage | With Mortgage |
| Housing Units | 569 | 506 |
| Median Property Value | $72,600 | $80,500 |
| Median Household Income | $46,567 | $67 |
| Monthly Housing Costs | $480 | $8 |
| Real Estate Taxes | $1,026 | $0 |
Property Value by Mortgage Status in Kulpmont borough
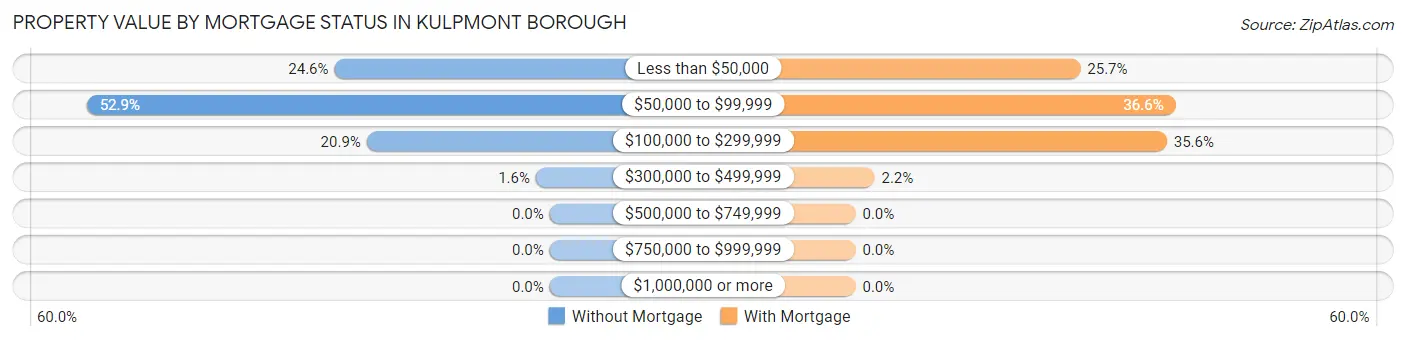
| Property Value | Without Mortgage | With Mortgage |
| Less than $50,000 | 140 (24.6%) | 130 (25.7%) |
| $50,000 to $99,999 | 301 (52.9%) | 185 (36.6%) |
| $100,000 to $299,999 | 119 (20.9%) | 180 (35.6%) |
| $300,000 to $499,999 | 9 (1.6%) | 11 (2.2%) |
| $500,000 to $749,999 | 0 (0.0%) | 0 (0.0%) |
| $750,000 to $999,999 | 0 (0.0%) | 0 (0.0%) |
| $1,000,000 or more | 0 (0.0%) | 0 (0.0%) |
| Total | 569 (100.0%) | 506 (100.0%) |
Household Income by Mortgage Status in Kulpmont borough
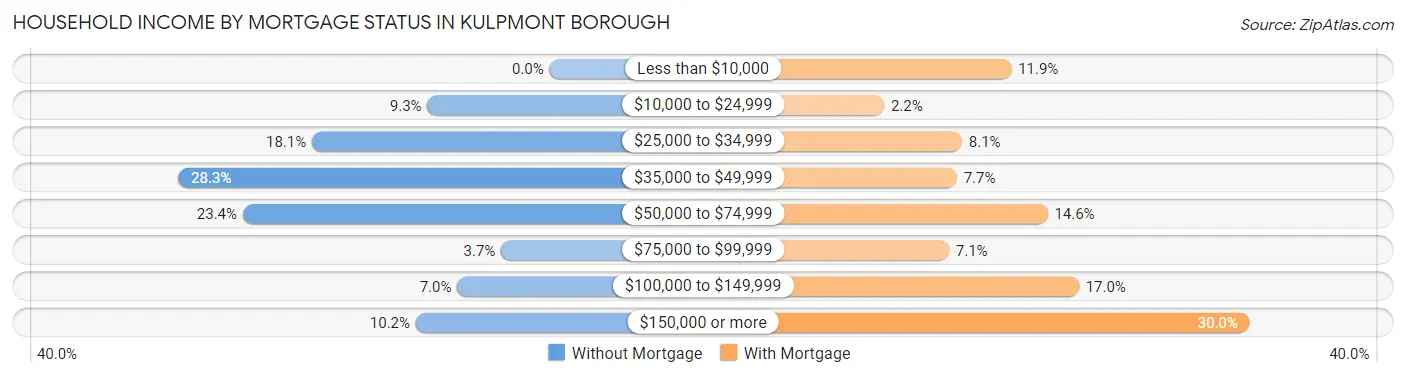
| Household Income | Without Mortgage | With Mortgage |
| Less than $10,000 | 0 (0.0%) | 60 (11.9%) |
| $10,000 to $24,999 | 53 (9.3%) | 11 (2.2%) |
| $25,000 to $34,999 | 103 (18.1%) | 41 (8.1%) |
| $35,000 to $49,999 | 161 (28.3%) | 39 (7.7%) |
| $50,000 to $74,999 | 133 (23.4%) | 74 (14.6%) |
| $75,000 to $99,999 | 21 (3.7%) | 36 (7.1%) |
| $100,000 to $149,999 | 40 (7.0%) | 86 (17.0%) |
| $150,000 or more | 58 (10.2%) | 152 (30.0%) |
| Total | 569 (100.0%) | 506 (100.0%) |
Property Value to Household Income Ratio in Kulpmont borough
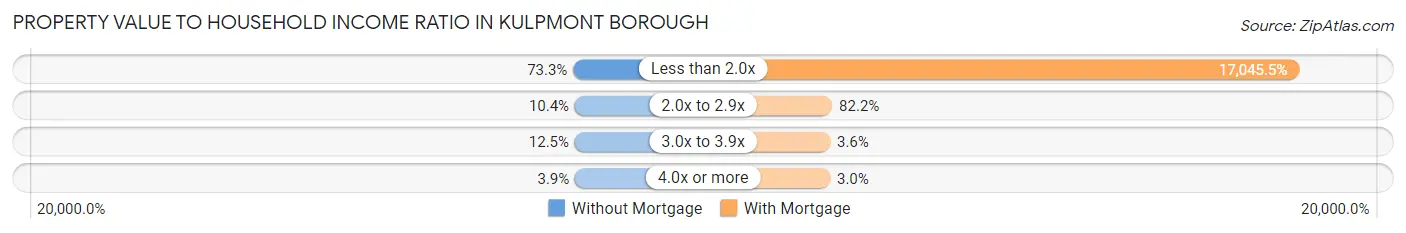
| Value-to-Income Ratio | Without Mortgage | With Mortgage |
| Less than 2.0x | 417 (73.3%) | 86,250 (17,045.4%) |
| 2.0x to 2.9x | 59 (10.4%) | 416 (82.2%) |
| 3.0x to 3.9x | 71 (12.5%) | 18 (3.6%) |
| 4.0x or more | 22 (3.9%) | 15 (3.0%) |
| Total | 569 (100.0%) | 506 (100.0%) |
Real Estate Taxes by Mortgage Status in Kulpmont borough
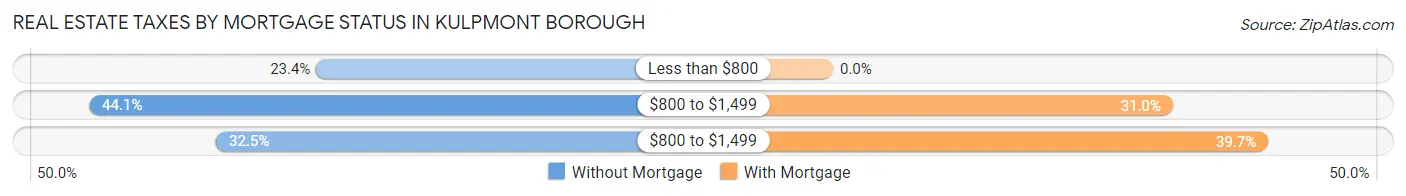
| Property Taxes | Without Mortgage | With Mortgage |
| Less than $800 | 133 (23.4%) | 0 (0.0%) |
| $800 to $1,499 | 251 (44.1%) | 157 (31.0%) |
| $800 to $1,499 | 185 (32.5%) | 201 (39.7%) |
| Total | 569 (100.0%) | 506 (100.0%) |
Health & Disability in Kulpmont borough
Health Insurance Coverage by Age in Kulpmont borough
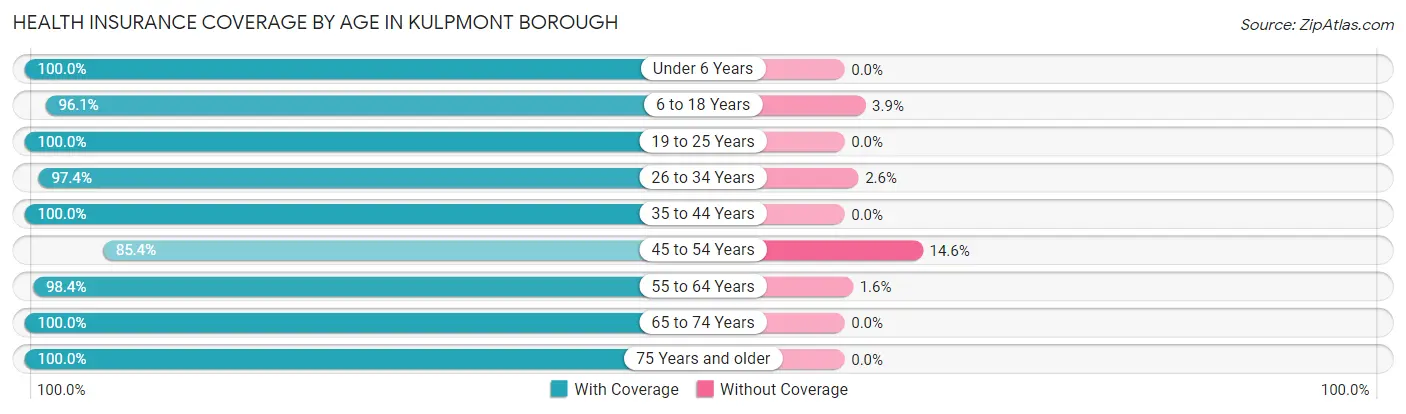
| Age Bracket | With Coverage | Without Coverage |
| Under 6 Years | 83 (100.0%) | 0 (0.0%) |
| 6 to 18 Years | 346 (96.1%) | 14 (3.9%) |
| 19 to 25 Years | 170 (100.0%) | 0 (0.0%) |
| 26 to 34 Years | 375 (97.4%) | 10 (2.6%) |
| 35 to 44 Years | 233 (100.0%) | 0 (0.0%) |
| 45 to 54 Years | 322 (85.4%) | 55 (14.6%) |
| 55 to 64 Years | 502 (98.4%) | 8 (1.6%) |
| 65 to 74 Years | 381 (100.0%) | 0 (0.0%) |
| 75 Years and older | 259 (100.0%) | 0 (0.0%) |
| Total | 2,671 (96.9%) | 87 (3.2%) |
Health Insurance Coverage by Citizenship Status in Kulpmont borough
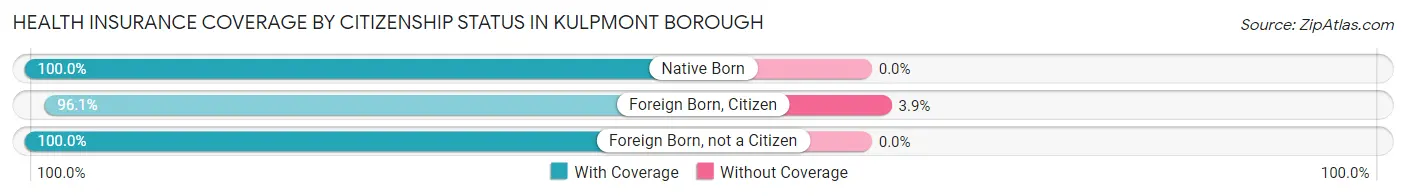
| Citizenship Status | With Coverage | Without Coverage |
| Native Born | 83 (100.0%) | 0 (0.0%) |
| Foreign Born, Citizen | 346 (96.1%) | 14 (3.9%) |
| Foreign Born, not a Citizen | 170 (100.0%) | 0 (0.0%) |
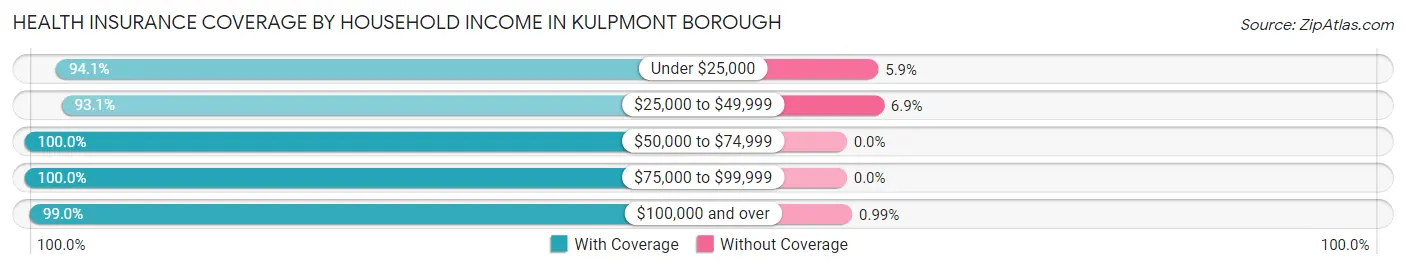
Health Insurance Coverage by Household Income in Kulpmont borough
| Household Income | With Coverage | Without Coverage |
| Under $25,000 | 351 (94.1%) | 22 (5.9%) |
| $25,000 to $49,999 | 738 (93.1%) | 55 (6.9%) |
| $50,000 to $74,999 | 269 (100.0%) | 0 (0.0%) |
| $75,000 to $99,999 | 299 (100.0%) | 0 (0.0%) |
| $100,000 and over | 1,003 (99.0%) | 10 (1.0%) |
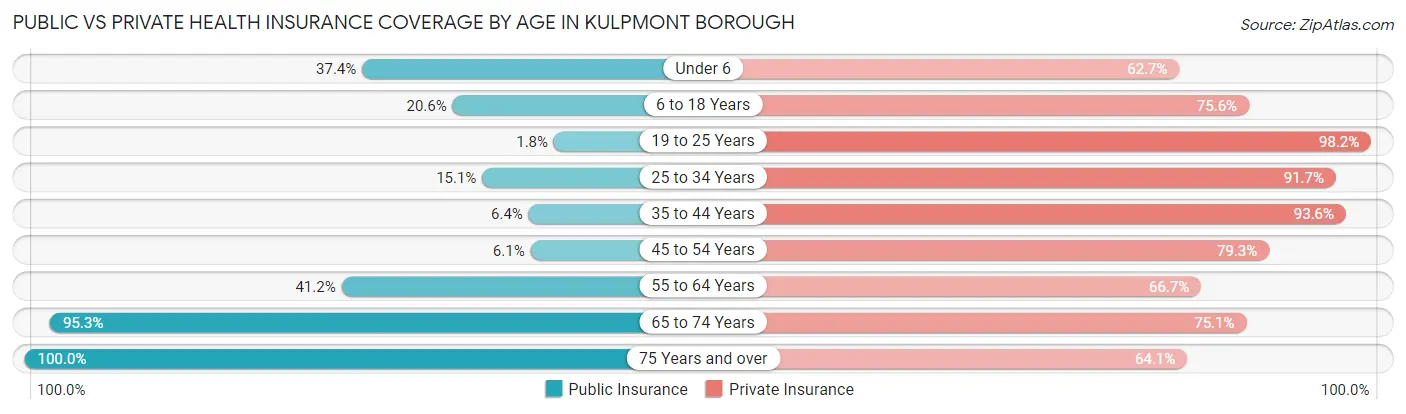
Public vs Private Health Insurance Coverage by Age in Kulpmont borough
| Age Bracket | Public Insurance | Private Insurance |
| Under 6 | 31 (37.3%) | 52 (62.6%) |
| 6 to 18 Years | 74 (20.6%) | 272 (75.6%) |
| 19 to 25 Years | 3 (1.8%) | 167 (98.2%) |
| 25 to 34 Years | 58 (15.1%) | 353 (91.7%) |
| 35 to 44 Years | 15 (6.4%) | 218 (93.6%) |
| 45 to 54 Years | 23 (6.1%) | 299 (79.3%) |
| 55 to 64 Years | 210 (41.2%) | 340 (66.7%) |
| 65 to 74 Years | 363 (95.3%) | 286 (75.1%) |
| 75 Years and over | 259 (100.0%) | 166 (64.1%) |
| Total | 1,036 (37.6%) | 2,153 (78.1%) |
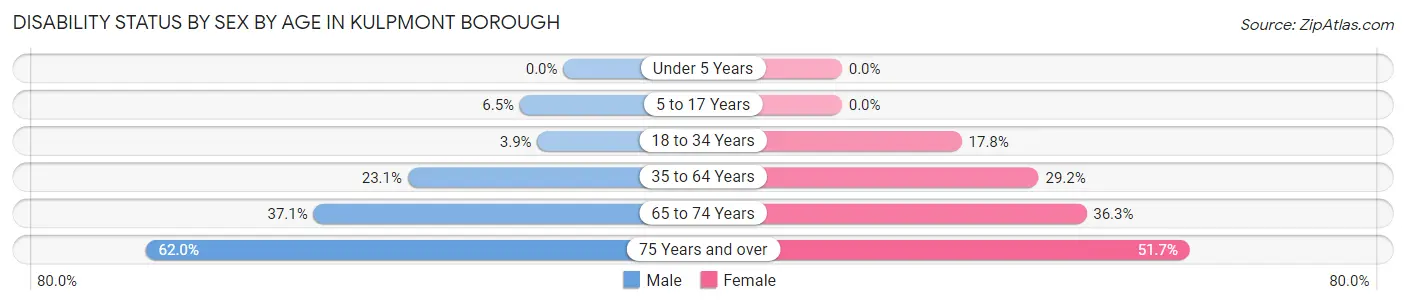
Disability Status by Sex by Age in Kulpmont borough
| Age Bracket | Male | Female |
| Under 5 Years | 0 (0.0%) | 0 (0.0%) |
| 5 to 17 Years | 14 (6.5%) | 0 (0.0%) |
| 18 to 34 Years | 13 (3.8%) | 50 (17.8%) |
| 35 to 64 Years | 152 (23.1%) | 135 (29.2%) |
| 65 to 74 Years | 79 (37.1%) | 61 (36.3%) |
| 75 Years and over | 49 (62.0%) | 93 (51.7%) |
Disability Class by Sex by Age in Kulpmont borough
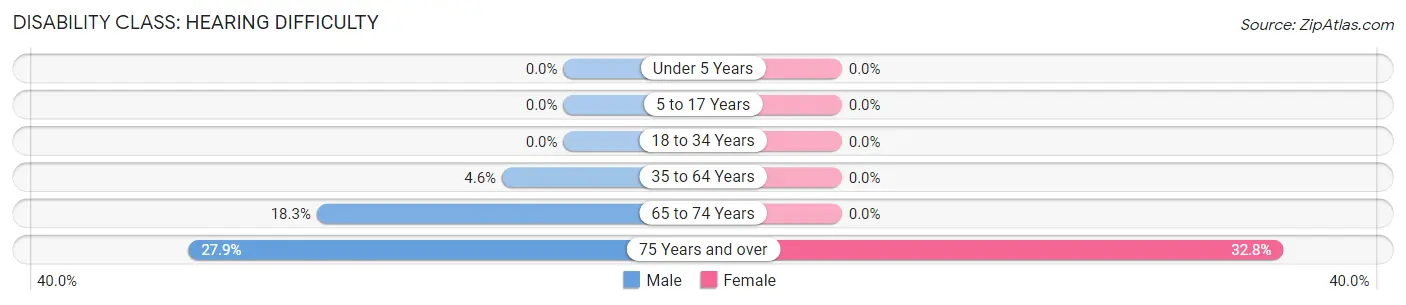
Disability Class: Hearing Difficulty
| Age Bracket | Male | Female |
| Under 5 Years | 0 (0.0%) | 0 (0.0%) |
| 5 to 17 Years | 0 (0.0%) | 0 (0.0%) |
| 18 to 34 Years | 0 (0.0%) | 0 (0.0%) |
| 35 to 64 Years | 30 (4.6%) | 0 (0.0%) |
| 65 to 74 Years | 39 (18.3%) | 0 (0.0%) |
| 75 Years and over | 22 (27.9%) | 59 (32.8%) |
Disability Class: Vision Difficulty
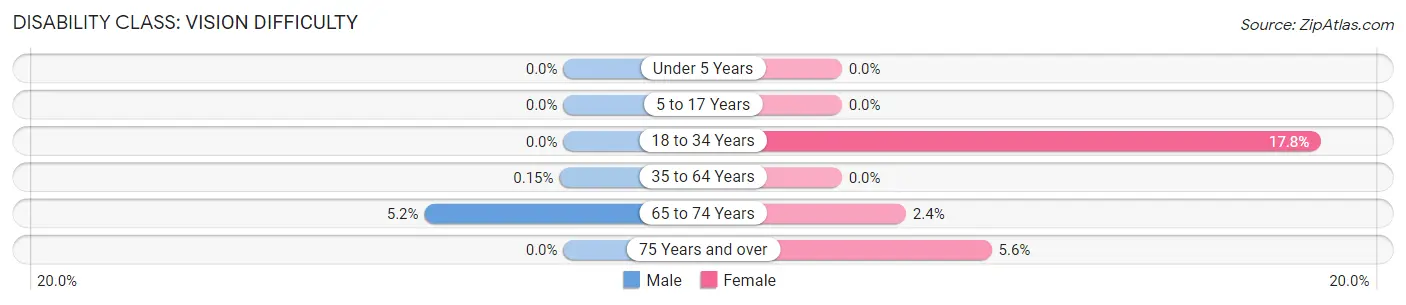
| Age Bracket | Male | Female |
| Under 5 Years | 0 (0.0%) | 0 (0.0%) |
| 5 to 17 Years | 0 (0.0%) | 0 (0.0%) |
| 18 to 34 Years | 0 (0.0%) | 50 (17.8%) |
| 35 to 64 Years | 1 (0.2%) | 0 (0.0%) |
| 65 to 74 Years | 11 (5.2%) | 4 (2.4%) |
| 75 Years and over | 0 (0.0%) | 10 (5.6%) |
Disability Class: Cognitive Difficulty
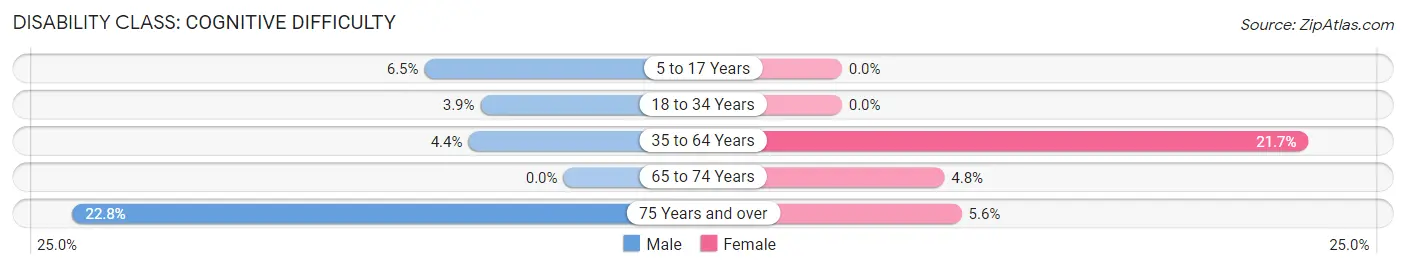
| Age Bracket | Male | Female |
| 5 to 17 Years | 14 (6.5%) | 0 (0.0%) |
| 18 to 34 Years | 13 (3.8%) | 0 (0.0%) |
| 35 to 64 Years | 29 (4.4%) | 100 (21.6%) |
| 65 to 74 Years | 0 (0.0%) | 8 (4.8%) |
| 75 Years and over | 18 (22.8%) | 10 (5.6%) |
Disability Class: Ambulatory Difficulty
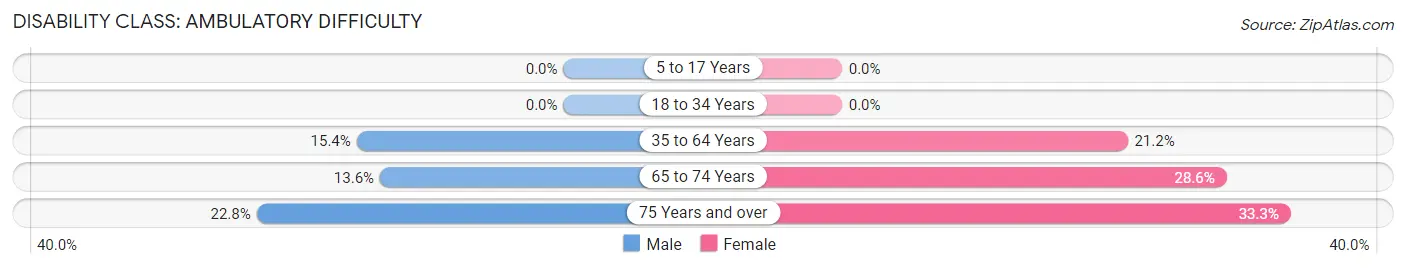
| Age Bracket | Male | Female |
| 5 to 17 Years | 0 (0.0%) | 0 (0.0%) |
| 18 to 34 Years | 0 (0.0%) | 0 (0.0%) |
| 35 to 64 Years | 101 (15.3%) | 98 (21.2%) |
| 65 to 74 Years | 29 (13.6%) | 48 (28.6%) |
| 75 Years and over | 18 (22.8%) | 60 (33.3%) |
Disability Class: Self-Care Difficulty
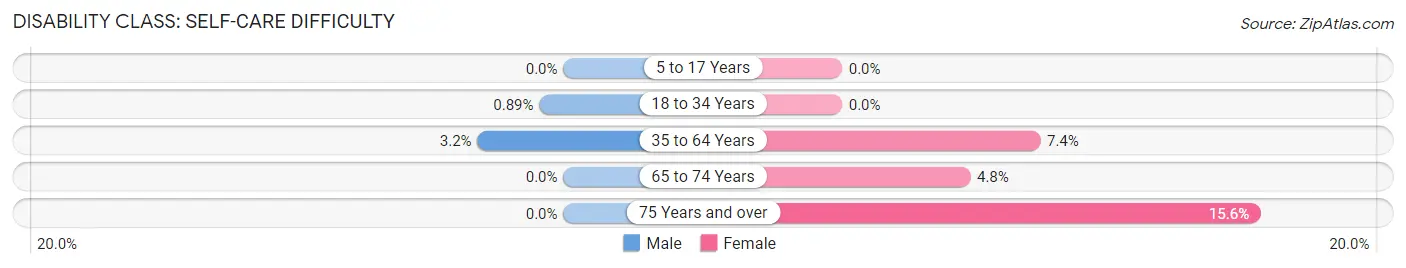
| Age Bracket | Male | Female |
| 5 to 17 Years | 0 (0.0%) | 0 (0.0%) |
| 18 to 34 Years | 3 (0.9%) | 0 (0.0%) |
| 35 to 64 Years | 21 (3.2%) | 34 (7.4%) |
| 65 to 74 Years | 0 (0.0%) | 8 (4.8%) |
| 75 Years and over | 0 (0.0%) | 28 (15.6%) |
Technology Access in Kulpmont borough
Computing Device Access in Kulpmont borough
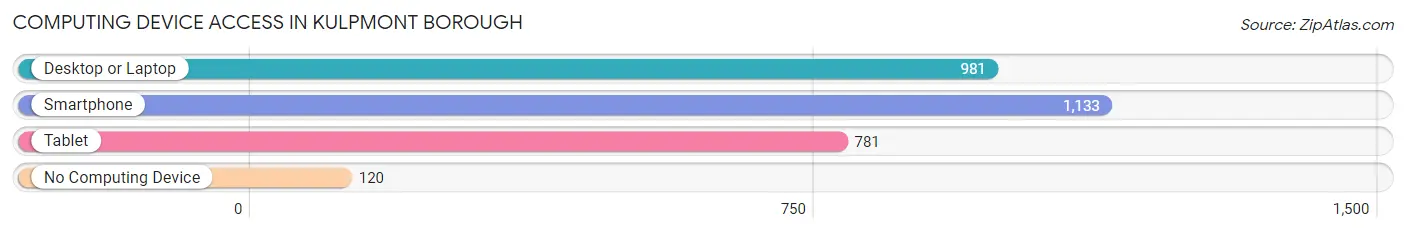
| Device Type | # Households | % Households |
| Desktop or Laptop | 981 | 72.5% |
| Smartphone | 1,133 | 83.7% |
| Tablet | 781 | 57.7% |
| No Computing Device | 120 | 8.9% |
| Total | 1,353 | 100.0% |
Internet Access in Kulpmont borough
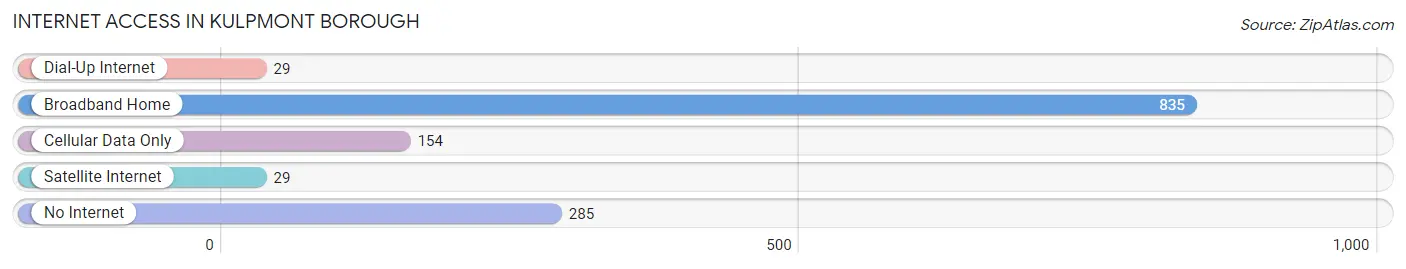
| Internet Type | # Households | % Households |
| Dial-Up Internet | 29 | 2.1% |
| Broadband Home | 835 | 61.7% |
| Cellular Data Only | 154 | 11.4% |
| Satellite Internet | 29 | 2.1% |
| No Internet | 285 | 21.1% |
| Total | 1,353 | 100.0% |
Kulpmont borough Summary
Kulpmont Borough is a small borough located in Northumberland County, Pennsylvania. It is situated in the Coal Region of the state, and is part of the Greater Hazleton Area. The borough has a population of approximately 2,500 people, and is home to a variety of businesses, including a coal mine, a steel mill, and a variety of small businesses.
History
Kulpmont Borough was founded in 1891, and was named after the nearby Kulpmont Creek. The creek was named after the Native American word for “black bear”, which was the name of a local tribe. The borough was originally a coal mining town, and the coal industry was the primary source of employment for the residents. The coal industry began to decline in the early 20th century, and the borough began to diversify its economy.
In the 1950s, the borough was home to a steel mill, which provided employment for many of the residents. The steel mill closed in the late 1970s, and the borough has since become a bedroom community for the nearby cities of Hazleton and Wilkes-Barre.
Geography
Kulpmont Borough is located in Northumberland County, Pennsylvania. It is situated in the Coal Region of the state, and is part of the Greater Hazleton Area. The borough is located in the Susquehanna River Valley, and is surrounded by rolling hills and mountains. The borough is located approximately 20 miles from the cities of Hazleton and Wilkes-Barre.
The borough has a total area of 0.7 square miles, all of which is land. The borough is located at an elevation of 1,000 feet above sea level. The climate in the borough is classified as humid continental, with cold winters and hot, humid summers.
Economy
Kulpmont Borough’s economy is largely based on small businesses and services. The borough is home to a variety of small businesses, including restaurants, retail stores, and professional services. The borough is also home to a coal mine, which provides employment for some of the residents.
The borough is also home to a variety of manufacturing businesses, including a steel mill and a plastics factory. The steel mill closed in the late 1970s, but the plastics factory remains in operation. The borough is also home to a variety of transportation businesses, including trucking companies and a bus line.
Demographics
Kulpmont Borough has a population of approximately 2,500 people. The population is largely white, with a small percentage of African Americans and Hispanics. The median household income in the borough is $37,000, and the median home value is $90,000. The borough has a high rate of poverty, with approximately 25% of the population living below the poverty line.
The borough is served by the Northumberland County School District, which operates two elementary schools and one middle school in the borough. The borough is also home to a variety of churches, including Catholic, Protestant, and non-denominational churches.
Conclusion
Kulpmont Borough is a small borough located in Northumberland County, Pennsylvania. It is situated in the Coal Region of the state, and is part of the Greater Hazleton Area. The borough has a population of approximately 2,500 people, and is home to a variety of businesses, including a coal mine, a steel mill, and a variety of small businesses. The borough’s economy is largely based on small businesses and services, and the borough is served by the Northumberland County School District. Kulpmont Borough is a diverse community with a rich history and a bright future.
Common Questions
What is Per Capita Income in Kulpmont borough?
Per Capita income in Kulpmont borough is $40,487.
What is the Median Family Income in Kulpmont borough?
Median Family Income in Kulpmont borough is $73,056.
What is the Median Household income in Kulpmont borough?
Median Household Income in Kulpmont borough is $49,534.
What is Income or Wage Gap in Kulpmont borough?
Income or Wage Gap in Kulpmont borough is 45.5%.
Women in Kulpmont borough earn 54.5 cents for every dollar earned by a man.
What is Inequality or Gini Index in Kulpmont borough?
Inequality or Gini Index in Kulpmont borough is 0.48.
What is the Total Population of Kulpmont borough?
Total Population of Kulpmont borough is 2,758.
What is the Total Male Population of Kulpmont borough?
Total Male Population of Kulpmont borough is 1,540.
What is the Total Female Population of Kulpmont borough?
Total Female Population of Kulpmont borough is 1,218.
What is the Ratio of Males per 100 Females in Kulpmont borough?
There are 126.44 Males per 100 Females in Kulpmont borough.
What is the Ratio of Females per 100 Males in Kulpmont borough?
There are 79.09 Females per 100 Males in Kulpmont borough.
What is the Median Population Age in Kulpmont borough?
Median Population Age in Kulpmont borough is 49.6 Years.
What is the Average Family Size in Kulpmont borough
Average Family Size in Kulpmont borough is 2.7 People.
What is the Average Household Size in Kulpmont borough
Average Household Size in Kulpmont borough is 2.0 People.
How Large is the Labor Force in Kulpmont borough?
There are 1,408 People in the Labor Forcein in Kulpmont borough.
What is the Percentage of People in the Labor Force in Kulpmont borough?
56.5% of People are in the Labor Force in Kulpmont borough.
What is the Unemployment Rate in Kulpmont borough?
Unemployment Rate in Kulpmont borough is 4.6%.