Cities with the Highest Percentage of Immigrants from Asia in South Dakota
RELATED REPORTS & OPTIONS
Asia
South Dakota
Compare Cities
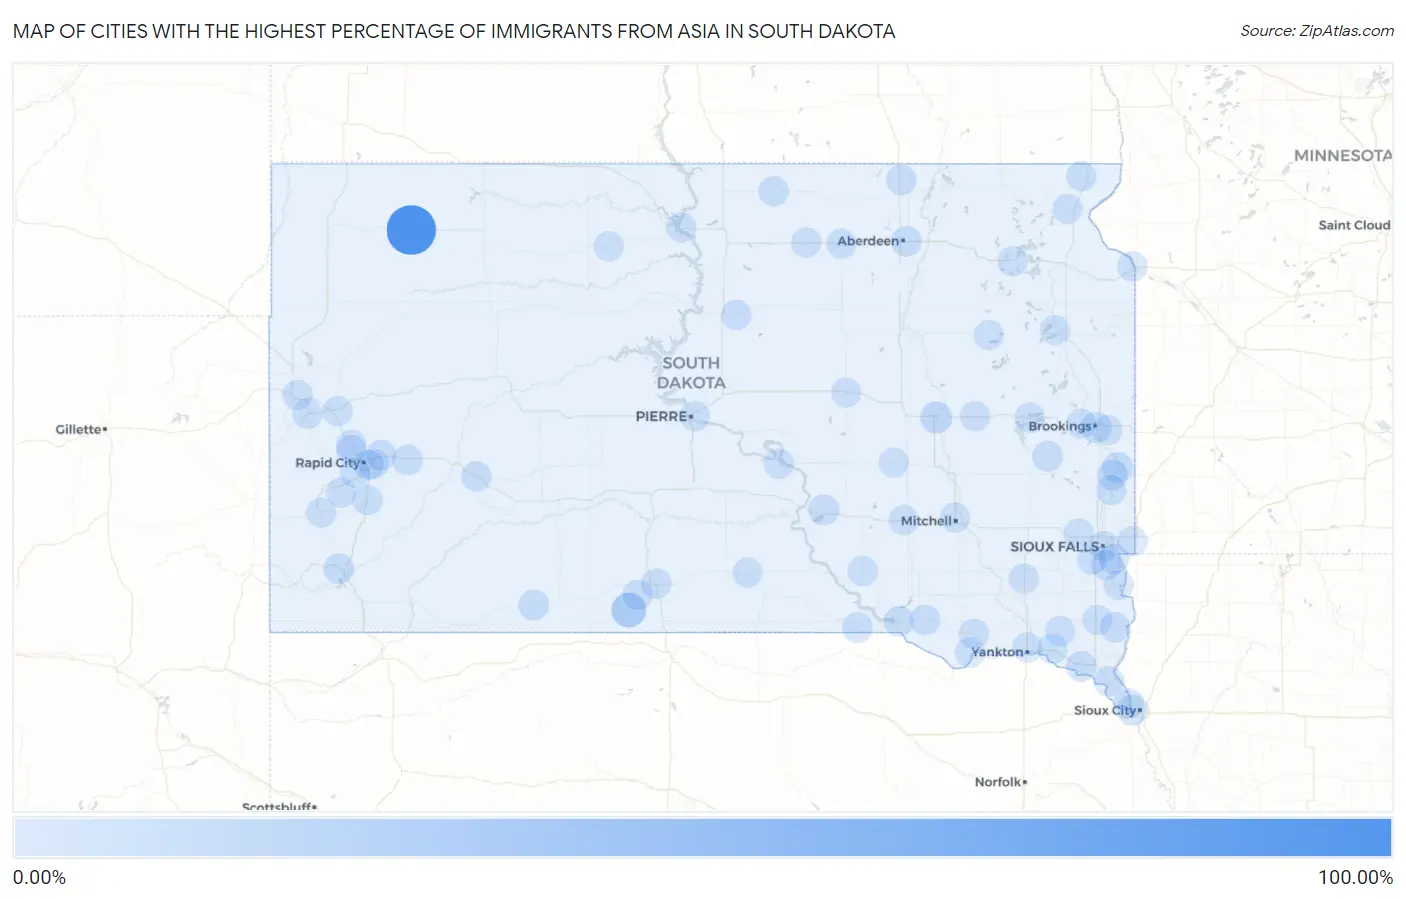
Map of Cities with the Highest Percentage of Immigrants from Asia in South Dakota
0.00%
100.00%
Cities with the Highest Percentage of Immigrants from Asia in South Dakota
| City | Asia | vs State | vs National | |
| 1. | Prairie City | 100.00% | 1.21%(+98.8)#1 | 4.26%(+95.7)#1 |
| 2. | St Francis | 23.00% | 1.21%(+21.8)#2 | 4.26%(+18.7)#214 |
| 3. | Huron | 8.17% | 1.21%(+6.97)#3 | 4.26%(+3.91)#1,232 |
| 4. | Mountain Plains | 7.07% | 1.21%(+5.86)#4 | 4.26%(+2.81)#1,479 |
| 5. | Flandreau | 4.41% | 1.21%(+3.20)#5 | 4.26%(+0.147)#2,530 |
| 6. | Brookings | 4.19% | 1.21%(+2.98)#6 | 4.26%(-0.074)#2,701 |
| 7. | Pukwana | 3.75% | 1.21%(+2.55)#7 | 4.26%(-0.506)#3,018 |
| 8. | Aberdeen | 3.41% | 1.21%(+2.20)#8 | 4.26%(-0.850)#3,314 |
| 9. | Dakota Dunes | 3.38% | 1.21%(+2.17)#9 | 4.26%(-0.883)#3,347 |
| 10. | Martin | 3.31% | 1.21%(+2.10)#10 | 4.26%(-0.954)#3,430 |
| 11. | Egan | 3.02% | 1.21%(+1.81)#11 | 4.26%(-1.24)#3,723 |
| 12. | Ramona | 2.82% | 1.21%(+1.61)#12 | 4.26%(-1.44)#3,959 |
| 13. | Vermillion | 2.68% | 1.21%(+1.47)#13 | 4.26%(-1.58)#4,127 |
| 14. | Hot Springs | 2.60% | 1.21%(+1.39)#14 | 4.26%(-1.66)#4,249 |
| 15. | Sioux Falls | 2.16% | 1.21%(+0.947)#15 | 4.26%(-2.11)#5,049 |
| 16. | New Underwood | 2.09% | 1.21%(+0.882)#16 | 4.26%(-2.17)#5,180 |
| 17. | Wall | 1.69% | 1.21%(+0.484)#17 | 4.26%(-2.57)#6,077 |
| 18. | Hermosa | 1.67% | 1.21%(+0.458)#18 | 4.26%(-2.59)#6,134 |
| 19. | Harrisburg | 1.63% | 1.21%(+0.426)#19 | 4.26%(-2.63)#6,221 |
| 20. | Shindler | 1.54% | 1.21%(+0.330)#20 | 4.26%(-2.72)#6,487 |
| 21. | Box Elder | 1.54% | 1.21%(+0.329)#21 | 4.26%(-2.72)#6,492 |
| 22. | Rosebud | 1.53% | 1.21%(+0.323)#22 | 4.26%(-2.73)#6,501 |
| 23. | Summerset | 1.49% | 1.21%(+0.283)#23 | 4.26%(-2.77)#6,627 |
| 24. | Fairfax | 1.48% | 1.21%(+0.273)#24 | 4.26%(-2.78)#6,664 |
| 25. | Gettysburg | 1.46% | 1.21%(+0.250)#25 | 4.26%(-2.80)#6,724 |
| 26. | Frederick | 1.38% | 1.21%(+0.174)#26 | 4.26%(-2.88)#6,942 |
| 27. | Rapid Valley | 1.16% | 1.21%(-0.048)#27 | 4.26%(-3.10)#7,747 |
| 28. | Pickstown | 1.09% | 1.21%(-0.114)#28 | 4.26%(-3.17)#8,010 |
| 29. | Rapid City | 1.08% | 1.21%(-0.131)#29 | 4.26%(-3.18)#8,084 |
| 30. | Wagner | 1.05% | 1.21%(-0.160)#30 | 4.26%(-3.21)#8,192 |
| 31. | Alcester | 1.03% | 1.21%(-0.181)#31 | 4.26%(-3.23)#8,288 |
| 32. | Blackhawk | 1.02% | 1.21%(-0.185)#32 | 4.26%(-3.24)#8,300 |
| 33. | New Effington | 0.96% | 1.21%(-0.252)#33 | 4.26%(-3.30)#8,588 |
| 34. | Trent | 0.90% | 1.21%(-0.305)#34 | 4.26%(-3.36)#8,833 |
| 35. | Eureka | 0.88% | 1.21%(-0.329)#35 | 4.26%(-3.38)#8,936 |
| 36. | Mission | 0.88% | 1.21%(-0.333)#36 | 4.26%(-3.38)#8,951 |
| 37. | Deadwood | 0.84% | 1.21%(-0.365)#37 | 4.26%(-3.42)#9,109 |
| 38. | Lower Brule | 0.78% | 1.21%(-0.424)#38 | 4.26%(-3.48)#9,386 |
| 39. | Custer | 0.73% | 1.21%(-0.474)#39 | 4.26%(-3.53)#9,652 |
| 40. | Lake Preston | 0.73% | 1.21%(-0.479)#40 | 4.26%(-3.53)#9,669 |
| 41. | Freeman | 0.70% | 1.21%(-0.512)#41 | 4.26%(-3.56)#9,841 |
| 42. | Colonial Pine Hills | 0.64% | 1.21%(-0.569)#42 | 4.26%(-3.62)#10,188 |
| 43. | Sturgis | 0.62% | 1.21%(-0.591)#43 | 4.26%(-3.64)#10,302 |
| 44. | Aurora | 0.56% | 1.21%(-0.649)#44 | 4.26%(-3.70)#10,653 |
| 45. | Mitchell | 0.54% | 1.21%(-0.666)#45 | 4.26%(-3.72)#10,763 |
| 46. | Miller | 0.54% | 1.21%(-0.667)#46 | 4.26%(-3.72)#10,775 |
| 47. | Pierre | 0.53% | 1.21%(-0.677)#47 | 4.26%(-3.73)#10,836 |
| 48. | Keystone | 0.52% | 1.21%(-0.689)#48 | 4.26%(-3.74)#10,912 |
| 49. | Clark | 0.50% | 1.21%(-0.711)#49 | 4.26%(-3.76)#11,074 |
| 50. | Springfield | 0.50% | 1.21%(-0.712)#50 | 4.26%(-3.76)#11,082 |
| 51. | Beresford | 0.50% | 1.21%(-0.712)#51 | 4.26%(-3.76)#11,085 |
| 52. | Plankinton | 0.50% | 1.21%(-0.713)#52 | 4.26%(-3.77)#11,094 |
| 53. | Timber Lake | 0.48% | 1.21%(-0.730)#53 | 4.26%(-3.78)#11,208 |
| 54. | Gayville | 0.48% | 1.21%(-0.732)#54 | 4.26%(-3.78)#11,220 |
| 55. | Iroquois | 0.47% | 1.21%(-0.736)#55 | 4.26%(-3.79)#11,247 |
| 56. | Spearfish | 0.46% | 1.21%(-0.744)#56 | 4.26%(-3.80)#11,292 |
| 57. | Big Stone City | 0.39% | 1.21%(-0.818)#57 | 4.26%(-3.87)#11,791 |
| 58. | Platte | 0.38% | 1.21%(-0.824)#58 | 4.26%(-3.88)#11,834 |
| 59. | Winner | 0.31% | 1.21%(-0.899)#59 | 4.26%(-3.95)#12,351 |
| 60. | Tea | 0.30% | 1.21%(-0.905)#60 | 4.26%(-3.96)#12,400 |
| 61. | Roscoe | 0.30% | 1.21%(-0.905)#61 | 4.26%(-3.96)#12,403 |
| 62. | Wessington Springs | 0.30% | 1.21%(-0.905)#62 | 4.26%(-3.96)#12,406 |
| 63. | Tyndall | 0.29% | 1.21%(-0.922)#63 | 4.26%(-3.97)#12,517 |
| 64. | Wakonda | 0.26% | 1.21%(-0.950)#64 | 4.26%(-4.00)#12,729 |
| 65. | Ipswich | 0.26% | 1.21%(-0.952)#65 | 4.26%(-4.00)#12,737 |
| 66. | Volga | 0.24% | 1.21%(-0.964)#66 | 4.26%(-4.02)#12,826 |
| 67. | North Sioux City | 0.23% | 1.21%(-0.974)#67 | 4.26%(-4.03)#12,900 |
| 68. | Canton | 0.23% | 1.21%(-0.980)#68 | 4.26%(-4.03)#12,949 |
| 69. | Mobridge | 0.22% | 1.21%(-0.985)#69 | 4.26%(-4.04)#12,978 |
| 70. | Hartford | 0.21% | 1.21%(-0.999)#70 | 4.26%(-4.05)#13,083 |
| 71. | Valley Springs | 0.21% | 1.21%(-1.00)#71 | 4.26%(-4.05)#13,095 |
| 72. | Watertown | 0.21% | 1.21%(-1.00)#72 | 4.26%(-4.05)#13,103 |
| 73. | Sisseton | 0.20% | 1.21%(-1.01)#73 | 4.26%(-4.07)#13,185 |
| 74. | Yankton | 0.19% | 1.21%(-1.02)#74 | 4.26%(-4.07)#13,235 |
| 75. | Elk Point | 0.18% | 1.21%(-1.02)#75 | 4.26%(-4.08)#13,274 |
| 76. | Webster | 0.055% | 1.21%(-1.15)#76 | 4.26%(-4.20)#13,995 |
1
2Common Questions
What are the Top 10 Cities with the Highest Percentage of Immigrants from Asia in South Dakota?
Top 10 Cities with the Highest Percentage of Immigrants from Asia in South Dakota are:
#1
100.00%
#2
23.00%
#3
8.17%
#4
4.41%
#5
4.19%
#6
3.75%
#7
3.41%
#8
3.38%
#9
3.31%
#10
3.02%
What city has the Highest Percentage of Immigrants from Asia in South Dakota?
Prairie City has the Highest Percentage of Immigrants from Asia in South Dakota with 100.00%.
What is the Percentage of Immigrants from Asia in the State of South Dakota?
Percentage of Immigrants from Asia in South Dakota is 1.21%.
What is the Percentage of Immigrants from Asia in the United States?
Percentage of Immigrants from Asia in the United States is 4.26%.