Cities with the Highest Percentage of Immigrants from Asia in Kentucky
RELATED REPORTS & OPTIONS
Asia
Kentucky
Compare Cities
Map of Cities with the Highest Percentage of Immigrants from Asia in Kentucky
0.00%
50.00%
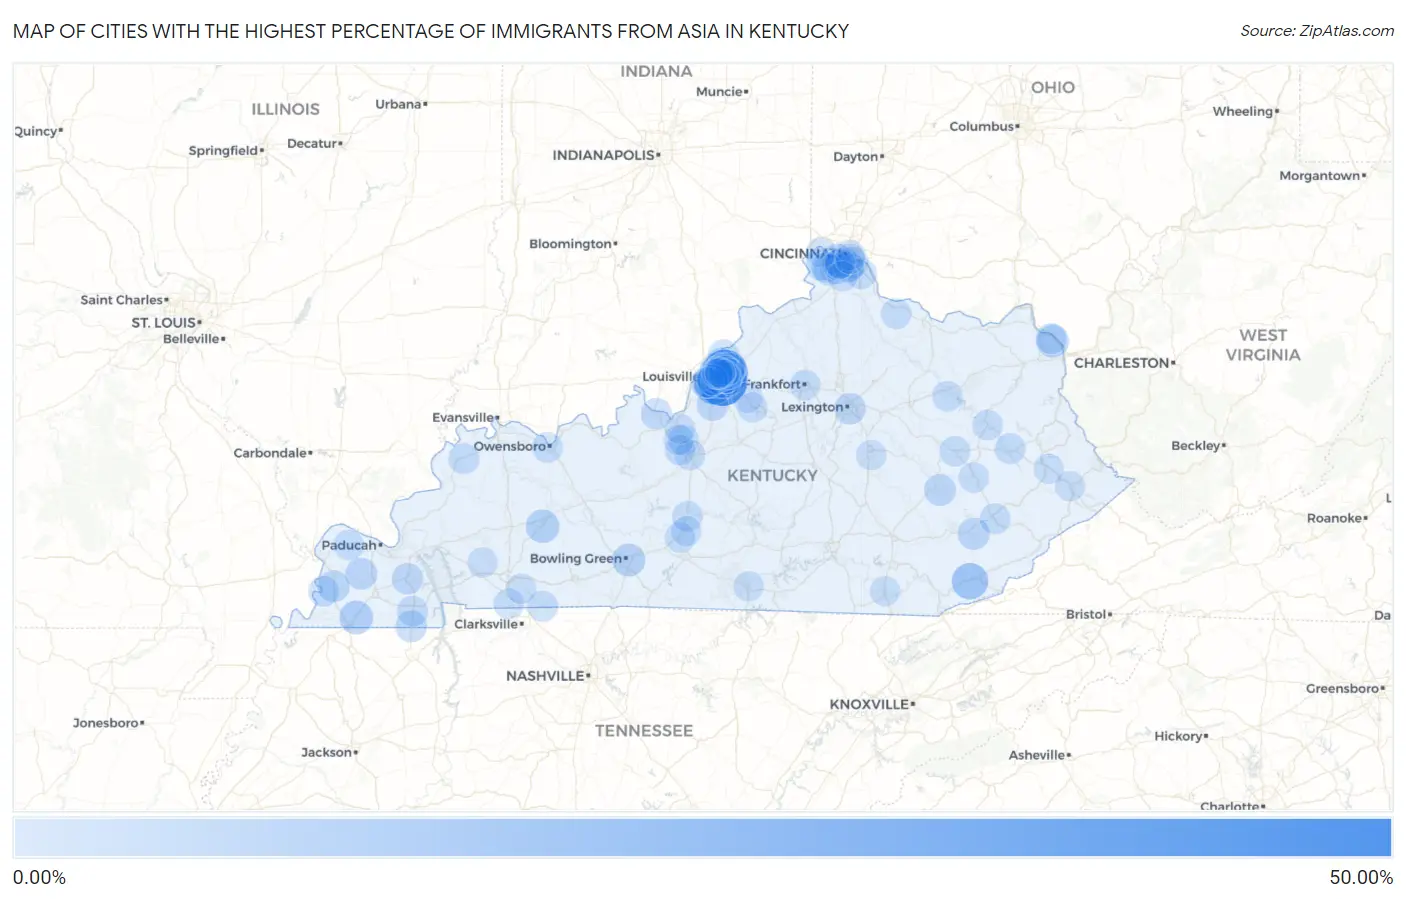
Cities with the Highest Percentage of Immigrants from Asia in Kentucky
| City | Asia | vs State | vs National | |
| 1. | Hurstbourne Acres | 40.57% | 1.37%(+39.2)#1 | 4.26%(+36.3)#39 |
| 2. | Meadow Vale | 32.32% | 1.37%(+31.0)#2 | 4.26%(+28.1)#88 |
| 3. | West Buechel | 18.60% | 1.37%(+17.2)#3 | 4.26%(+14.3)#332 |
| 4. | Hurstbourne | 16.89% | 1.37%(+15.5)#4 | 4.26%(+12.6)#400 |
| 5. | Wallins Creek | 13.52% | 1.37%(+12.1)#5 | 4.26%(+9.26)#569 |
| 6. | Beechwood Village | 11.14% | 1.37%(+9.77)#6 | 4.26%(+6.88)#766 |
| 7. | Meadowview Estates | 8.05% | 1.37%(+6.68)#7 | 4.26%(+3.79)#1,251 |
| 8. | Water Valley | 7.95% | 1.37%(+6.58)#8 | 4.26%(+3.69)#1,273 |
| 9. | Greenville | 7.53% | 1.37%(+6.16)#9 | 4.26%(+3.27)#1,366 |
| 10. | St. Joseph | 7.00% | 1.37%(+5.63)#10 | 4.26%(+2.74)#1,503 |
| 11. | Bowling Green | 6.57% | 1.37%(+5.20)#11 | 4.26%(+2.31)#1,633 |
| 12. | Plantation | 6.29% | 1.37%(+4.92)#12 | 4.26%(+2.03)#1,706 |
| 13. | Middletown | 6.21% | 1.37%(+4.84)#13 | 4.26%(+1.95)#1,730 |
| 14. | Hickory Hill | 5.88% | 1.37%(+4.51)#14 | 4.26%(+1.62)#1,836 |
| 15. | Bellefonte | 5.84% | 1.37%(+4.47)#15 | 4.26%(+1.58)#1,857 |
| 16. | Crescent Springs | 5.82% | 1.37%(+4.45)#16 | 4.26%(+1.56)#1,866 |
| 17. | Langdon Place | 5.68% | 1.37%(+4.31)#17 | 4.26%(+1.42)#1,915 |
| 18. | Coldstream | 5.60% | 1.37%(+4.23)#18 | 4.26%(+1.34)#1,950 |
| 19. | Hyden | 4.75% | 1.37%(+3.38)#19 | 4.26%(+0.493)#2,331 |
| 20. | Lowes | 4.55% | 1.37%(+3.18)#20 | 4.26%(+0.285)#2,454 |
| 21. | Arlington | 4.51% | 1.37%(+3.14)#21 | 4.26%(+0.251)#2,479 |
| 22. | Booneville | 4.32% | 1.37%(+2.95)#22 | 4.26%(+0.056)#2,596 |
| 23. | Jeffersontown | 4.23% | 1.37%(+2.86)#23 | 4.26%(-0.031)#2,667 |
| 24. | Glenview | 4.18% | 1.37%(+2.81)#24 | 4.26%(-0.079)#2,709 |
| 25. | Ten Broeck | 4.11% | 1.37%(+2.74)#25 | 4.26%(-0.151)#2,752 |
| 26. | Worthington Hills | 4.06% | 1.37%(+2.69)#26 | 4.26%(-0.196)#2,784 |
| 27. | Hazel | 4.02% | 1.37%(+2.65)#27 | 4.26%(-0.242)#2,815 |
| 28. | Hillview | 3.94% | 1.37%(+2.57)#28 | 4.26%(-0.321)#2,863 |
| 29. | Fincastle | 3.91% | 1.37%(+2.54)#29 | 4.26%(-0.349)#2,882 |
| 30. | Indian Hills | 3.91% | 1.37%(+2.54)#30 | 4.26%(-0.352)#2,883 |
| 31. | Lexington | 3.81% | 1.37%(+2.44)#31 | 4.26%(-0.449)#2,968 |
| 32. | Wildwood | 3.78% | 1.37%(+2.41)#32 | 4.26%(-0.479)#2,993 |
| 33. | Prospect | 3.76% | 1.37%(+2.39)#33 | 4.26%(-0.497)#3,009 |
| 34. | Benton | 3.72% | 1.37%(+2.35)#34 | 4.26%(-0.536)#3,040 |
| 35. | Highland Heights | 3.32% | 1.37%(+1.95)#35 | 4.26%(-0.940)#3,412 |
| 36. | Brandenburg | 3.31% | 1.37%(+1.94)#36 | 4.26%(-0.945)#3,418 |
| 37. | Goshen | 2.89% | 1.37%(+1.52)#37 | 4.26%(-1.37)#3,861 |
| 38. | Old Brownsboro Place | 2.86% | 1.37%(+1.49)#38 | 4.26%(-1.40)#3,899 |
| 39. | St Matthews | 2.72% | 1.37%(+1.35)#39 | 4.26%(-1.54)#4,083 |
| 40. | Fairview | 2.70% | 1.37%(+1.33)#40 | 4.26%(-1.56)#4,096 |
| 41. | Florence | 2.70% | 1.37%(+1.33)#41 | 4.26%(-1.56)#4,102 |
| 42. | Alexandria | 2.69% | 1.37%(+1.32)#42 | 4.26%(-1.57)#4,116 |
| 43. | Blue Ridge Manor | 2.69% | 1.37%(+1.32)#43 | 4.26%(-1.57)#4,117 |
| 44. | Columbus | 2.66% | 1.37%(+1.29)#44 | 4.26%(-1.60)#4,153 |
| 45. | Murray | 2.62% | 1.37%(+1.25)#45 | 4.26%(-1.64)#4,206 |
| 46. | Lakeside Park | 2.61% | 1.37%(+1.24)#46 | 4.26%(-1.65)#4,220 |
| 47. | Hazard | 2.58% | 1.37%(+1.21)#47 | 4.26%(-1.68)#4,282 |
| 48. | Barbourmeade | 2.56% | 1.37%(+1.19)#48 | 4.26%(-1.70)#4,317 |
| 49. | Salyersville | 2.55% | 1.37%(+1.18)#49 | 4.26%(-1.71)#4,322 |
| 50. | Breckinridge Center | 2.54% | 1.37%(+1.17)#50 | 4.26%(-1.72)#4,343 |
| 51. | Radcliff | 2.54% | 1.37%(+1.17)#51 | 4.26%(-1.72)#4,348 |
| 52. | Northfield | 2.53% | 1.37%(+1.16)#52 | 4.26%(-1.73)#4,360 |
| 53. | Brownsboro Farm | 2.53% | 1.37%(+1.16)#53 | 4.26%(-1.73)#4,361 |
| 54. | Louisville | 2.53% | 1.37%(+1.16)#54 | 4.26%(-1.73)#4,364 |
| 55. | Russell | 2.51% | 1.37%(+1.14)#55 | 4.26%(-1.75)#4,401 |
| 56. | Guthrie | 2.40% | 1.37%(+1.03)#56 | 4.26%(-1.86)#4,596 |
| 57. | Elsmere | 2.39% | 1.37%(+1.02)#57 | 4.26%(-1.87)#4,621 |
| 58. | Munfordville | 2.35% | 1.37%(+0.978)#58 | 4.26%(-1.91)#4,688 |
| 59. | Owensboro | 2.34% | 1.37%(+0.969)#59 | 4.26%(-1.92)#4,704 |
| 60. | Burlington | 2.28% | 1.37%(+0.913)#60 | 4.26%(-1.98)#4,806 |
| 61. | West Liberty | 2.22% | 1.37%(+0.847)#61 | 4.26%(-2.04)#4,925 |
| 62. | Creekside | 2.20% | 1.37%(+0.828)#62 | 4.26%(-2.06)#4,965 |
| 63. | Frankfort | 2.18% | 1.37%(+0.812)#63 | 4.26%(-2.08)#4,998 |
| 64. | Anchorage | 2.15% | 1.37%(+0.779)#64 | 4.26%(-2.11)#5,059 |
| 65. | Salt Lick | 2.13% | 1.37%(+0.757)#65 | 4.26%(-2.13)#5,102 |
| 66. | Elizabethtown | 2.11% | 1.37%(+0.743)#66 | 4.26%(-2.15)#5,130 |
| 67. | Campton | 2.11% | 1.37%(+0.740)#67 | 4.26%(-2.15)#5,143 |
| 68. | Parkway Village | 2.09% | 1.37%(+0.720)#68 | 4.26%(-2.17)#5,182 |
| 69. | Kevil | 2.05% | 1.37%(+0.680)#69 | 4.26%(-2.21)#5,254 |
| 70. | Lyndon | 2.04% | 1.37%(+0.667)#70 | 4.26%(-2.22)#5,278 |
| 71. | West Van Lear | 1.92% | 1.37%(+0.547)#71 | 4.26%(-2.34)#5,547 |
| 72. | Fort Campbell North | 1.89% | 1.37%(+0.519)#72 | 4.26%(-2.37)#5,599 |
| 73. | Cave City | 1.85% | 1.37%(+0.477)#73 | 4.26%(-2.41)#5,688 |
| 74. | Francisville | 1.84% | 1.37%(+0.472)#74 | 4.26%(-2.42)#5,702 |
| 75. | Brooksville | 1.83% | 1.37%(+0.462)#75 | 4.26%(-2.43)#5,722 |
| 76. | Taylor Mill | 1.81% | 1.37%(+0.440)#76 | 4.26%(-2.45)#5,774 |
| 77. | Jackson | 1.79% | 1.37%(+0.423)#77 | 4.26%(-2.47)#5,818 |
| 78. | Rineyville | 1.76% | 1.37%(+0.393)#78 | 4.26%(-2.50)#5,886 |
| 79. | Seneca Gardens | 1.75% | 1.37%(+0.384)#79 | 4.26%(-2.51)#5,909 |
| 80. | Graymoor Devondale | 1.69% | 1.37%(+0.317)#80 | 4.26%(-2.57)#6,084 |
| 81. | Fort Knox | 1.69% | 1.37%(+0.317)#81 | 4.26%(-2.57)#6,086 |
| 82. | Woodlawn | 1.68% | 1.37%(+0.306)#82 | 4.26%(-2.58)#6,115 |
| 83. | Vine Grove | 1.65% | 1.37%(+0.279)#83 | 4.26%(-2.61)#6,175 |
| 84. | Oakbrook | 1.62% | 1.37%(+0.253)#84 | 4.26%(-2.64)#6,254 |
| 85. | Erlanger | 1.60% | 1.37%(+0.229)#85 | 4.26%(-2.66)#6,314 |
| 86. | Windy Hills | 1.60% | 1.37%(+0.226)#86 | 4.26%(-2.66)#6,321 |
| 87. | Independence | 1.59% | 1.37%(+0.224)#87 | 4.26%(-2.67)#6,326 |
| 88. | Williamsburg | 1.59% | 1.37%(+0.217)#88 | 4.26%(-2.67)#6,343 |
| 89. | Elk Creek | 1.57% | 1.37%(+0.198)#89 | 4.26%(-2.69)#6,380 |
| 90. | Horse Cave | 1.49% | 1.37%(+0.117)#90 | 4.26%(-2.77)#6,641 |
| 91. | Taylorsville | 1.46% | 1.37%(+0.085)#91 | 4.26%(-2.81)#6,728 |
| 92. | Pembroke | 1.44% | 1.37%(+0.074)#92 | 4.26%(-2.82)#6,755 |
| 93. | Crestview Hills | 1.43% | 1.37%(+0.062)#93 | 4.26%(-2.83)#6,796 |
| 94. | Cerulean | 1.43% | 1.37%(+0.062)#94 | 4.26%(-2.83)#6,798 |
| 95. | Richmond | 1.41% | 1.37%(+0.043)#95 | 4.26%(-2.85)#6,853 |
| 96. | Allen | 1.41% | 1.37%(+0.038)#96 | 4.26%(-2.85)#6,867 |
| 97. | Burkesville | 1.41% | 1.37%(+0.035)#97 | 4.26%(-2.85)#6,882 |
| 98. | Bancroft | 1.40% | 1.37%(+0.033)#98 | 4.26%(-2.86)#6,892 |
| 99. | Pikeville | 1.34% | 1.37%(-0.035)#99 | 4.26%(-2.92)#7,104 |
| 100. | Southgate | 1.31% | 1.37%(-0.065)#100 | 4.26%(-2.95)#7,206 |
Common Questions
What are the Top 10 Cities with the Highest Percentage of Immigrants from Asia in Kentucky?
Top 10 Cities with the Highest Percentage of Immigrants from Asia in Kentucky are:
#1
40.57%
#2
32.32%
#3
18.60%
#4
16.89%
#5
13.52%
#6
11.14%
#7
8.05%
#8
7.95%
#9
7.53%
#10
6.57%
What city has the Highest Percentage of Immigrants from Asia in Kentucky?
Hurstbourne Acres has the Highest Percentage of Immigrants from Asia in Kentucky with 40.57%.
What is the Percentage of Immigrants from Asia in the State of Kentucky?
Percentage of Immigrants from Asia in Kentucky is 1.37%.
What is the Percentage of Immigrants from Asia in the United States?
Percentage of Immigrants from Asia in the United States is 4.26%.