Cities with the Highest Percentage of Immigrants from Asia in Idaho
RELATED REPORTS & OPTIONS
Asia
Idaho
Compare Cities
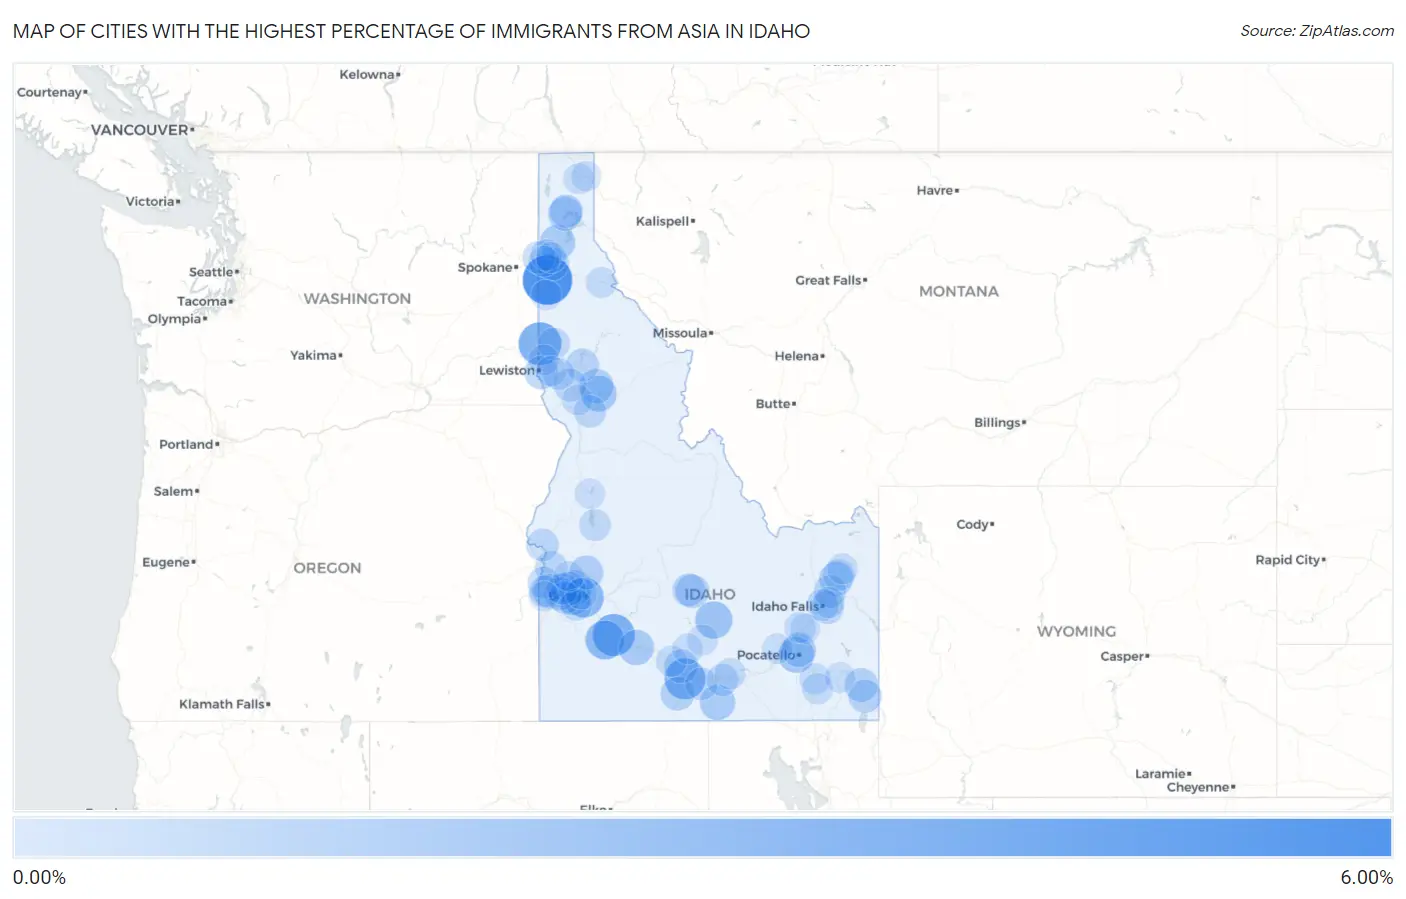
Map of Cities with the Highest Percentage of Immigrants from Asia in Idaho
0.00%
6.00%
Cities with the Highest Percentage of Immigrants from Asia in Idaho
| City | Asia | vs State | vs National | |
| 1. | Rockford Bay | 5.88% | 1.09%(+4.80)#1 | 4.26%(+1.62)#1,835 |
| 2. | Moscow | 3.81% | 1.09%(+2.72)#2 | 4.26%(-0.454)#2,972 |
| 3. | Mountain Home | 3.56% | 1.09%(+2.48)#3 | 4.26%(-0.697)#3,179 |
| 4. | Twin Falls | 3.20% | 1.09%(+2.11)#4 | 4.26%(-1.06)#3,523 |
| 5. | Boise City | 2.94% | 1.09%(+1.85)#5 | 4.26%(-1.33)#3,814 |
| 6. | Mountain Home Afb | 2.64% | 1.09%(+1.55)#6 | 4.26%(-1.62)#4,190 |
| 7. | Carey | 2.09% | 1.09%(+1.00)#7 | 4.26%(-2.17)#5,181 |
| 8. | Kooskia | 1.64% | 1.09%(+0.557)#8 | 4.26%(-2.62)#6,186 |
| 9. | Pocatello | 1.63% | 1.09%(+0.539)#9 | 4.26%(-2.63)#6,247 |
| 10. | Athol | 1.52% | 1.09%(+0.432)#10 | 4.26%(-2.74)#6,541 |
| 11. | Oakley | 1.51% | 1.09%(+0.422)#11 | 4.26%(-2.75)#6,568 |
| 12. | Glenns Ferry | 1.51% | 1.09%(+0.420)#12 | 4.26%(-2.75)#6,579 |
| 13. | Meridian | 1.36% | 1.09%(+0.276)#13 | 4.26%(-2.90)#6,999 |
| 14. | Eagle | 1.33% | 1.09%(+0.241)#14 | 4.26%(-2.93)#7,125 |
| 15. | Kamiah | 1.32% | 1.09%(+0.235)#15 | 4.26%(-2.94)#7,148 |
| 16. | Chubbuck | 1.23% | 1.09%(+0.147)#16 | 4.26%(-3.03)#7,458 |
| 17. | Greenleaf | 1.21% | 1.09%(+0.119)#17 | 4.26%(-3.05)#7,567 |
| 18. | Rexburg | 1.19% | 1.09%(+0.101)#18 | 4.26%(-3.07)#7,645 |
| 19. | Hammett | 1.19% | 1.09%(+0.099)#19 | 4.26%(-3.07)#7,654 |
| 20. | Sandpoint | 1.13% | 1.09%(+0.048)#20 | 4.26%(-3.13)#7,859 |
| 21. | Horseshoe Bend | 1.13% | 1.09%(+0.046)#21 | 4.26%(-3.13)#7,864 |
| 22. | Star | 1.08% | 1.09%(-0.010)#22 | 4.26%(-3.18)#8,083 |
| 23. | Hollister | 1.06% | 1.09%(-0.023)#23 | 4.26%(-3.20)#8,125 |
| 24. | Georgetown | 1.06% | 1.09%(-0.030)#24 | 4.26%(-3.20)#8,155 |
| 25. | Jerome | 1.05% | 1.09%(-0.038)#25 | 4.26%(-3.21)#8,188 |
| 26. | Sun Valley | 1.01% | 1.09%(-0.075)#26 | 4.26%(-3.25)#8,343 |
| 27. | Lewiston | 0.97% | 1.09%(-0.118)#27 | 4.26%(-3.29)#8,527 |
| 28. | Ponderay | 0.91% | 1.09%(-0.177)#28 | 4.26%(-3.35)#8,798 |
| 29. | Montpelier | 0.91% | 1.09%(-0.181)#29 | 4.26%(-3.35)#8,823 |
| 30. | Coeur D Alene | 0.82% | 1.09%(-0.267)#30 | 4.26%(-3.44)#9,217 |
| 31. | Ammon | 0.80% | 1.09%(-0.284)#31 | 4.26%(-3.46)#9,290 |
| 32. | Ketchum | 0.80% | 1.09%(-0.285)#32 | 4.26%(-3.46)#9,296 |
| 33. | Orofino | 0.80% | 1.09%(-0.288)#33 | 4.26%(-3.46)#9,312 |
| 34. | Craigmont | 0.80% | 1.09%(-0.289)#34 | 4.26%(-3.46)#9,315 |
| 35. | Caldwell | 0.77% | 1.09%(-0.316)#35 | 4.26%(-3.49)#9,458 |
| 36. | New Plymouth | 0.73% | 1.09%(-0.358)#36 | 4.26%(-3.53)#9,676 |
| 37. | Rigby | 0.73% | 1.09%(-0.361)#37 | 4.26%(-3.53)#9,693 |
| 38. | Weiser | 0.70% | 1.09%(-0.383)#38 | 4.26%(-3.56)#9,802 |
| 39. | Nampa | 0.70% | 1.09%(-0.385)#39 | 4.26%(-3.56)#9,813 |
| 40. | Grangeville | 0.68% | 1.09%(-0.405)#40 | 4.26%(-3.58)#9,927 |
| 41. | Murtaugh | 0.65% | 1.09%(-0.438)#41 | 4.26%(-3.61)#10,132 |
| 42. | Hauser | 0.64% | 1.09%(-0.446)#42 | 4.26%(-3.62)#10,180 |
| 43. | Parma | 0.62% | 1.09%(-0.468)#43 | 4.26%(-3.64)#10,292 |
| 44. | Idaho Falls | 0.57% | 1.09%(-0.513)#44 | 4.26%(-3.69)#10,558 |
| 45. | Burley | 0.56% | 1.09%(-0.522)#45 | 4.26%(-3.70)#10,616 |
| 46. | Wilder | 0.54% | 1.09%(-0.549)#46 | 4.26%(-3.72)#10,797 |
| 47. | Troy | 0.53% | 1.09%(-0.558)#47 | 4.26%(-3.73)#10,850 |
| 48. | Culdesac | 0.51% | 1.09%(-0.577)#48 | 4.26%(-3.75)#10,983 |
| 49. | Cascade | 0.50% | 1.09%(-0.586)#49 | 4.26%(-3.76)#11,050 |
| 50. | Middleton | 0.47% | 1.09%(-0.619)#50 | 4.26%(-3.79)#11,276 |
| 51. | Sugar City | 0.44% | 1.09%(-0.649)#51 | 4.26%(-3.82)#11,473 |
| 52. | Kuna | 0.43% | 1.09%(-0.657)#52 | 4.26%(-3.83)#11,531 |
| 53. | Rathdrum | 0.37% | 1.09%(-0.721)#53 | 4.26%(-3.89)#11,951 |
| 54. | Rupert | 0.33% | 1.09%(-0.758)#54 | 4.26%(-3.93)#12,196 |
| 55. | Wendell | 0.31% | 1.09%(-0.777)#55 | 4.26%(-3.95)#12,349 |
| 56. | Arimo | 0.31% | 1.09%(-0.781)#56 | 4.26%(-3.95)#12,379 |
| 57. | Garden City | 0.30% | 1.09%(-0.786)#57 | 4.26%(-3.96)#12,420 |
| 58. | Moreland | 0.30% | 1.09%(-0.789)#58 | 4.26%(-3.96)#12,440 |
| 59. | Iona | 0.29% | 1.09%(-0.796)#59 | 4.26%(-3.97)#12,491 |
| 60. | Wallace | 0.28% | 1.09%(-0.810)#60 | 4.26%(-3.98)#12,591 |
| 61. | Downey | 0.25% | 1.09%(-0.839)#61 | 4.26%(-4.01)#12,798 |
| 62. | Post Falls | 0.20% | 1.09%(-0.885)#62 | 4.26%(-4.06)#13,141 |
| 63. | Richfield | 0.20% | 1.09%(-0.891)#63 | 4.26%(-4.06)#13,173 |
| 64. | Bonners Ferry | 0.20% | 1.09%(-0.892)#64 | 4.26%(-4.06)#13,178 |
| 65. | St Anthony | 0.19% | 1.09%(-0.900)#65 | 4.26%(-4.07)#13,240 |
| 66. | Shoshone | 0.18% | 1.09%(-0.909)#66 | 4.26%(-4.08)#13,314 |
| 67. | Genesee | 0.17% | 1.09%(-0.922)#67 | 4.26%(-4.09)#13,381 |
| 68. | Cottonwood | 0.16% | 1.09%(-0.926)#68 | 4.26%(-4.10)#13,413 |
| 69. | Hayden | 0.16% | 1.09%(-0.928)#69 | 4.26%(-4.10)#13,423 |
| 70. | Aberdeen | 0.15% | 1.09%(-0.934)#70 | 4.26%(-4.11)#13,463 |
| 71. | Lapwai | 0.15% | 1.09%(-0.935)#71 | 4.26%(-4.11)#13,470 |
| 72. | Grace | 0.14% | 1.09%(-0.946)#72 | 4.26%(-4.12)#13,537 |
| 73. | Plummer | 0.086% | 1.09%(-1.00)#73 | 4.26%(-4.17)#13,861 |
| 74. | Mccall | 0.080% | 1.09%(-1.01)#74 | 4.26%(-4.18)#13,892 |
| 75. | Moyie Springs | 0.077% | 1.09%(-1.01)#75 | 4.26%(-4.18)#13,909 |
| 76. | Blackfoot | 0.073% | 1.09%(-1.01)#76 | 4.26%(-4.19)#13,923 |
| 77. | Emmett | 0.065% | 1.09%(-1.02)#77 | 4.26%(-4.20)#13,964 |
| 78. | Homedale | 0.034% | 1.09%(-1.05)#78 | 4.26%(-4.23)#14,065 |
1
2Common Questions
What are the Top 10 Cities with the Highest Percentage of Immigrants from Asia in Idaho?
Top 10 Cities with the Highest Percentage of Immigrants from Asia in Idaho are:
#1
5.88%
#2
3.81%
#3
3.56%
#4
3.20%
#5
2.94%
#6
2.64%
#7
2.09%
#8
1.64%
#9
1.63%
#10
1.52%
What city has the Highest Percentage of Immigrants from Asia in Idaho?
Rockford Bay has the Highest Percentage of Immigrants from Asia in Idaho with 5.88%.
What is the Percentage of Immigrants from Asia in the State of Idaho?
Percentage of Immigrants from Asia in Idaho is 1.09%.
What is the Percentage of Immigrants from Asia in the United States?
Percentage of Immigrants from Asia in the United States is 4.26%.