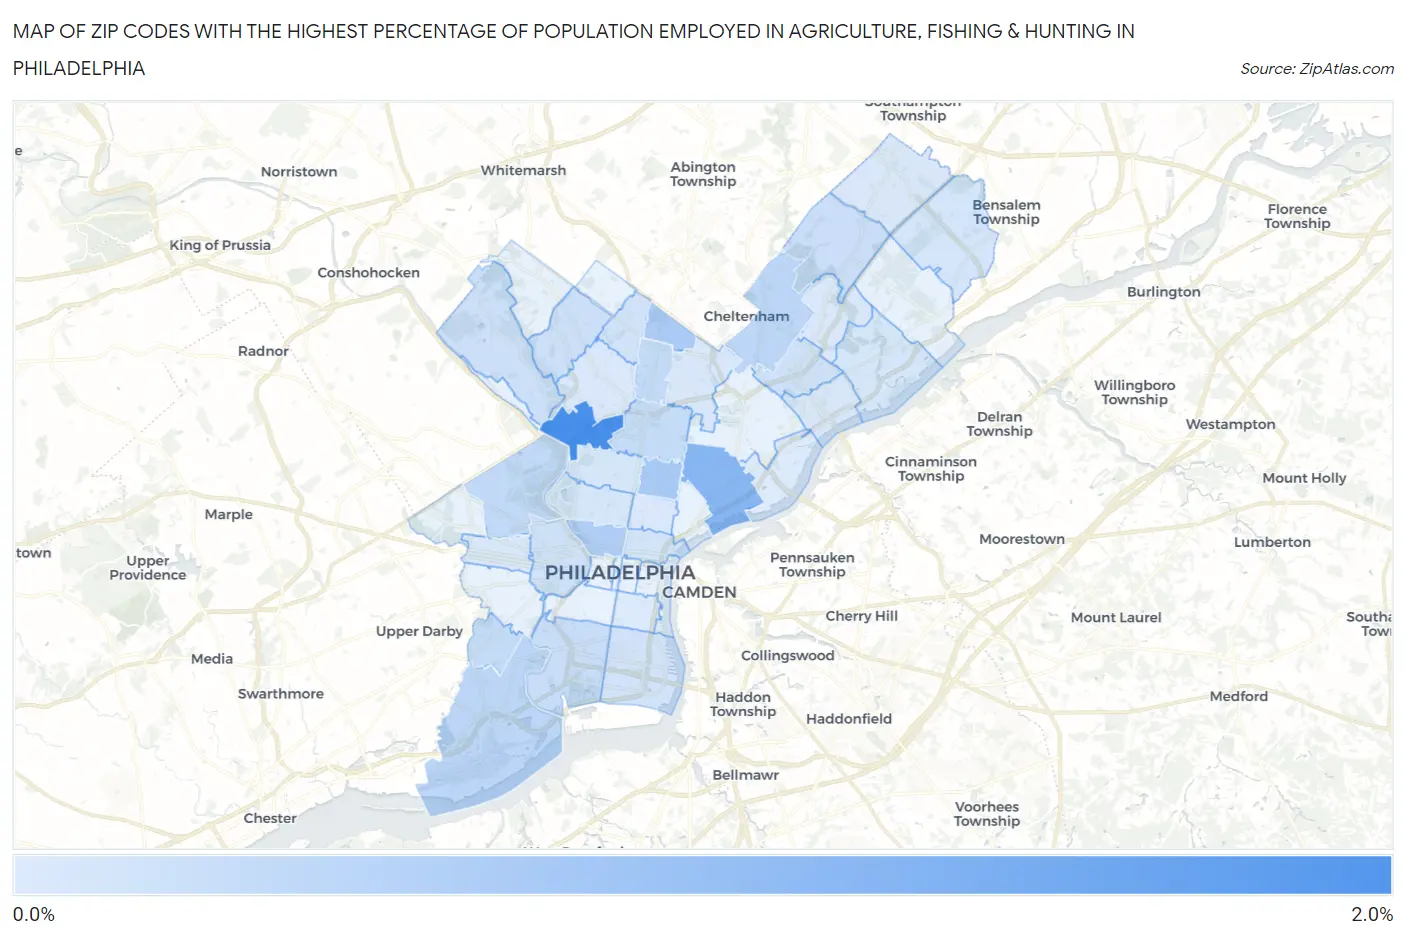
Zip Codes with the Highest Percentage of Population Employed in Agriculture, Fishing & Hunting in Philadelphia, PA
RELATED REPORTS & OPTIONS
Agriculture, Fishing & Hunting
Philadelphia
Compare Zip Codes
Map of Zip Codes with the Highest Percentage of Population Employed in Agriculture, Fishing & Hunting in Philadelphia
0.030%
1.7%

Zip Codes with the Highest Percentage of Population Employed in Agriculture, Fishing & Hunting in Philadelphia, PA
| Zip Code | % Employed | vs State | vs National | |
| 1. | 19129 | 1.7% | 0.87%(+0.874)#465 | 1.2%(+0.542)#13,531 |
| 2. | 19134 | 1.0% | 0.87%(+0.146)#608 | 1.2%(-0.186)#16,164 |
| 3. | 19133 | 0.63% | 0.87%(-0.242)#740 | 1.2%(-0.574)#18,306 |
| 4. | 19126 | 0.59% | 0.87%(-0.274)#752 | 1.2%(-0.606)#18,530 |
| 5. | 19130 | 0.56% | 0.87%(-0.302)#765 | 1.2%(-0.635)#18,740 |
| 6. | 19153 | 0.40% | 0.87%(-0.467)#851 | 1.2%(-0.799)#20,153 |
| 7. | 19111 | 0.39% | 0.87%(-0.480)#856 | 1.2%(-0.813)#20,275 |
| 8. | 19131 | 0.35% | 0.87%(-0.519)#877 | 1.2%(-0.852)#20,678 |
| 9. | 19141 | 0.32% | 0.87%(-0.546)#895 | 1.2%(-0.878)#20,938 |
| 10. | 19142 | 0.30% | 0.87%(-0.572)#909 | 1.2%(-0.904)#21,219 |
| 11. | 19140 | 0.28% | 0.87%(-0.586)#920 | 1.2%(-0.918)#21,401 |
| 12. | 19145 | 0.25% | 0.87%(-0.615)#937 | 1.2%(-0.947)#21,737 |
| 13. | 19115 | 0.23% | 0.87%(-0.641)#950 | 1.2%(-0.973)#22,037 |
| 14. | 19128 | 0.21% | 0.87%(-0.653)#960 | 1.2%(-0.985)#22,180 |
| 15. | 19119 | 0.20% | 0.87%(-0.662)#971 | 1.2%(-0.995)#22,306 |
| 16. | 19149 | 0.20% | 0.87%(-0.670)#980 | 1.2%(-1.00)#22,400 |
| 17. | 19104 | 0.17% | 0.87%(-0.694)#990 | 1.2%(-1.03)#22,673 |
| 18. | 19148 | 0.16% | 0.87%(-0.707)#997 | 1.2%(-1.04)#22,876 |
| 19. | 19138 | 0.15% | 0.87%(-0.720)#1,007 | 1.2%(-1.05)#23,055 |
| 20. | 19123 | 0.12% | 0.87%(-0.744)#1,019 | 1.2%(-1.08)#23,371 |
| 21. | 19154 | 0.12% | 0.87%(-0.745)#1,021 | 1.2%(-1.08)#23,376 |
| 22. | 19132 | 0.12% | 0.87%(-0.748)#1,023 | 1.2%(-1.08)#23,435 |
| 23. | 19121 | 0.12% | 0.87%(-0.750)#1,024 | 1.2%(-1.08)#23,453 |
| 24. | 19136 | 0.10% | 0.87%(-0.762)#1,029 | 1.2%(-1.09)#23,600 |
| 25. | 19135 | 0.086% | 0.87%(-0.781)#1,043 | 1.2%(-1.11)#23,883 |
| 26. | 19116 | 0.084% | 0.87%(-0.783)#1,044 | 1.2%(-1.11)#23,898 |
| 27. | 19139 | 0.074% | 0.87%(-0.793)#1,050 | 1.2%(-1.13)#24,040 |
| 28. | 19120 | 0.070% | 0.87%(-0.797)#1,056 | 1.2%(-1.13)#24,103 |
| 29. | 19152 | 0.063% | 0.87%(-0.804)#1,057 | 1.2%(-1.14)#24,192 |
| 30. | 19122 | 0.054% | 0.87%(-0.813)#1,065 | 1.2%(-1.14)#24,296 |
| 31. | 19144 | 0.054% | 0.87%(-0.813)#1,066 | 1.2%(-1.15)#24,297 |
| 32. | 19147 | 0.042% | 0.87%(-0.825)#1,072 | 1.2%(-1.16)#24,428 |
| 33. | 19137 | 0.030% | 0.87%(-0.838)#1,077 | 1.2%(-1.17)#24,534 |
1
Common Questions
What are the Top 10 Zip Codes with the Highest Percentage of Population Employed in Agriculture, Fishing & Hunting in Philadelphia, PA?
Top 10 Zip Codes with the Highest Percentage of Population Employed in Agriculture, Fishing & Hunting in Philadelphia, PA are:
What zip code has the Highest Percentage of Population Employed in Agriculture, Fishing & Hunting in Philadelphia, PA?
19129 has the Highest Percentage of Population Employed in Agriculture, Fishing & Hunting in Philadelphia, PA with 1.7%.
What is the Percentage of Population Employed in Agriculture, Fishing & Hunting in Philadelphia, PA?
Percentage of Population Employed in Agriculture, Fishing & Hunting in Philadelphia is 0.19%.
What is the Percentage of Population Employed in Agriculture, Fishing & Hunting in Pennsylvania?
Percentage of Population Employed in Agriculture, Fishing & Hunting in Pennsylvania is 0.87%.
What is the Percentage of Population Employed in Agriculture, Fishing & Hunting in the United States?
Percentage of Population Employed in Agriculture, Fishing & Hunting in the United States is 1.2%.