Frackville borough, PA Map & Demographics
Frackville borough Overview
$30,276
PER CAPITA INCOME
$80,959
AVG FAMILY INCOME
$65,139
AVG HOUSEHOLD INCOME
40.7%
WAGE / INCOME GAP [ % ]
59.3¢/ $1
WAGE / INCOME GAP [ $ ]
$8,025
FAMILY INCOME DEFICIT
0.44
INEQUALITY / GINI INDEX
3,861
TOTAL POPULATION
1,900
MALE POPULATION
1,961
FEMALE POPULATION
96.89
MALES / 100 FEMALES
103.21
FEMALES / 100 MALES
42.0
MEDIAN AGE
3.2
AVG FAMILY SIZE
2.7
AVG HOUSEHOLD SIZE
1,662
LABOR FORCE [ PEOPLE ]
54.8%
PERCENT IN LABOR FORCE
3.0%
UNEMPLOYMENT RATE
Income in Frackville borough
Income Overview in Frackville borough
Per Capita Income in Frackville borough is $30,276, while median incomes of families and households are $80,959 and $65,139 respectively.
| Characteristic | Number | Measure |
| Per Capita Income | 3,861 | $30,276 |
| Median Family Income | 932 | $80,959 |
| Mean Family Income | 932 | $84,493 |
| Median Household Income | 1,408 | $65,139 |
| Mean Household Income | 1,408 | $80,255 |
| Income Deficit | 932 | $8,025 |
| Wage / Income Gap (%) | 3,861 | 40.74% |
| Wage / Income Gap ($) | 3,861 | 59.26¢ per $1 |
| Gini / Inequality Index | 3,861 | 0.44 |
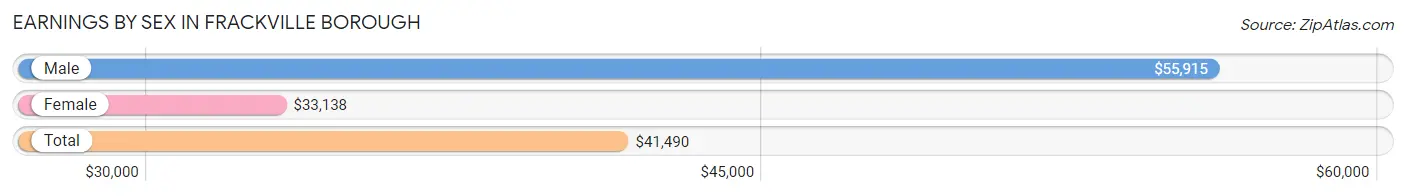
Earnings by Sex in Frackville borough
Average Earnings in Frackville borough are $41,490, $55,915 for men and $33,138 for women, a difference of 40.7%.
| Sex | Number | Average Earnings |
| Male | 999 (54.7%) | $55,915 |
| Female | 828 (45.3%) | $33,138 |
| Total | 1,827 (100.0%) | $41,490 |
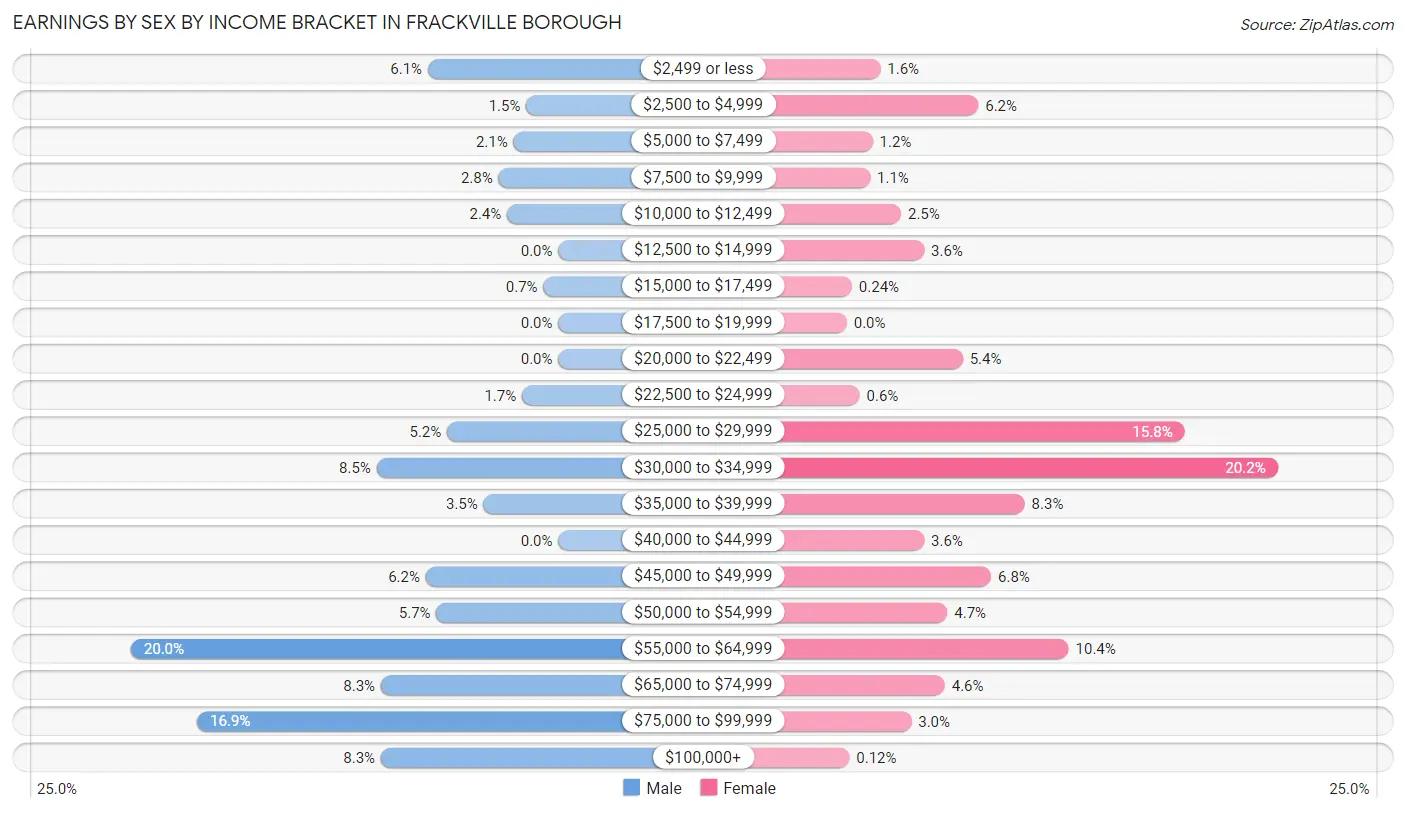
Earnings by Sex by Income Bracket in Frackville borough
The most common earnings brackets in Frackville borough are $55,000 to $64,999 for men (200 | 20.0%) and $30,000 to $34,999 for women (167 | 20.2%).
| Income | Male | Female |
| $2,499 or less | 61 (6.1%) | 13 (1.6%) |
| $2,500 to $4,999 | 15 (1.5%) | 51 (6.2%) |
| $5,000 to $7,499 | 21 (2.1%) | 10 (1.2%) |
| $7,500 to $9,999 | 28 (2.8%) | 9 (1.1%) |
| $10,000 to $12,499 | 24 (2.4%) | 21 (2.5%) |
| $12,500 to $14,999 | 0 (0.0%) | 30 (3.6%) |
| $15,000 to $17,499 | 7 (0.7%) | 2 (0.2%) |
| $17,500 to $19,999 | 0 (0.0%) | 0 (0.0%) |
| $20,000 to $22,499 | 0 (0.0%) | 45 (5.4%) |
| $22,500 to $24,999 | 17 (1.7%) | 5 (0.6%) |
| $25,000 to $29,999 | 52 (5.2%) | 131 (15.8%) |
| $30,000 to $34,999 | 85 (8.5%) | 167 (20.2%) |
| $35,000 to $39,999 | 35 (3.5%) | 69 (8.3%) |
| $40,000 to $44,999 | 0 (0.0%) | 30 (3.6%) |
| $45,000 to $49,999 | 62 (6.2%) | 56 (6.8%) |
| $50,000 to $54,999 | 57 (5.7%) | 39 (4.7%) |
| $55,000 to $64,999 | 200 (20.0%) | 86 (10.4%) |
| $65,000 to $74,999 | 83 (8.3%) | 38 (4.6%) |
| $75,000 to $99,999 | 169 (16.9%) | 25 (3.0%) |
| $100,000+ | 83 (8.3%) | 1 (0.1%) |
| Total | 999 (100.0%) | 828 (100.0%) |
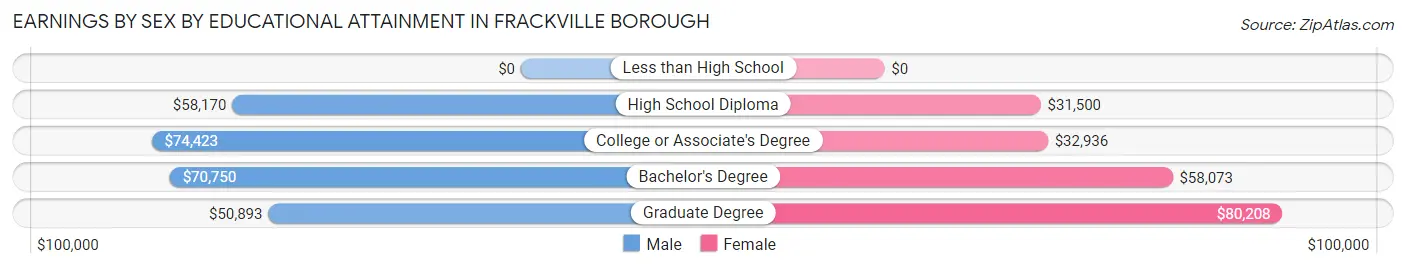
Earnings by Sex by Educational Attainment in Frackville borough
Average earnings in Frackville borough are $57,545 for men and $33,790 for women, a difference of 41.3%. Men with an educational attainment of college or associate's degree enjoy the highest average annual earnings of $74,423, while those with graduate degree education earn the least with $50,893. Women with an educational attainment of graduate degree earn the most with the average annual earnings of $80,208, while those with high school diploma education have the smallest earnings of $31,500.
| Educational Attainment | Male Income | Female Income |
| Less than High School | - | - |
| High School Diploma | $58,170 | $31,500 |
| College or Associate's Degree | $74,423 | $32,936 |
| Bachelor's Degree | $70,750 | $58,073 |
| Graduate Degree | $50,893 | $80,208 |
| Total | $57,545 | $33,790 |
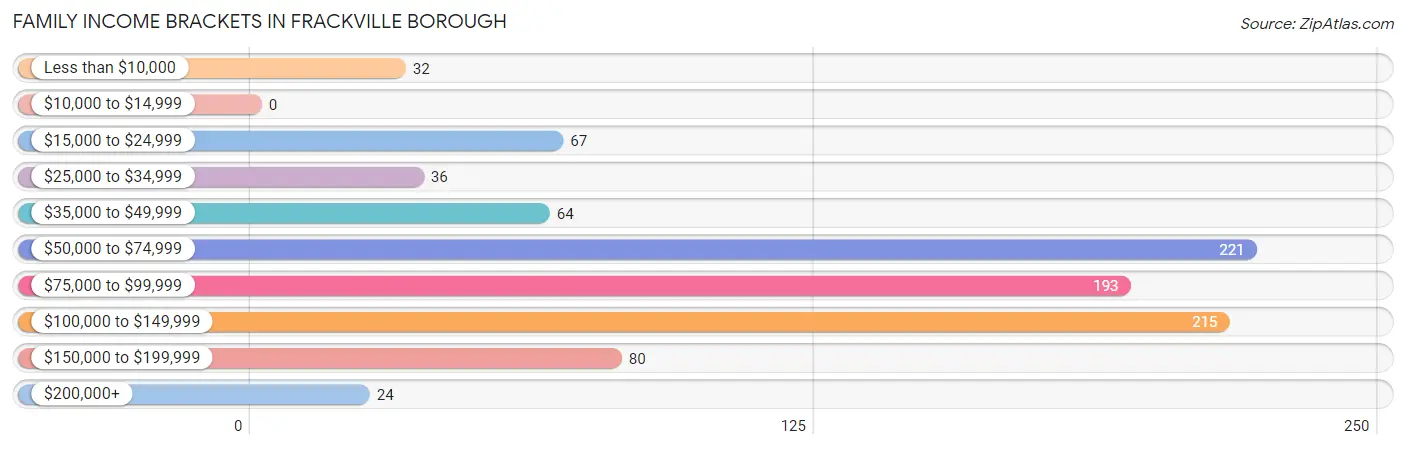
Family Income in Frackville borough
Family Income Brackets in Frackville borough
According to the Frackville borough family income data, there are 221 families falling into the $50,000 to $74,999 income range, which is the most common income bracket and makes up 23.7% of all families.
| Income Bracket | # Families | % Families |
| Less than $10,000 | 32 | 3.4% |
| $10,000 to $14,999 | 0 | 0.0% |
| $15,000 to $24,999 | 67 | 7.2% |
| $25,000 to $34,999 | 36 | 3.9% |
| $35,000 to $49,999 | 64 | 6.9% |
| $50,000 to $74,999 | 221 | 23.7% |
| $75,000 to $99,999 | 193 | 20.7% |
| $100,000 to $149,999 | 215 | 23.1% |
| $150,000 to $199,999 | 80 | 8.6% |
| $200,000+ | 24 | 2.6% |
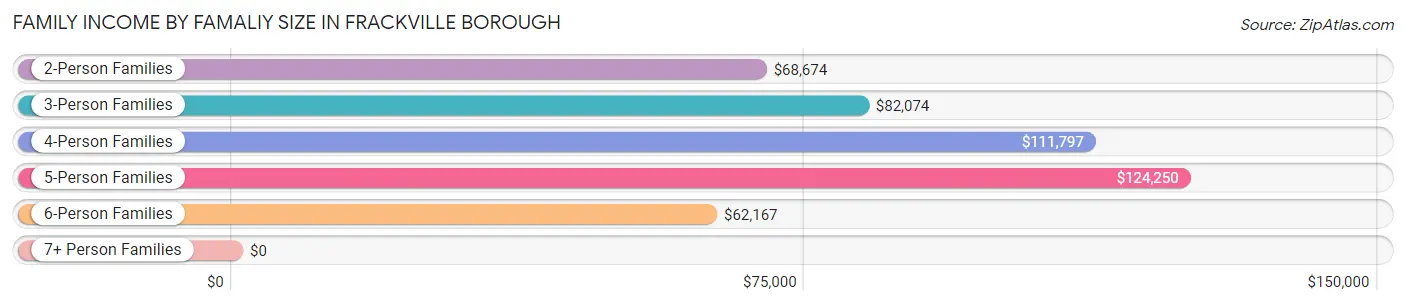
Family Income by Famaliy Size in Frackville borough
5-person families (54 | 5.8%) account for the highest median family income in Frackville borough with $124,250 per family, while 2-person families (479 | 51.4%) have the highest median income of $34,337 per family member.
| Income Bracket | # Families | Median Income |
| 2-Person Families | 479 (51.4%) | $68,674 |
| 3-Person Families | 153 (16.4%) | $82,074 |
| 4-Person Families | 141 (15.1%) | $111,797 |
| 5-Person Families | 54 (5.8%) | $124,250 |
| 6-Person Families | 78 (8.4%) | $62,167 |
| 7+ Person Families | 27 (2.9%) | $0 |
| Total | 932 (100.0%) | $80,959 |
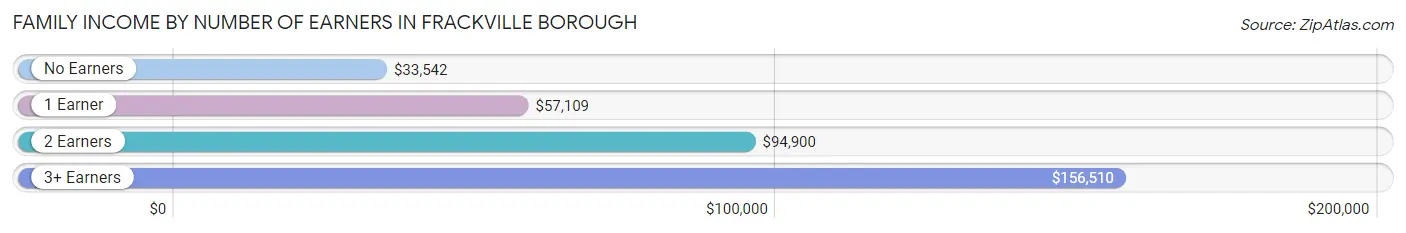
Family Income by Number of Earners in Frackville borough
The median family income in Frackville borough is $80,959, with families comprising 3+ earners (89) having the highest median family income of $156,510, while families with no earners (154) have the lowest median family income of $33,542, accounting for 9.6% and 16.5% of families, respectively.
| Number of Earners | # Families | Median Income |
| No Earners | 154 (16.5%) | $33,542 |
| 1 Earner | 287 (30.8%) | $57,109 |
| 2 Earners | 402 (43.1%) | $94,900 |
| 3+ Earners | 89 (9.6%) | $156,510 |
| Total | 932 (100.0%) | $80,959 |
Household Income in Frackville borough
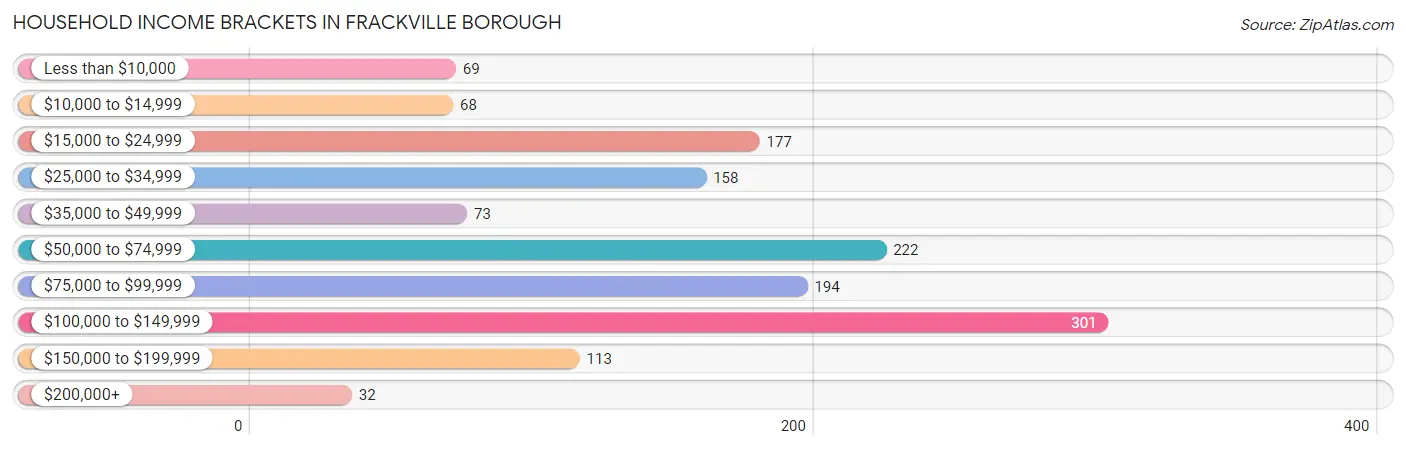
Household Income Brackets in Frackville borough
With 301 households falling in the category, the $100,000 to $149,999 income range is the most frequent in Frackville borough, accounting for 21.4% of all households. In contrast, only 32 households (2.3%) fall into the $200,000+ income bracket, making it the least populous group.
| Income Bracket | # Households | % Households |
| Less than $10,000 | 69 | 4.9% |
| $10,000 to $14,999 | 68 | 4.8% |
| $15,000 to $24,999 | 177 | 12.6% |
| $25,000 to $34,999 | 158 | 11.2% |
| $35,000 to $49,999 | 73 | 5.2% |
| $50,000 to $74,999 | 222 | 15.8% |
| $75,000 to $99,999 | 194 | 13.8% |
| $100,000 to $149,999 | 301 | 21.4% |
| $150,000 to $199,999 | 113 | 8.0% |
| $200,000+ | 32 | 2.3% |
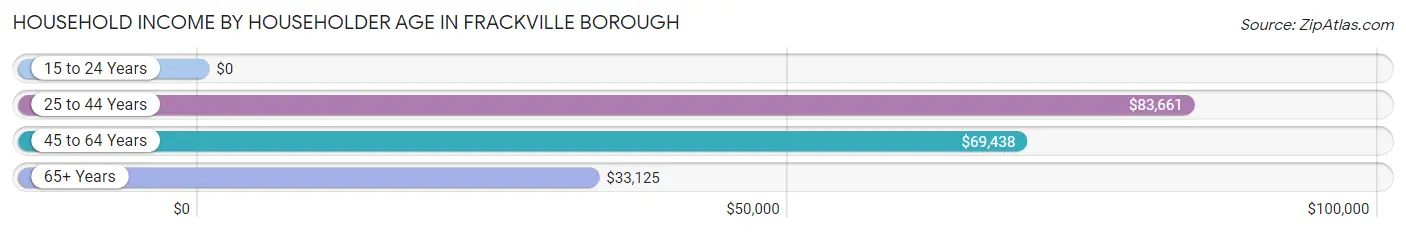
Household Income by Householder Age in Frackville borough
The median household income in Frackville borough is $65,139, with the highest median household income of $83,661 found in the 25 to 44 years age bracket for the primary householder. A total of 497 households (35.3%) fall into this category. Meanwhile, the 15 to 24 years age bracket for the primary householder has the lowest median household income of $0, with 16 households (1.1%) in this group.
| Income Bracket | # Households | Median Income |
| 15 to 24 Years | 16 (1.1%) | $0 |
| 25 to 44 Years | 497 (35.3%) | $83,661 |
| 45 to 64 Years | 473 (33.6%) | $69,438 |
| 65+ Years | 422 (30.0%) | $33,125 |
| Total | 1,408 (100.0%) | $65,139 |
Poverty in Frackville borough
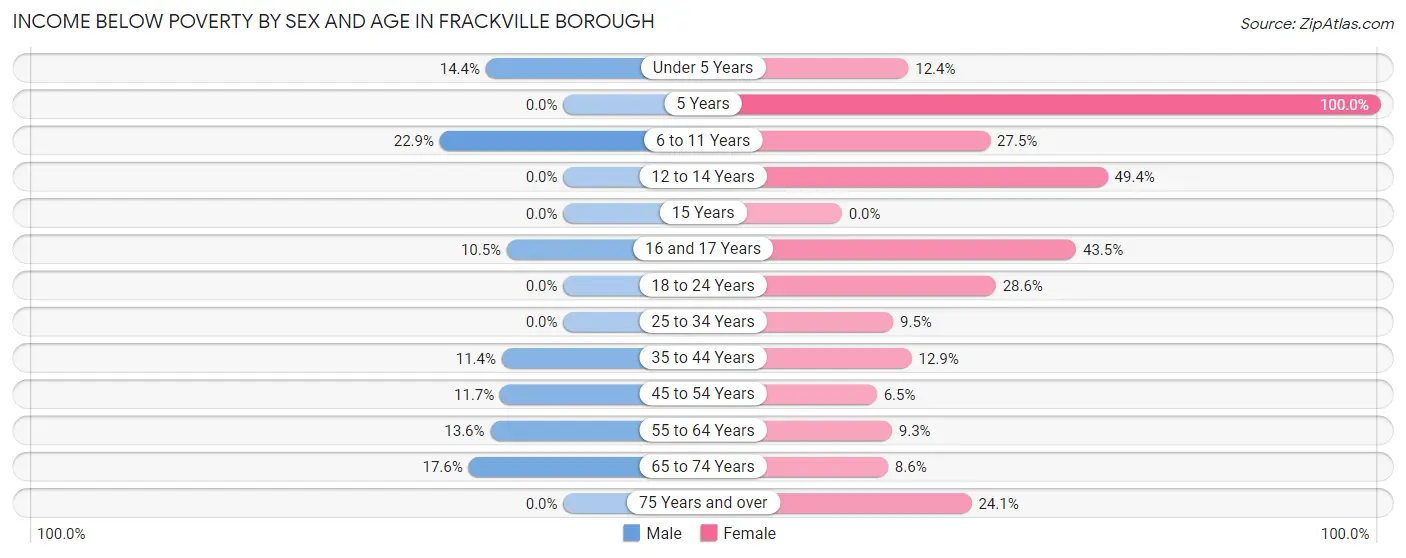
Income Below Poverty by Sex and Age in Frackville borough
With 9.6% poverty level for males and 16.1% for females among the residents of Frackville borough, 6 to 11 year old males and 5 year old females are the most vulnerable to poverty, with 39 males (22.9%) and 13 females (100.0%) in their respective age groups living below the poverty level.
| Age Bracket | Male | Female |
| Under 5 Years | 18 (14.4%) | 10 (12.3%) |
| 5 Years | 0 (0.0%) | 13 (100.0%) |
| 6 to 11 Years | 39 (22.9%) | 46 (27.5%) |
| 12 to 14 Years | 0 (0.0%) | 38 (49.3%) |
| 15 Years | 0 (0.0%) | 0 (0.0%) |
| 16 and 17 Years | 9 (10.5%) | 10 (43.5%) |
| 18 to 24 Years | 0 (0.0%) | 28 (28.6%) |
| 25 to 34 Years | 0 (0.0%) | 20 (9.5%) |
| 35 to 44 Years | 40 (11.4%) | 37 (12.9%) |
| 45 to 54 Years | 31 (11.7%) | 14 (6.5%) |
| 55 to 64 Years | 21 (13.6%) | 25 (9.3%) |
| 65 to 74 Years | 22 (17.6%) | 19 (8.6%) |
| 75 Years and over | 0 (0.0%) | 39 (24.1%) |
| Total | 180 (9.6%) | 299 (16.1%) |
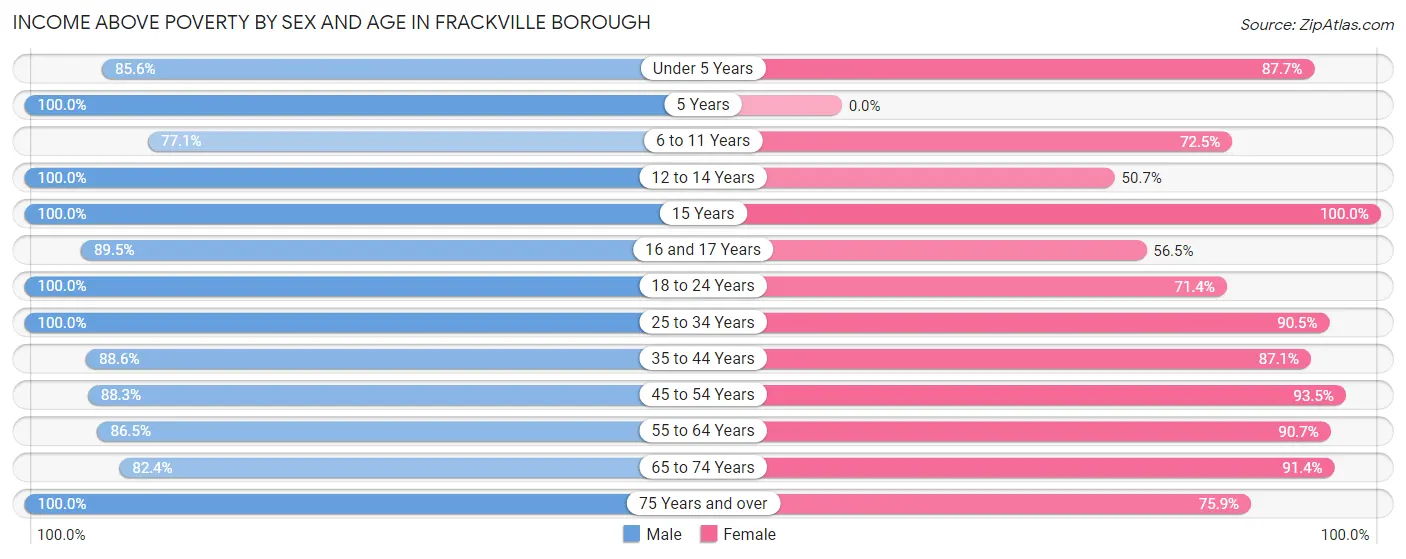
Income Above Poverty by Sex and Age in Frackville borough
According to the poverty statistics in Frackville borough, males aged 5 years and females aged 15 years are the age groups that are most secure financially, with 100.0% of males and 100.0% of females in these age groups living above the poverty line.
| Age Bracket | Male | Female |
| Under 5 Years | 107 (85.6%) | 71 (87.6%) |
| 5 Years | 47 (100.0%) | 0 (0.0%) |
| 6 to 11 Years | 131 (77.1%) | 121 (72.5%) |
| 12 to 14 Years | 77 (100.0%) | 39 (50.6%) |
| 15 Years | 26 (100.0%) | 36 (100.0%) |
| 16 and 17 Years | 77 (89.5%) | 13 (56.5%) |
| 18 to 24 Years | 129 (100.0%) | 70 (71.4%) |
| 25 to 34 Years | 223 (100.0%) | 190 (90.5%) |
| 35 to 44 Years | 310 (88.6%) | 249 (87.1%) |
| 45 to 54 Years | 233 (88.3%) | 202 (93.5%) |
| 55 to 64 Years | 134 (86.5%) | 244 (90.7%) |
| 65 to 74 Years | 103 (82.4%) | 203 (91.4%) |
| 75 Years and over | 101 (100.0%) | 123 (75.9%) |
| Total | 1,698 (90.4%) | 1,561 (83.9%) |
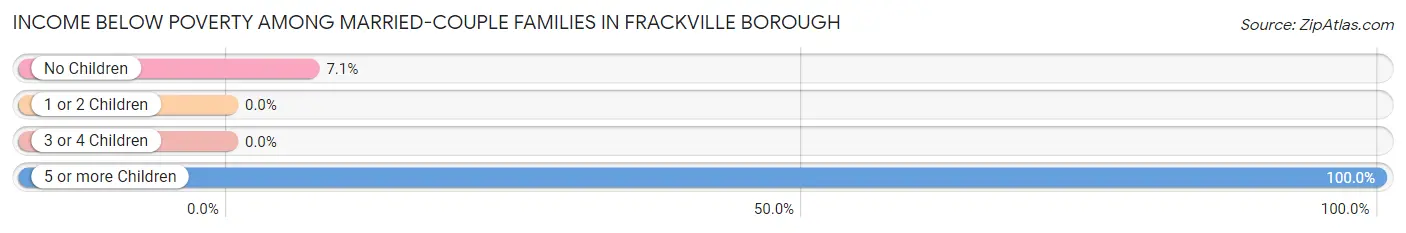
Income Below Poverty Among Married-Couple Families in Frackville borough
The poverty statistics for married-couple families in Frackville borough show that 6.6% or 41 of the total 622 families live below the poverty line. Families with 5 or more children have the highest poverty rate of 100.0%, comprising of 11 families. On the other hand, families with 1 or 2 children have the lowest poverty rate of 0.0%, which includes 0 families.
| Children | Above Poverty | Below Poverty |
| No Children | 393 (92.9%) | 30 (7.1%) |
| 1 or 2 Children | 112 (100.0%) | 0 (0.0%) |
| 3 or 4 Children | 76 (100.0%) | 0 (0.0%) |
| 5 or more Children | 0 (0.0%) | 11 (100.0%) |
| Total | 581 (93.4%) | 41 (6.6%) |
Income Below Poverty Among Single-Parent Households in Frackville borough
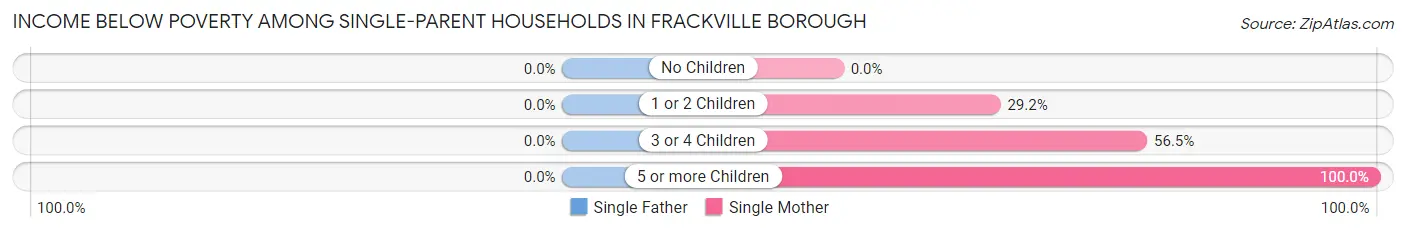
| Children | Single Father | Single Mother |
| No Children | 0 (0.0%) | 0 (0.0%) |
| 1 or 2 Children | 0 (0.0%) | 26 (29.2%) |
| 3 or 4 Children | 0 (0.0%) | 13 (56.5%) |
| 5 or more Children | 0 (0.0%) | 8 (100.0%) |
| Total | 0 (0.0%) | 47 (23.2%) |
Income Below Poverty Among Married-Couple vs Single-Parent Households in Frackville borough
The poverty data for Frackville borough shows that 41 of the married-couple family households (6.6%) and 47 of the single-parent households (15.2%) are living below the poverty level. Within the married-couple family households, those with 5 or more children have the highest poverty rate, with 11 households (100.0%) falling below the poverty line. Among the single-parent households, those with 5 or more children have the highest poverty rate, with 8 household (100.0%) living below poverty.
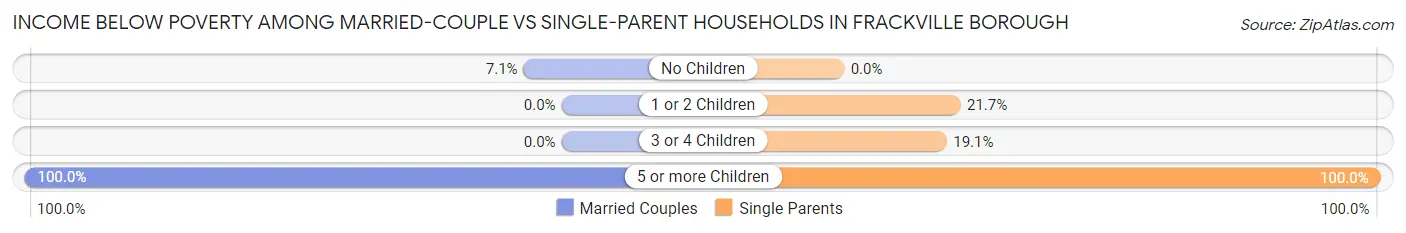
| Children | Married-Couple Families | Single-Parent Households |
| No Children | 30 (7.1%) | 0 (0.0%) |
| 1 or 2 Children | 0 (0.0%) | 26 (21.7%) |
| 3 or 4 Children | 0 (0.0%) | 13 (19.1%) |
| 5 or more Children | 11 (100.0%) | 8 (100.0%) |
| Total | 41 (6.6%) | 47 (15.2%) |
Race in Frackville borough
The most populous races in Frackville borough are White / Caucasian (3,619 | 93.7%), Hispanic or Latino (226 | 5.9%), and Two or more Races (216 | 5.6%).
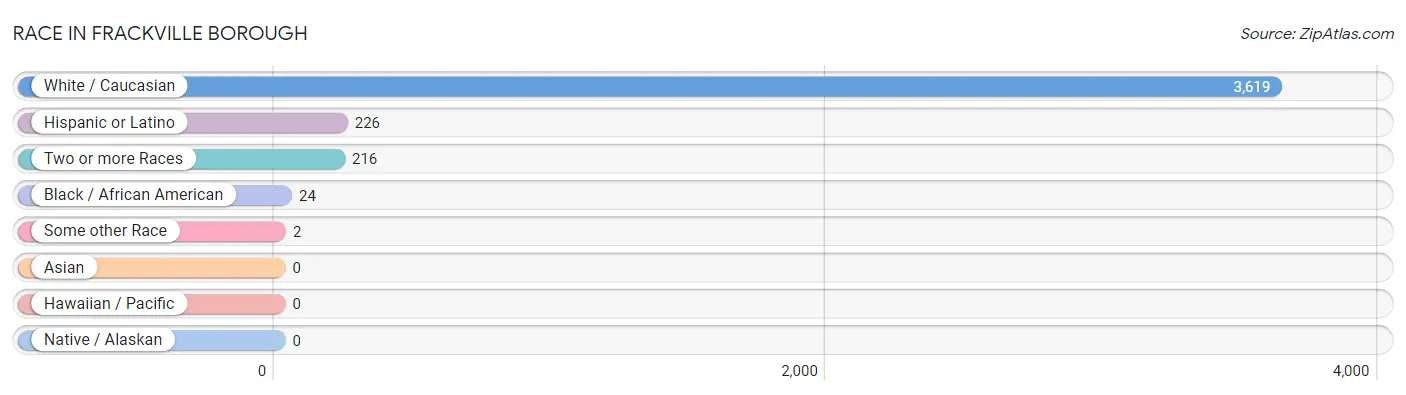
| Race | # Population | % Population |
| Asian | 0 | 0.0% |
| Black / African American | 24 | 0.6% |
| Hawaiian / Pacific | 0 | 0.0% |
| Hispanic or Latino | 226 | 5.9% |
| Native / Alaskan | 0 | 0.0% |
| White / Caucasian | 3,619 | 93.7% |
| Two or more Races | 216 | 5.6% |
| Some other Race | 2 | 0.1% |
| Total | 3,861 | 100.0% |
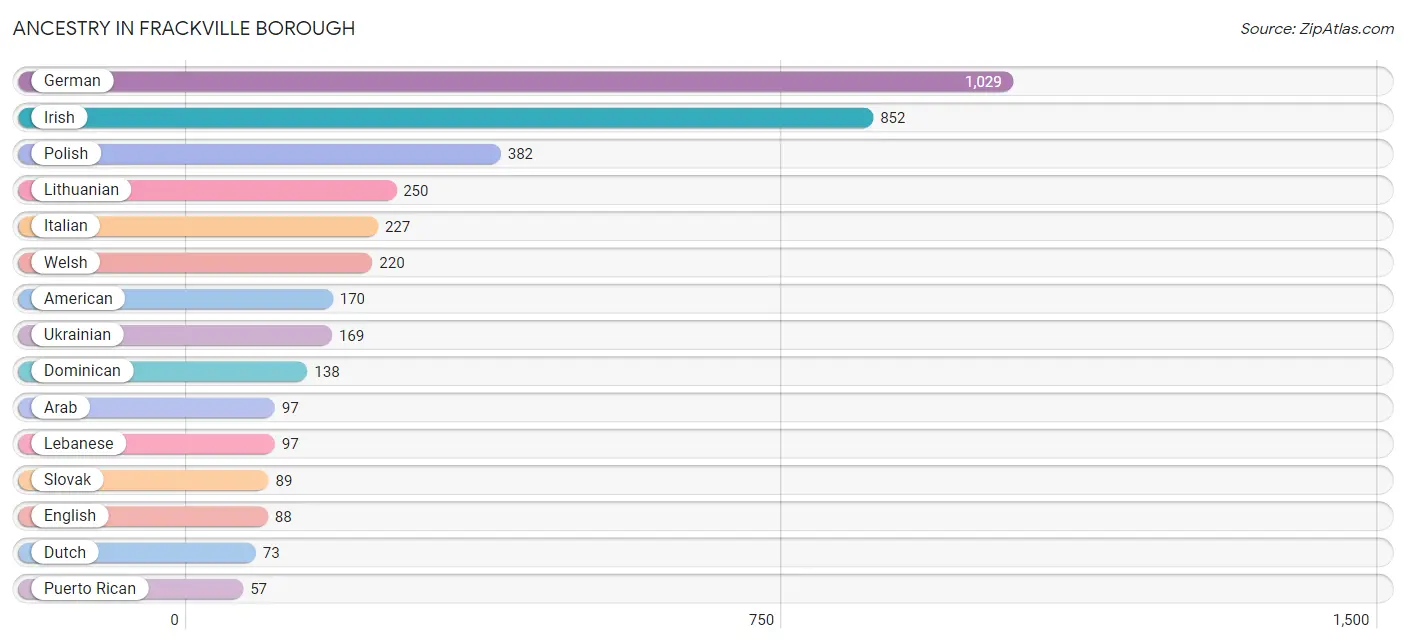
Ancestry in Frackville borough
The most populous ancestries reported in Frackville borough are German (1,029 | 26.7%), Irish (852 | 22.1%), Polish (382 | 9.9%), Lithuanian (250 | 6.5%), and Italian (227 | 5.9%), together accounting for 71.0% of all Frackville borough residents.
| Ancestry | # Population | % Population |
| Albanian | 19 | 0.5% |
| American | 170 | 4.4% |
| Apache | 4 | 0.1% |
| Arab | 97 | 2.5% |
| Austrian | 19 | 0.5% |
| Blackfeet | 7 | 0.2% |
| British | 16 | 0.4% |
| Cherokee | 11 | 0.3% |
| Choctaw | 7 | 0.2% |
| Croatian | 9 | 0.2% |
| Czech | 10 | 0.3% |
| Danish | 3 | 0.1% |
| Dominican | 138 | 3.6% |
| Dutch | 73 | 1.9% |
| English | 88 | 2.3% |
| European | 35 | 0.9% |
| French | 36 | 0.9% |
| French Canadian | 9 | 0.2% |
| German | 1,029 | 26.7% |
| Greek | 12 | 0.3% |
| Hungarian | 35 | 0.9% |
| Irish | 852 | 22.1% |
| Italian | 227 | 5.9% |
| Korean | 8 | 0.2% |
| Lebanese | 97 | 2.5% |
| Lithuanian | 250 | 6.5% |
| Mexican | 31 | 0.8% |
| Polish | 382 | 9.9% |
| Puerto Rican | 57 | 1.5% |
| Russian | 39 | 1.0% |
| Scotch-Irish | 15 | 0.4% |
| Scottish | 18 | 0.5% |
| Slavic | 2 | 0.1% |
| Slovak | 89 | 2.3% |
| Swedish | 28 | 0.7% |
| Swiss | 1 | 0.0% |
| Ukrainian | 169 | 4.4% |
| Welsh | 220 | 5.7% | View All 38 Rows |
Immigrants in Frackville borough
The most numerous immigrant groups reported in Frackville borough came from Europe (29 | 0.7%), Eastern Europe (17 | 0.4%), Germany (12 | 0.3%), Western Europe (12 | 0.3%), and Ukraine (9 | 0.2%), together accounting for 2.0% of all Frackville borough residents.
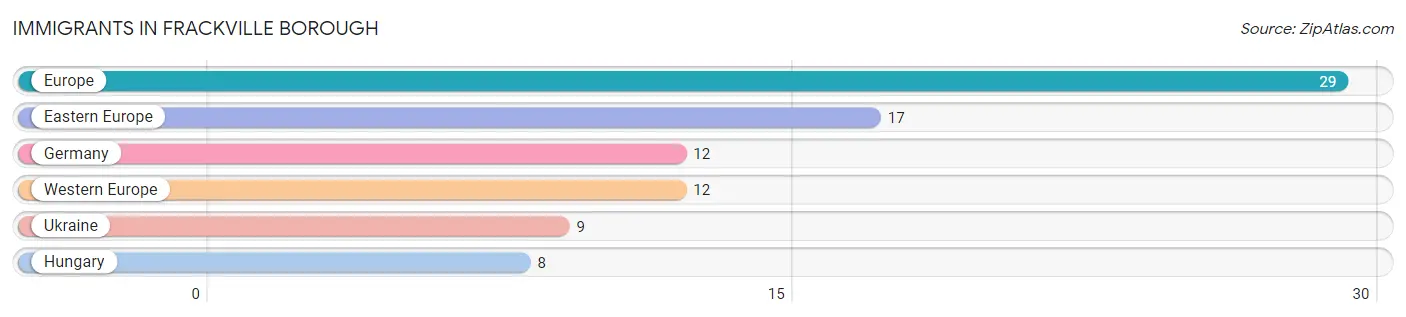
| Immigration Origin | # Population | % Population |
| Eastern Europe | 17 | 0.4% |
| Europe | 29 | 0.7% |
| Germany | 12 | 0.3% |
| Hungary | 8 | 0.2% |
| Ukraine | 9 | 0.2% |
| Western Europe | 12 | 0.3% | View All 6 Rows |
Sex and Age in Frackville borough
Sex and Age in Frackville borough
The most populous age groups in Frackville borough are 40 to 44 Years (248 | 13.1%) for men and 25 to 29 Years (166 | 8.5%) for women.
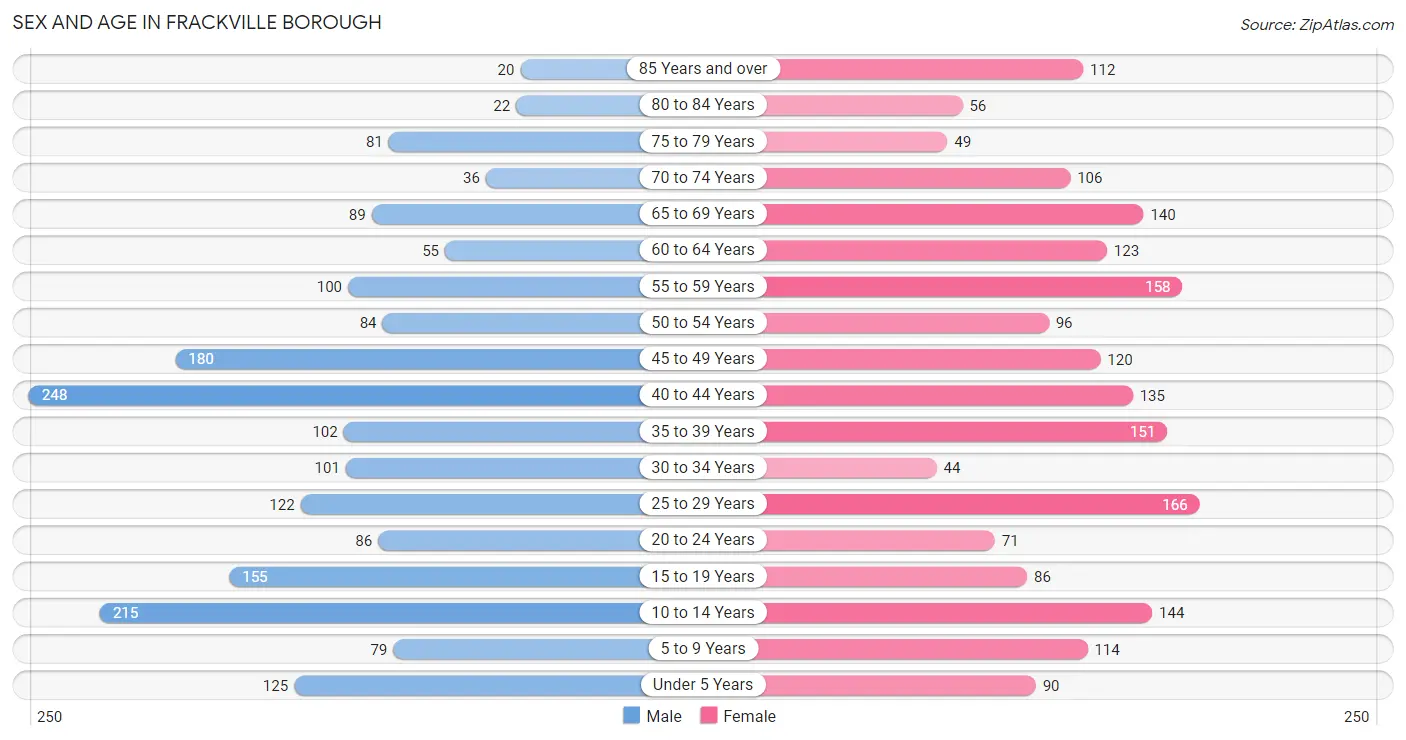
| Age Bracket | Male | Female |
| Under 5 Years | 125 (6.6%) | 90 (4.6%) |
| 5 to 9 Years | 79 (4.2%) | 114 (5.8%) |
| 10 to 14 Years | 215 (11.3%) | 144 (7.3%) |
| 15 to 19 Years | 155 (8.2%) | 86 (4.4%) |
| 20 to 24 Years | 86 (4.5%) | 71 (3.6%) |
| 25 to 29 Years | 122 (6.4%) | 166 (8.5%) |
| 30 to 34 Years | 101 (5.3%) | 44 (2.2%) |
| 35 to 39 Years | 102 (5.4%) | 151 (7.7%) |
| 40 to 44 Years | 248 (13.1%) | 135 (6.9%) |
| 45 to 49 Years | 180 (9.5%) | 120 (6.1%) |
| 50 to 54 Years | 84 (4.4%) | 96 (4.9%) |
| 55 to 59 Years | 100 (5.3%) | 158 (8.1%) |
| 60 to 64 Years | 55 (2.9%) | 123 (6.3%) |
| 65 to 69 Years | 89 (4.7%) | 140 (7.1%) |
| 70 to 74 Years | 36 (1.9%) | 106 (5.4%) |
| 75 to 79 Years | 81 (4.3%) | 49 (2.5%) |
| 80 to 84 Years | 22 (1.2%) | 56 (2.9%) |
| 85 Years and over | 20 (1.1%) | 112 (5.7%) |
| Total | 1,900 (100.0%) | 1,961 (100.0%) |
Families and Households in Frackville borough
Median Family Size in Frackville borough
The median family size in Frackville borough is 3.23 persons per family, with single male/father families (107 | 11.5%) accounting for the largest median family size of 3.51 persons per family. On the other hand, single female/mother families (203 | 21.8%) represent the smallest median family size with 2.96 persons per family.
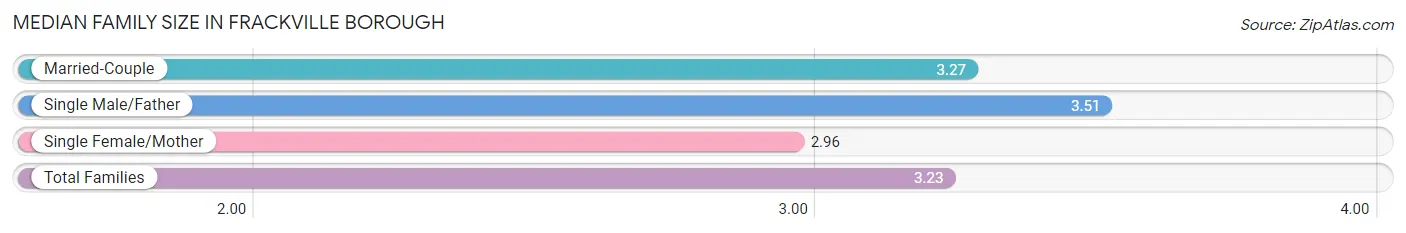
| Family Type | # Families | Family Size |
| Married-Couple | 622 (66.7%) | 3.27 |
| Single Male/Father | 107 (11.5%) | 3.51 |
| Single Female/Mother | 203 (21.8%) | 2.96 |
| Total Families | 932 (100.0%) | 3.23 |
Median Household Size in Frackville borough
The median household size in Frackville borough is 2.66 persons per household, with single male/father households (107 | 7.6%) accounting for the largest median household size of 4.52 persons per household. non-family households (476 | 33.8%) represent the smallest median household size with 1.10 persons per household.
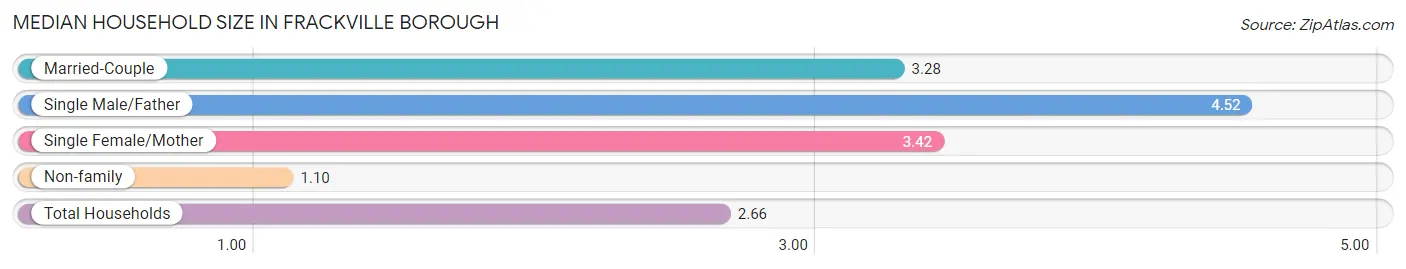
| Household Type | # Households | Household Size |
| Married-Couple | 622 (44.2%) | 3.28 |
| Single Male/Father | 107 (7.6%) | 4.52 |
| Single Female/Mother | 203 (14.4%) | 3.42 |
| Non-family | 476 (33.8%) | 1.10 |
| Total Households | 1,408 (100.0%) | 2.66 |
Household Size by Marriage Status in Frackville borough
Out of a total of 1,408 households in Frackville borough, 932 (66.2%) are family households, while 476 (33.8%) are nonfamily households. The most numerous type of family households are 2-person households, comprising 394, and the most common type of nonfamily households are 1-person households, comprising 427.
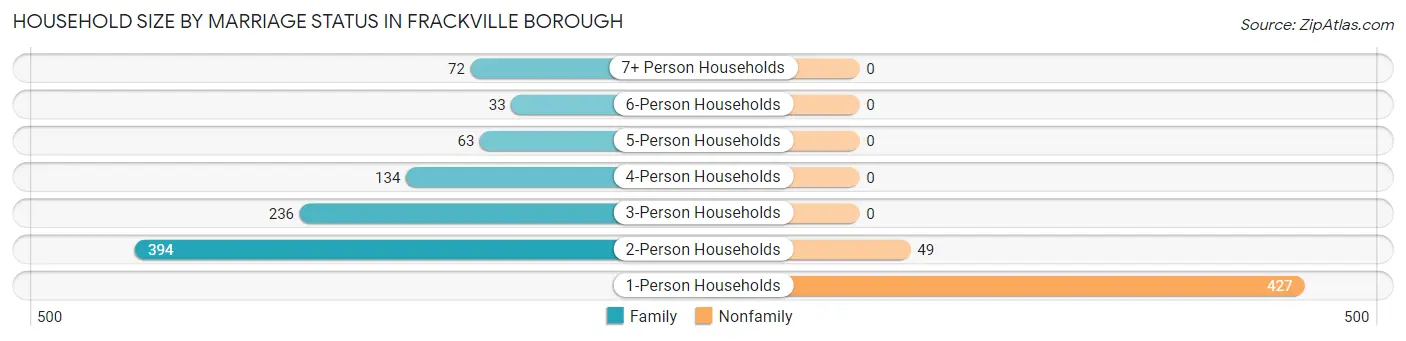
| Household Size | Family Households | Nonfamily Households |
| 1-Person Households | - | 427 (30.3%) |
| 2-Person Households | 394 (28.0%) | 49 (3.5%) |
| 3-Person Households | 236 (16.8%) | 0 (0.0%) |
| 4-Person Households | 134 (9.5%) | 0 (0.0%) |
| 5-Person Households | 63 (4.5%) | 0 (0.0%) |
| 6-Person Households | 33 (2.3%) | 0 (0.0%) |
| 7+ Person Households | 72 (5.1%) | 0 (0.0%) |
| Total | 932 (66.2%) | 476 (33.8%) |
Female Fertility in Frackville borough
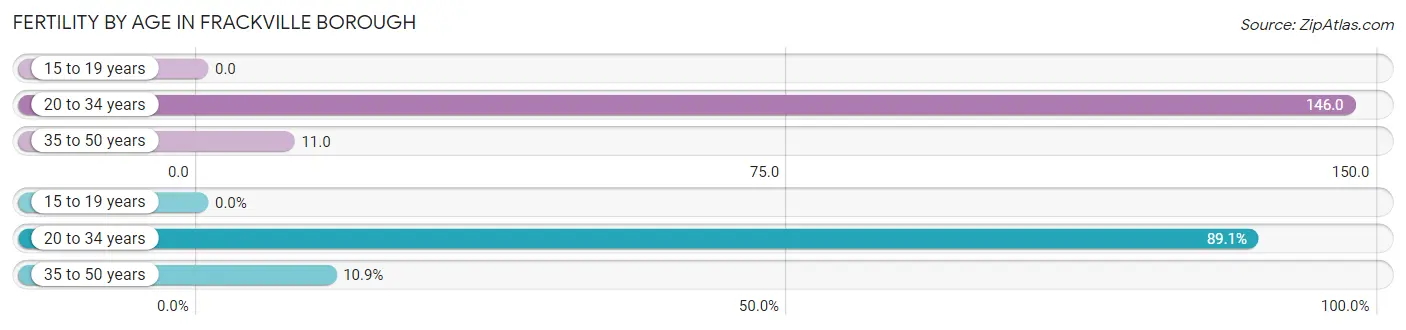
Fertility by Age in Frackville borough
Average fertility rate in Frackville borough is 57.0 births per 1,000 women. Women in the age bracket of 20 to 34 years have the highest fertility rate with 146.0 births per 1,000 women. Women in the age bracket of 20 to 34 years acount for 89.1% of all women with births.
| Age Bracket | Women with Births | Births / 1,000 Women |
| 15 to 19 years | 0 (0.0%) | 0.0 |
| 20 to 34 years | 41 (89.1%) | 146.0 |
| 35 to 50 years | 5 (10.9%) | 11.0 |
| Total | 46 (100.0%) | 57.0 |
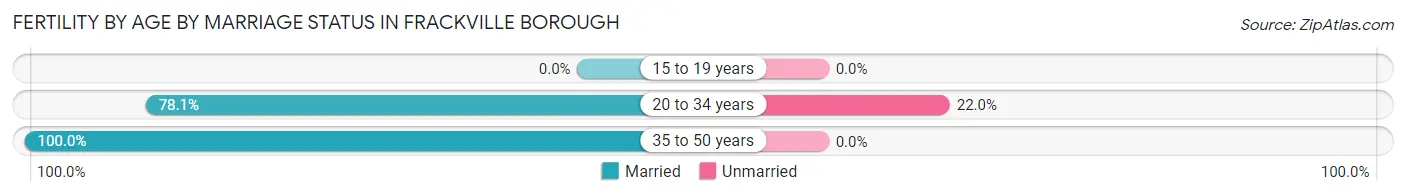
Fertility by Age by Marriage Status in Frackville borough
80.4% of women with births (46) in Frackville borough are married. The highest percentage of unmarried women with births falls into 20 to 34 years age bracket with 22.0% of them unmarried at the time of birth, while the lowest percentage of unmarried women with births belong to 35 to 50 years age bracket with 0.0% of them unmarried.
| Age Bracket | Married | Unmarried |
| 15 to 19 years | 0 (0.0%) | 0 (0.0%) |
| 20 to 34 years | 32 (78.0%) | 9 (22.0%) |
| 35 to 50 years | 5 (100.0%) | 0 (0.0%) |
| Total | 37 (80.4%) | 9 (19.6%) |
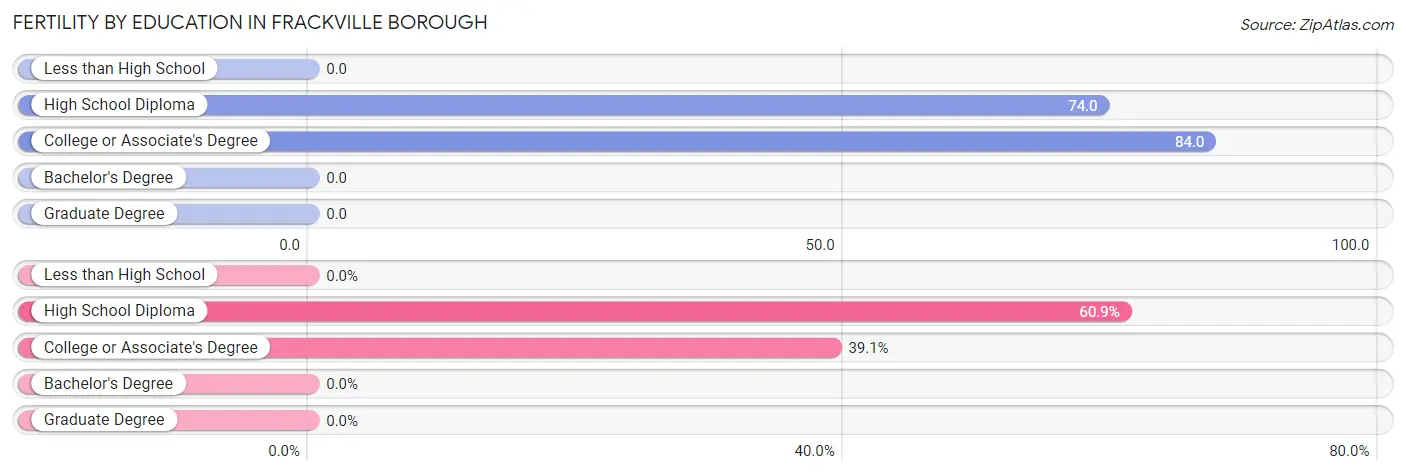
Fertility by Education in Frackville borough
| Educational Attainment | Women with Births | Births / 1,000 Women |
| Less than High School | 0 (0.0%) | 0.0 |
| High School Diploma | 28 (60.9%) | 74.0 |
| College or Associate's Degree | 18 (39.1%) | 84.0 |
| Bachelor's Degree | 0 (0.0%) | 0.0 |
| Graduate Degree | 0 (0.0%) | 0.0 |
| Total | 46 (100.0%) | 57.0 |
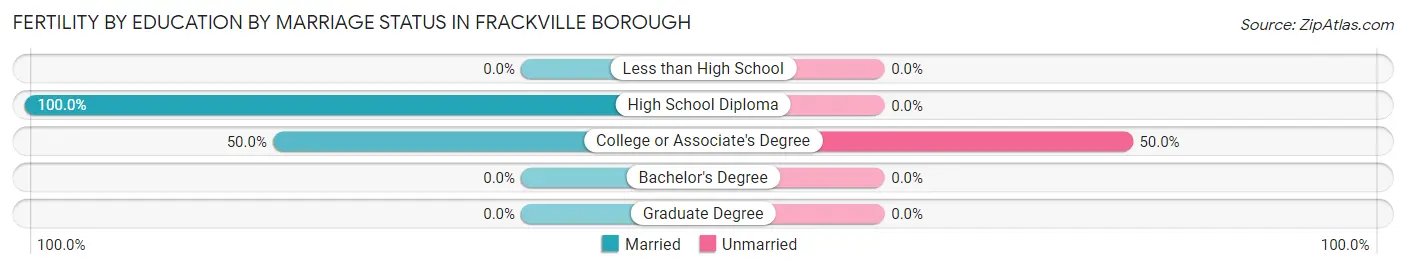
Fertility by Education by Marriage Status in Frackville borough
19.6% of women with births in Frackville borough are unmarried. Women with the educational attainment of high school diploma are most likely to be married with 100.0% of them married at childbirth, while women with the educational attainment of college or associate's degree are least likely to be married with 50.0% of them unmarried at childbirth.
| Educational Attainment | Married | Unmarried |
| Less than High School | 0 (0.0%) | 0 (0.0%) |
| High School Diploma | 28 (100.0%) | 0 (0.0%) |
| College or Associate's Degree | 9 (50.0%) | 9 (50.0%) |
| Bachelor's Degree | 0 (0.0%) | 0 (0.0%) |
| Graduate Degree | 0 (0.0%) | 0 (0.0%) |
| Total | 37 (80.4%) | 9 (19.6%) |
Employment Characteristics in Frackville borough
Employment by Class of Employer in Frackville borough
Among the 1,592 employed individuals in Frackville borough, private company employees (1,196 | 75.1%), not-for-profit organizations (143 | 9.0%), and state government employees (110 | 6.9%) make up the most common classes of employment.
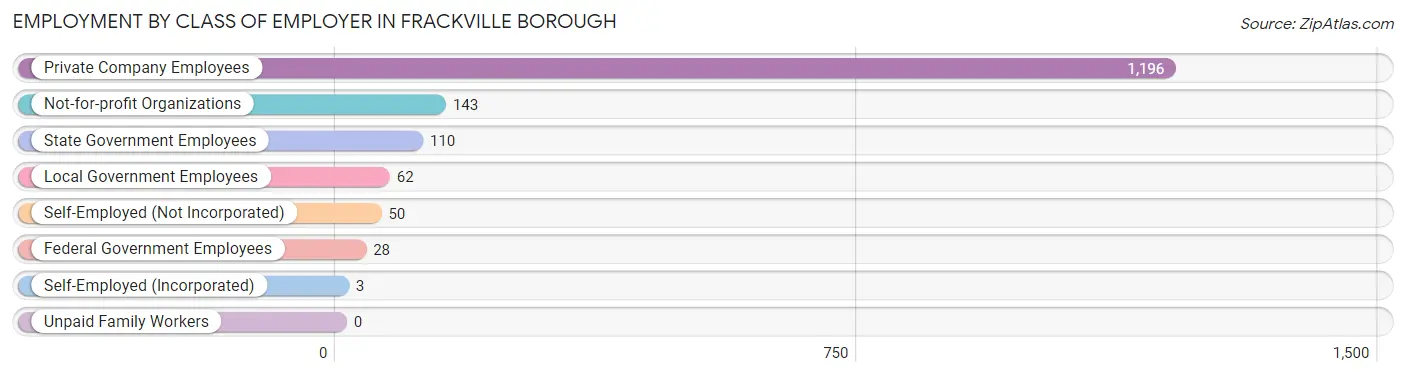
| Employer Class | # Employees | % Employees |
| Private Company Employees | 1,196 | 75.1% |
| Self-Employed (Incorporated) | 3 | 0.2% |
| Self-Employed (Not Incorporated) | 50 | 3.1% |
| Not-for-profit Organizations | 143 | 9.0% |
| Local Government Employees | 62 | 3.9% |
| State Government Employees | 110 | 6.9% |
| Federal Government Employees | 28 | 1.8% |
| Unpaid Family Workers | 0 | 0.0% |
| Total | 1,592 | 100.0% |
Employment Status by Age in Frackville borough
According to the labor force statistics for Frackville borough, out of the total population over 16 years of age (3,032), 54.8% or 1,662 individuals are in the labor force, with 3.0% or 50 of them unemployed. The age group with the highest labor force participation rate is 20 to 24 years, with 88.5% or 139 individuals in the labor force. Within the labor force, the 35 to 44 years age range has the highest percentage of unemployed individuals, with 5.5% or 25 of them being unemployed.
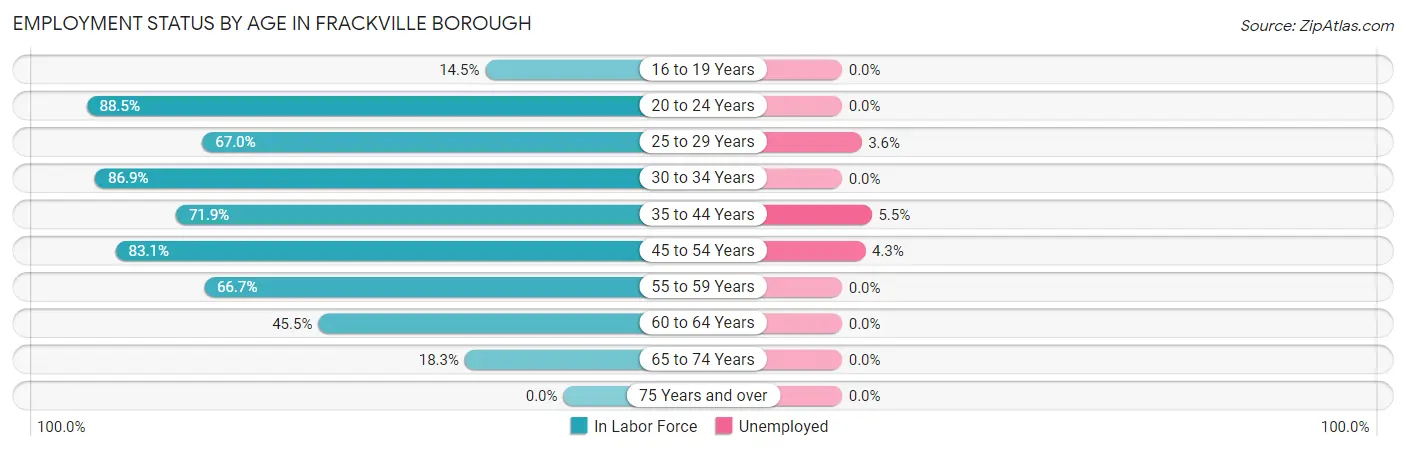
| Age Bracket | In Labor Force | Unemployed |
| 16 to 19 Years | 26 (14.5%) | 0 (0.0%) |
| 20 to 24 Years | 139 (88.5%) | 0 (0.0%) |
| 25 to 29 Years | 193 (67.0%) | 7 (3.6%) |
| 30 to 34 Years | 126 (86.9%) | 0 (0.0%) |
| 35 to 44 Years | 457 (71.9%) | 25 (5.5%) |
| 45 to 54 Years | 399 (83.1%) | 17 (4.3%) |
| 55 to 59 Years | 172 (66.7%) | 0 (0.0%) |
| 60 to 64 Years | 81 (45.5%) | 0 (0.0%) |
| 65 to 74 Years | 68 (18.3%) | 0 (0.0%) |
| 75 Years and over | 0 (0.0%) | 0 (0.0%) |
| Total | 1,662 (54.8%) | 50 (3.0%) |
Employment Status by Educational Attainment in Frackville borough
According to labor force statistics for Frackville borough, 71.9% of individuals (1,427) out of the total population between 25 and 64 years of age (1,985) are in the labor force, with 3.4% or 49 of them being unemployed. The group with the highest labor force participation rate are those with the educational attainment of bachelor's degree or higher, with 92.6% or 239 individuals in the labor force. Within the labor force, individuals with college / associate degree education have the highest percentage of unemployment, with 9.0% or 33 of them being unemployed.
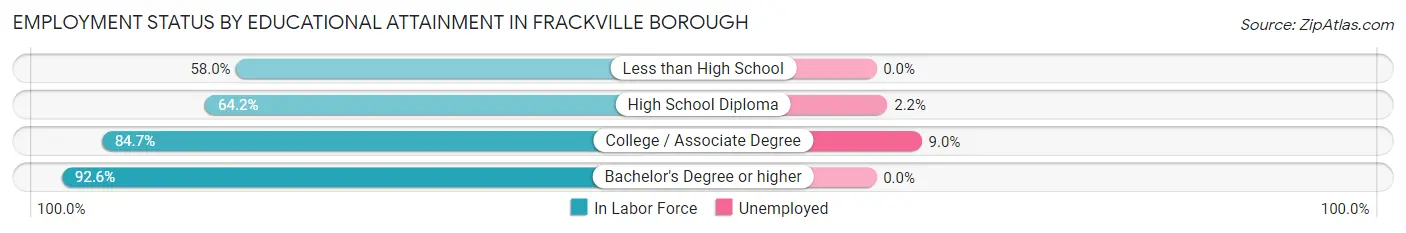
| Educational Attainment | In Labor Force | Unemployed |
| Less than High School | 83 (58.0%) | 0 (0.0%) |
| High School Diploma | 740 (64.2%) | 25 (2.2%) |
| College / Associate Degree | 366 (84.7%) | 39 (9.0%) |
| Bachelor's Degree or higher | 239 (92.6%) | 0 (0.0%) |
| Total | 1,427 (71.9%) | 67 (3.4%) |
Employment Occupations by Sex in Frackville borough
Management, Business, Science and Arts Occupations
The most common Management, Business, Science and Arts occupations in Frackville borough are Community & Social Service (186 | 11.5%), Health Diagnosing & Treating (94 | 5.8%), Education, Arts & Media (83 | 5.1%), Business & Financial (74 | 4.6%), and Education Instruction & Library (66 | 4.1%).
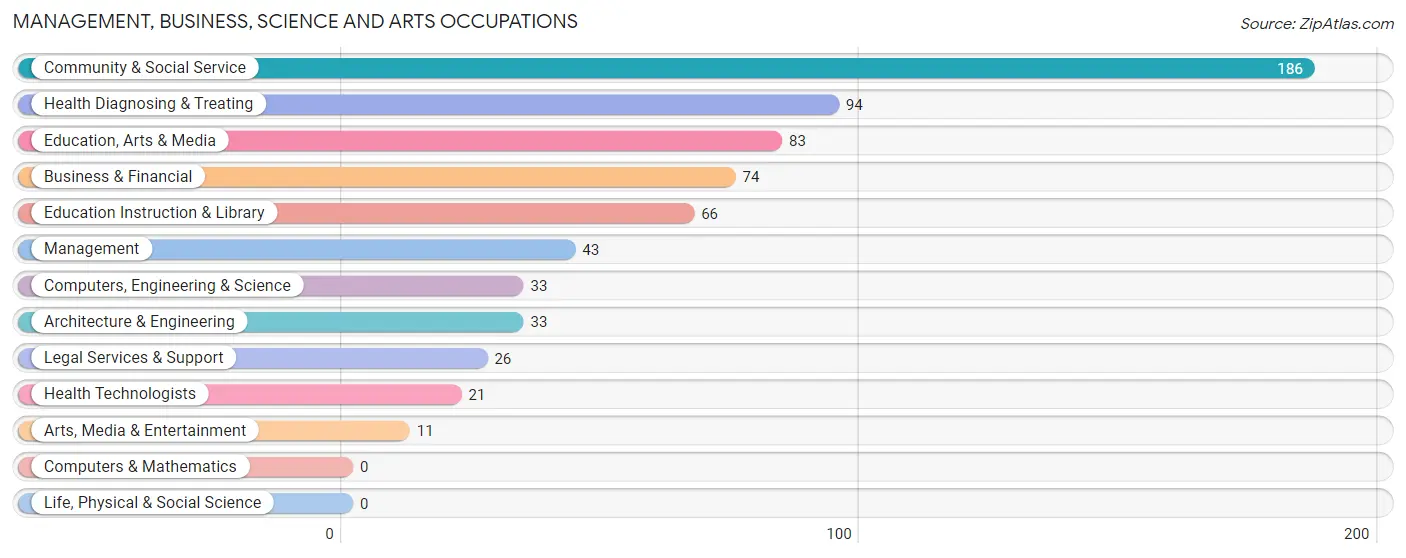
Management, Business, Science and Arts Occupations by Sex
Within the Management, Business, Science and Arts occupations in Frackville borough, the most male-oriented occupations are Computers, Engineering & Science (100.0%), Architecture & Engineering (100.0%), and Legal Services & Support (84.6%), while the most female-oriented occupations are Arts, Media & Entertainment (100.0%), Health Diagnosing & Treating (84.0%), and Health Technologists (76.2%).
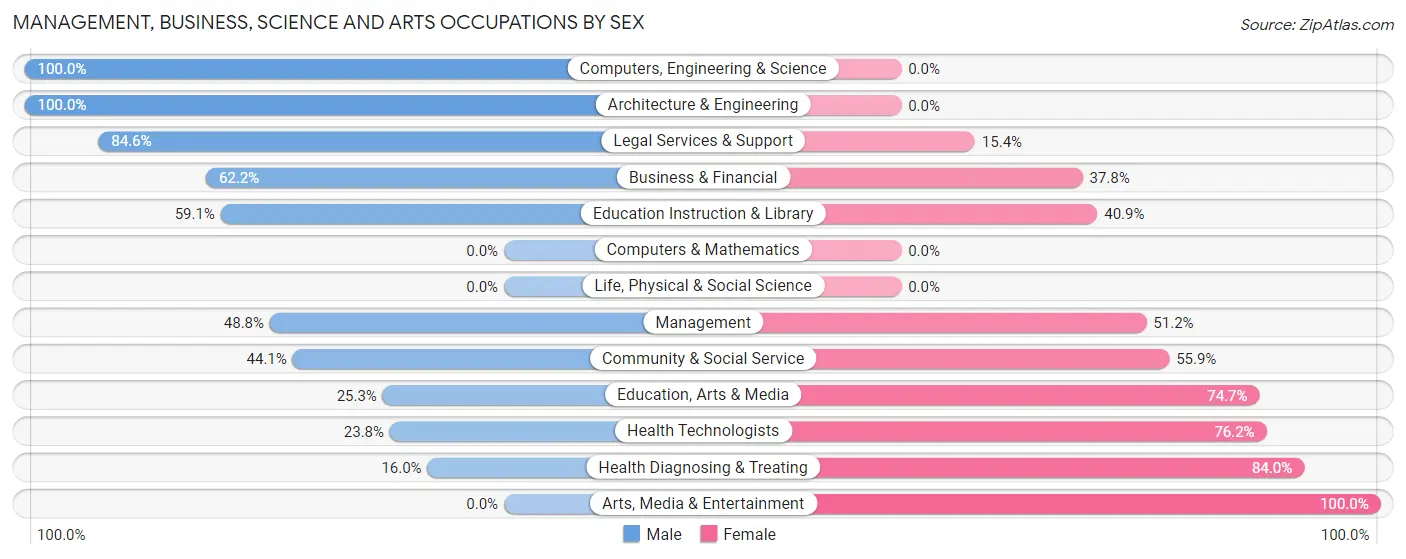
| Occupation | Male | Female |
| Management | 21 (48.8%) | 22 (51.2%) |
| Business & Financial | 46 (62.2%) | 28 (37.8%) |
| Computers, Engineering & Science | 33 (100.0%) | 0 (0.0%) |
| Computers & Mathematics | 0 (0.0%) | 0 (0.0%) |
| Architecture & Engineering | 33 (100.0%) | 0 (0.0%) |
| Life, Physical & Social Science | 0 (0.0%) | 0 (0.0%) |
| Community & Social Service | 82 (44.1%) | 104 (55.9%) |
| Education, Arts & Media | 21 (25.3%) | 62 (74.7%) |
| Legal Services & Support | 22 (84.6%) | 4 (15.4%) |
| Education Instruction & Library | 39 (59.1%) | 27 (40.9%) |
| Arts, Media & Entertainment | 0 (0.0%) | 11 (100.0%) |
| Health Diagnosing & Treating | 15 (16.0%) | 79 (84.0%) |
| Health Technologists | 5 (23.8%) | 16 (76.2%) |
| Total (Category) | 197 (45.8%) | 233 (54.2%) |
| Total (Overall) | 916 (56.8%) | 696 (43.2%) |
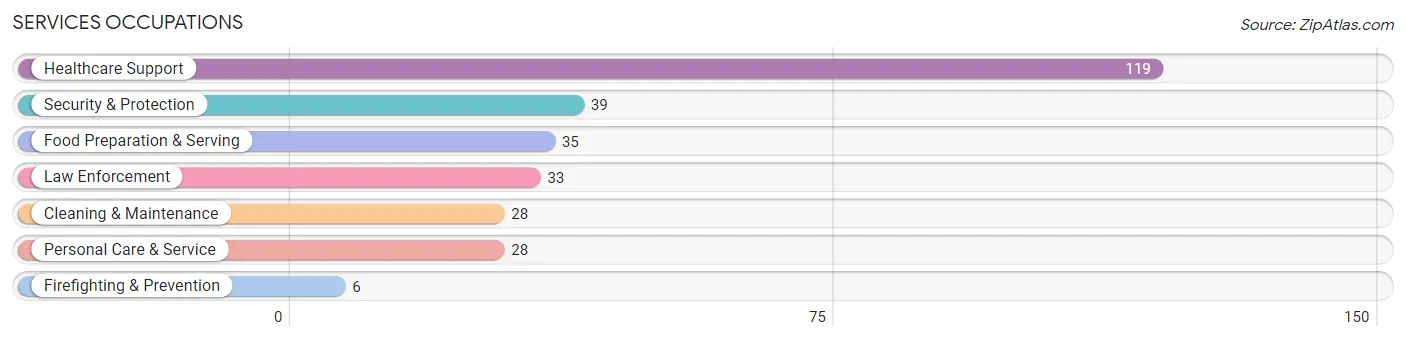
Services Occupations
The most common Services occupations in Frackville borough are Healthcare Support (119 | 7.4%), Security & Protection (39 | 2.4%), Food Preparation & Serving (35 | 2.2%), Law Enforcement (33 | 2.1%), and Cleaning & Maintenance (28 | 1.7%).
Services Occupations by Sex
Within the Services occupations in Frackville borough, the most male-oriented occupations are Security & Protection (100.0%), Firefighting & Prevention (100.0%), and Law Enforcement (100.0%), while the most female-oriented occupations are Food Preparation & Serving (100.0%), Personal Care & Service (100.0%), and Healthcare Support (69.8%).
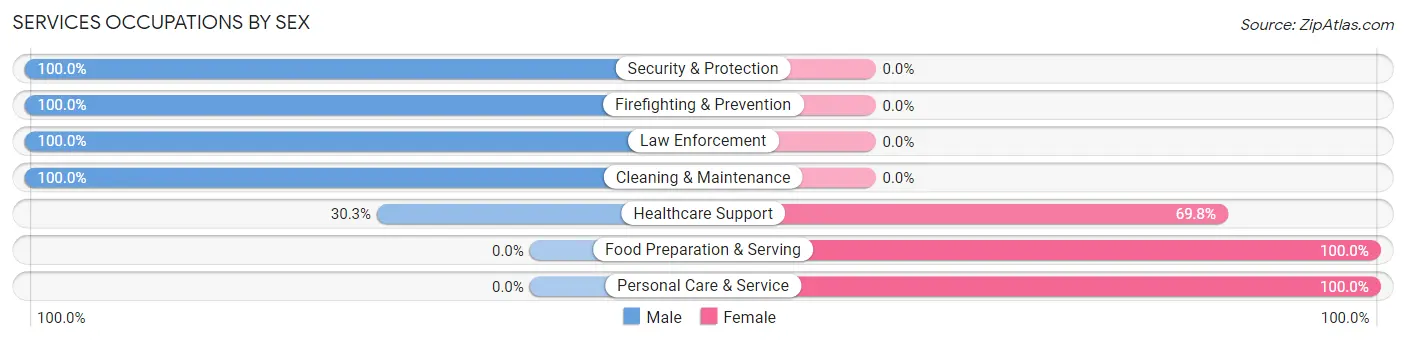
| Occupation | Male | Female |
| Healthcare Support | 36 (30.2%) | 83 (69.8%) |
| Security & Protection | 39 (100.0%) | 0 (0.0%) |
| Firefighting & Prevention | 6 (100.0%) | 0 (0.0%) |
| Law Enforcement | 33 (100.0%) | 0 (0.0%) |
| Food Preparation & Serving | 0 (0.0%) | 35 (100.0%) |
| Cleaning & Maintenance | 28 (100.0%) | 0 (0.0%) |
| Personal Care & Service | 0 (0.0%) | 28 (100.0%) |
| Total (Category) | 103 (41.4%) | 146 (58.6%) |
| Total (Overall) | 916 (56.8%) | 696 (43.2%) |
Sales and Office Occupations
The most common Sales and Office occupations in Frackville borough are Office & Administration (169 | 10.5%), and Sales & Related (144 | 8.9%).

Sales and Office Occupations by Sex

| Occupation | Male | Female |
| Sales & Related | 69 (47.9%) | 75 (52.1%) |
| Office & Administration | 24 (14.2%) | 145 (85.8%) |
| Total (Category) | 93 (29.7%) | 220 (70.3%) |
| Total (Overall) | 916 (56.8%) | 696 (43.2%) |
Natural Resources, Construction and Maintenance Occupations
The most common Natural Resources, Construction and Maintenance occupations in Frackville borough are Installation, Maintenance & Repair (50 | 3.1%), and Construction & Extraction (26 | 1.6%).
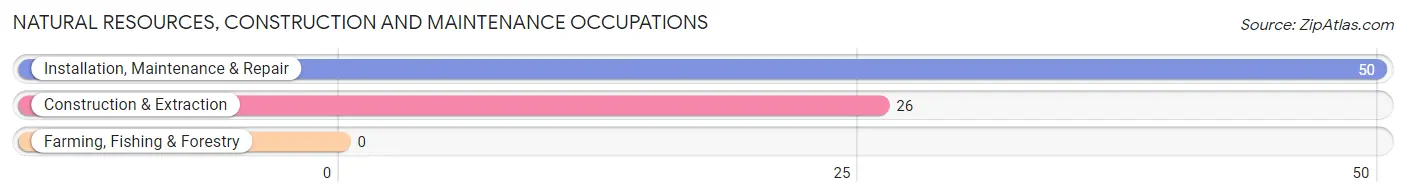
Natural Resources, Construction and Maintenance Occupations by Sex
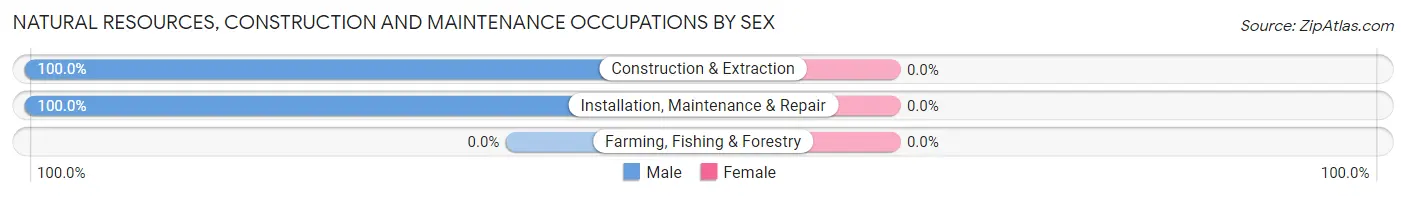
| Occupation | Male | Female |
| Farming, Fishing & Forestry | 0 (0.0%) | 0 (0.0%) |
| Construction & Extraction | 26 (100.0%) | 0 (0.0%) |
| Installation, Maintenance & Repair | 50 (100.0%) | 0 (0.0%) |
| Total (Category) | 76 (100.0%) | 0 (0.0%) |
| Total (Overall) | 916 (56.8%) | 696 (43.2%) |
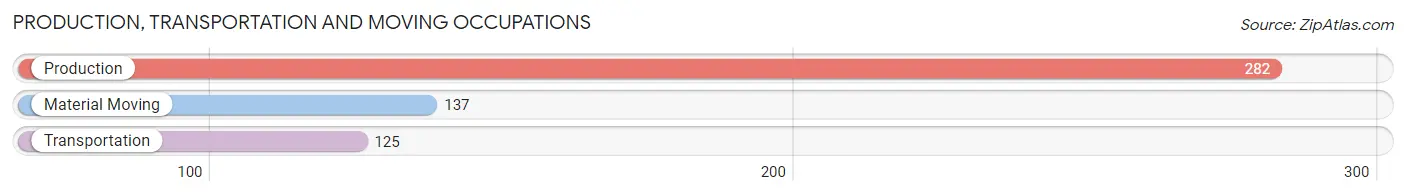
Production, Transportation and Moving Occupations
The most common Production, Transportation and Moving occupations in Frackville borough are Production (282 | 17.5%), Material Moving (137 | 8.5%), and Transportation (125 | 7.7%).
Production, Transportation and Moving Occupations by Sex
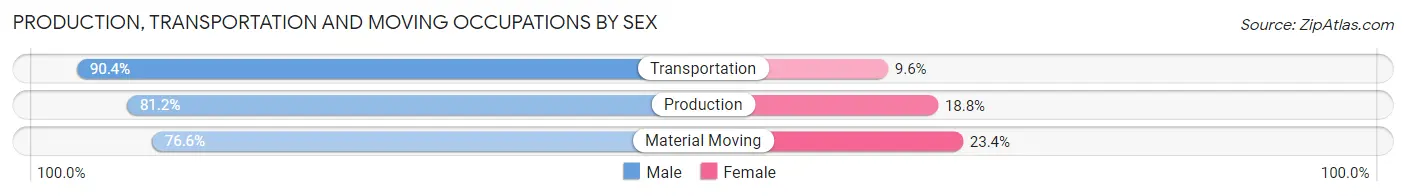
| Occupation | Male | Female |
| Production | 229 (81.2%) | 53 (18.8%) |
| Transportation | 113 (90.4%) | 12 (9.6%) |
| Material Moving | 105 (76.6%) | 32 (23.4%) |
| Total (Category) | 447 (82.2%) | 97 (17.8%) |
| Total (Overall) | 916 (56.8%) | 696 (43.2%) |
Employment Industries by Sex in Frackville borough
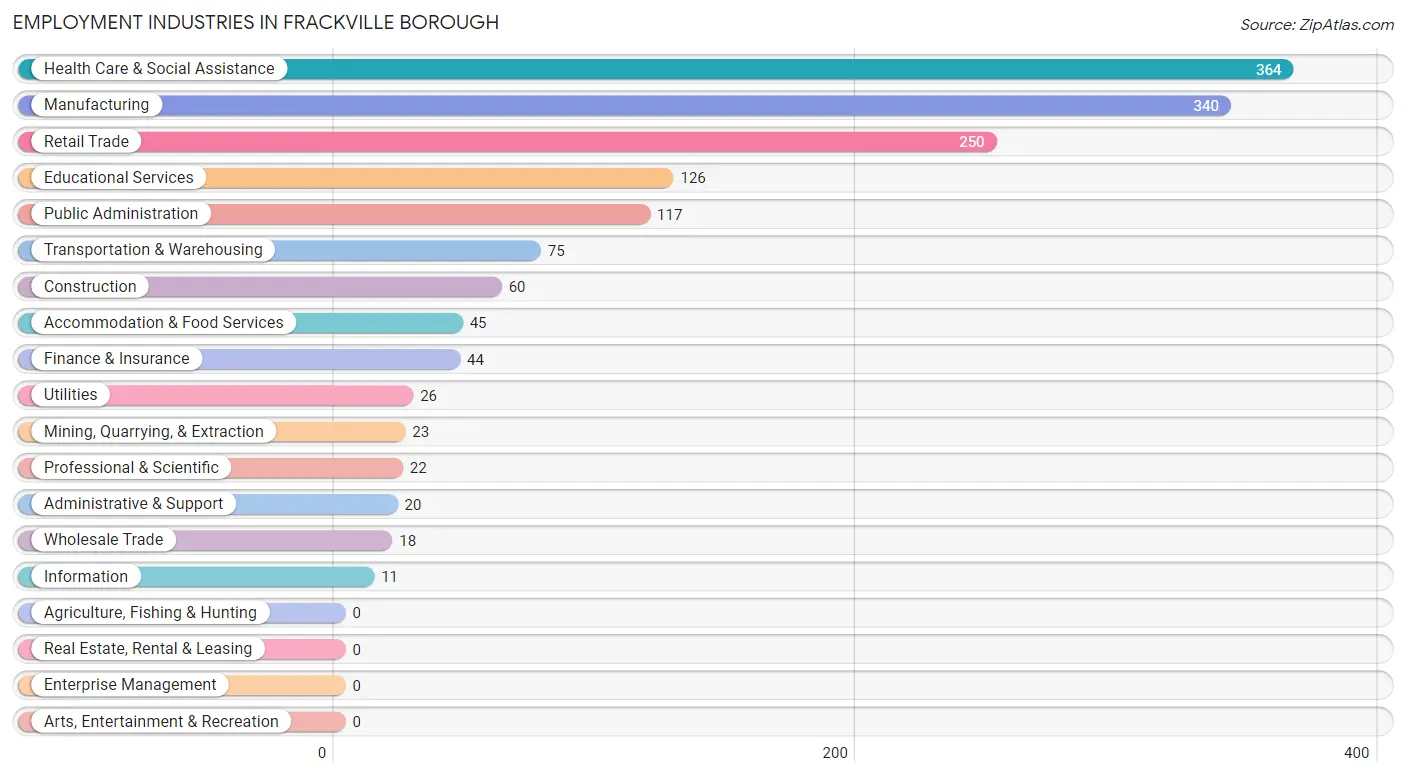
Employment Industries in Frackville borough
The major employment industries in Frackville borough include Health Care & Social Assistance (364 | 22.6%), Manufacturing (340 | 21.1%), Retail Trade (250 | 15.5%), Educational Services (126 | 7.8%), and Public Administration (117 | 7.3%).
Employment Industries by Sex in Frackville borough
The Frackville borough industries that see more men than women are Construction (100.0%), Wholesale Trade (100.0%), and Finance & Insurance (100.0%), whereas the industries that tend to have a higher number of women are Utilities (100.0%), Information (100.0%), and Accommodation & Food Services (100.0%).
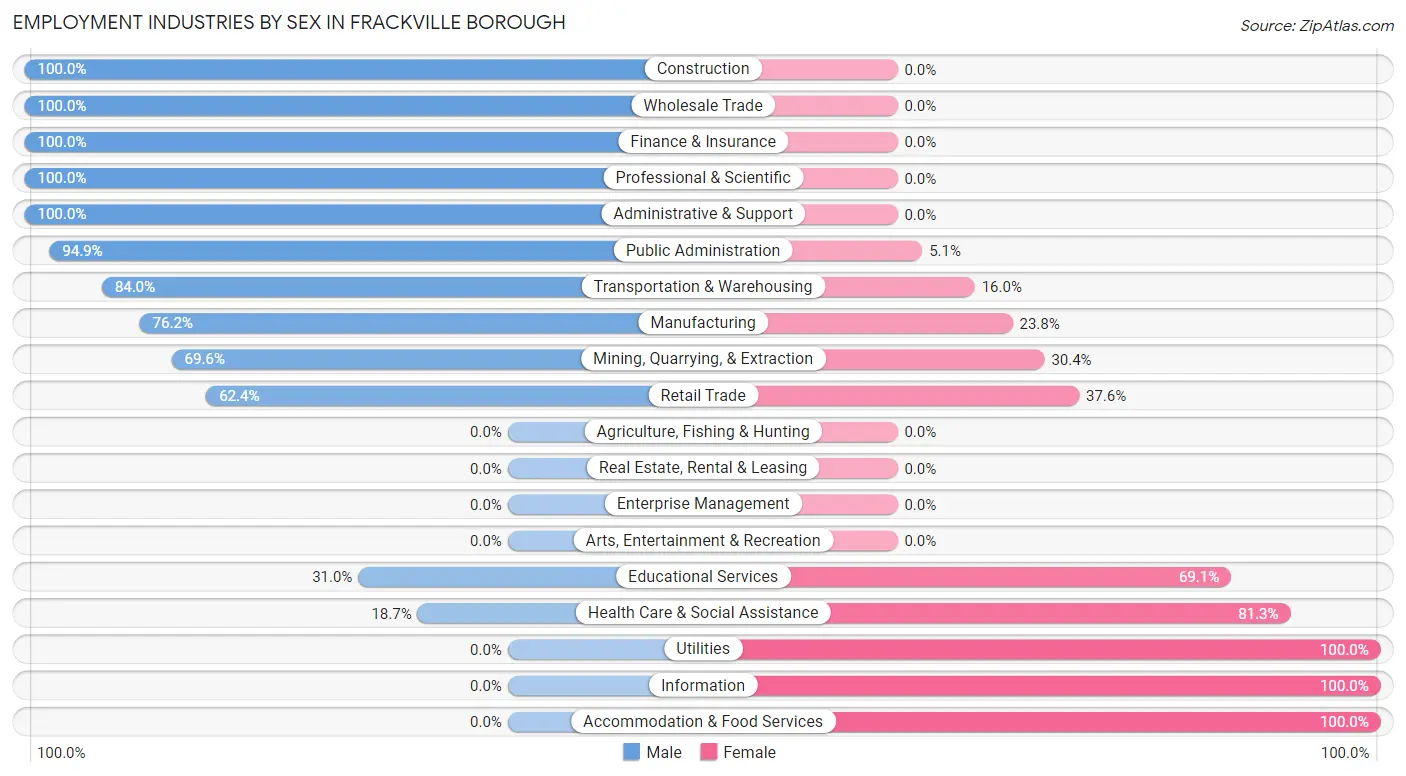
| Industry | Male | Female |
| Agriculture, Fishing & Hunting | 0 (0.0%) | 0 (0.0%) |
| Mining, Quarrying, & Extraction | 16 (69.6%) | 7 (30.4%) |
| Construction | 60 (100.0%) | 0 (0.0%) |
| Manufacturing | 259 (76.2%) | 81 (23.8%) |
| Wholesale Trade | 18 (100.0%) | 0 (0.0%) |
| Retail Trade | 156 (62.4%) | 94 (37.6%) |
| Transportation & Warehousing | 63 (84.0%) | 12 (16.0%) |
| Utilities | 0 (0.0%) | 26 (100.0%) |
| Information | 0 (0.0%) | 11 (100.0%) |
| Finance & Insurance | 44 (100.0%) | 0 (0.0%) |
| Real Estate, Rental & Leasing | 0 (0.0%) | 0 (0.0%) |
| Professional & Scientific | 22 (100.0%) | 0 (0.0%) |
| Enterprise Management | 0 (0.0%) | 0 (0.0%) |
| Administrative & Support | 20 (100.0%) | 0 (0.0%) |
| Educational Services | 39 (30.9%) | 87 (69.1%) |
| Health Care & Social Assistance | 68 (18.7%) | 296 (81.3%) |
| Arts, Entertainment & Recreation | 0 (0.0%) | 0 (0.0%) |
| Accommodation & Food Services | 0 (0.0%) | 45 (100.0%) |
| Public Administration | 111 (94.9%) | 6 (5.1%) |
| Total | 916 (56.8%) | 696 (43.2%) |
Education in Frackville borough
School Enrollment in Frackville borough
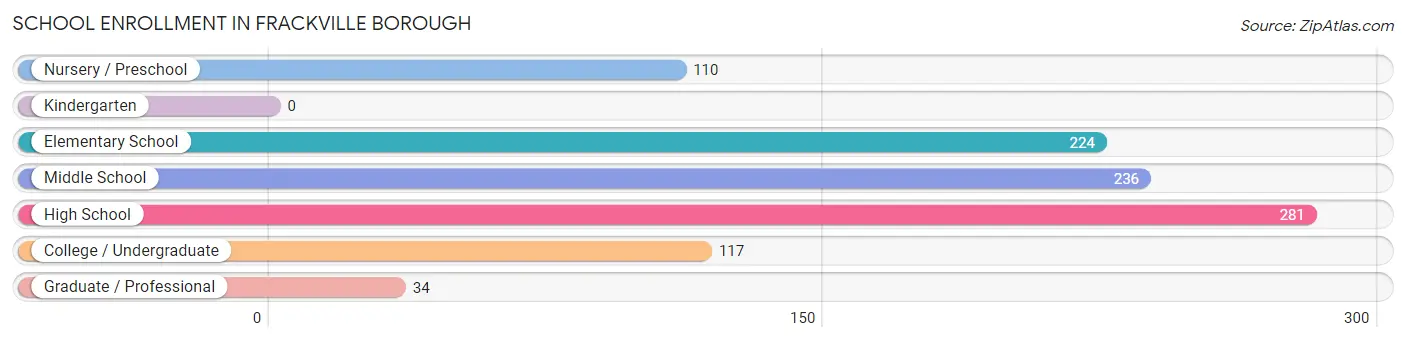
The most common levels of schooling among the 1,002 students in Frackville borough are high school (281 | 28.0%), middle school (236 | 23.5%), and elementary school (224 | 22.4%).
| School Level | # Students | % Students |
| Nursery / Preschool | 110 | 11.0% |
| Kindergarten | 0 | 0.0% |
| Elementary School | 224 | 22.4% |
| Middle School | 236 | 23.5% |
| High School | 281 | 28.0% |
| College / Undergraduate | 117 | 11.7% |
| Graduate / Professional | 34 | 3.4% |
| Total | 1,002 | 100.0% |
School Enrollment by Age by Funding Source in Frackville borough
Out of a total of 1,002 students who are enrolled in schools in Frackville borough, 103 (10.3%) attend a private institution, while the remaining 899 (89.7%) are enrolled in public schools. The age group of 35 years and over has the highest likelihood of being enrolled in private schools, with 25 (100.0% in the age bracket) enrolled. Conversely, the age group of 3 to 4 year olds has the lowest likelihood of being enrolled in a private school, with 50 (100.0% in the age bracket) attending a public institution.
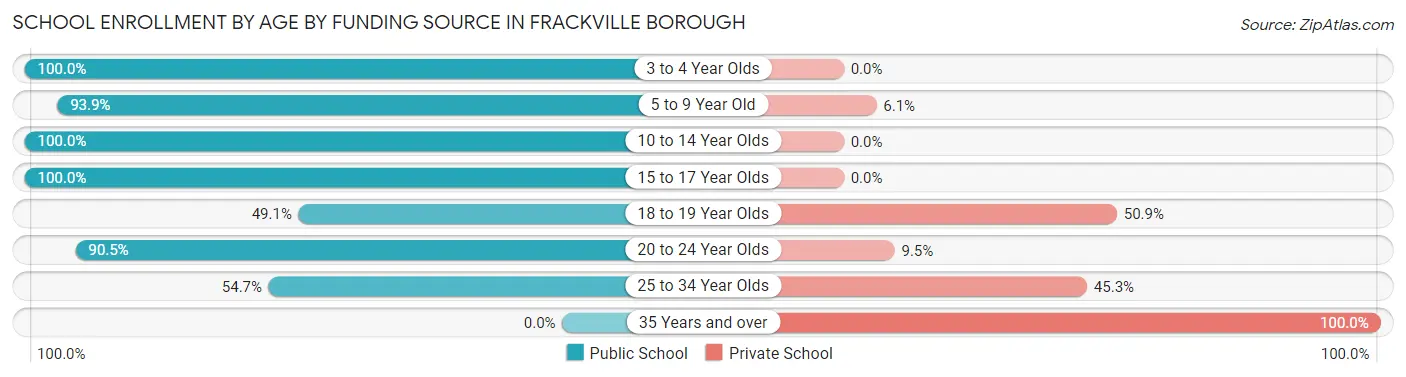
| Age Bracket | Public School | Private School |
| 3 to 4 Year Olds | 50 (100.0%) | 0 (0.0%) |
| 5 to 9 Year Old | 170 (93.9%) | 11 (6.1%) |
| 10 to 14 Year Olds | 359 (100.0%) | 0 (0.0%) |
| 15 to 17 Year Olds | 171 (100.0%) | 0 (0.0%) |
| 18 to 19 Year Olds | 28 (49.1%) | 29 (50.9%) |
| 20 to 24 Year Olds | 86 (90.5%) | 9 (9.5%) |
| 25 to 34 Year Olds | 35 (54.7%) | 29 (45.3%) |
| 35 Years and over | 0 (0.0%) | 25 (100.0%) |
| Total | 899 (89.7%) | 103 (10.3%) |
Educational Attainment by Field of Study in Frackville borough
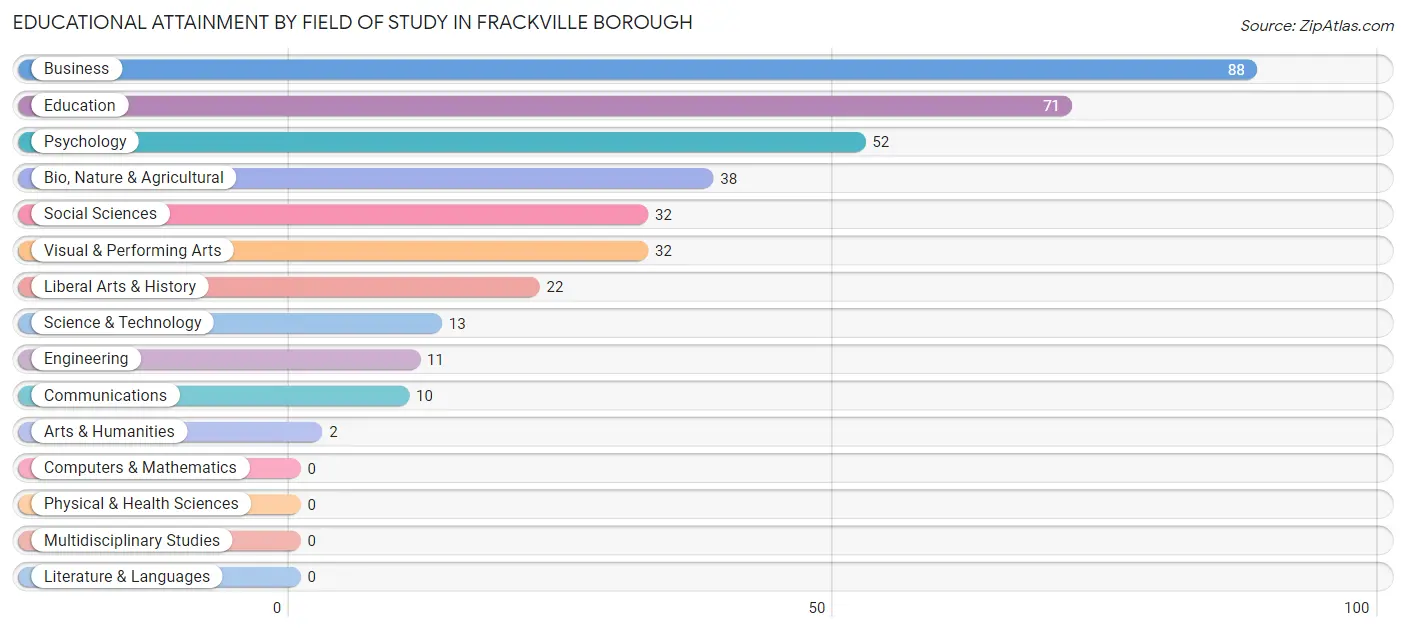
Business (88 | 23.7%), education (71 | 19.1%), psychology (52 | 14.0%), bio, nature & agricultural (38 | 10.2%), and social sciences (32 | 8.6%) are the most common fields of study among 371 individuals in Frackville borough who have obtained a bachelor's degree or higher.
| Field of Study | # Graduates | % Graduates |
| Computers & Mathematics | 0 | 0.0% |
| Bio, Nature & Agricultural | 38 | 10.2% |
| Physical & Health Sciences | 0 | 0.0% |
| Psychology | 52 | 14.0% |
| Social Sciences | 32 | 8.6% |
| Engineering | 11 | 3.0% |
| Multidisciplinary Studies | 0 | 0.0% |
| Science & Technology | 13 | 3.5% |
| Business | 88 | 23.7% |
| Education | 71 | 19.1% |
| Literature & Languages | 0 | 0.0% |
| Liberal Arts & History | 22 | 5.9% |
| Visual & Performing Arts | 32 | 8.6% |
| Communications | 10 | 2.7% |
| Arts & Humanities | 2 | 0.5% |
| Total | 371 | 100.0% |
Transportation & Commute in Frackville borough
Vehicle Availability by Sex in Frackville borough
The most prevalent vehicle ownership categories in Frackville borough are males with 2 vehicles (382, accounting for 42.6%) and females with 2 vehicles (241, making up 55.0%).
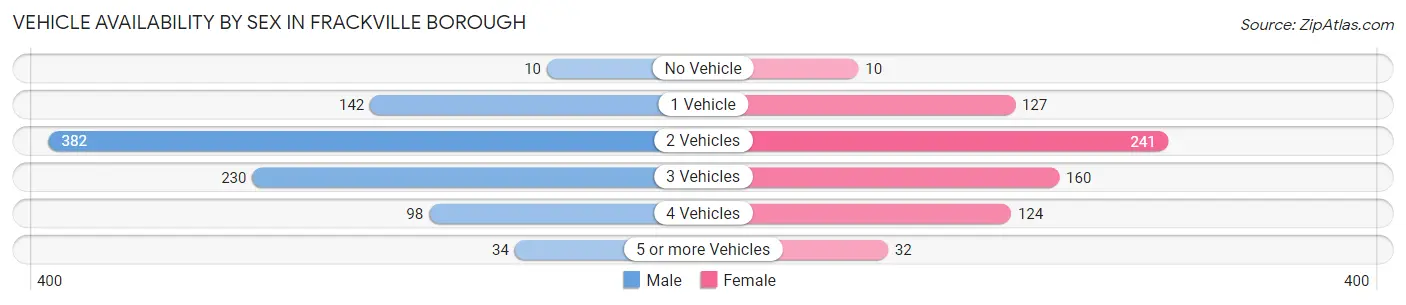
| Vehicles Available | Male | Female |
| No Vehicle | 10 (1.1%) | 10 (1.4%) |
| 1 Vehicle | 142 (15.9%) | 127 (18.3%) |
| 2 Vehicles | 382 (42.6%) | 241 (34.7%) |
| 3 Vehicles | 230 (25.7%) | 160 (23.1%) |
| 4 Vehicles | 98 (10.9%) | 124 (17.9%) |
| 5 or more Vehicles | 34 (3.8%) | 32 (4.6%) |
| Total | 896 (100.0%) | 694 (100.0%) |
Commute Time in Frackville borough
The most frequently occuring commute durations in Frackville borough are 30 to 34 minutes (323 commuters, 21.7%), 20 to 24 minutes (236 commuters, 15.9%), and 5 to 9 minutes (215 commuters, 14.4%).
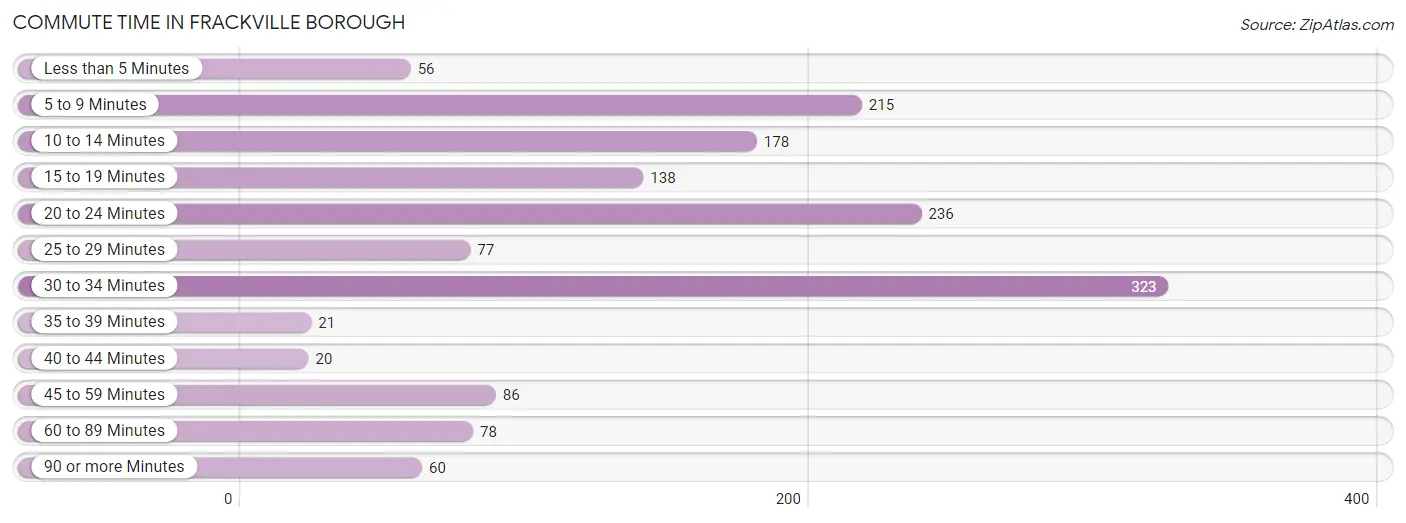
| Commute Time | # Commuters | % Commuters |
| Less than 5 Minutes | 56 | 3.8% |
| 5 to 9 Minutes | 215 | 14.4% |
| 10 to 14 Minutes | 178 | 12.0% |
| 15 to 19 Minutes | 138 | 9.3% |
| 20 to 24 Minutes | 236 | 15.9% |
| 25 to 29 Minutes | 77 | 5.2% |
| 30 to 34 Minutes | 323 | 21.7% |
| 35 to 39 Minutes | 21 | 1.4% |
| 40 to 44 Minutes | 20 | 1.3% |
| 45 to 59 Minutes | 86 | 5.8% |
| 60 to 89 Minutes | 78 | 5.2% |
| 90 or more Minutes | 60 | 4.0% |
Commute Time by Sex in Frackville borough
The most common commute times in Frackville borough are 30 to 34 minutes (216 commuters, 25.9%) for males and 10 to 14 minutes (123 commuters, 18.8%) for females.
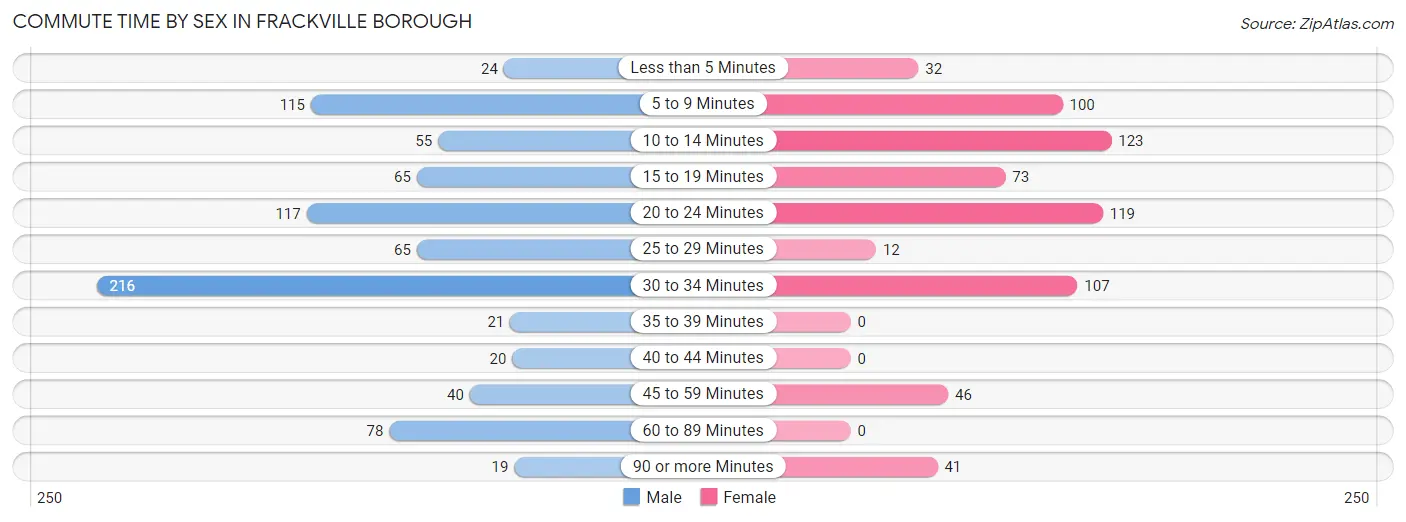
| Commute Time | Male | Female |
| Less than 5 Minutes | 24 (2.9%) | 32 (4.9%) |
| 5 to 9 Minutes | 115 (13.8%) | 100 (15.3%) |
| 10 to 14 Minutes | 55 (6.6%) | 123 (18.8%) |
| 15 to 19 Minutes | 65 (7.8%) | 73 (11.2%) |
| 20 to 24 Minutes | 117 (14.0%) | 119 (18.2%) |
| 25 to 29 Minutes | 65 (7.8%) | 12 (1.8%) |
| 30 to 34 Minutes | 216 (25.9%) | 107 (16.4%) |
| 35 to 39 Minutes | 21 (2.5%) | 0 (0.0%) |
| 40 to 44 Minutes | 20 (2.4%) | 0 (0.0%) |
| 45 to 59 Minutes | 40 (4.8%) | 46 (7.0%) |
| 60 to 89 Minutes | 78 (9.3%) | 0 (0.0%) |
| 90 or more Minutes | 19 (2.3%) | 41 (6.3%) |
Time of Departure to Work by Sex in Frackville borough
The most frequent times of departure to work in Frackville borough are 7:00 AM to 7:29 AM (132, 15.8%) for males and 7:00 AM to 7:29 AM (128, 19.6%) for females.
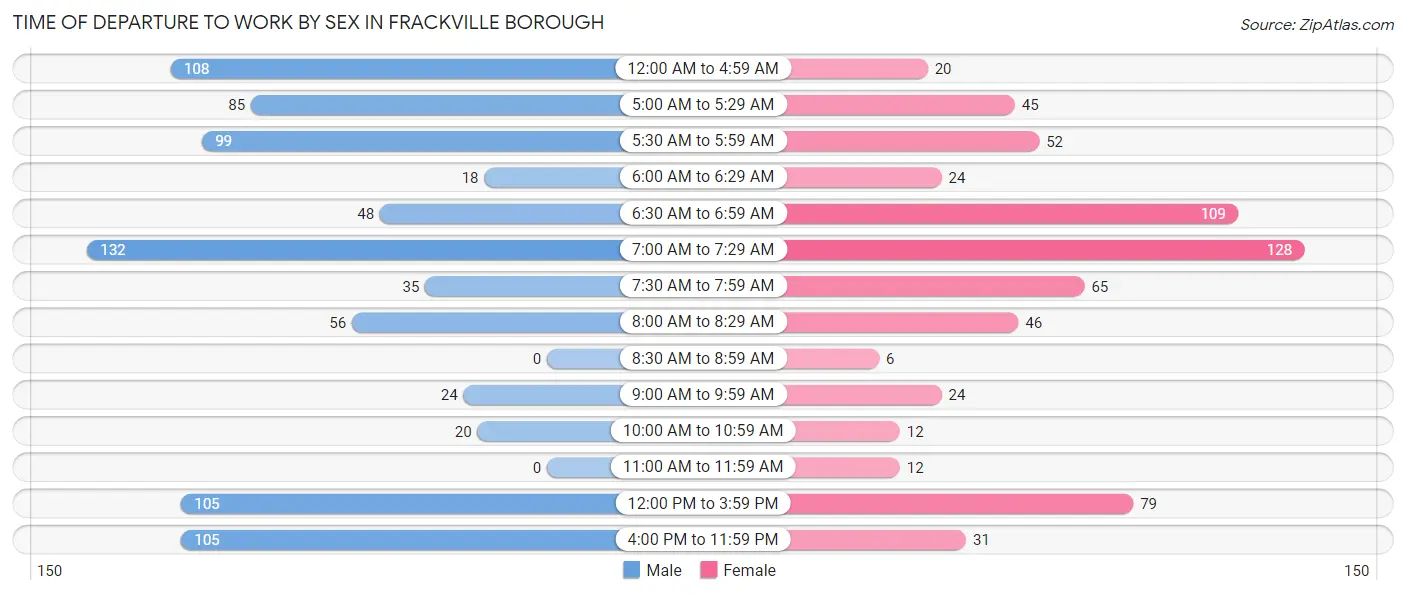
| Time of Departure | Male | Female |
| 12:00 AM to 4:59 AM | 108 (12.9%) | 20 (3.1%) |
| 5:00 AM to 5:29 AM | 85 (10.2%) | 45 (6.9%) |
| 5:30 AM to 5:59 AM | 99 (11.9%) | 52 (8.0%) |
| 6:00 AM to 6:29 AM | 18 (2.2%) | 24 (3.7%) |
| 6:30 AM to 6:59 AM | 48 (5.8%) | 109 (16.7%) |
| 7:00 AM to 7:29 AM | 132 (15.8%) | 128 (19.6%) |
| 7:30 AM to 7:59 AM | 35 (4.2%) | 65 (10.0%) |
| 8:00 AM to 8:29 AM | 56 (6.7%) | 46 (7.0%) |
| 8:30 AM to 8:59 AM | 0 (0.0%) | 6 (0.9%) |
| 9:00 AM to 9:59 AM | 24 (2.9%) | 24 (3.7%) |
| 10:00 AM to 10:59 AM | 20 (2.4%) | 12 (1.8%) |
| 11:00 AM to 11:59 AM | 0 (0.0%) | 12 (1.8%) |
| 12:00 PM to 3:59 PM | 105 (12.6%) | 79 (12.1%) |
| 4:00 PM to 11:59 PM | 105 (12.6%) | 31 (4.8%) |
| Total | 835 (100.0%) | 653 (100.0%) |
Housing Occupancy in Frackville borough
Occupancy by Ownership in Frackville borough
Of the total 1,408 dwellings in Frackville borough, owner-occupied units account for 1,109 (78.8%), while renter-occupied units make up 299 (21.2%).
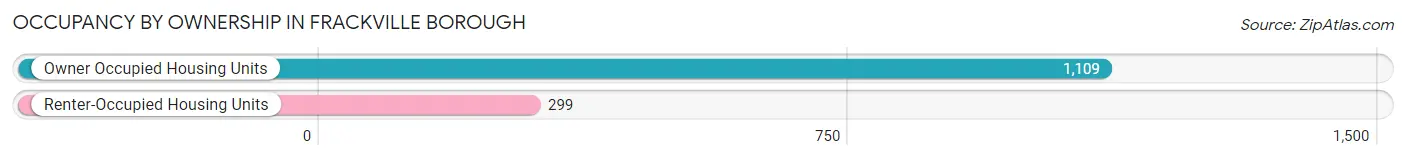
| Occupancy | # Housing Units | % Housing Units |
| Owner Occupied Housing Units | 1,109 | 78.8% |
| Renter-Occupied Housing Units | 299 | 21.2% |
| Total Occupied Housing Units | 1,408 | 100.0% |
Occupancy by Household Size in Frackville borough
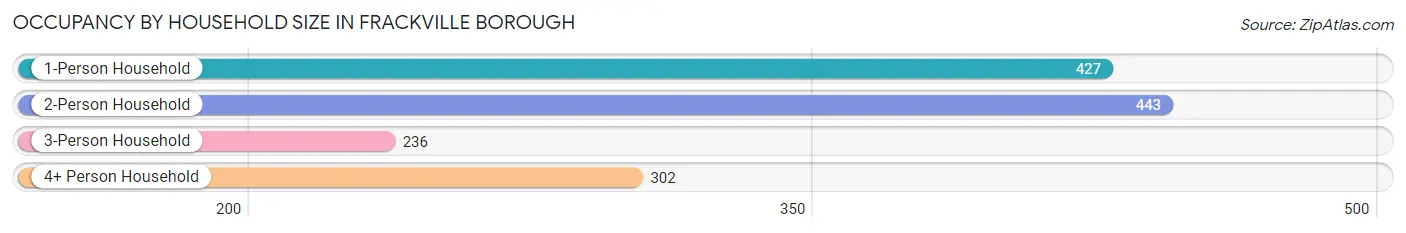
| Household Size | # Housing Units | % Housing Units |
| 1-Person Household | 427 | 30.3% |
| 2-Person Household | 443 | 31.5% |
| 3-Person Household | 236 | 16.8% |
| 4+ Person Household | 302 | 21.4% |
| Total Housing Units | 1,408 | 100.0% |
Occupancy by Ownership by Household Size in Frackville borough
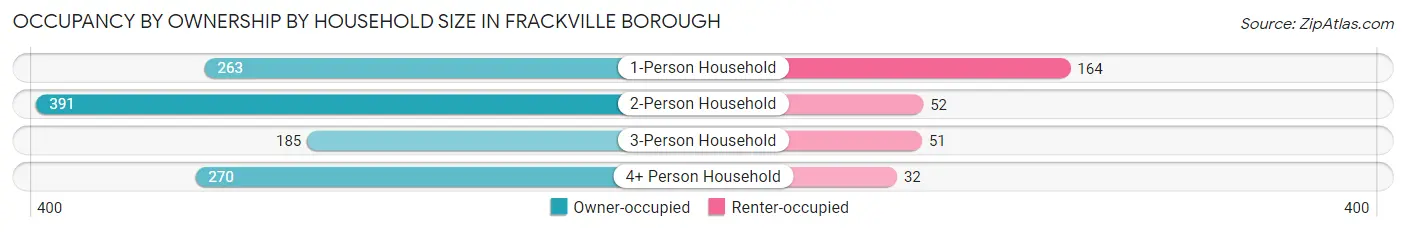
| Household Size | Owner-occupied | Renter-occupied |
| 1-Person Household | 263 (61.6%) | 164 (38.4%) |
| 2-Person Household | 391 (88.3%) | 52 (11.7%) |
| 3-Person Household | 185 (78.4%) | 51 (21.6%) |
| 4+ Person Household | 270 (89.4%) | 32 (10.6%) |
| Total Housing Units | 1,109 (78.8%) | 299 (21.2%) |
Occupancy by Educational Attainment in Frackville borough
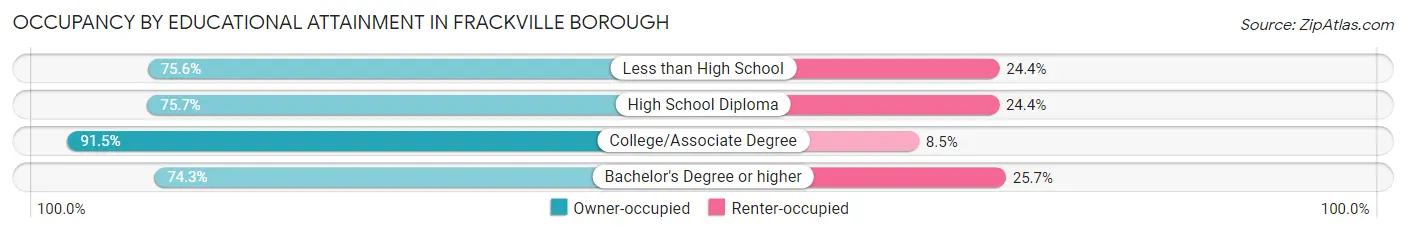
| Household Size | Owner-occupied | Renter-occupied |
| Less than High School | 65 (75.6%) | 21 (24.4%) |
| High School Diploma | 615 (75.6%) | 198 (24.3%) |
| College/Associate Degree | 270 (91.5%) | 25 (8.5%) |
| Bachelor's Degree or higher | 159 (74.3%) | 55 (25.7%) |
Occupancy by Age of Householder in Frackville borough
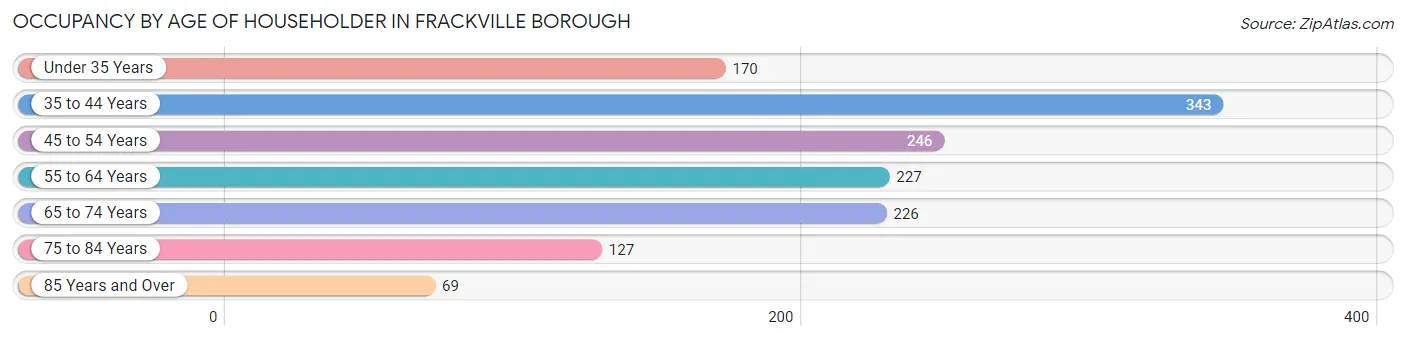
| Age Bracket | # Households | % Households |
| Under 35 Years | 170 | 12.1% |
| 35 to 44 Years | 343 | 24.4% |
| 45 to 54 Years | 246 | 17.5% |
| 55 to 64 Years | 227 | 16.1% |
| 65 to 74 Years | 226 | 16.1% |
| 75 to 84 Years | 127 | 9.0% |
| 85 Years and Over | 69 | 4.9% |
| Total | 1,408 | 100.0% |
Housing Finances in Frackville borough
Median Income by Occupancy in Frackville borough
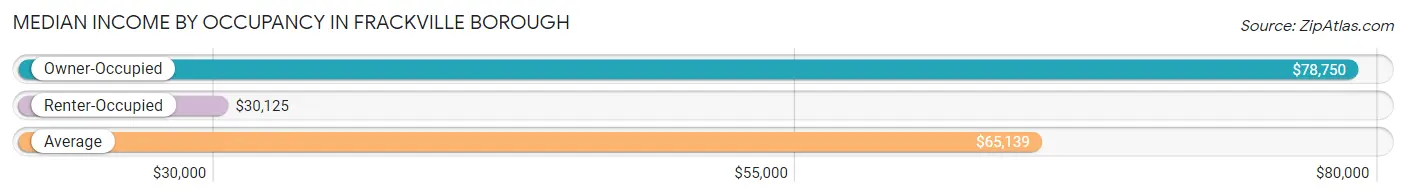
| Occupancy Type | # Households | Median Income |
| Owner-Occupied | 1,109 (78.8%) | $78,750 |
| Renter-Occupied | 299 (21.2%) | $30,125 |
| Average | 1,408 (100.0%) | $65,139 |
Occupancy by Householder Income Bracket in Frackville borough
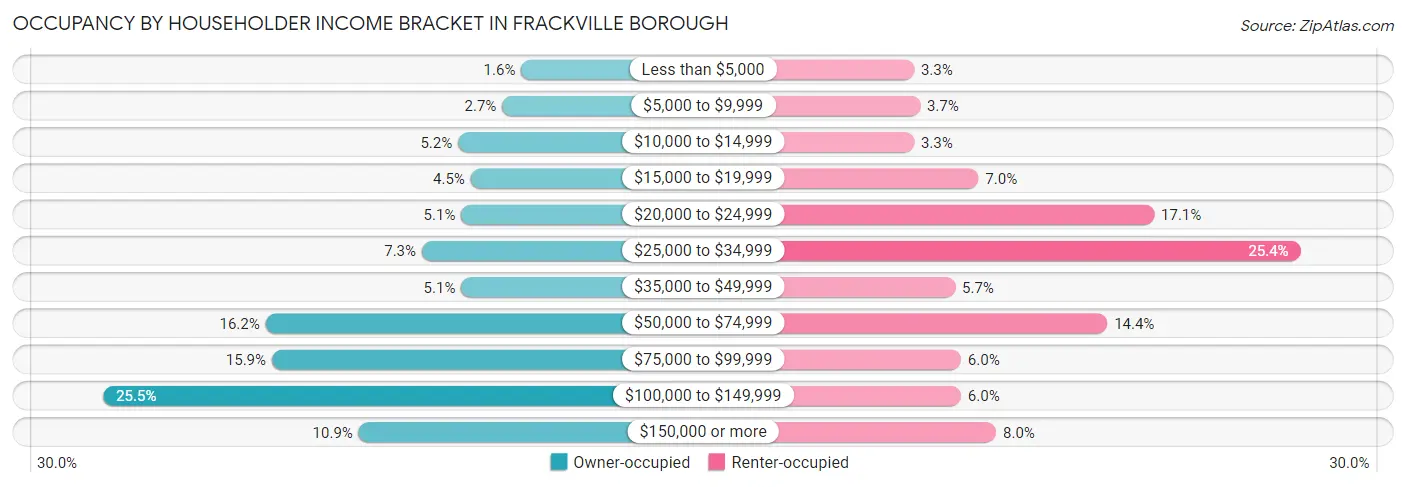
| Income Bracket | Owner-occupied | Renter-occupied |
| Less than $5,000 | 18 (1.6%) | 10 (3.3%) |
| $5,000 to $9,999 | 30 (2.7%) | 11 (3.7%) |
| $10,000 to $14,999 | 58 (5.2%) | 10 (3.3%) |
| $15,000 to $19,999 | 50 (4.5%) | 21 (7.0%) |
| $20,000 to $24,999 | 56 (5.1%) | 51 (17.1%) |
| $25,000 to $34,999 | 81 (7.3%) | 76 (25.4%) |
| $35,000 to $49,999 | 56 (5.1%) | 17 (5.7%) |
| $50,000 to $74,999 | 180 (16.2%) | 43 (14.4%) |
| $75,000 to $99,999 | 176 (15.9%) | 18 (6.0%) |
| $100,000 to $149,999 | 283 (25.5%) | 18 (6.0%) |
| $150,000 or more | 121 (10.9%) | 24 (8.0%) |
| Total | 1,109 (100.0%) | 299 (100.0%) |
Monthly Housing Cost Tiers in Frackville borough
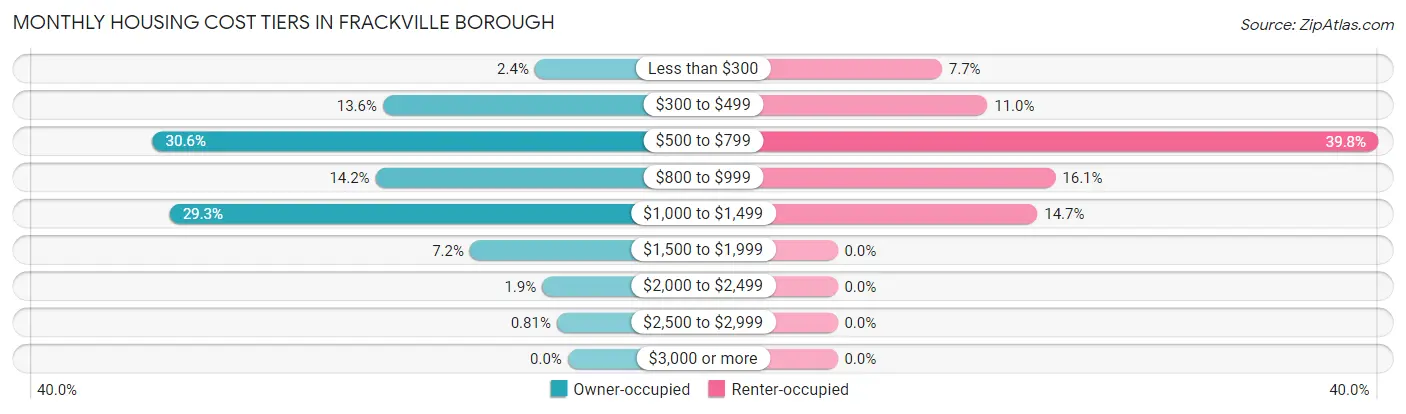
| Monthly Cost | Owner-occupied | Renter-occupied |
| Less than $300 | 27 (2.4%) | 23 (7.7%) |
| $300 to $499 | 151 (13.6%) | 33 (11.0%) |
| $500 to $799 | 339 (30.6%) | 119 (39.8%) |
| $800 to $999 | 157 (14.2%) | 48 (16.1%) |
| $1,000 to $1,499 | 325 (29.3%) | 44 (14.7%) |
| $1,500 to $1,999 | 80 (7.2%) | 0 (0.0%) |
| $2,000 to $2,499 | 21 (1.9%) | 0 (0.0%) |
| $2,500 to $2,999 | 9 (0.8%) | 0 (0.0%) |
| $3,000 or more | 0 (0.0%) | 0 (0.0%) |
| Total | 1,109 (100.0%) | 299 (100.0%) |
Physical Housing Characteristics in Frackville borough
Housing Structures in Frackville borough
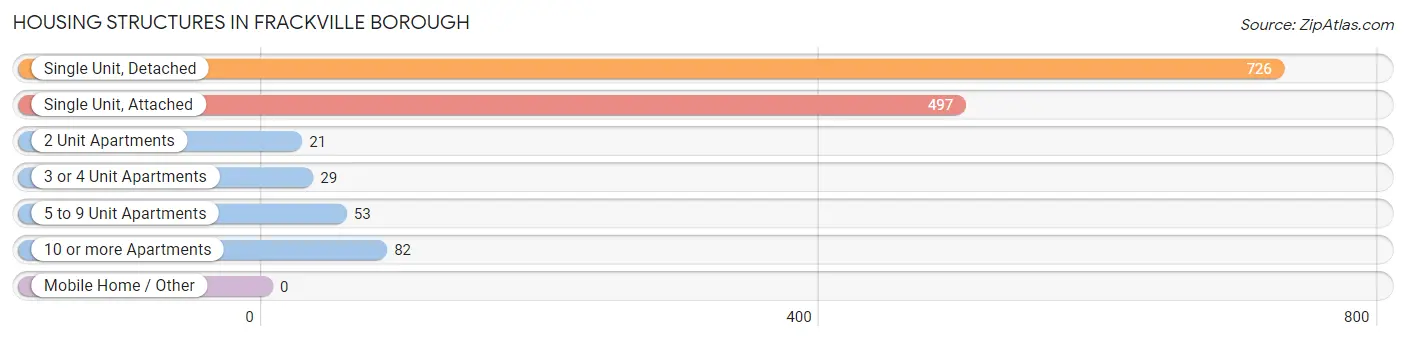
| Structure Type | # Housing Units | % Housing Units |
| Single Unit, Detached | 726 | 51.6% |
| Single Unit, Attached | 497 | 35.3% |
| 2 Unit Apartments | 21 | 1.5% |
| 3 or 4 Unit Apartments | 29 | 2.1% |
| 5 to 9 Unit Apartments | 53 | 3.8% |
| 10 or more Apartments | 82 | 5.8% |
| Mobile Home / Other | 0 | 0.0% |
| Total | 1,408 | 100.0% |
Housing Structures by Occupancy in Frackville borough
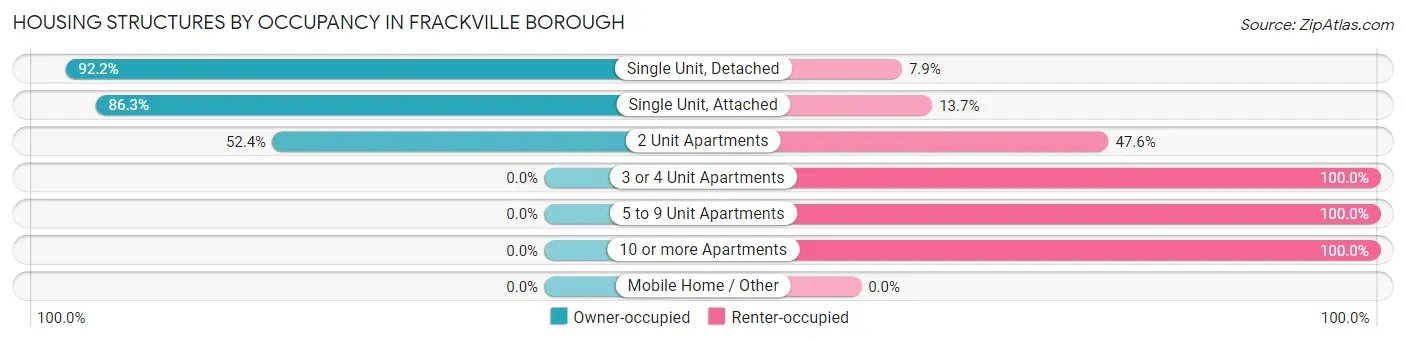
| Structure Type | Owner-occupied | Renter-occupied |
| Single Unit, Detached | 669 (92.1%) | 57 (7.9%) |
| Single Unit, Attached | 429 (86.3%) | 68 (13.7%) |
| 2 Unit Apartments | 11 (52.4%) | 10 (47.6%) |
| 3 or 4 Unit Apartments | 0 (0.0%) | 29 (100.0%) |
| 5 to 9 Unit Apartments | 0 (0.0%) | 53 (100.0%) |
| 10 or more Apartments | 0 (0.0%) | 82 (100.0%) |
| Mobile Home / Other | 0 (0.0%) | 0 (0.0%) |
| Total | 1,109 (78.8%) | 299 (21.2%) |
Housing Structures by Number of Rooms in Frackville borough
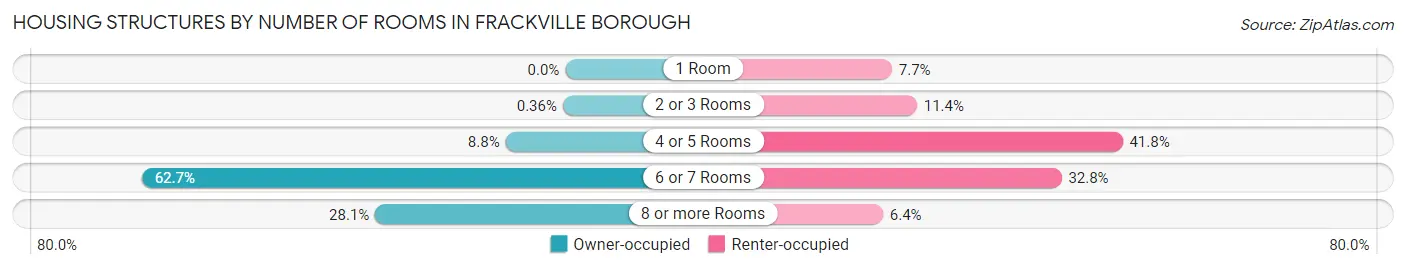
| Number of Rooms | Owner-occupied | Renter-occupied |
| 1 Room | 0 (0.0%) | 23 (7.7%) |
| 2 or 3 Rooms | 4 (0.4%) | 34 (11.4%) |
| 4 or 5 Rooms | 98 (8.8%) | 125 (41.8%) |
| 6 or 7 Rooms | 695 (62.7%) | 98 (32.8%) |
| 8 or more Rooms | 312 (28.1%) | 19 (6.4%) |
| Total | 1,109 (100.0%) | 299 (100.0%) |
Housing Structure by Heating Type in Frackville borough
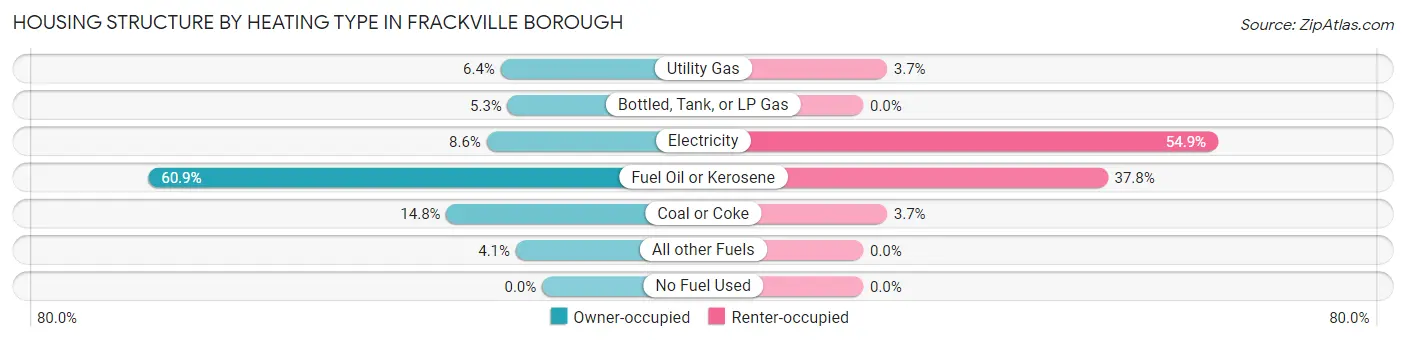
| Heating Type | Owner-occupied | Renter-occupied |
| Utility Gas | 71 (6.4%) | 11 (3.7%) |
| Bottled, Tank, or LP Gas | 59 (5.3%) | 0 (0.0%) |
| Electricity | 95 (8.6%) | 164 (54.8%) |
| Fuel Oil or Kerosene | 675 (60.9%) | 113 (37.8%) |
| Coal or Coke | 164 (14.8%) | 11 (3.7%) |
| All other Fuels | 45 (4.1%) | 0 (0.0%) |
| No Fuel Used | 0 (0.0%) | 0 (0.0%) |
| Total | 1,109 (100.0%) | 299 (100.0%) |
Household Vehicle Usage in Frackville borough
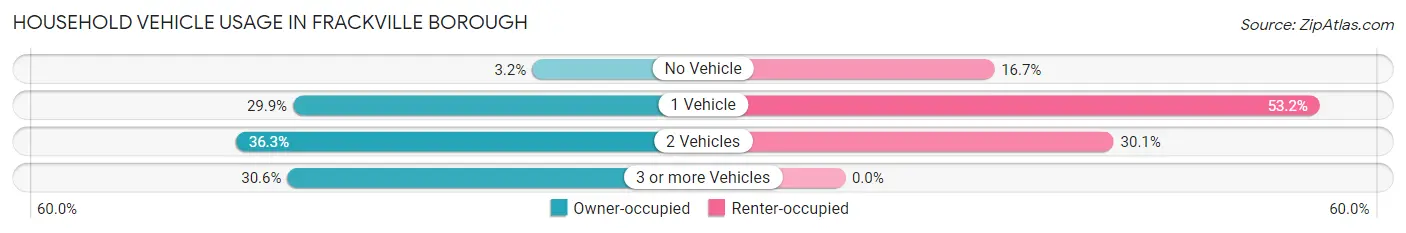
| Vehicles per Household | Owner-occupied | Renter-occupied |
| No Vehicle | 35 (3.2%) | 50 (16.7%) |
| 1 Vehicle | 332 (29.9%) | 159 (53.2%) |
| 2 Vehicles | 403 (36.3%) | 90 (30.1%) |
| 3 or more Vehicles | 339 (30.6%) | 0 (0.0%) |
| Total | 1,109 (100.0%) | 299 (100.0%) |
Real Estate & Mortgages in Frackville borough
Real Estate and Mortgage Overview in Frackville borough
| Characteristic | Without Mortgage | With Mortgage |
| Housing Units | 425 | 684 |
| Median Property Value | $80,400 | $107,300 |
| Median Household Income | $55,078 | $91 |
| Monthly Housing Costs | $571 | $0 |
| Real Estate Taxes | $1,775 | $0 |
Property Value by Mortgage Status in Frackville borough
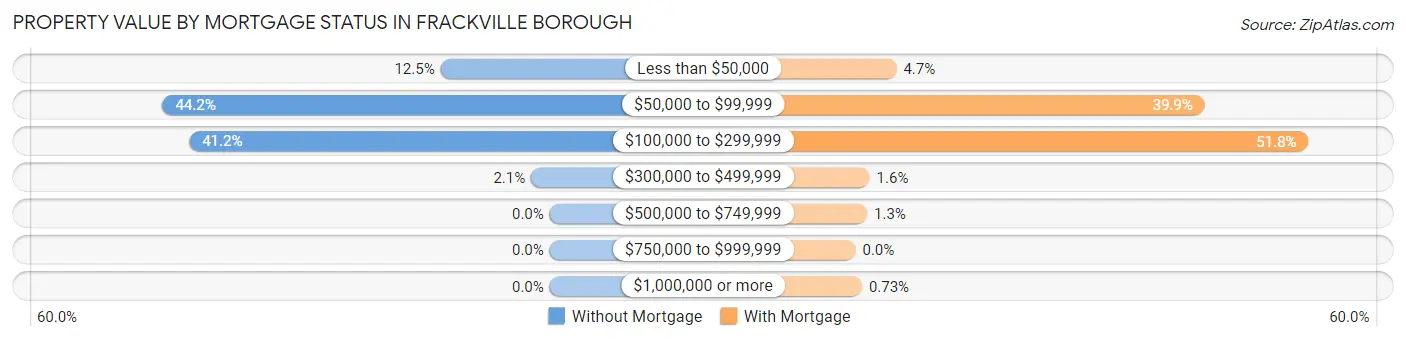
| Property Value | Without Mortgage | With Mortgage |
| Less than $50,000 | 53 (12.5%) | 32 (4.7%) |
| $50,000 to $99,999 | 188 (44.2%) | 273 (39.9%) |
| $100,000 to $299,999 | 175 (41.2%) | 354 (51.7%) |
| $300,000 to $499,999 | 9 (2.1%) | 11 (1.6%) |
| $500,000 to $749,999 | 0 (0.0%) | 9 (1.3%) |
| $750,000 to $999,999 | 0 (0.0%) | 0 (0.0%) |
| $1,000,000 or more | 0 (0.0%) | 5 (0.7%) |
| Total | 425 (100.0%) | 684 (100.0%) |
Household Income by Mortgage Status in Frackville borough
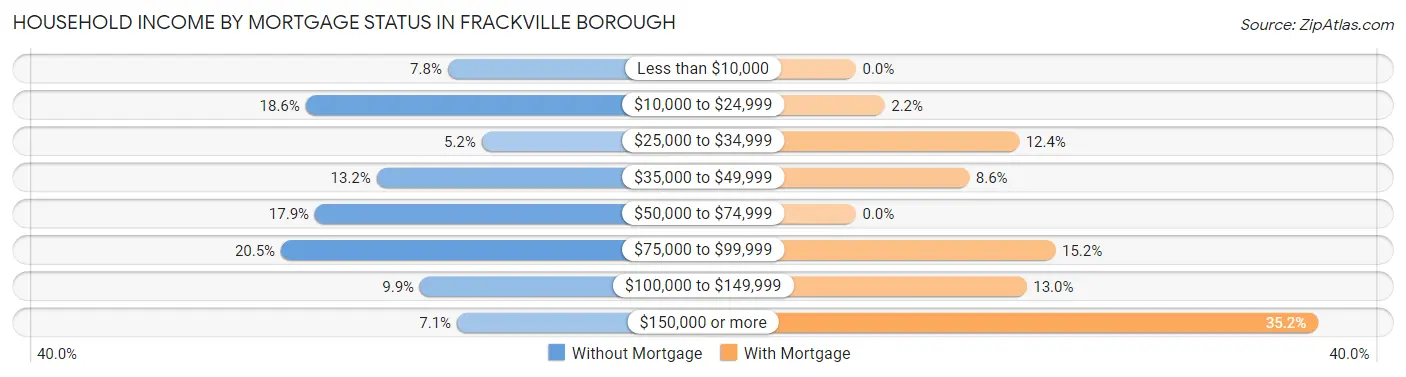
| Household Income | Without Mortgage | With Mortgage |
| Less than $10,000 | 33 (7.8%) | 0 (0.0%) |
| $10,000 to $24,999 | 79 (18.6%) | 15 (2.2%) |
| $25,000 to $34,999 | 22 (5.2%) | 85 (12.4%) |
| $35,000 to $49,999 | 56 (13.2%) | 59 (8.6%) |
| $50,000 to $74,999 | 76 (17.9%) | 0 (0.0%) |
| $75,000 to $99,999 | 87 (20.5%) | 104 (15.2%) |
| $100,000 to $149,999 | 42 (9.9%) | 89 (13.0%) |
| $150,000 or more | 30 (7.1%) | 241 (35.2%) |
| Total | 425 (100.0%) | 684 (100.0%) |
Property Value to Household Income Ratio in Frackville borough
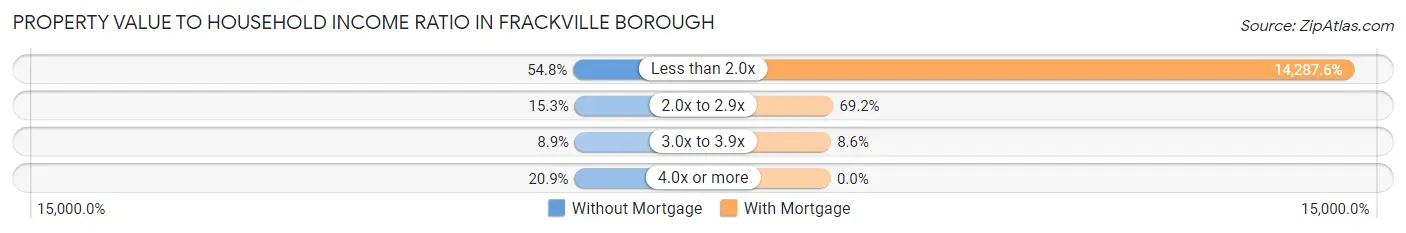
| Value-to-Income Ratio | Without Mortgage | With Mortgage |
| Less than 2.0x | 233 (54.8%) | 97,727 (14,287.6%) |
| 2.0x to 2.9x | 65 (15.3%) | 473 (69.2%) |
| 3.0x to 3.9x | 38 (8.9%) | 59 (8.6%) |
| 4.0x or more | 89 (20.9%) | 0 (0.0%) |
| Total | 425 (100.0%) | 684 (100.0%) |
Real Estate Taxes by Mortgage Status in Frackville borough
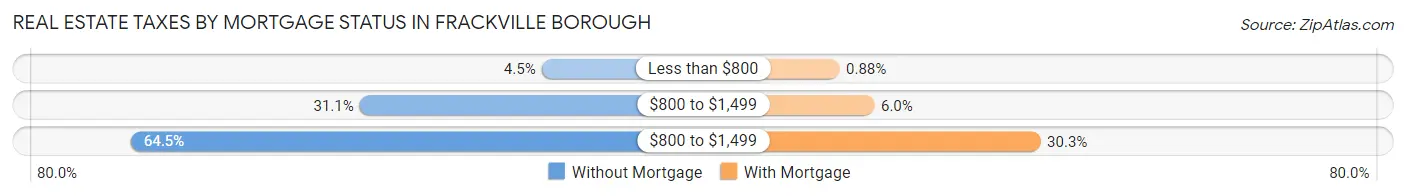
| Property Taxes | Without Mortgage | With Mortgage |
| Less than $800 | 19 (4.5%) | 6 (0.9%) |
| $800 to $1,499 | 132 (31.1%) | 41 (6.0%) |
| $800 to $1,499 | 274 (64.5%) | 207 (30.3%) |
| Total | 425 (100.0%) | 684 (100.0%) |
Health & Disability in Frackville borough
Health Insurance Coverage by Age in Frackville borough
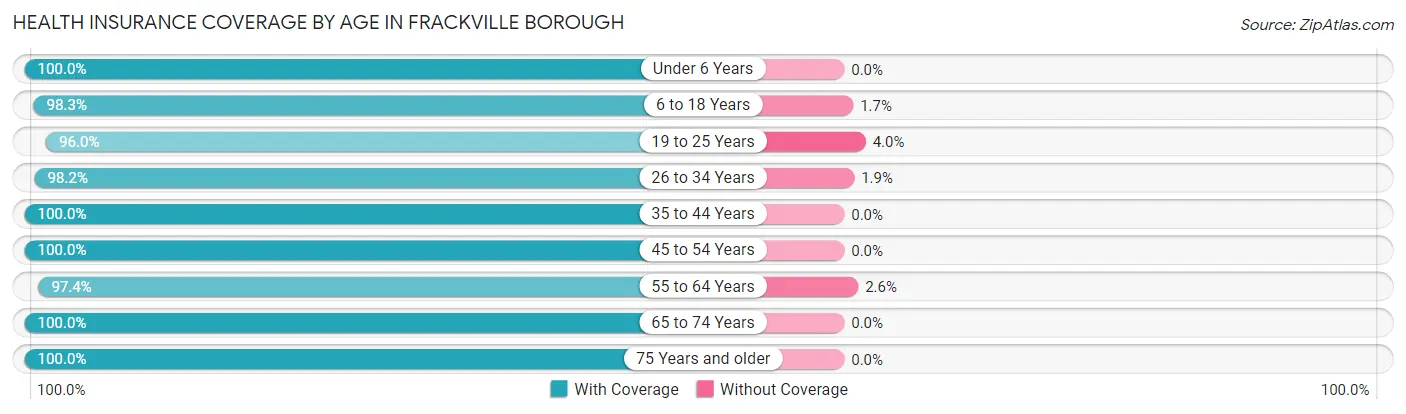
| Age Bracket | With Coverage | Without Coverage |
| Under 6 Years | 275 (100.0%) | 0 (0.0%) |
| 6 to 18 Years | 708 (98.3%) | 12 (1.7%) |
| 19 to 25 Years | 216 (96.0%) | 9 (4.0%) |
| 26 to 34 Years | 371 (98.2%) | 7 (1.8%) |
| 35 to 44 Years | 636 (100.0%) | 0 (0.0%) |
| 45 to 54 Years | 480 (100.0%) | 0 (0.0%) |
| 55 to 64 Years | 413 (97.4%) | 11 (2.6%) |
| 65 to 74 Years | 347 (100.0%) | 0 (0.0%) |
| 75 Years and older | 263 (100.0%) | 0 (0.0%) |
| Total | 3,709 (99.0%) | 39 (1.0%) |
Health Insurance Coverage by Citizenship Status in Frackville borough
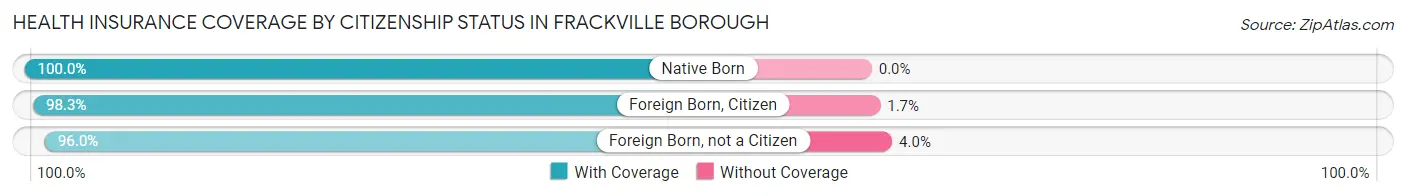
| Citizenship Status | With Coverage | Without Coverage |
| Native Born | 275 (100.0%) | 0 (0.0%) |
| Foreign Born, Citizen | 708 (98.3%) | 12 (1.7%) |
| Foreign Born, not a Citizen | 216 (96.0%) | 9 (4.0%) |
Health Insurance Coverage by Household Income in Frackville borough
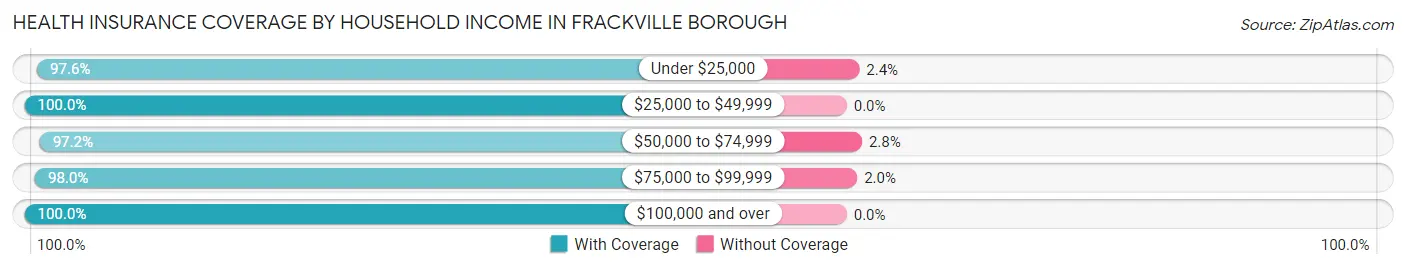
| Household Income | With Coverage | Without Coverage |
| Under $25,000 | 413 (97.6%) | 10 (2.4%) |
| $25,000 to $49,999 | 441 (100.0%) | 0 (0.0%) |
| $50,000 to $74,999 | 547 (97.2%) | 16 (2.8%) |
| $75,000 to $99,999 | 601 (98.0%) | 12 (2.0%) |
| $100,000 and over | 1,701 (100.0%) | 0 (0.0%) |
Public vs Private Health Insurance Coverage by Age in Frackville borough
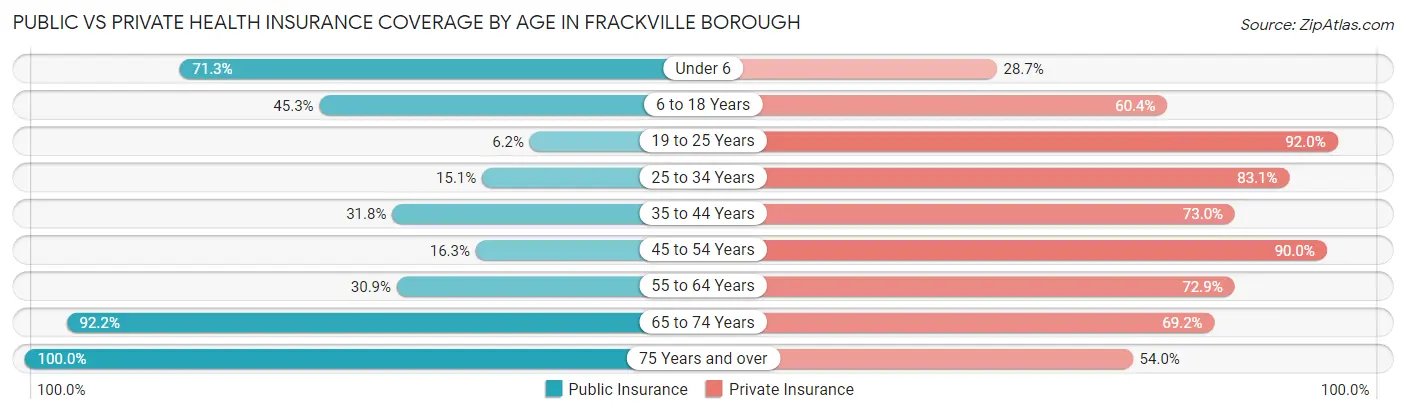
| Age Bracket | Public Insurance | Private Insurance |
| Under 6 | 196 (71.3%) | 79 (28.7%) |
| 6 to 18 Years | 326 (45.3%) | 435 (60.4%) |
| 19 to 25 Years | 14 (6.2%) | 207 (92.0%) |
| 25 to 34 Years | 57 (15.1%) | 314 (83.1%) |
| 35 to 44 Years | 202 (31.8%) | 464 (73.0%) |
| 45 to 54 Years | 78 (16.3%) | 432 (90.0%) |
| 55 to 64 Years | 131 (30.9%) | 309 (72.9%) |
| 65 to 74 Years | 320 (92.2%) | 240 (69.2%) |
| 75 Years and over | 263 (100.0%) | 142 (54.0%) |
| Total | 1,587 (42.3%) | 2,622 (70.0%) |
Disability Status by Sex by Age in Frackville borough
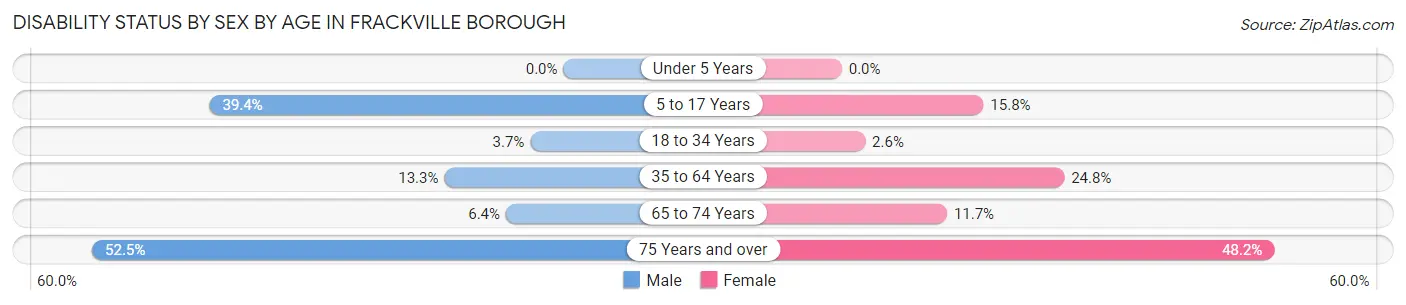
| Age Bracket | Male | Female |
| Under 5 Years | 0 (0.0%) | 0 (0.0%) |
| 5 to 17 Years | 160 (39.4%) | 50 (15.8%) |
| 18 to 34 Years | 13 (3.7%) | 8 (2.6%) |
| 35 to 64 Years | 102 (13.3%) | 191 (24.8%) |
| 65 to 74 Years | 8 (6.4%) | 26 (11.7%) |
| 75 Years and over | 53 (52.5%) | 78 (48.1%) |
Disability Class by Sex by Age in Frackville borough
Disability Class: Hearing Difficulty
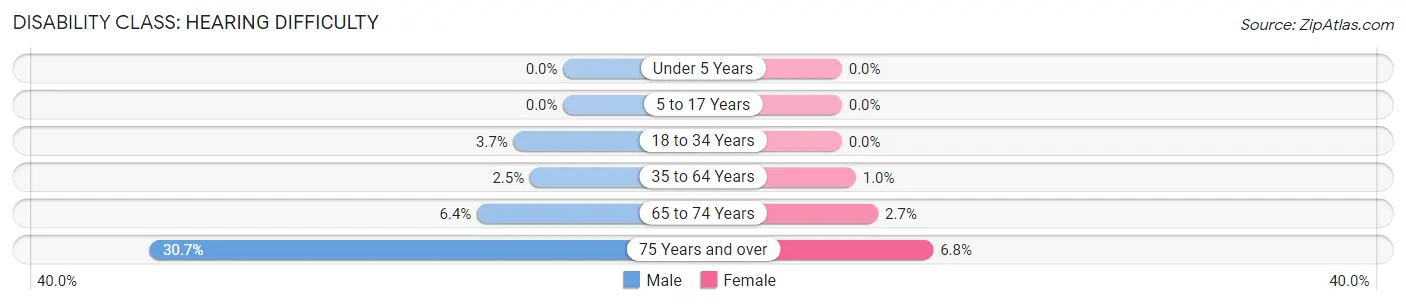
| Age Bracket | Male | Female |
| Under 5 Years | 0 (0.0%) | 0 (0.0%) |
| 5 to 17 Years | 0 (0.0%) | 0 (0.0%) |
| 18 to 34 Years | 13 (3.7%) | 0 (0.0%) |
| 35 to 64 Years | 19 (2.5%) | 8 (1.0%) |
| 65 to 74 Years | 8 (6.4%) | 6 (2.7%) |
| 75 Years and over | 31 (30.7%) | 11 (6.8%) |
Disability Class: Vision Difficulty
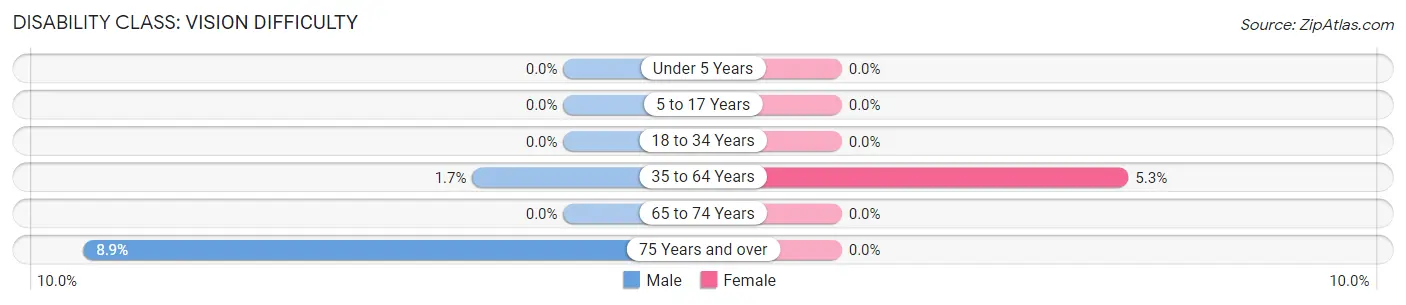
| Age Bracket | Male | Female |
| Under 5 Years | 0 (0.0%) | 0 (0.0%) |
| 5 to 17 Years | 0 (0.0%) | 0 (0.0%) |
| 18 to 34 Years | 0 (0.0%) | 0 (0.0%) |
| 35 to 64 Years | 13 (1.7%) | 41 (5.3%) |
| 65 to 74 Years | 0 (0.0%) | 0 (0.0%) |
| 75 Years and over | 9 (8.9%) | 0 (0.0%) |
Disability Class: Cognitive Difficulty
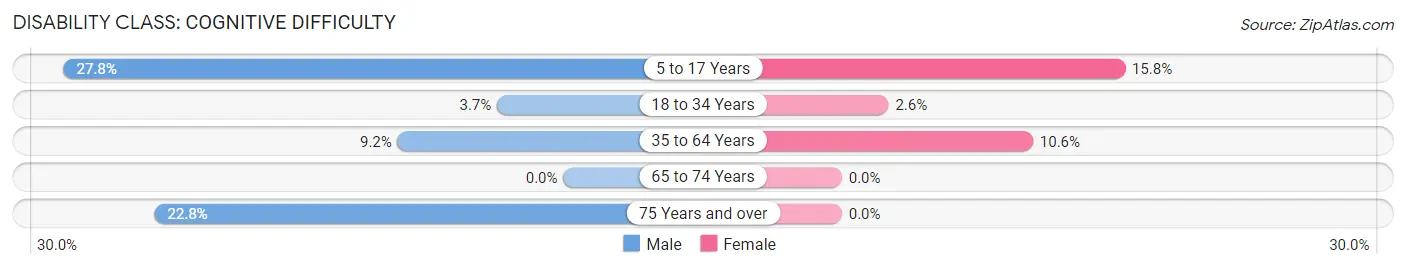
| Age Bracket | Male | Female |
| 5 to 17 Years | 113 (27.8%) | 50 (15.8%) |
| 18 to 34 Years | 13 (3.7%) | 8 (2.6%) |
| 35 to 64 Years | 71 (9.2%) | 82 (10.6%) |
| 65 to 74 Years | 0 (0.0%) | 0 (0.0%) |
| 75 Years and over | 23 (22.8%) | 0 (0.0%) |
Disability Class: Ambulatory Difficulty
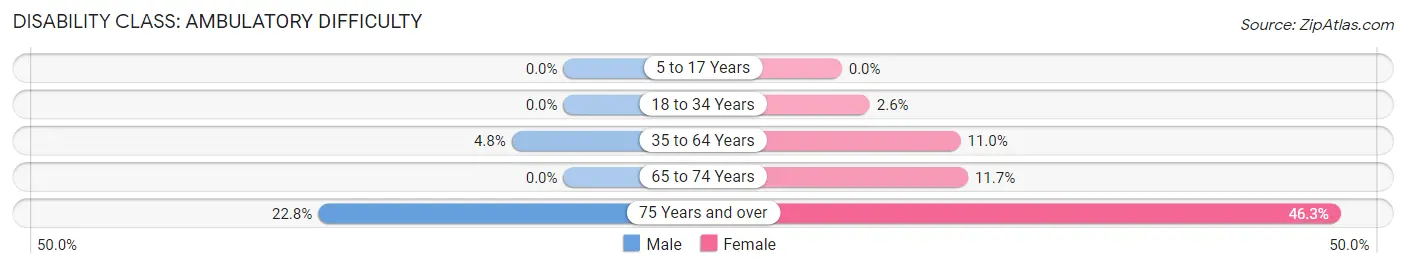
| Age Bracket | Male | Female |
| 5 to 17 Years | 0 (0.0%) | 0 (0.0%) |
| 18 to 34 Years | 0 (0.0%) | 8 (2.6%) |
| 35 to 64 Years | 37 (4.8%) | 85 (11.0%) |
| 65 to 74 Years | 0 (0.0%) | 26 (11.7%) |
| 75 Years and over | 23 (22.8%) | 75 (46.3%) |
Disability Class: Self-Care Difficulty
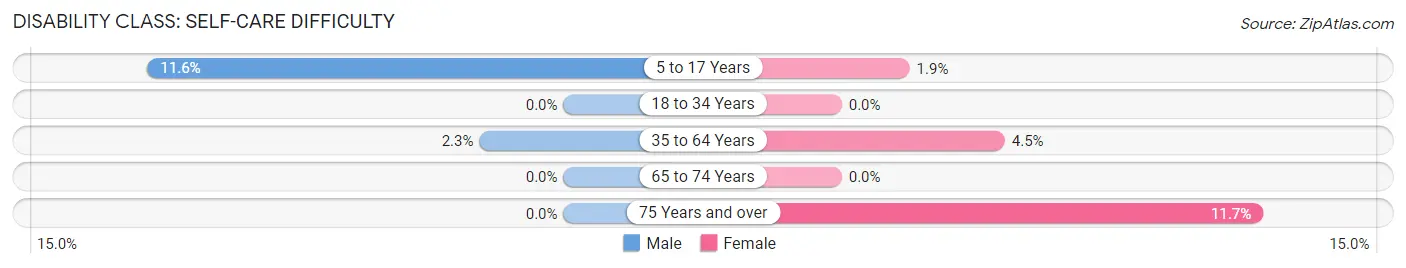
| Age Bracket | Male | Female |
| 5 to 17 Years | 47 (11.6%) | 6 (1.9%) |
| 18 to 34 Years | 0 (0.0%) | 0 (0.0%) |
| 35 to 64 Years | 18 (2.3%) | 35 (4.5%) |
| 65 to 74 Years | 0 (0.0%) | 0 (0.0%) |
| 75 Years and over | 0 (0.0%) | 19 (11.7%) |
Technology Access in Frackville borough
Computing Device Access in Frackville borough
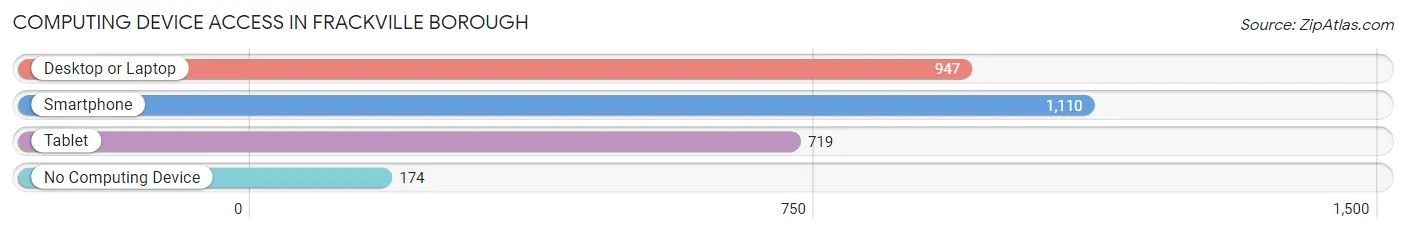
| Device Type | # Households | % Households |
| Desktop or Laptop | 947 | 67.3% |
| Smartphone | 1,110 | 78.8% |
| Tablet | 719 | 51.1% |
| No Computing Device | 174 | 12.4% |
| Total | 1,408 | 100.0% |
Internet Access in Frackville borough
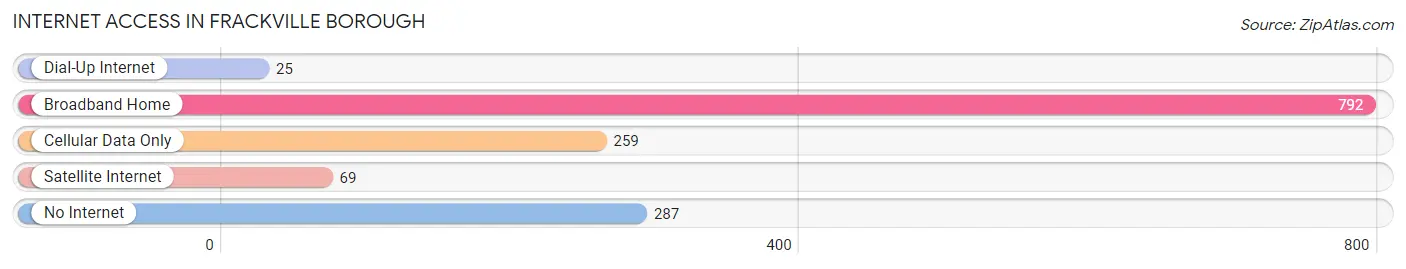
| Internet Type | # Households | % Households |
| Dial-Up Internet | 25 | 1.8% |
| Broadband Home | 792 | 56.2% |
| Cellular Data Only | 259 | 18.4% |
| Satellite Internet | 69 | 4.9% |
| No Internet | 287 | 20.4% |
| Total | 1,408 | 100.0% |
Frackville borough Summary
Frackville Borough is a small borough located in Schuylkill County, Pennsylvania. It is situated in the heart of the anthracite coal region of the state, and is home to a population of approximately 3,000 people. The borough is located in the Mahanoy Creek Valley, and is surrounded by the townships of Ryan, West Mahanoy, and East Union.
History
The area that is now Frackville Borough was first settled in the early 1800s by German and Irish immigrants. The town was originally known as “Frick’s Mill”, named after the first settler, John Frick. The town was officially incorporated as a borough in 1864.
The town was originally a farming community, but the discovery of anthracite coal in the area in the late 1800s changed the town’s economy. The coal industry brought jobs and prosperity to the area, and the town quickly grew. By the early 1900s, Frackville was a bustling coal mining town, with several mines in operation.
The coal industry in Frackville began to decline in the mid-1900s, and the town’s economy shifted to other industries. The town is now home to several small businesses, including a few manufacturing plants.
Geography
Frackville Borough is located in the Mahanoy Creek Valley, in the heart of the anthracite coal region of Pennsylvania. The borough is situated in the southern part of Schuylkill County, and is bordered by the townships of Ryan, West Mahanoy, and East Union.
The borough is located at an elevation of 1,000 feet above sea level, and is situated on a plateau. The borough is surrounded by rolling hills and mountains, and is home to several small streams and creeks.
Economy
The economy of Frackville Borough is largely based on small businesses and manufacturing. The town is home to several small businesses, including a few manufacturing plants. The town is also home to a few retail stores, restaurants, and other services.
The town is also home to a few coal mines, although the coal industry in the area has declined in recent years. The town is also home to a few tourist attractions, including the Frackville Historic District and the Frackville Coal Mine Museum.
Demographics
As of the 2010 census, the population of Frackville Borough was 3,051. The population is largely white (96.2%), with a small percentage of African Americans (2.2%) and Hispanics (1.3%). The median household income in the borough is $37,917, and the median age is 43.
The town is home to a few churches, including the Frackville United Methodist Church, the Frackville Presbyterian Church, and the Frackville Baptist Church. The town is also home to a few schools, including the Frackville Elementary School and the Frackville High School.
Conclusion
Frackville Borough is a small borough located in Schuylkill County, Pennsylvania. The town was originally a farming community, but the discovery of anthracite coal in the area in the late 1800s changed the town’s economy. The coal industry brought jobs and prosperity to the area, and the town quickly grew. The coal industry in Frackville began to decline in the mid-1900s, and the town’s economy shifted to other industries. The town is now home to several small businesses, including a few manufacturing plants. The population of Frackville Borough is largely white, with a small percentage of African Americans and Hispanics. The town is home to a few churches, schools, and tourist attractions.
Common Questions
What is Per Capita Income in Frackville borough?
Per Capita income in Frackville borough is $30,276.
What is the Median Family Income in Frackville borough?
Median Family Income in Frackville borough is $80,959.
What is the Median Household income in Frackville borough?
Median Household Income in Frackville borough is $65,139.
What is Income or Wage Gap in Frackville borough?
Income or Wage Gap in Frackville borough is 40.7%.
Women in Frackville borough earn 59.3 cents for every dollar earned by a man.
What is Family Income Deficit in Frackville borough?
Family Income Deficit in Frackville borough is $8,025.
Families that are below poverty line in Frackville borough earn $8,025 less on average than the poverty threshold level.
What is Inequality or Gini Index in Frackville borough?
Inequality or Gini Index in Frackville borough is 0.44.
What is the Total Population of Frackville borough?
Total Population of Frackville borough is 3,861.
What is the Total Male Population of Frackville borough?
Total Male Population of Frackville borough is 1,900.
What is the Total Female Population of Frackville borough?
Total Female Population of Frackville borough is 1,961.
What is the Ratio of Males per 100 Females in Frackville borough?
There are 96.89 Males per 100 Females in Frackville borough.
What is the Ratio of Females per 100 Males in Frackville borough?
There are 103.21 Females per 100 Males in Frackville borough.
What is the Median Population Age in Frackville borough?
Median Population Age in Frackville borough is 42.0 Years.
What is the Average Family Size in Frackville borough
Average Family Size in Frackville borough is 3.2 People.
What is the Average Household Size in Frackville borough
Average Household Size in Frackville borough is 2.7 People.
How Large is the Labor Force in Frackville borough?
There are 1,662 People in the Labor Forcein in Frackville borough.
What is the Percentage of People in the Labor Force in Frackville borough?
54.8% of People are in the Labor Force in Frackville borough.
What is the Unemployment Rate in Frackville borough?
Unemployment Rate in Frackville borough is 3.0%.