Carlisle, OH Map & Demographics
Carlisle Map
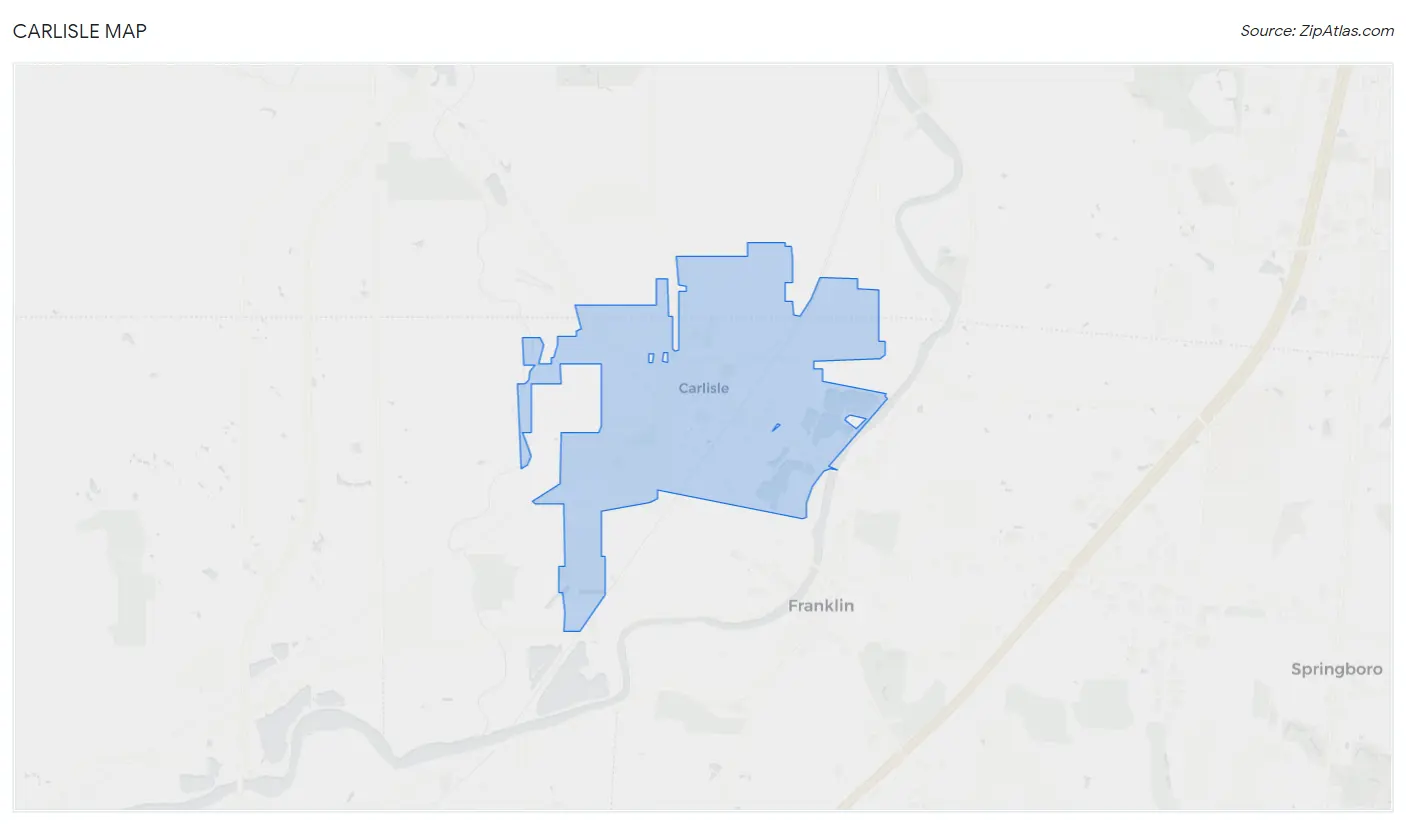
Carlisle Overview
$36,020
PER CAPITA INCOME
$86,955
AVG FAMILY INCOME
$69,513
AVG HOUSEHOLD INCOME
23.3%
WAGE / INCOME GAP [ % ]
76.7¢/ $1
WAGE / INCOME GAP [ $ ]
0.44
INEQUALITY / GINI INDEX
5,488
TOTAL POPULATION
2,710
MALE POPULATION
2,778
FEMALE POPULATION
97.55
MALES / 100 FEMALES
102.51
FEMALES / 100 MALES
41.6
MEDIAN AGE
2.9
AVG FAMILY SIZE
2.4
AVG HOUSEHOLD SIZE
2,856
LABOR FORCE [ PEOPLE ]
61.1%
PERCENT IN LABOR FORCE
4.5%
UNEMPLOYMENT RATE
Carlisle Area Codes
Income in Carlisle
Income Overview in Carlisle
Per Capita Income in Carlisle is $36,020, while median incomes of families and households are $86,955 and $69,513 respectively.
| Characteristic | Number | Measure |
| Per Capita Income | 5,488 | $36,020 |
| Median Family Income | 1,517 | $86,955 |
| Mean Family Income | 1,517 | $104,040 |
| Median Household Income | 2,231 | $69,513 |
| Mean Household Income | 2,231 | $86,672 |
| Income Deficit | 1,517 | $0 |
| Wage / Income Gap (%) | 5,488 | 23.26% |
| Wage / Income Gap ($) | 5,488 | 76.74¢ per $1 |
| Gini / Inequality Index | 5,488 | 0.44 |
Earnings by Sex in Carlisle
Average Earnings in Carlisle are $35,644, $39,945 for men and $30,654 for women, a difference of 23.3%.
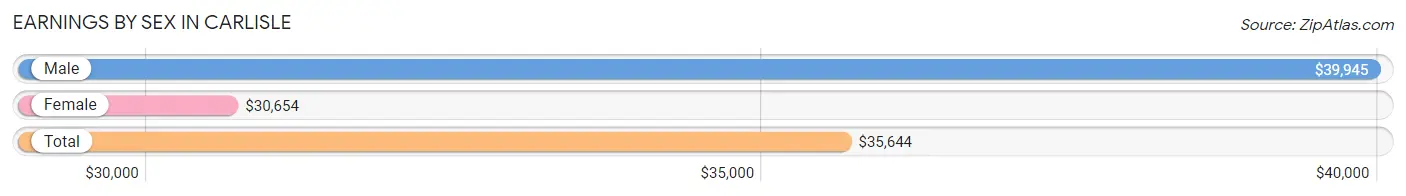
| Sex | Number | Average Earnings |
| Male | 1,569 (52.6%) | $39,945 |
| Female | 1,412 (47.4%) | $30,654 |
| Total | 2,981 (100.0%) | $35,644 |
Earnings by Sex by Income Bracket in Carlisle
The most common earnings brackets in Carlisle are $75,000 to $99,999 for men (244 | 15.5%) and $30,000 to $34,999 for women (188 | 13.3%).
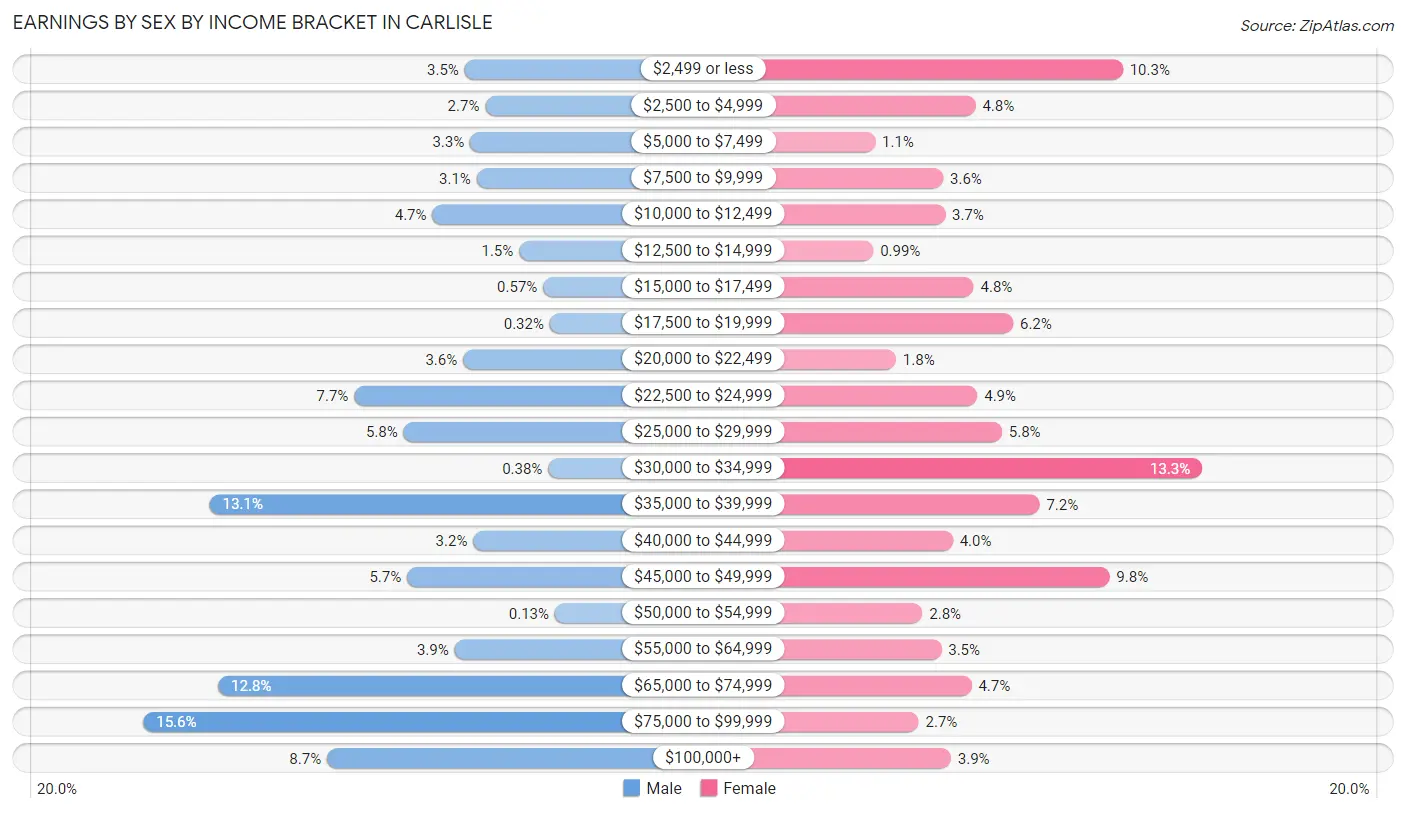
| Income | Male | Female |
| $2,499 or less | 55 (3.5%) | 146 (10.3%) |
| $2,500 to $4,999 | 43 (2.7%) | 68 (4.8%) |
| $5,000 to $7,499 | 52 (3.3%) | 15 (1.1%) |
| $7,500 to $9,999 | 48 (3.1%) | 51 (3.6%) |
| $10,000 to $12,499 | 74 (4.7%) | 52 (3.7%) |
| $12,500 to $14,999 | 23 (1.5%) | 14 (1.0%) |
| $15,000 to $17,499 | 9 (0.6%) | 67 (4.8%) |
| $17,500 to $19,999 | 5 (0.3%) | 88 (6.2%) |
| $20,000 to $22,499 | 56 (3.6%) | 26 (1.8%) |
| $22,500 to $24,999 | 120 (7.6%) | 69 (4.9%) |
| $25,000 to $29,999 | 91 (5.8%) | 82 (5.8%) |
| $30,000 to $34,999 | 6 (0.4%) | 188 (13.3%) |
| $35,000 to $39,999 | 205 (13.1%) | 102 (7.2%) |
| $40,000 to $44,999 | 50 (3.2%) | 56 (4.0%) |
| $45,000 to $49,999 | 89 (5.7%) | 139 (9.8%) |
| $50,000 to $54,999 | 2 (0.1%) | 40 (2.8%) |
| $55,000 to $64,999 | 61 (3.9%) | 50 (3.5%) |
| $65,000 to $74,999 | 200 (12.8%) | 66 (4.7%) |
| $75,000 to $99,999 | 244 (15.5%) | 38 (2.7%) |
| $100,000+ | 136 (8.7%) | 55 (3.9%) |
| Total | 1,569 (100.0%) | 1,412 (100.0%) |
Earnings by Sex by Educational Attainment in Carlisle
Average earnings in Carlisle are $63,947 for men and $32,917 for women, a difference of 48.5%. Men with an educational attainment of college or associate's degree enjoy the highest average annual earnings of $69,773, while those with less than high school education earn the least with $26,458. Women with an educational attainment of less than high school earn the most with the average annual earnings of $47,321, while those with high school diploma education have the smallest earnings of $23,170.
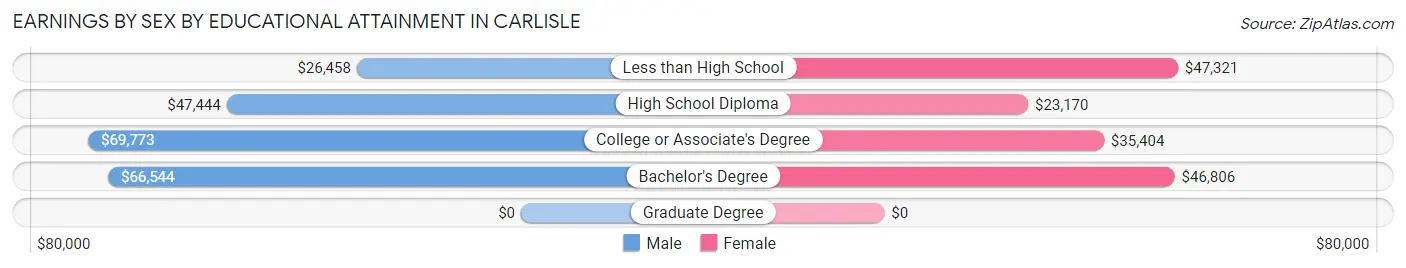
| Educational Attainment | Male Income | Female Income |
| Less than High School | $26,458 | $47,321 |
| High School Diploma | $47,444 | $23,170 |
| College or Associate's Degree | $69,773 | $35,404 |
| Bachelor's Degree | $66,544 | $46,806 |
| Graduate Degree | - | - |
| Total | $63,947 | $32,917 |
Family Income in Carlisle
Family Income Brackets in Carlisle
According to the Carlisle family income data, there are 369 families falling into the $100,000 to $149,999 income range, which is the most common income bracket and makes up 24.3% of all families. Conversely, the $10,000 to $14,999 income bracket is the least frequent group with only 9 families (0.6%) belonging to this category.
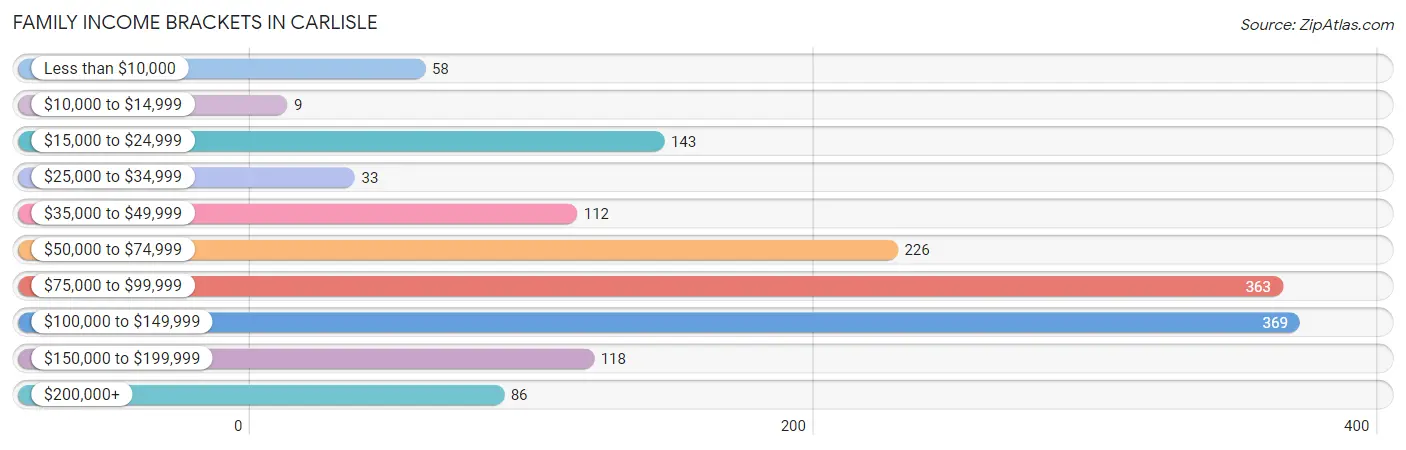
| Income Bracket | # Families | % Families |
| Less than $10,000 | 58 | 3.8% |
| $10,000 to $14,999 | 9 | 0.6% |
| $15,000 to $24,999 | 143 | 9.4% |
| $25,000 to $34,999 | 33 | 2.2% |
| $35,000 to $49,999 | 112 | 7.4% |
| $50,000 to $74,999 | 226 | 14.9% |
| $75,000 to $99,999 | 363 | 23.9% |
| $100,000 to $149,999 | 369 | 24.3% |
| $150,000 to $199,999 | 118 | 7.8% |
| $200,000+ | 86 | 5.7% |
Family Income by Famaliy Size in Carlisle
5-person families (104 | 6.9%) account for the highest median family income in Carlisle with $118,750 per family, while 2-person families (692 | 45.6%) have the highest median income of $36,000 per family member.
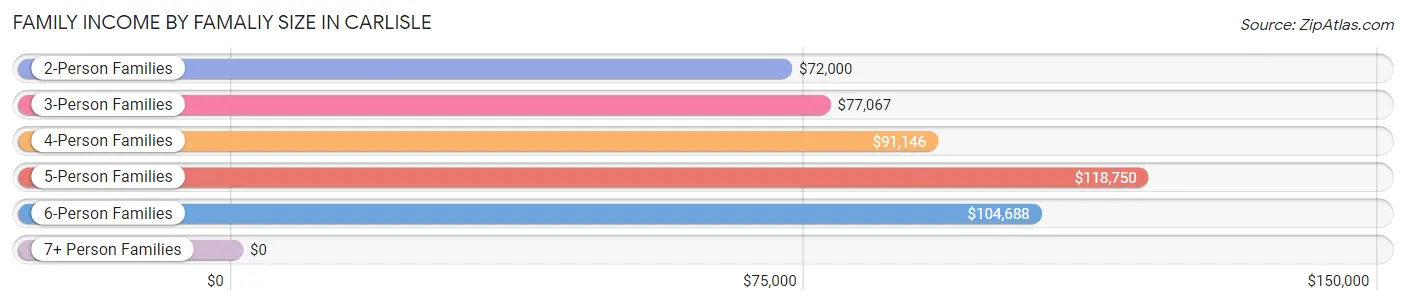
| Income Bracket | # Families | Median Income |
| 2-Person Families | 692 (45.6%) | $72,000 |
| 3-Person Families | 434 (28.6%) | $77,067 |
| 4-Person Families | 203 (13.4%) | $91,146 |
| 5-Person Families | 104 (6.9%) | $118,750 |
| 6-Person Families | 84 (5.5%) | $104,688 |
| 7+ Person Families | 0 (0.0%) | $0 |
| Total | 1,517 (100.0%) | $86,955 |
Family Income by Number of Earners in Carlisle
The median family income in Carlisle is $86,955, with families comprising 3+ earners (175) having the highest median family income of $152,784, while families with no earners (290) have the lowest median family income of $40,682, accounting for 11.5% and 19.1% of families, respectively.
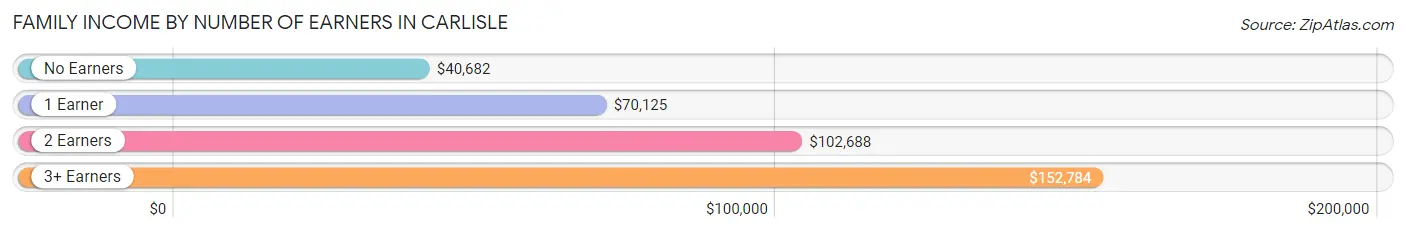
| Number of Earners | # Families | Median Income |
| No Earners | 290 (19.1%) | $40,682 |
| 1 Earner | 423 (27.9%) | $70,125 |
| 2 Earners | 629 (41.5%) | $102,688 |
| 3+ Earners | 175 (11.5%) | $152,784 |
| Total | 1,517 (100.0%) | $86,955 |
Household Income in Carlisle
Household Income Brackets in Carlisle
With 424 households falling in the category, the $50,000 to $74,999 income range is the most frequent in Carlisle, accounting for 19.0% of all households. In contrast, only 65 households (2.9%) fall into the $10,000 to $14,999 income bracket, making it the least populous group.
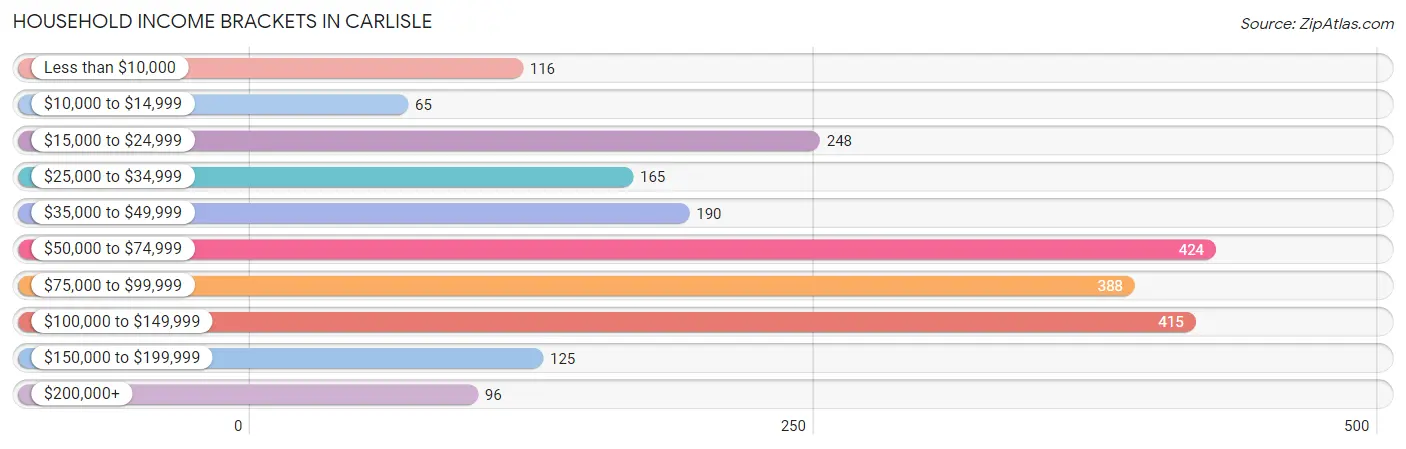
| Income Bracket | # Households | % Households |
| Less than $10,000 | 116 | 5.2% |
| $10,000 to $14,999 | 65 | 2.9% |
| $15,000 to $24,999 | 248 | 11.1% |
| $25,000 to $34,999 | 165 | 7.4% |
| $35,000 to $49,999 | 190 | 8.5% |
| $50,000 to $74,999 | 424 | 19.0% |
| $75,000 to $99,999 | 388 | 17.4% |
| $100,000 to $149,999 | 415 | 18.6% |
| $150,000 to $199,999 | 125 | 5.6% |
| $200,000+ | 96 | 4.3% |
Household Income by Householder Age in Carlisle
The median household income in Carlisle is $69,513, with the highest median household income of $94,861 found in the 45 to 64 years age bracket for the primary householder. A total of 705 households (31.6%) fall into this category. Meanwhile, the 15 to 24 years age bracket for the primary householder has the lowest median household income of $0, with 284 households (12.7%) in this group.
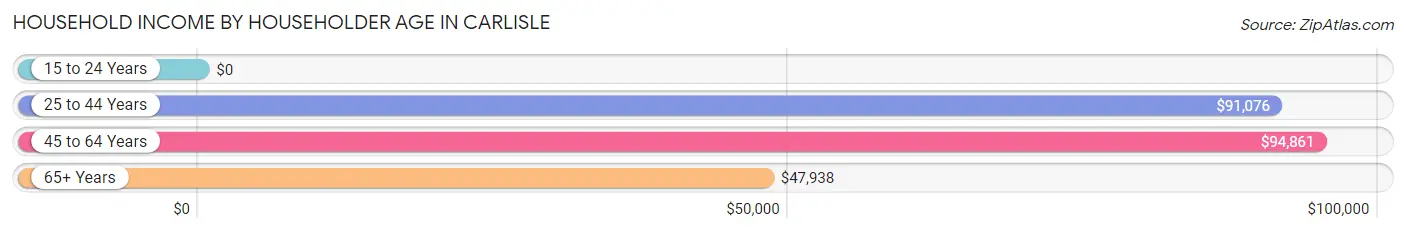
| Income Bracket | # Households | Median Income |
| 15 to 24 Years | 284 (12.7%) | $0 |
| 25 to 44 Years | 519 (23.3%) | $91,076 |
| 45 to 64 Years | 705 (31.6%) | $94,861 |
| 65+ Years | 723 (32.4%) | $47,938 |
| Total | 2,231 (100.0%) | $69,513 |
Poverty in Carlisle
Income Below Poverty by Sex and Age in Carlisle
With 9.5% poverty level for males and 8.0% for females among the residents of Carlisle, 18 to 24 year old males and 65 to 74 year old females are the most vulnerable to poverty, with 137 males (27.1%) and 116 females (29.1%) in their respective age groups living below the poverty level.
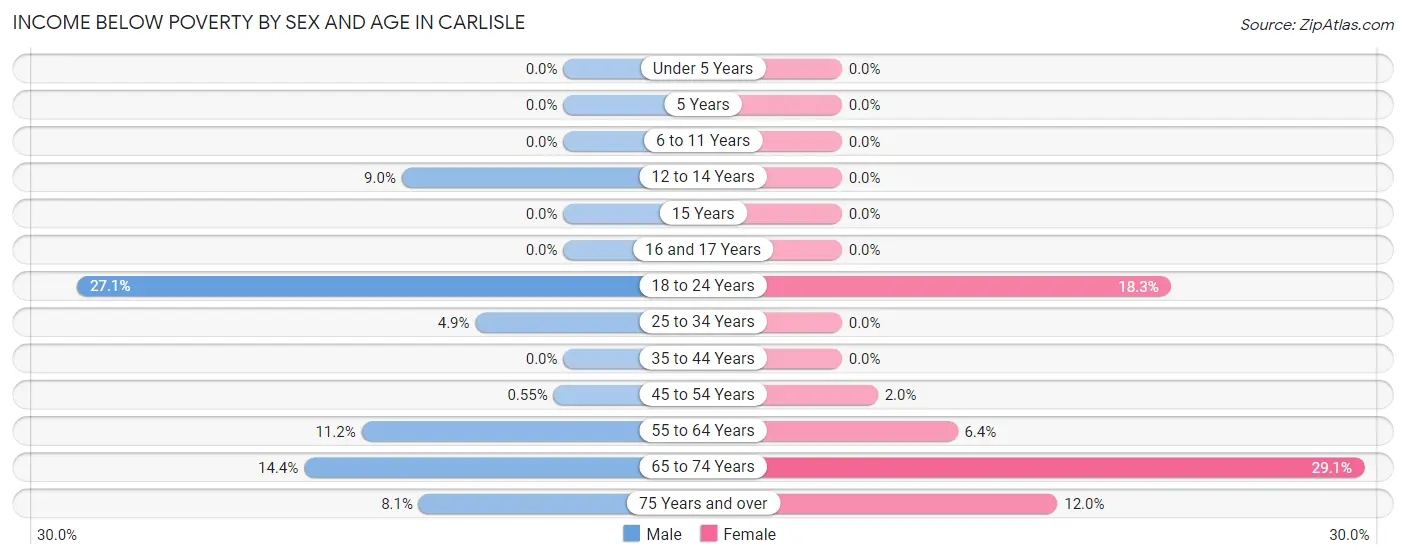
| Age Bracket | Male | Female |
| Under 5 Years | 0 (0.0%) | 0 (0.0%) |
| 5 Years | 0 (0.0%) | 0 (0.0%) |
| 6 to 11 Years | 0 (0.0%) | 0 (0.0%) |
| 12 to 14 Years | 9 (9.0%) | 0 (0.0%) |
| 15 Years | 0 (0.0%) | 0 (0.0%) |
| 16 and 17 Years | 0 (0.0%) | 0 (0.0%) |
| 18 to 24 Years | 137 (27.1%) | 43 (18.3%) |
| 25 to 34 Years | 14 (4.9%) | 0 (0.0%) |
| 35 to 44 Years | 0 (0.0%) | 0 (0.0%) |
| 45 to 54 Years | 2 (0.5%) | 8 (2.0%) |
| 55 to 64 Years | 29 (11.2%) | 19 (6.4%) |
| 65 to 74 Years | 54 (14.4%) | 116 (29.1%) |
| 75 Years and over | 12 (8.1%) | 33 (12.0%) |
| Total | 257 (9.5%) | 219 (8.0%) |
Income Above Poverty by Sex and Age in Carlisle
According to the poverty statistics in Carlisle, males aged under 5 years and females aged under 5 years are the age groups that are most secure financially, with 100.0% of males and 100.0% of females in these age groups living above the poverty line.
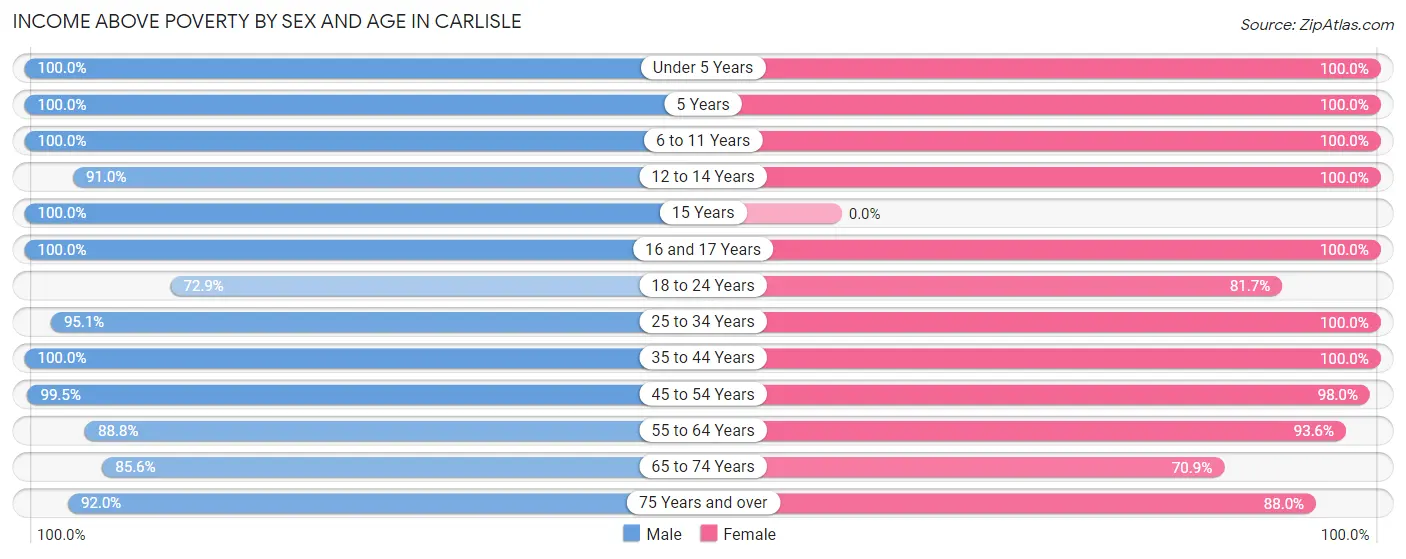
| Age Bracket | Male | Female |
| Under 5 Years | 83 (100.0%) | 155 (100.0%) |
| 5 Years | 24 (100.0%) | 12 (100.0%) |
| 6 to 11 Years | 156 (100.0%) | 151 (100.0%) |
| 12 to 14 Years | 91 (91.0%) | 103 (100.0%) |
| 15 Years | 30 (100.0%) | 0 (0.0%) |
| 16 and 17 Years | 69 (100.0%) | 167 (100.0%) |
| 18 to 24 Years | 369 (72.9%) | 192 (81.7%) |
| 25 to 34 Years | 272 (95.1%) | 233 (100.0%) |
| 35 to 44 Years | 295 (100.0%) | 321 (100.0%) |
| 45 to 54 Years | 361 (99.5%) | 392 (98.0%) |
| 55 to 64 Years | 229 (88.8%) | 276 (93.6%) |
| 65 to 74 Years | 320 (85.6%) | 283 (70.9%) |
| 75 Years and over | 137 (91.9%) | 242 (88.0%) |
| Total | 2,436 (90.5%) | 2,527 (92.0%) |
Income Below Poverty Among Married-Couple Families in Carlisle
The poverty statistics for married-couple families in Carlisle show that 5.8% or 73 of the total 1,256 families live below the poverty line. Families with no children have the highest poverty rate of 8.5%, comprising of 63 families. On the other hand, families with 3 or 4 children have the lowest poverty rate of 0.0%, which includes 0 families.
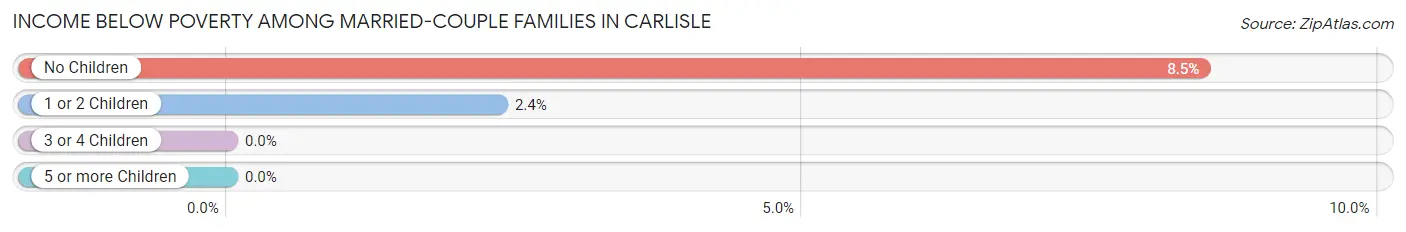
| Children | Above Poverty | Below Poverty |
| No Children | 681 (91.5%) | 63 (8.5%) |
| 1 or 2 Children | 415 (97.7%) | 10 (2.4%) |
| 3 or 4 Children | 87 (100.0%) | 0 (0.0%) |
| 5 or more Children | 0 (0.0%) | 0 (0.0%) |
| Total | 1,183 (94.2%) | 73 (5.8%) |
Income Below Poverty Among Single-Parent Households in Carlisle
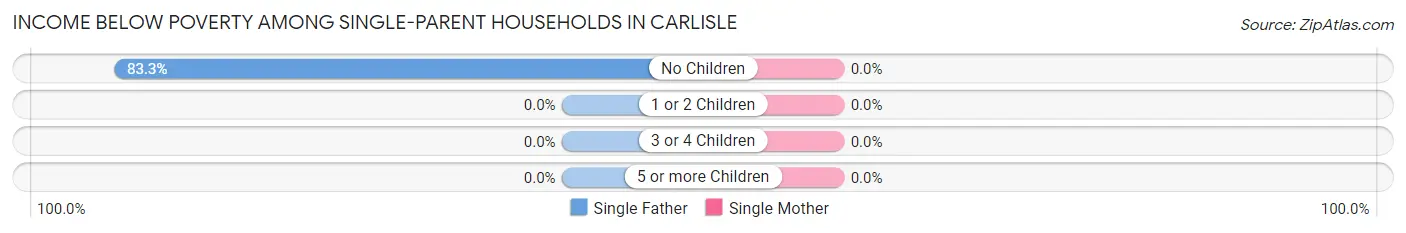
| Children | Single Father | Single Mother |
| No Children | 100 (83.3%) | 0 (0.0%) |
| 1 or 2 Children | 0 (0.0%) | 0 (0.0%) |
| 3 or 4 Children | 0 (0.0%) | 0 (0.0%) |
| 5 or more Children | 0 (0.0%) | 0 (0.0%) |
| Total | 100 (63.7%) | 0 (0.0%) |
Income Below Poverty Among Married-Couple vs Single-Parent Households in Carlisle
The poverty data for Carlisle shows that 73 of the married-couple family households (5.8%) and 100 of the single-parent households (38.3%) are living below the poverty level. Within the married-couple family households, those with no children have the highest poverty rate, with 63 households (8.5%) falling below the poverty line. Among the single-parent households, those with no children have the highest poverty rate, with 100 household (61.7%) living below poverty.
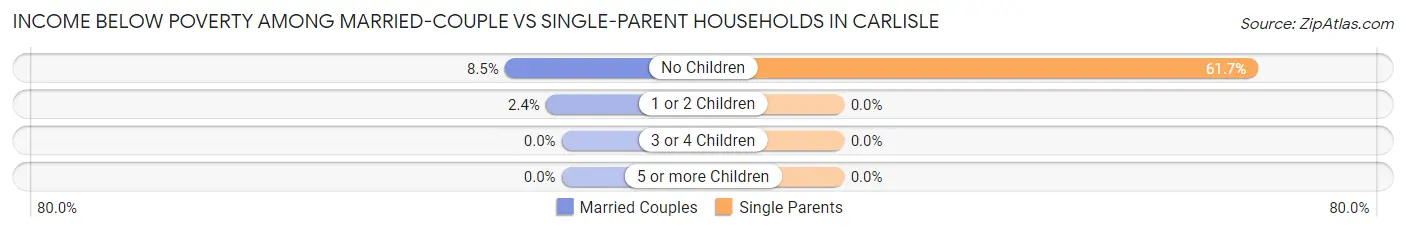
| Children | Married-Couple Families | Single-Parent Households |
| No Children | 63 (8.5%) | 100 (61.7%) |
| 1 or 2 Children | 10 (2.4%) | 0 (0.0%) |
| 3 or 4 Children | 0 (0.0%) | 0 (0.0%) |
| 5 or more Children | 0 (0.0%) | 0 (0.0%) |
| Total | 73 (5.8%) | 100 (38.3%) |
Race in Carlisle
The most populous races in Carlisle are White / Caucasian (5,074 | 92.5%), Asian (178 | 3.2%), and Two or more Races (172 | 3.1%).
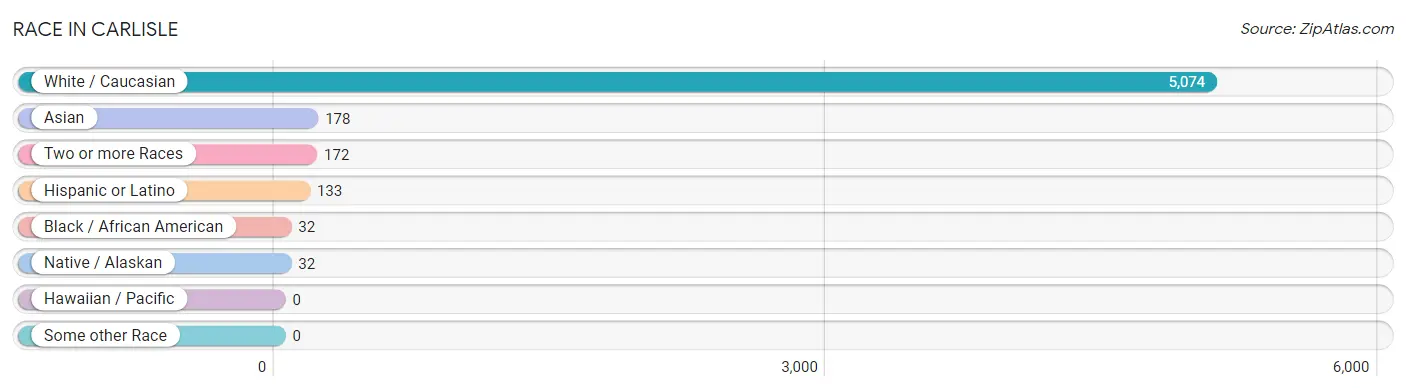
| Race | # Population | % Population |
| Asian | 178 | 3.2% |
| Black / African American | 32 | 0.6% |
| Hawaiian / Pacific | 0 | 0.0% |
| Hispanic or Latino | 133 | 2.4% |
| Native / Alaskan | 32 | 0.6% |
| White / Caucasian | 5,074 | 92.5% |
| Two or more Races | 172 | 3.1% |
| Some other Race | 0 | 0.0% |
| Total | 5,488 | 100.0% |
Ancestry in Carlisle
The most populous ancestries reported in Carlisle are German (1,097 | 20.0%), Irish (786 | 14.3%), American (593 | 10.8%), English (556 | 10.1%), and French (185 | 3.4%), together accounting for 58.6% of all Carlisle residents.
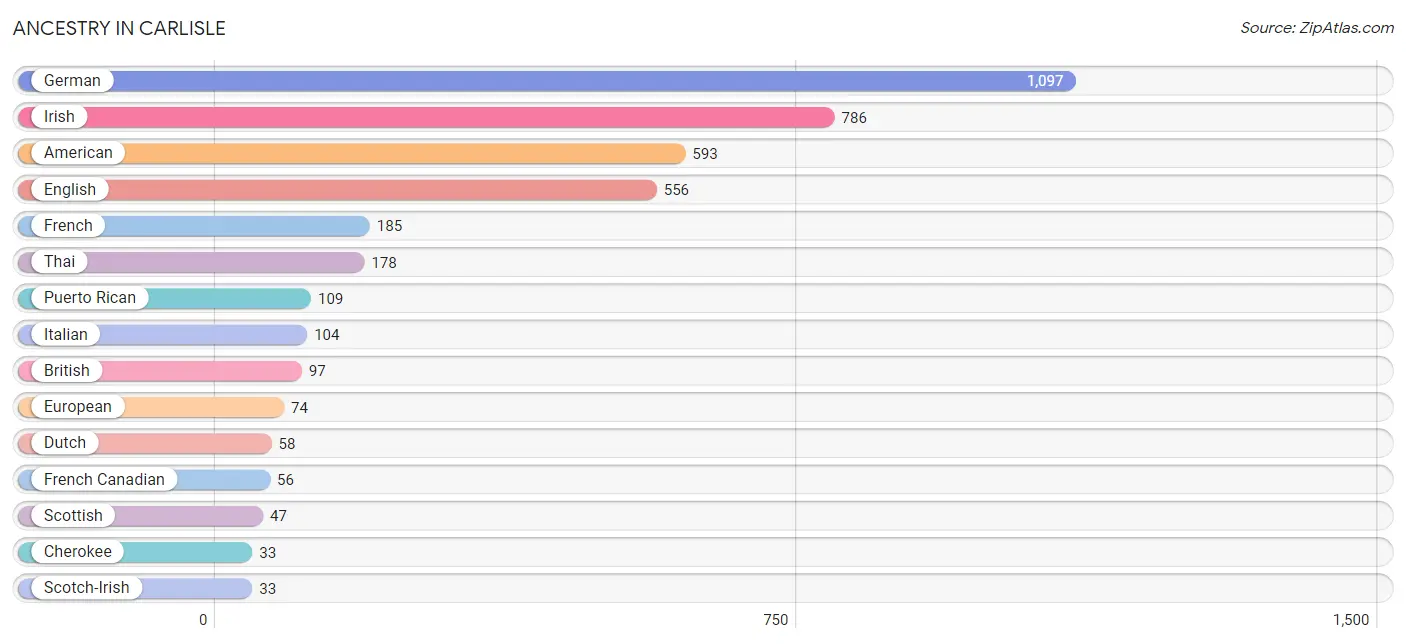
| Ancestry | # Population | % Population |
| American | 593 | 10.8% |
| Arab | 7 | 0.1% |
| Blackfeet | 15 | 0.3% |
| British | 97 | 1.8% |
| Canadian | 15 | 0.3% |
| Cherokee | 33 | 0.6% |
| Chippewa | 4 | 0.1% |
| Czech | 11 | 0.2% |
| Dutch | 58 | 1.1% |
| English | 556 | 10.1% |
| European | 74 | 1.3% |
| French | 185 | 3.4% |
| French Canadian | 56 | 1.0% |
| German | 1,097 | 20.0% |
| Greek | 11 | 0.2% |
| Hungarian | 12 | 0.2% |
| Irish | 786 | 14.3% |
| Italian | 104 | 1.9% |
| Lebanese | 7 | 0.1% |
| Mexican | 24 | 0.4% |
| Pennsylvania German | 8 | 0.2% |
| Polish | 11 | 0.2% |
| Puerto Rican | 109 | 2.0% |
| Romanian | 9 | 0.2% |
| Scandinavian | 28 | 0.5% |
| Scotch-Irish | 33 | 0.6% |
| Scottish | 47 | 0.9% |
| Thai | 178 | 3.2% |
| Welsh | 22 | 0.4% | View All 29 Rows |
Immigrants in Carlisle
The most numerous immigrant groups reported in Carlisle came from Asia (178 | 3.2%), India (178 | 3.2%), South Central Asia (178 | 3.2%), Central America (17 | 0.3%), and Latin America (17 | 0.3%), together accounting for 10.3% of all Carlisle residents.
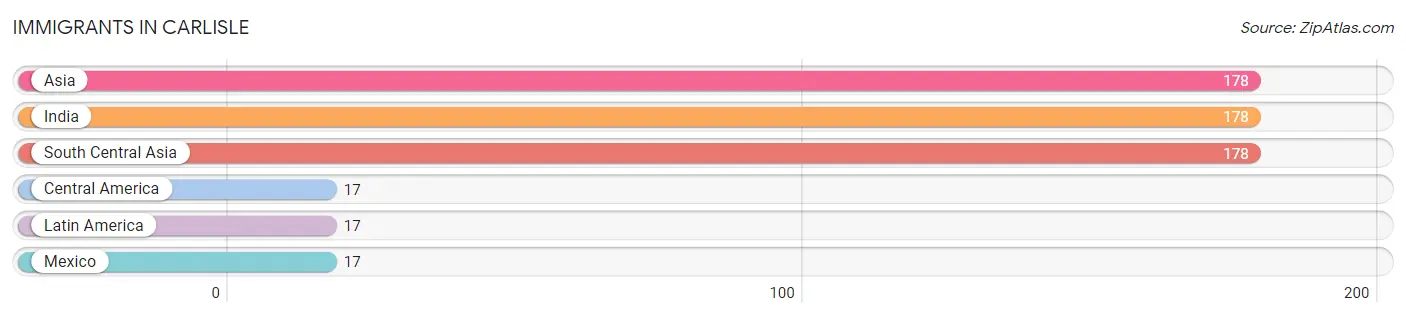
| Immigration Origin | # Population | % Population |
| Asia | 178 | 3.2% |
| Central America | 17 | 0.3% |
| India | 178 | 3.2% |
| Latin America | 17 | 0.3% |
| Mexico | 17 | 0.3% |
| South Central Asia | 178 | 3.2% | View All 6 Rows |
Sex and Age in Carlisle
Sex and Age in Carlisle
The most populous age groups in Carlisle are 20 to 24 Years (444 | 16.4%) for men and 65 to 69 Years (308 | 11.1%) for women.
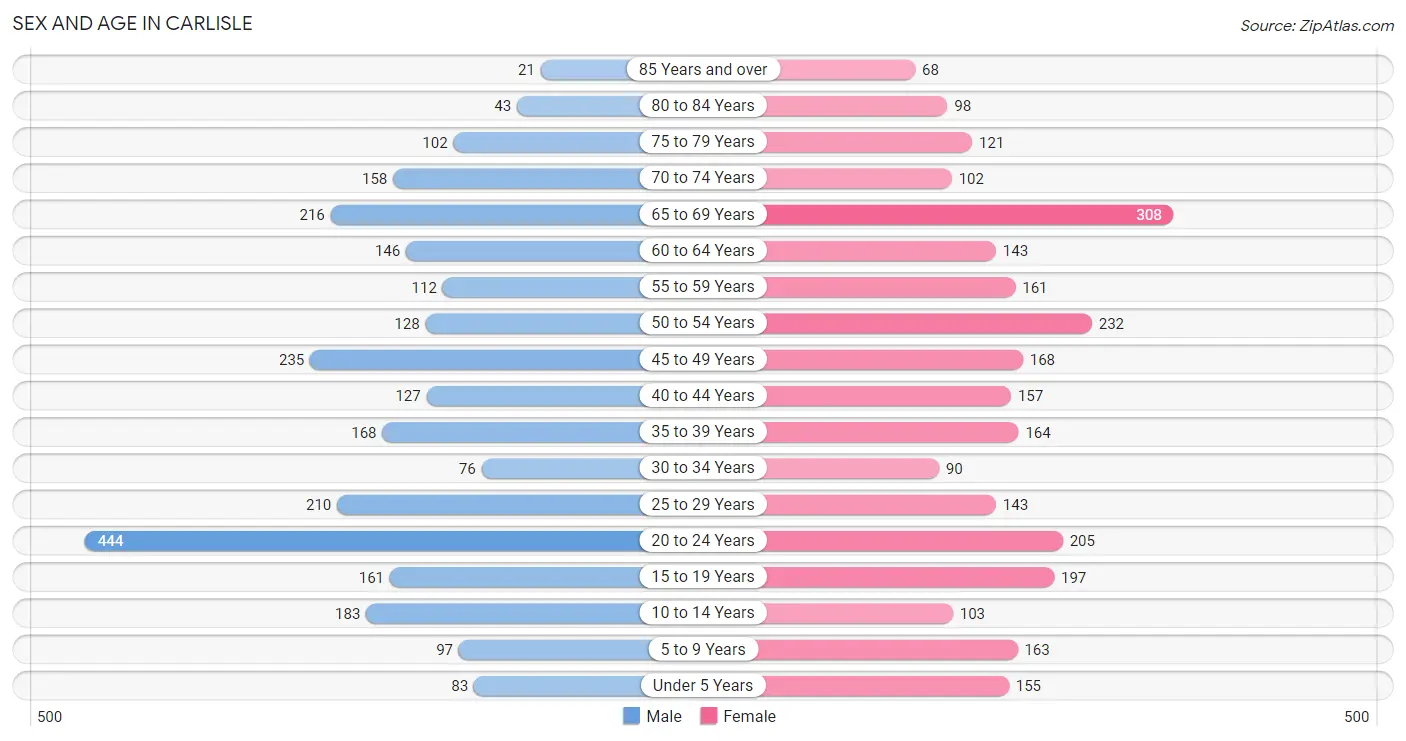
| Age Bracket | Male | Female |
| Under 5 Years | 83 (3.1%) | 155 (5.6%) |
| 5 to 9 Years | 97 (3.6%) | 163 (5.9%) |
| 10 to 14 Years | 183 (6.8%) | 103 (3.7%) |
| 15 to 19 Years | 161 (5.9%) | 197 (7.1%) |
| 20 to 24 Years | 444 (16.4%) | 205 (7.4%) |
| 25 to 29 Years | 210 (7.7%) | 143 (5.1%) |
| 30 to 34 Years | 76 (2.8%) | 90 (3.2%) |
| 35 to 39 Years | 168 (6.2%) | 164 (5.9%) |
| 40 to 44 Years | 127 (4.7%) | 157 (5.7%) |
| 45 to 49 Years | 235 (8.7%) | 168 (6.0%) |
| 50 to 54 Years | 128 (4.7%) | 232 (8.4%) |
| 55 to 59 Years | 112 (4.1%) | 161 (5.8%) |
| 60 to 64 Years | 146 (5.4%) | 143 (5.1%) |
| 65 to 69 Years | 216 (8.0%) | 308 (11.1%) |
| 70 to 74 Years | 158 (5.8%) | 102 (3.7%) |
| 75 to 79 Years | 102 (3.8%) | 121 (4.4%) |
| 80 to 84 Years | 43 (1.6%) | 98 (3.5%) |
| 85 Years and over | 21 (0.8%) | 68 (2.5%) |
| Total | 2,710 (100.0%) | 2,778 (100.0%) |
Families and Households in Carlisle
Median Family Size in Carlisle
The median family size in Carlisle is 2.94 persons per family, with married-couple families (1,256 | 82.8%) accounting for the largest median family size of 3.03 persons per family. On the other hand, single male/father families (157 | 10.3%) represent the smallest median family size with 2.11 persons per family.
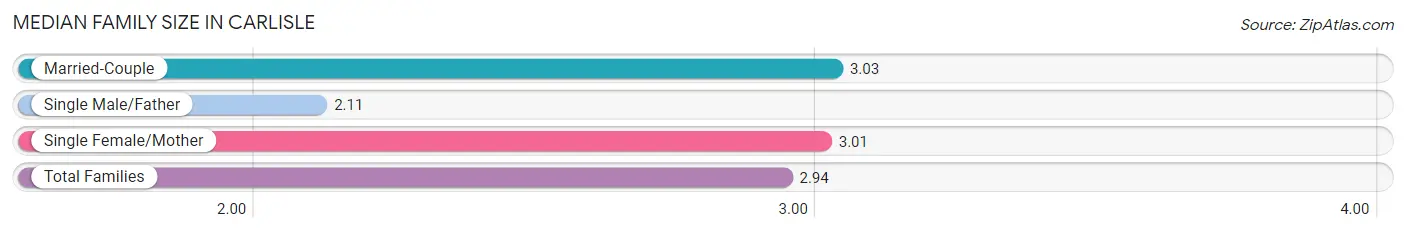
| Family Type | # Families | Family Size |
| Married-Couple | 1,256 (82.8%) | 3.03 |
| Single Male/Father | 157 (10.3%) | 2.11 |
| Single Female/Mother | 104 (6.9%) | 3.01 |
| Total Families | 1,517 (100.0%) | 2.94 |
Median Household Size in Carlisle
The median household size in Carlisle is 2.43 persons per household, with married-couple households (1,256 | 56.3%) accounting for the largest median household size of 3.08 persons per household. non-family households (714 | 32.0%) represent the smallest median household size with 1.22 persons per household.
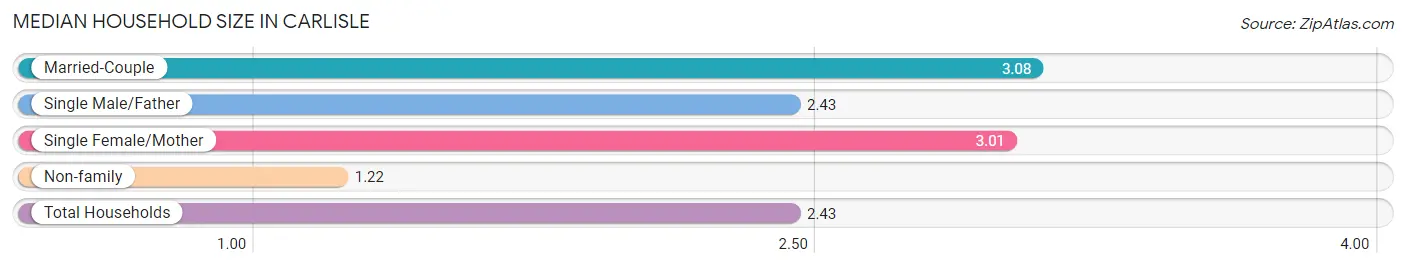
| Household Type | # Households | Household Size |
| Married-Couple | 1,256 (56.3%) | 3.08 |
| Single Male/Father | 157 (7.0%) | 2.43 |
| Single Female/Mother | 104 (4.7%) | 3.01 |
| Non-family | 714 (32.0%) | 1.22 |
| Total Households | 2,231 (100.0%) | 2.43 |
Household Size by Marriage Status in Carlisle
Out of a total of 2,231 households in Carlisle, 1,517 (68.0%) are family households, while 714 (32.0%) are nonfamily households. The most numerous type of family households are 2-person households, comprising 683, and the most common type of nonfamily households are 1-person households, comprising 561.
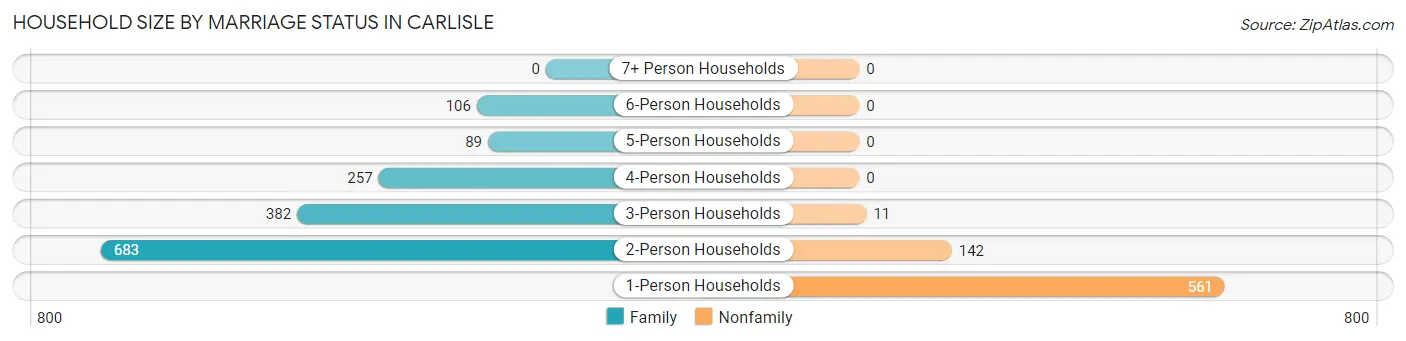
| Household Size | Family Households | Nonfamily Households |
| 1-Person Households | - | 561 (25.2%) |
| 2-Person Households | 683 (30.6%) | 142 (6.4%) |
| 3-Person Households | 382 (17.1%) | 11 (0.5%) |
| 4-Person Households | 257 (11.5%) | 0 (0.0%) |
| 5-Person Households | 89 (4.0%) | 0 (0.0%) |
| 6-Person Households | 106 (4.8%) | 0 (0.0%) |
| 7+ Person Households | 0 (0.0%) | 0 (0.0%) |
| Total | 1,517 (68.0%) | 714 (32.0%) |
Female Fertility in Carlisle
Fertility by Age in Carlisle
Average fertility rate in Carlisle is 63.0 births per 1,000 women. Women in the age bracket of 20 to 34 years have the highest fertility rate with 167.0 births per 1,000 women. Women in the age bracket of 20 to 34 years acount for 100.0% of all women with births.
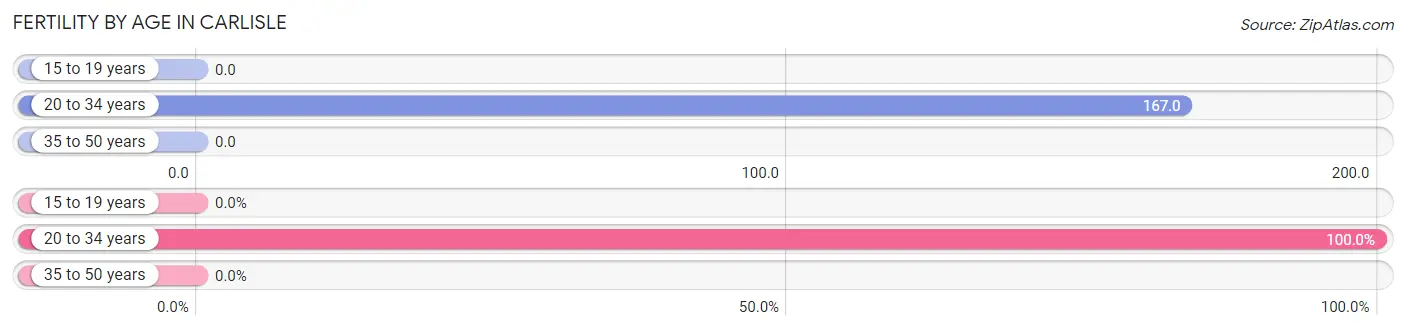
| Age Bracket | Women with Births | Births / 1,000 Women |
| 15 to 19 years | 0 (0.0%) | 0.0 |
| 20 to 34 years | 73 (100.0%) | 167.0 |
| 35 to 50 years | 0 (0.0%) | 0.0 |
| Total | 73 (100.0%) | 63.0 |
Fertility by Age by Marriage Status in Carlisle
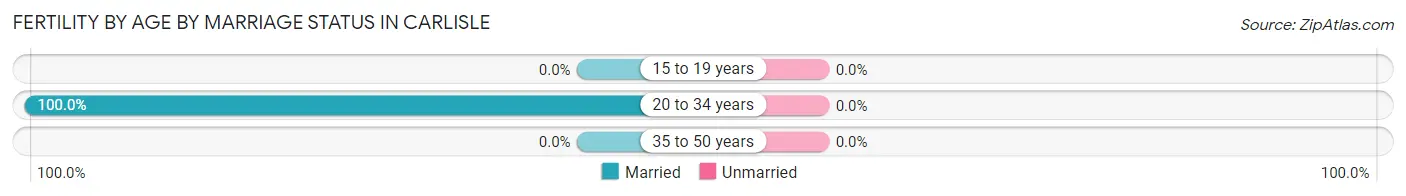
| Age Bracket | Married | Unmarried |
| 15 to 19 years | 0 (0.0%) | 0 (0.0%) |
| 20 to 34 years | 73 (100.0%) | 0 (0.0%) |
| 35 to 50 years | 0 (0.0%) | 0 (0.0%) |
| Total | 73 (100.0%) | 0 (0.0%) |
Fertility by Education in Carlisle
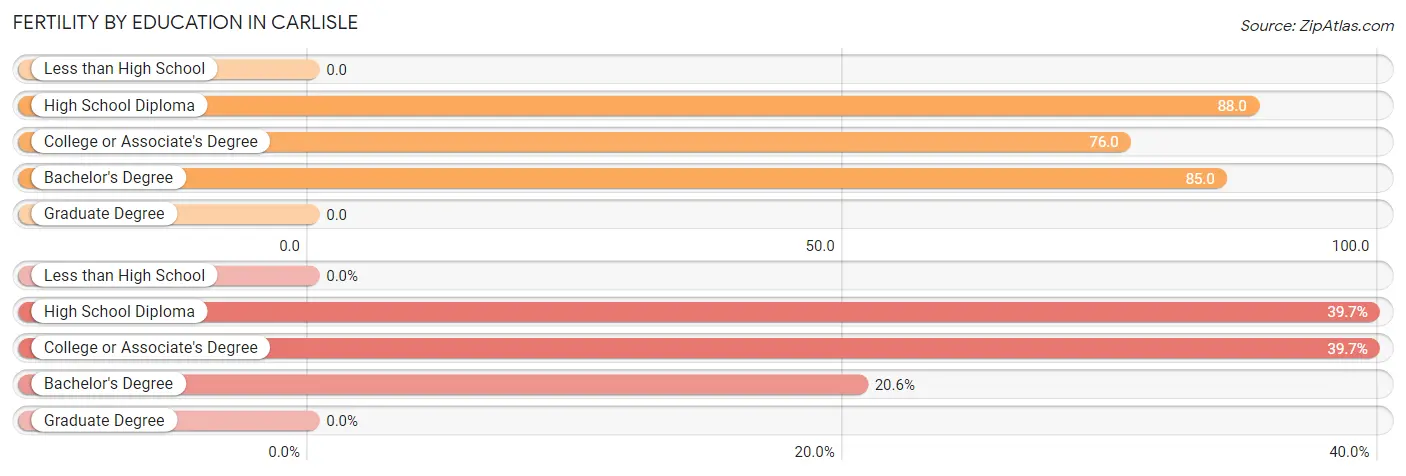
| Educational Attainment | Women with Births | Births / 1,000 Women |
| Less than High School | 0 (0.0%) | 0.0 |
| High School Diploma | 29 (39.7%) | 88.0 |
| College or Associate's Degree | 29 (39.7%) | 76.0 |
| Bachelor's Degree | 15 (20.5%) | 85.0 |
| Graduate Degree | 0 (0.0%) | 0.0 |
| Total | 73 (100.0%) | 63.0 |
Fertility by Education by Marriage Status in Carlisle
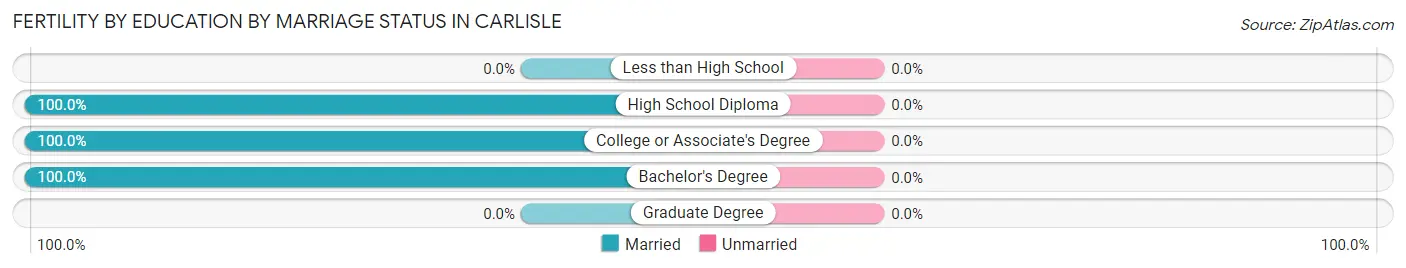
| Educational Attainment | Married | Unmarried |
| Less than High School | 0 (0.0%) | 0 (0.0%) |
| High School Diploma | 29 (100.0%) | 0 (0.0%) |
| College or Associate's Degree | 29 (100.0%) | 0 (0.0%) |
| Bachelor's Degree | 15 (100.0%) | 0 (0.0%) |
| Graduate Degree | 0 (0.0%) | 0 (0.0%) |
| Total | 73 (100.0%) | 0 (0.0%) |
Employment Characteristics in Carlisle
Employment by Class of Employer in Carlisle
Among the 2,602 employed individuals in Carlisle, private company employees (2,072 | 79.6%), local government employees (194 | 7.5%), and not-for-profit organizations (157 | 6.0%) make up the most common classes of employment.
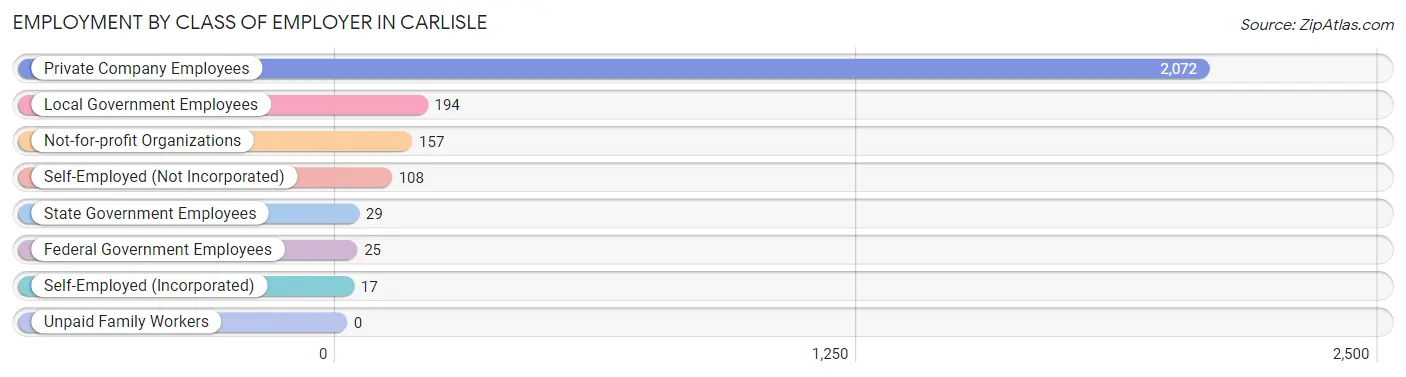
| Employer Class | # Employees | % Employees |
| Private Company Employees | 2,072 | 79.6% |
| Self-Employed (Incorporated) | 17 | 0.6% |
| Self-Employed (Not Incorporated) | 108 | 4.2% |
| Not-for-profit Organizations | 157 | 6.0% |
| Local Government Employees | 194 | 7.5% |
| State Government Employees | 29 | 1.1% |
| Federal Government Employees | 25 | 1.0% |
| Unpaid Family Workers | 0 | 0.0% |
| Total | 2,602 | 100.0% |
Employment Status by Age in Carlisle
According to the labor force statistics for Carlisle, out of the total population over 16 years of age (4,674), 61.1% or 2,856 individuals are in the labor force, with 4.5% or 129 of them unemployed. The age group with the highest labor force participation rate is 35 to 44 years, with 94.0% or 579 individuals in the labor force. Within the labor force, the 60 to 64 years age range has the highest percentage of unemployed individuals, with 15.5% or 16 of them being unemployed.
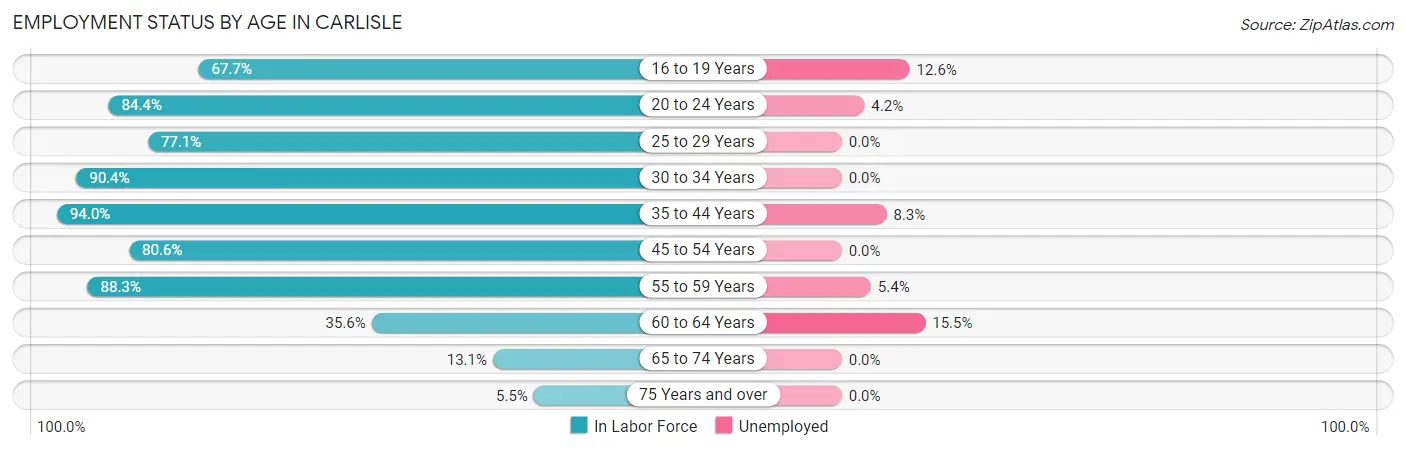
| Age Bracket | In Labor Force | Unemployed |
| 16 to 19 Years | 222 (67.7%) | 28 (12.6%) |
| 20 to 24 Years | 548 (84.4%) | 23 (4.2%) |
| 25 to 29 Years | 272 (77.1%) | 0 (0.0%) |
| 30 to 34 Years | 150 (90.4%) | 0 (0.0%) |
| 35 to 44 Years | 579 (94.0%) | 48 (8.3%) |
| 45 to 54 Years | 615 (80.6%) | 0 (0.0%) |
| 55 to 59 Years | 241 (88.3%) | 13 (5.4%) |
| 60 to 64 Years | 103 (35.6%) | 16 (15.5%) |
| 65 to 74 Years | 103 (13.1%) | 0 (0.0%) |
| 75 Years and over | 25 (5.5%) | 0 (0.0%) |
| Total | 2,856 (61.1%) | 129 (4.5%) |
Employment Status by Educational Attainment in Carlisle
According to labor force statistics for Carlisle, 79.7% of individuals (1,961) out of the total population between 25 and 64 years of age (2,460) are in the labor force, with 3.9% or 76 of them being unemployed. The group with the highest labor force participation rate are those with the educational attainment of college / associate degree, with 88.1% or 719 individuals in the labor force. Within the labor force, individuals with college / associate degree education have the highest percentage of unemployment, with 7.8% or 56 of them being unemployed.
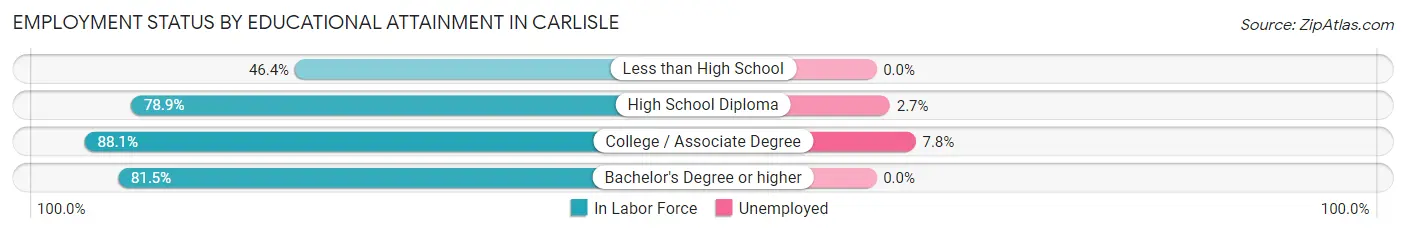
| Educational Attainment | In Labor Force | Unemployed |
| Less than High School | 97 (46.4%) | 0 (0.0%) |
| High School Diploma | 782 (78.9%) | 27 (2.7%) |
| College / Associate Degree | 719 (88.1%) | 64 (7.8%) |
| Bachelor's Degree or higher | 362 (81.5%) | 0 (0.0%) |
| Total | 1,961 (79.7%) | 96 (3.9%) |
Employment Occupations by Sex in Carlisle
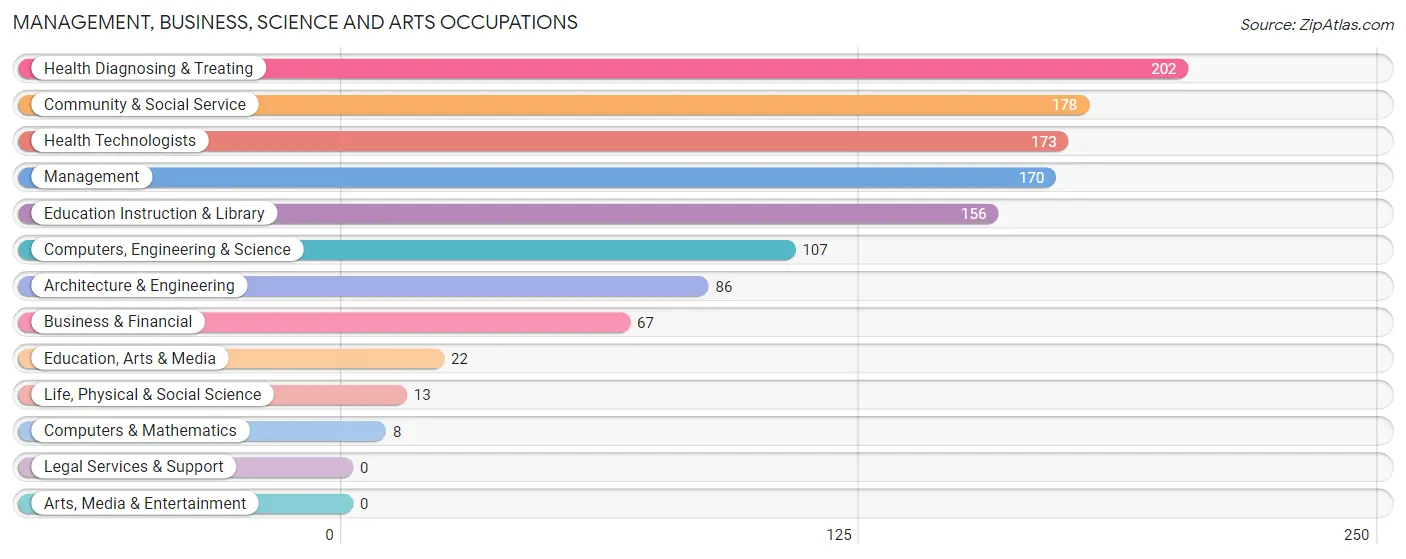
Management, Business, Science and Arts Occupations
The most common Management, Business, Science and Arts occupations in Carlisle are Health Diagnosing & Treating (202 | 7.4%), Community & Social Service (178 | 6.5%), Health Technologists (173 | 6.3%), Management (170 | 6.2%), and Education Instruction & Library (156 | 5.7%).
Management, Business, Science and Arts Occupations by Sex
Within the Management, Business, Science and Arts occupations in Carlisle, the most male-oriented occupations are Computers & Mathematics (100.0%), Education, Arts & Media (100.0%), and Architecture & Engineering (90.7%), while the most female-oriented occupations are Life, Physical & Social Science (100.0%), Education Instruction & Library (86.5%), and Health Technologists (78.0%).
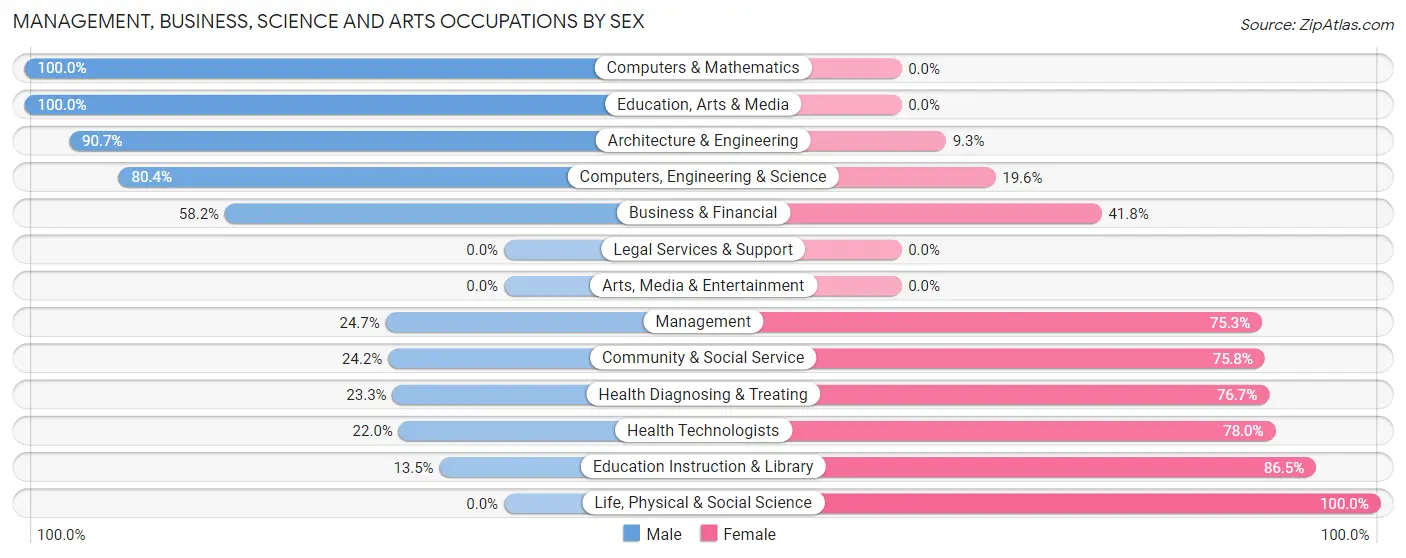
| Occupation | Male | Female |
| Management | 42 (24.7%) | 128 (75.3%) |
| Business & Financial | 39 (58.2%) | 28 (41.8%) |
| Computers, Engineering & Science | 86 (80.4%) | 21 (19.6%) |
| Computers & Mathematics | 8 (100.0%) | 0 (0.0%) |
| Architecture & Engineering | 78 (90.7%) | 8 (9.3%) |
| Life, Physical & Social Science | 0 (0.0%) | 13 (100.0%) |
| Community & Social Service | 43 (24.2%) | 135 (75.8%) |
| Education, Arts & Media | 22 (100.0%) | 0 (0.0%) |
| Legal Services & Support | 0 (0.0%) | 0 (0.0%) |
| Education Instruction & Library | 21 (13.5%) | 135 (86.5%) |
| Arts, Media & Entertainment | 0 (0.0%) | 0 (0.0%) |
| Health Diagnosing & Treating | 47 (23.3%) | 155 (76.7%) |
| Health Technologists | 38 (22.0%) | 135 (78.0%) |
| Total (Category) | 257 (35.5%) | 467 (64.5%) |
| Total (Overall) | 1,481 (54.2%) | 1,249 (45.8%) |
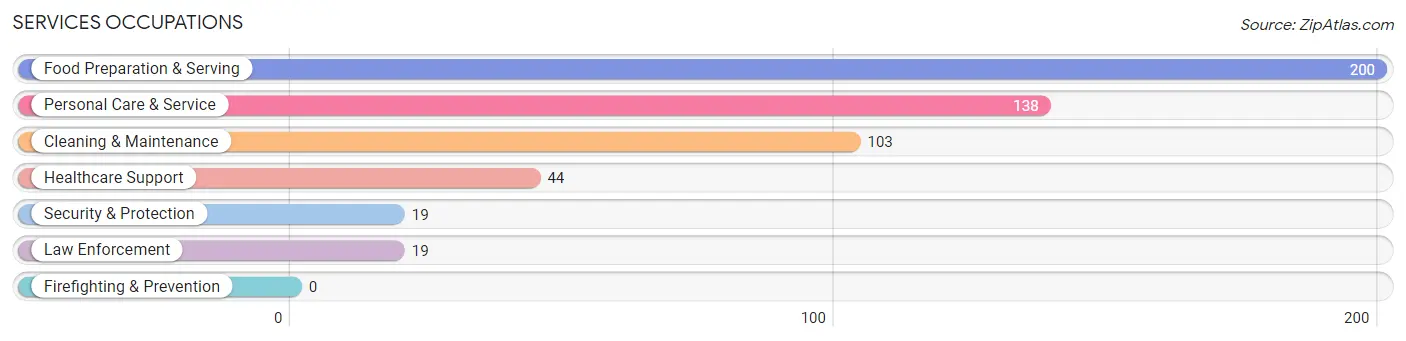
Services Occupations
The most common Services occupations in Carlisle are Food Preparation & Serving (200 | 7.3%), Personal Care & Service (138 | 5.1%), Cleaning & Maintenance (103 | 3.8%), Healthcare Support (44 | 1.6%), and Security & Protection (19 | 0.7%).
Services Occupations by Sex
Within the Services occupations in Carlisle, the most male-oriented occupations are Security & Protection (100.0%), Law Enforcement (100.0%), and Cleaning & Maintenance (83.5%), while the most female-oriented occupations are Personal Care & Service (97.8%), Healthcare Support (79.5%), and Food Preparation & Serving (61.0%).
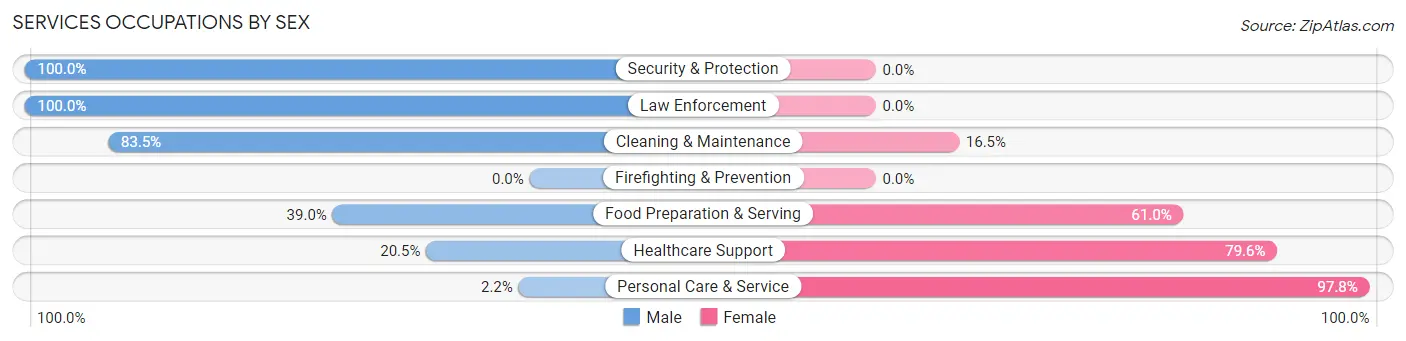
| Occupation | Male | Female |
| Healthcare Support | 9 (20.4%) | 35 (79.5%) |
| Security & Protection | 19 (100.0%) | 0 (0.0%) |
| Firefighting & Prevention | 0 (0.0%) | 0 (0.0%) |
| Law Enforcement | 19 (100.0%) | 0 (0.0%) |
| Food Preparation & Serving | 78 (39.0%) | 122 (61.0%) |
| Cleaning & Maintenance | 86 (83.5%) | 17 (16.5%) |
| Personal Care & Service | 3 (2.2%) | 135 (97.8%) |
| Total (Category) | 195 (38.7%) | 309 (61.3%) |
| Total (Overall) | 1,481 (54.2%) | 1,249 (45.8%) |
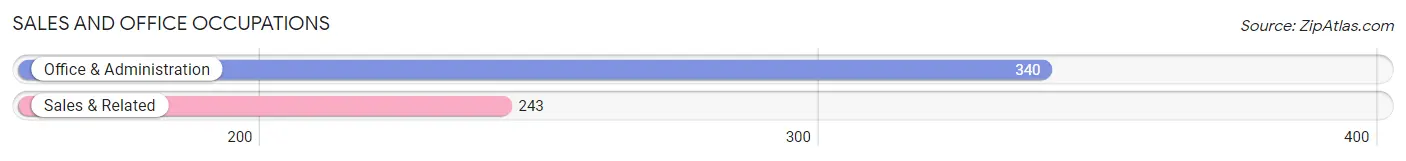
Sales and Office Occupations
The most common Sales and Office occupations in Carlisle are Office & Administration (340 | 12.4%), and Sales & Related (243 | 8.9%).
Sales and Office Occupations by Sex
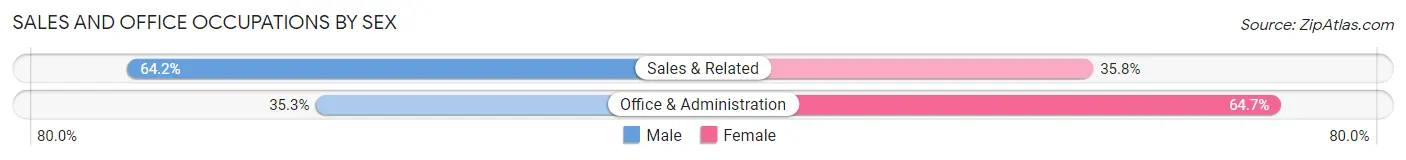
| Occupation | Male | Female |
| Sales & Related | 156 (64.2%) | 87 (35.8%) |
| Office & Administration | 120 (35.3%) | 220 (64.7%) |
| Total (Category) | 276 (47.3%) | 307 (52.7%) |
| Total (Overall) | 1,481 (54.2%) | 1,249 (45.8%) |
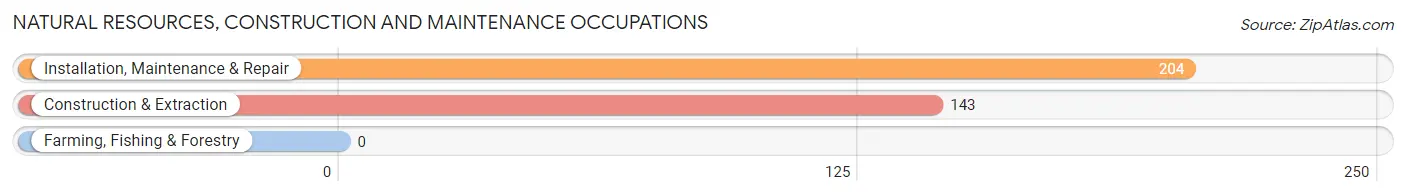
Natural Resources, Construction and Maintenance Occupations
The most common Natural Resources, Construction and Maintenance occupations in Carlisle are Installation, Maintenance & Repair (204 | 7.5%), and Construction & Extraction (143 | 5.2%).
Natural Resources, Construction and Maintenance Occupations by Sex
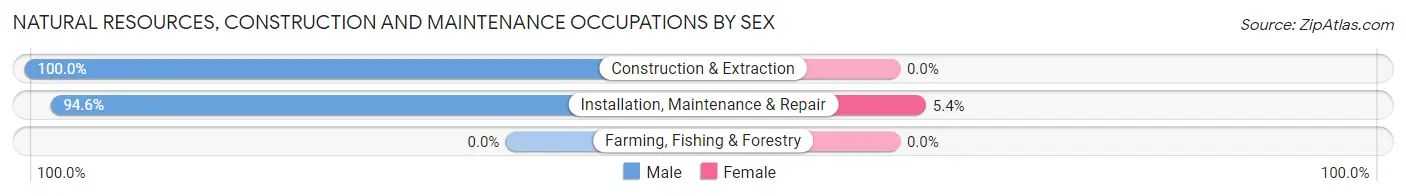
| Occupation | Male | Female |
| Farming, Fishing & Forestry | 0 (0.0%) | 0 (0.0%) |
| Construction & Extraction | 143 (100.0%) | 0 (0.0%) |
| Installation, Maintenance & Repair | 193 (94.6%) | 11 (5.4%) |
| Total (Category) | 336 (96.8%) | 11 (3.2%) |
| Total (Overall) | 1,481 (54.2%) | 1,249 (45.8%) |
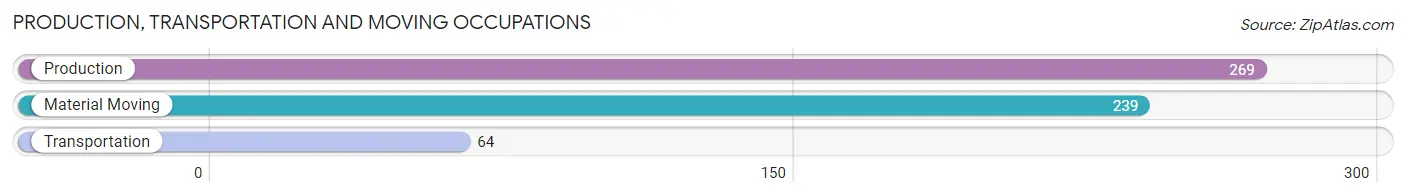
Production, Transportation and Moving Occupations
The most common Production, Transportation and Moving occupations in Carlisle are Production (269 | 9.9%), Material Moving (239 | 8.7%), and Transportation (64 | 2.3%).
Production, Transportation and Moving Occupations by Sex
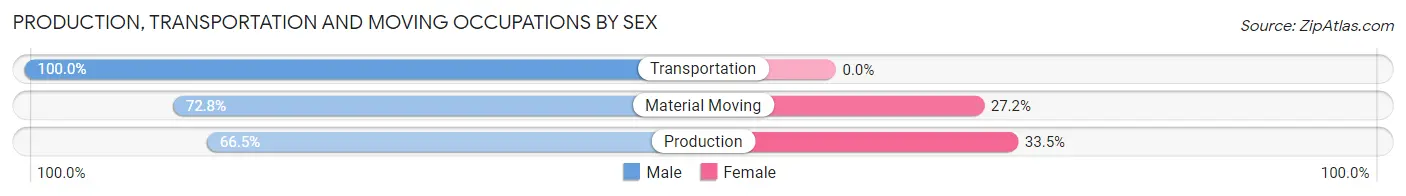
| Occupation | Male | Female |
| Production | 179 (66.5%) | 90 (33.5%) |
| Transportation | 64 (100.0%) | 0 (0.0%) |
| Material Moving | 174 (72.8%) | 65 (27.2%) |
| Total (Category) | 417 (72.9%) | 155 (27.1%) |
| Total (Overall) | 1,481 (54.2%) | 1,249 (45.8%) |
Employment Industries by Sex in Carlisle
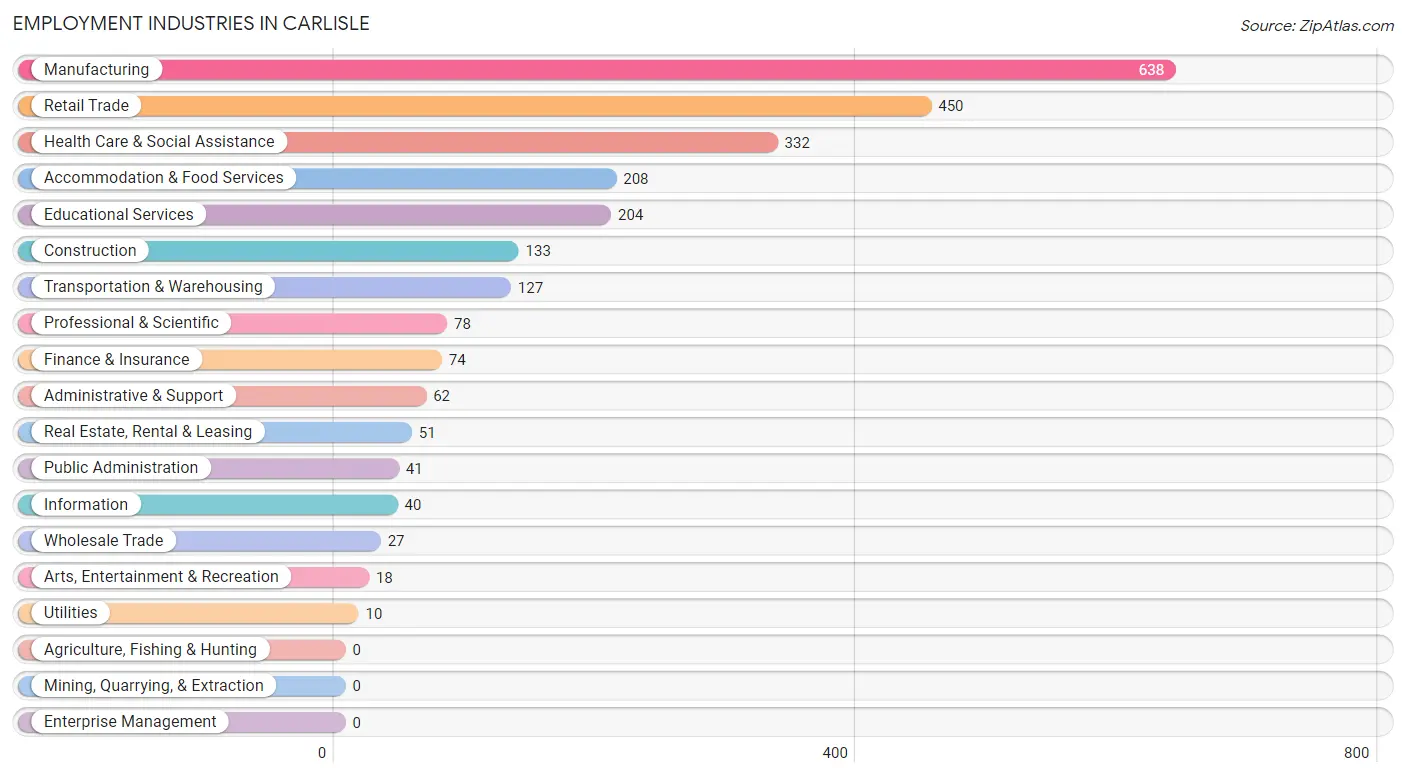
Employment Industries in Carlisle
The major employment industries in Carlisle include Manufacturing (638 | 23.4%), Retail Trade (450 | 16.5%), Health Care & Social Assistance (332 | 12.2%), Accommodation & Food Services (208 | 7.6%), and Educational Services (204 | 7.5%).
Employment Industries by Sex in Carlisle
The Carlisle industries that see more men than women are Construction (100.0%), Wholesale Trade (100.0%), and Utilities (100.0%), whereas the industries that tend to have a higher number of women are Real Estate, Rental & Leasing (100.0%), Educational Services (84.8%), and Finance & Insurance (81.1%).
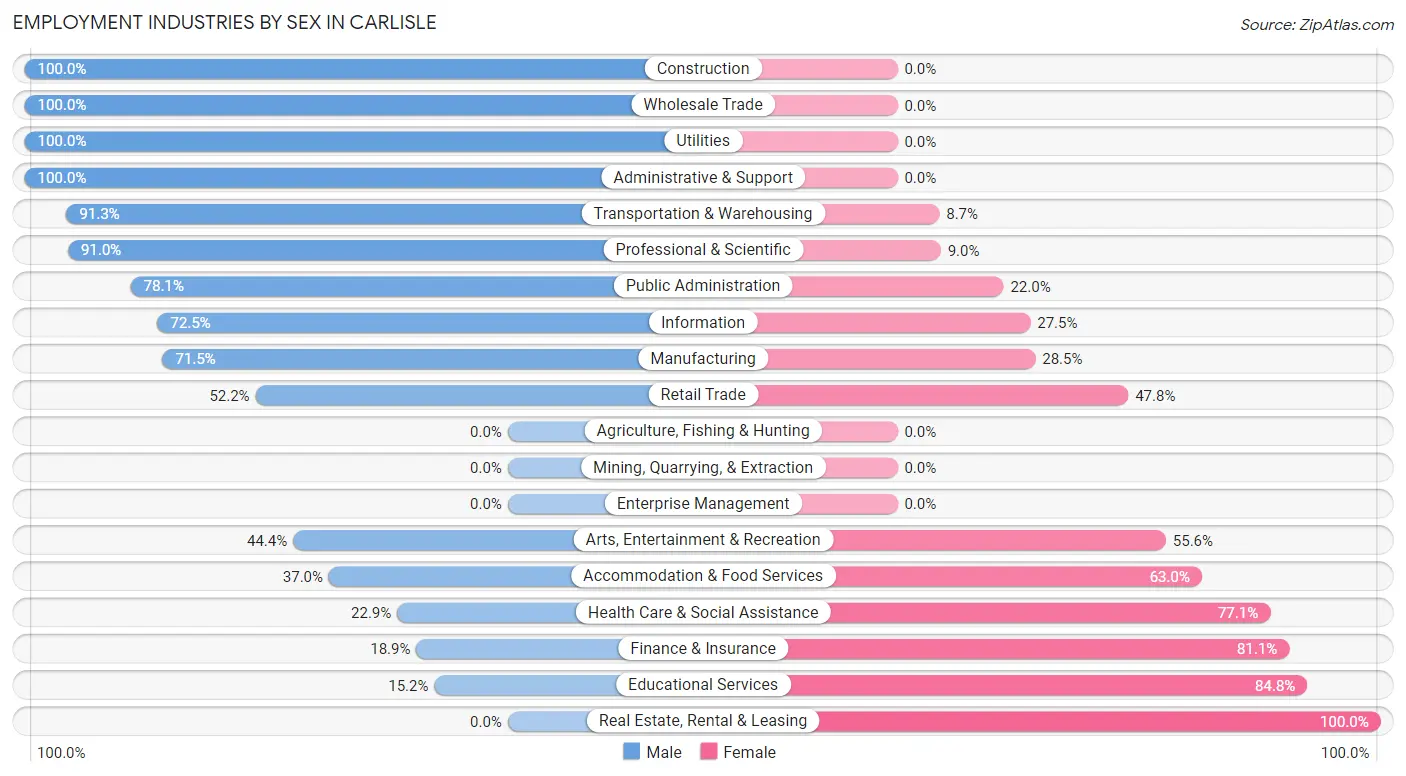
| Industry | Male | Female |
| Agriculture, Fishing & Hunting | 0 (0.0%) | 0 (0.0%) |
| Mining, Quarrying, & Extraction | 0 (0.0%) | 0 (0.0%) |
| Construction | 133 (100.0%) | 0 (0.0%) |
| Manufacturing | 456 (71.5%) | 182 (28.5%) |
| Wholesale Trade | 27 (100.0%) | 0 (0.0%) |
| Retail Trade | 235 (52.2%) | 215 (47.8%) |
| Transportation & Warehousing | 116 (91.3%) | 11 (8.7%) |
| Utilities | 10 (100.0%) | 0 (0.0%) |
| Information | 29 (72.5%) | 11 (27.5%) |
| Finance & Insurance | 14 (18.9%) | 60 (81.1%) |
| Real Estate, Rental & Leasing | 0 (0.0%) | 51 (100.0%) |
| Professional & Scientific | 71 (91.0%) | 7 (9.0%) |
| Enterprise Management | 0 (0.0%) | 0 (0.0%) |
| Administrative & Support | 62 (100.0%) | 0 (0.0%) |
| Educational Services | 31 (15.2%) | 173 (84.8%) |
| Health Care & Social Assistance | 76 (22.9%) | 256 (77.1%) |
| Arts, Entertainment & Recreation | 8 (44.4%) | 10 (55.6%) |
| Accommodation & Food Services | 77 (37.0%) | 131 (63.0%) |
| Public Administration | 32 (78.0%) | 9 (22.0%) |
| Total | 1,481 (54.2%) | 1,249 (45.8%) |
Education in Carlisle
School Enrollment in Carlisle
The most common levels of schooling among the 1,072 students in Carlisle are high school (362 | 33.8%), elementary school (245 | 22.9%), and college / undergraduate (201 | 18.8%).
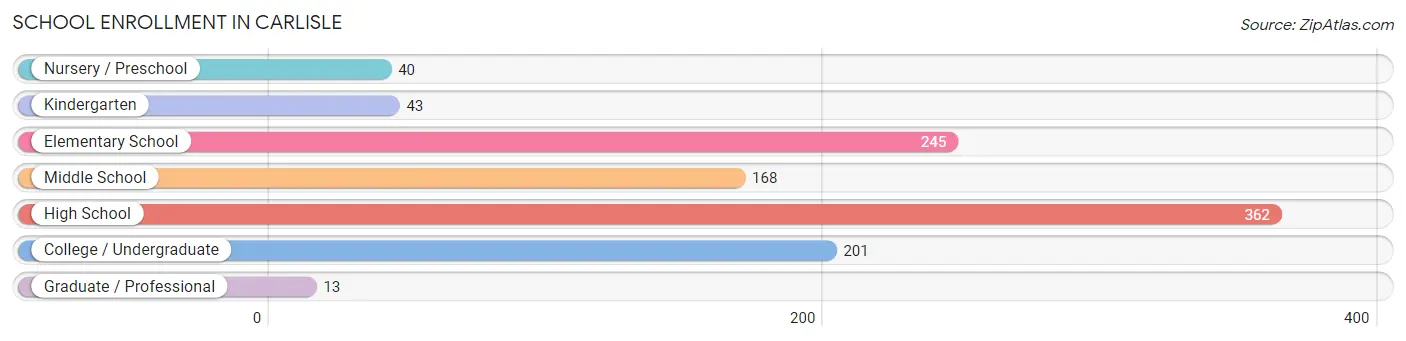
| School Level | # Students | % Students |
| Nursery / Preschool | 40 | 3.7% |
| Kindergarten | 43 | 4.0% |
| Elementary School | 245 | 22.9% |
| Middle School | 168 | 15.7% |
| High School | 362 | 33.8% |
| College / Undergraduate | 201 | 18.8% |
| Graduate / Professional | 13 | 1.2% |
| Total | 1,072 | 100.0% |
School Enrollment by Age by Funding Source in Carlisle
Out of a total of 1,072 students who are enrolled in schools in Carlisle, 85 (7.9%) attend a private institution, while the remaining 987 (92.1%) are enrolled in public schools. The age group of 35 years and over has the highest likelihood of being enrolled in private schools, with 16 (25.8% in the age bracket) enrolled. Conversely, the age group of 3 to 4 year olds has the lowest likelihood of being enrolled in a private school, with 26 (100.0% in the age bracket) attending a public institution.
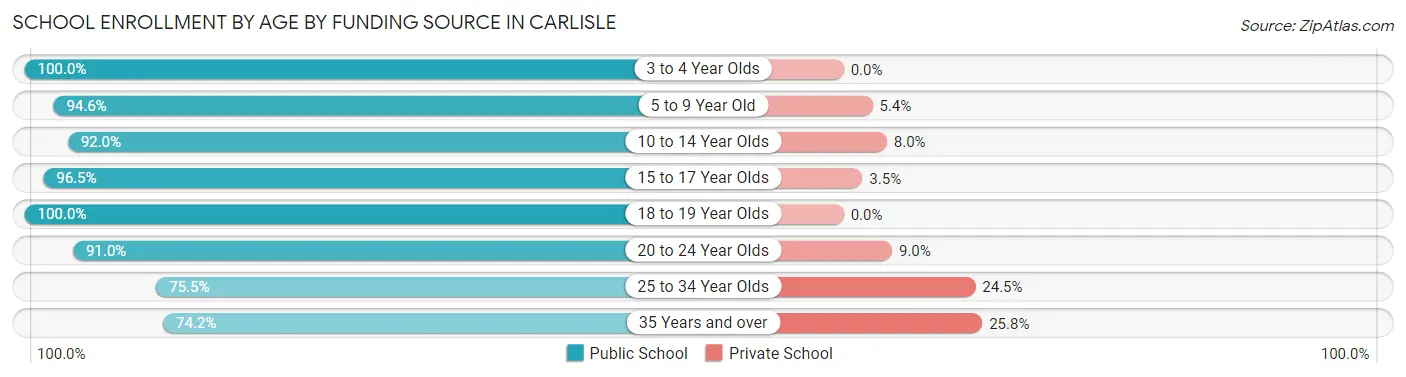
| Age Bracket | Public School | Private School |
| 3 to 4 Year Olds | 26 (100.0%) | 0 (0.0%) |
| 5 to 9 Year Old | 246 (94.6%) | 14 (5.4%) |
| 10 to 14 Year Olds | 263 (92.0%) | 23 (8.0%) |
| 15 to 17 Year Olds | 249 (96.5%) | 9 (3.5%) |
| 18 to 19 Year Olds | 16 (100.0%) | 0 (0.0%) |
| 20 to 24 Year Olds | 101 (91.0%) | 10 (9.0%) |
| 25 to 34 Year Olds | 40 (75.5%) | 13 (24.5%) |
| 35 Years and over | 46 (74.2%) | 16 (25.8%) |
| Total | 987 (92.1%) | 85 (7.9%) |
Educational Attainment by Field of Study in Carlisle
Education (122 | 22.2%), science & technology (101 | 18.4%), business (91 | 16.6%), communications (57 | 10.4%), and physical & health sciences (53 | 9.6%) are the most common fields of study among 550 individuals in Carlisle who have obtained a bachelor's degree or higher.
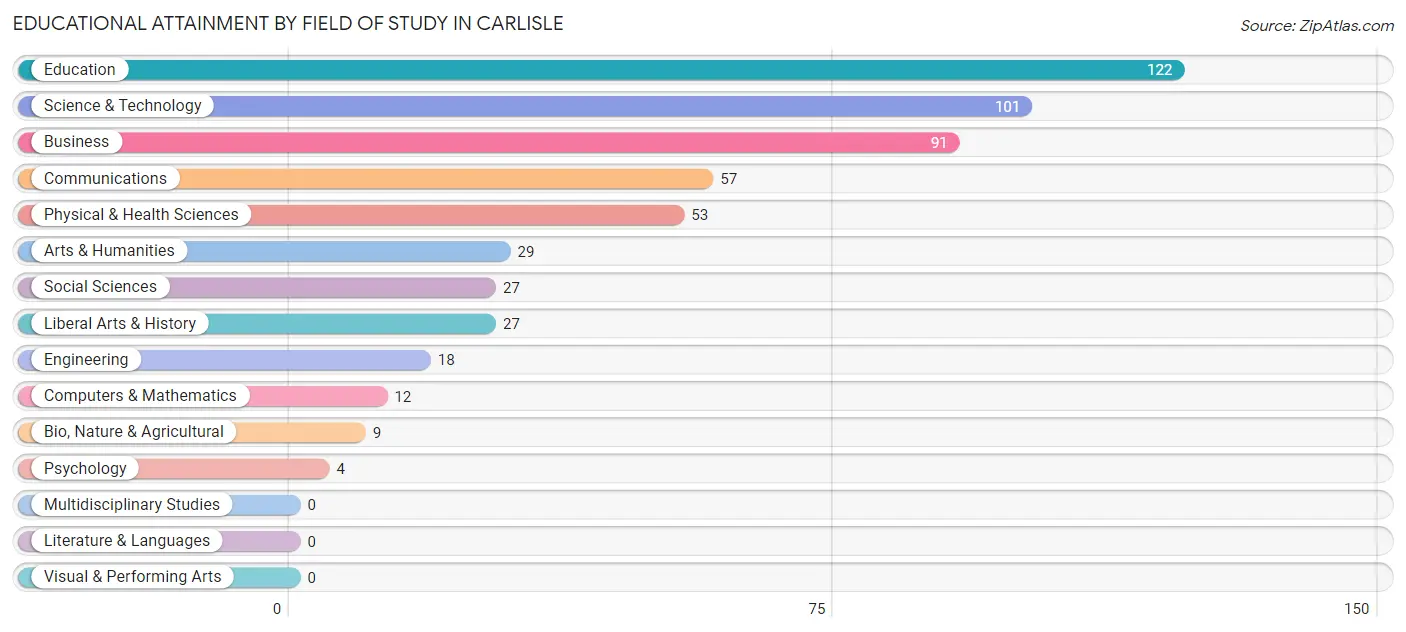
| Field of Study | # Graduates | % Graduates |
| Computers & Mathematics | 12 | 2.2% |
| Bio, Nature & Agricultural | 9 | 1.6% |
| Physical & Health Sciences | 53 | 9.6% |
| Psychology | 4 | 0.7% |
| Social Sciences | 27 | 4.9% |
| Engineering | 18 | 3.3% |
| Multidisciplinary Studies | 0 | 0.0% |
| Science & Technology | 101 | 18.4% |
| Business | 91 | 16.6% |
| Education | 122 | 22.2% |
| Literature & Languages | 0 | 0.0% |
| Liberal Arts & History | 27 | 4.9% |
| Visual & Performing Arts | 0 | 0.0% |
| Communications | 57 | 10.4% |
| Arts & Humanities | 29 | 5.3% |
| Total | 550 | 100.0% |
Transportation & Commute in Carlisle
Vehicle Availability by Sex in Carlisle
The most prevalent vehicle ownership categories in Carlisle are males with 2 vehicles (669, accounting for 46.9%) and females with 2 vehicles (395, making up 56.8%).
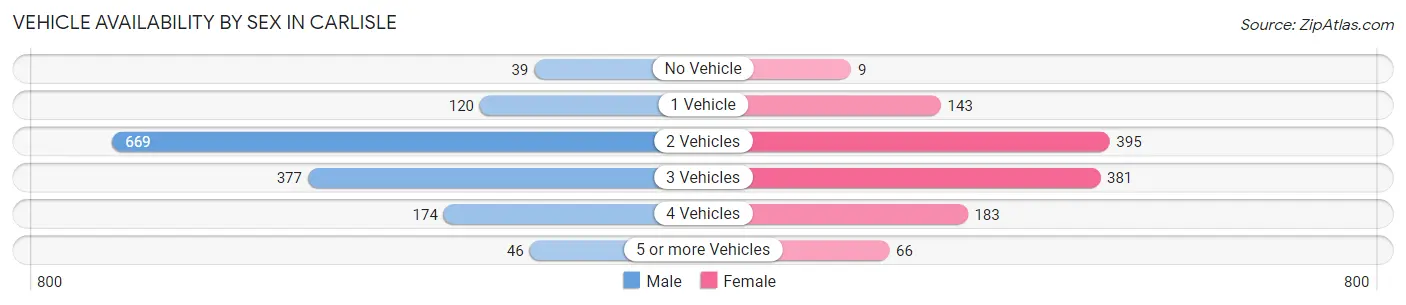
| Vehicles Available | Male | Female |
| No Vehicle | 39 (2.7%) | 9 (0.8%) |
| 1 Vehicle | 120 (8.4%) | 143 (12.1%) |
| 2 Vehicles | 669 (46.9%) | 395 (33.6%) |
| 3 Vehicles | 377 (26.5%) | 381 (32.4%) |
| 4 Vehicles | 174 (12.2%) | 183 (15.5%) |
| 5 or more Vehicles | 46 (3.2%) | 66 (5.6%) |
| Total | 1,425 (100.0%) | 1,177 (100.0%) |
Commute Time in Carlisle
The most frequently occuring commute durations in Carlisle are 30 to 34 minutes (531 commuters, 21.2%), 10 to 14 minutes (451 commuters, 18.0%), and 15 to 19 minutes (438 commuters, 17.5%).
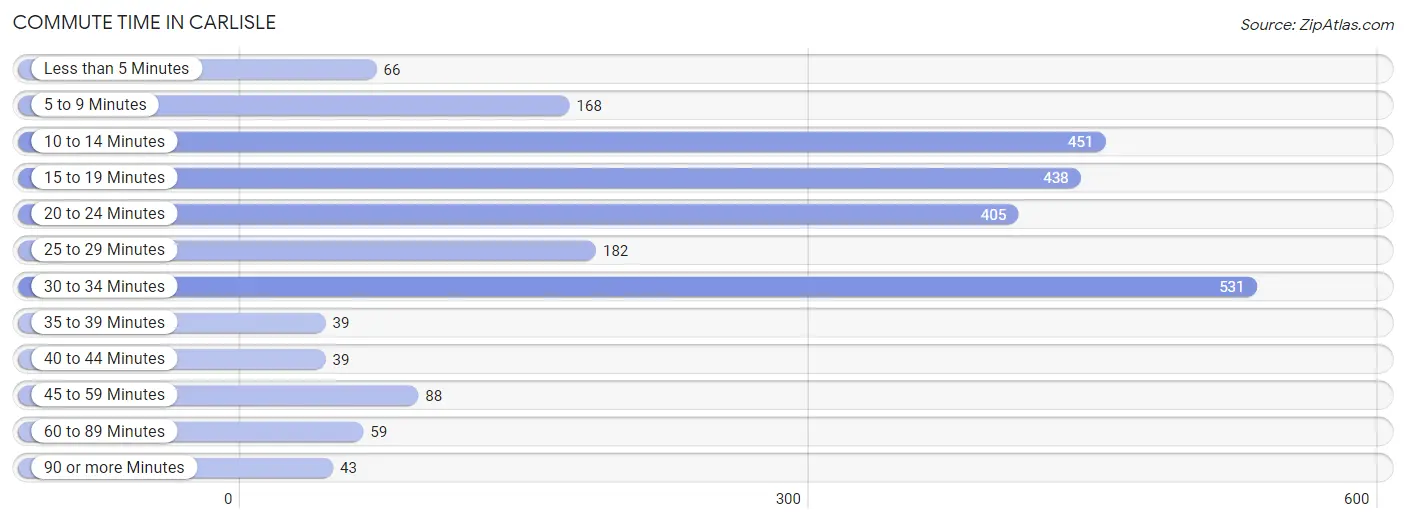
| Commute Time | # Commuters | % Commuters |
| Less than 5 Minutes | 66 | 2.6% |
| 5 to 9 Minutes | 168 | 6.7% |
| 10 to 14 Minutes | 451 | 18.0% |
| 15 to 19 Minutes | 438 | 17.5% |
| 20 to 24 Minutes | 405 | 16.1% |
| 25 to 29 Minutes | 182 | 7.2% |
| 30 to 34 Minutes | 531 | 21.2% |
| 35 to 39 Minutes | 39 | 1.5% |
| 40 to 44 Minutes | 39 | 1.5% |
| 45 to 59 Minutes | 88 | 3.5% |
| 60 to 89 Minutes | 59 | 2.4% |
| 90 or more Minutes | 43 | 1.7% |
Commute Time by Sex in Carlisle
The most common commute times in Carlisle are 30 to 34 minutes (410 commuters, 29.0%) for males and 15 to 19 minutes (207 commuters, 18.9%) for females.
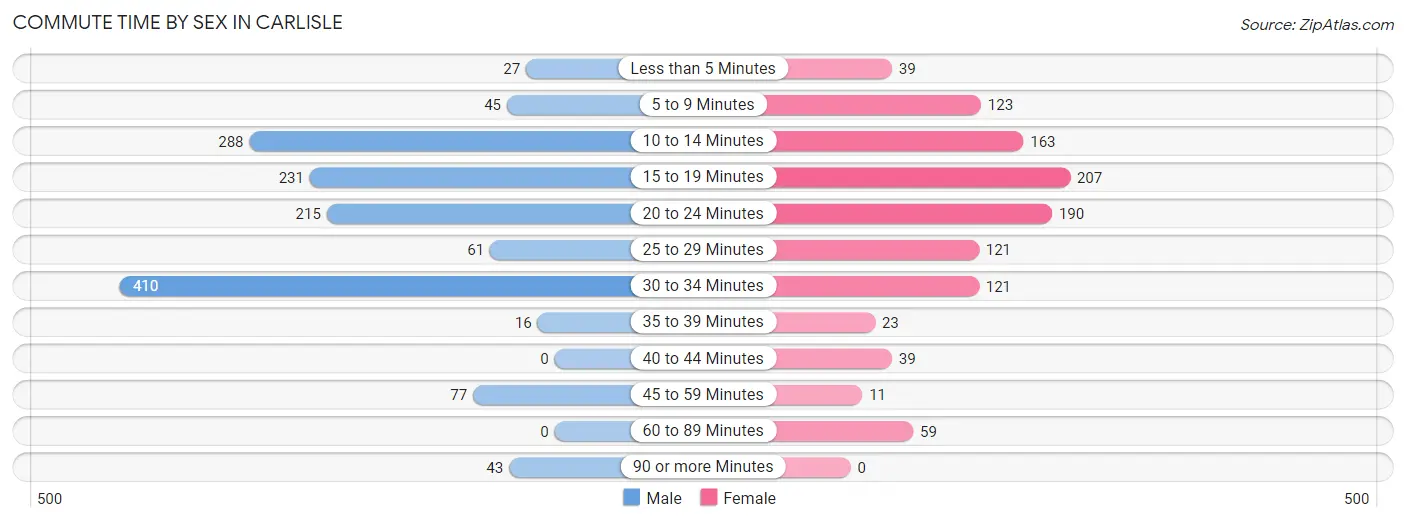
| Commute Time | Male | Female |
| Less than 5 Minutes | 27 (1.9%) | 39 (3.6%) |
| 5 to 9 Minutes | 45 (3.2%) | 123 (11.2%) |
| 10 to 14 Minutes | 288 (20.4%) | 163 (14.9%) |
| 15 to 19 Minutes | 231 (16.4%) | 207 (18.9%) |
| 20 to 24 Minutes | 215 (15.2%) | 190 (17.3%) |
| 25 to 29 Minutes | 61 (4.3%) | 121 (11.0%) |
| 30 to 34 Minutes | 410 (29.0%) | 121 (11.0%) |
| 35 to 39 Minutes | 16 (1.1%) | 23 (2.1%) |
| 40 to 44 Minutes | 0 (0.0%) | 39 (3.6%) |
| 45 to 59 Minutes | 77 (5.4%) | 11 (1.0%) |
| 60 to 89 Minutes | 0 (0.0%) | 59 (5.4%) |
| 90 or more Minutes | 43 (3.0%) | 0 (0.0%) |
Time of Departure to Work by Sex in Carlisle
The most frequent times of departure to work in Carlisle are 4:00 PM to 11:59 PM (235, 16.6%) for males and 7:00 AM to 7:29 AM (194, 17.7%) for females.
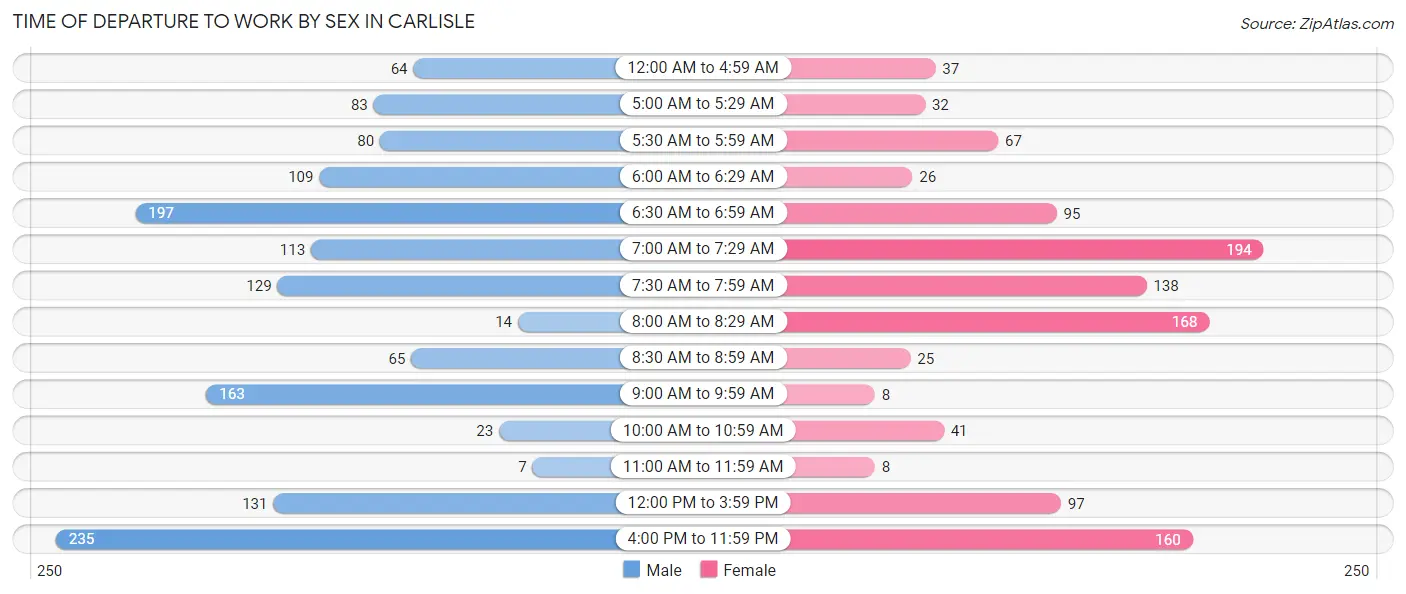
| Time of Departure | Male | Female |
| 12:00 AM to 4:59 AM | 64 (4.5%) | 37 (3.4%) |
| 5:00 AM to 5:29 AM | 83 (5.9%) | 32 (2.9%) |
| 5:30 AM to 5:59 AM | 80 (5.7%) | 67 (6.1%) |
| 6:00 AM to 6:29 AM | 109 (7.7%) | 26 (2.4%) |
| 6:30 AM to 6:59 AM | 197 (13.9%) | 95 (8.7%) |
| 7:00 AM to 7:29 AM | 113 (8.0%) | 194 (17.7%) |
| 7:30 AM to 7:59 AM | 129 (9.1%) | 138 (12.6%) |
| 8:00 AM to 8:29 AM | 14 (1.0%) | 168 (15.3%) |
| 8:30 AM to 8:59 AM | 65 (4.6%) | 25 (2.3%) |
| 9:00 AM to 9:59 AM | 163 (11.5%) | 8 (0.7%) |
| 10:00 AM to 10:59 AM | 23 (1.6%) | 41 (3.7%) |
| 11:00 AM to 11:59 AM | 7 (0.5%) | 8 (0.7%) |
| 12:00 PM to 3:59 PM | 131 (9.3%) | 97 (8.8%) |
| 4:00 PM to 11:59 PM | 235 (16.6%) | 160 (14.6%) |
| Total | 1,413 (100.0%) | 1,096 (100.0%) |
Housing Occupancy in Carlisle
Occupancy by Ownership in Carlisle
Of the total 2,231 dwellings in Carlisle, owner-occupied units account for 1,607 (72.0%), while renter-occupied units make up 624 (28.0%).
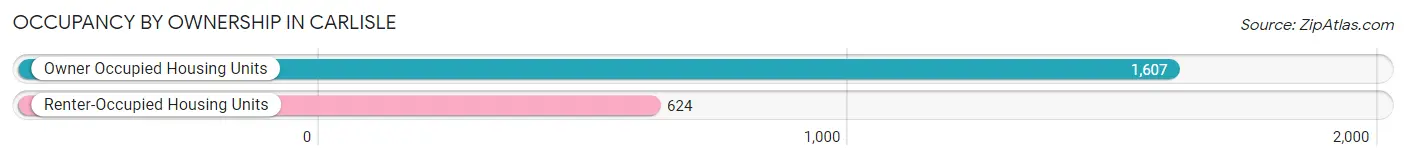
| Occupancy | # Housing Units | % Housing Units |
| Owner Occupied Housing Units | 1,607 | 72.0% |
| Renter-Occupied Housing Units | 624 | 28.0% |
| Total Occupied Housing Units | 2,231 | 100.0% |
Occupancy by Household Size in Carlisle
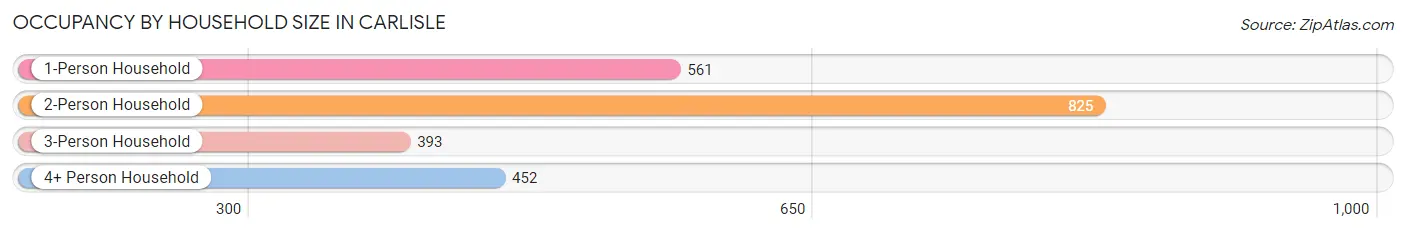
| Household Size | # Housing Units | % Housing Units |
| 1-Person Household | 561 | 25.2% |
| 2-Person Household | 825 | 37.0% |
| 3-Person Household | 393 | 17.6% |
| 4+ Person Household | 452 | 20.3% |
| Total Housing Units | 2,231 | 100.0% |
Occupancy by Ownership by Household Size in Carlisle
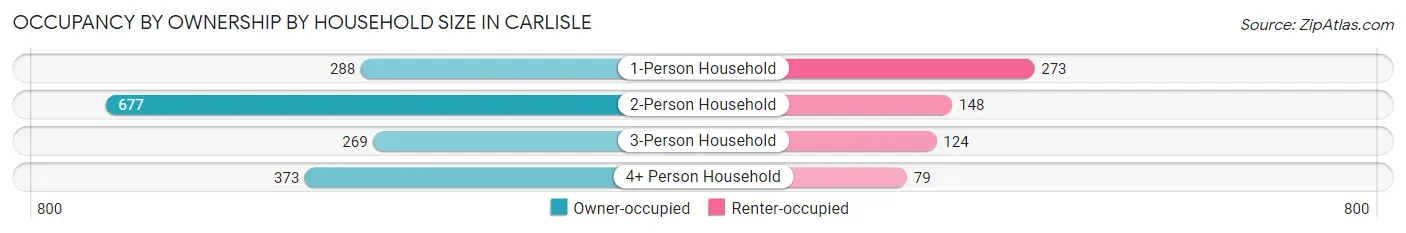
| Household Size | Owner-occupied | Renter-occupied |
| 1-Person Household | 288 (51.3%) | 273 (48.7%) |
| 2-Person Household | 677 (82.1%) | 148 (17.9%) |
| 3-Person Household | 269 (68.4%) | 124 (31.6%) |
| 4+ Person Household | 373 (82.5%) | 79 (17.5%) |
| Total Housing Units | 1,607 (72.0%) | 624 (28.0%) |
Occupancy by Educational Attainment in Carlisle
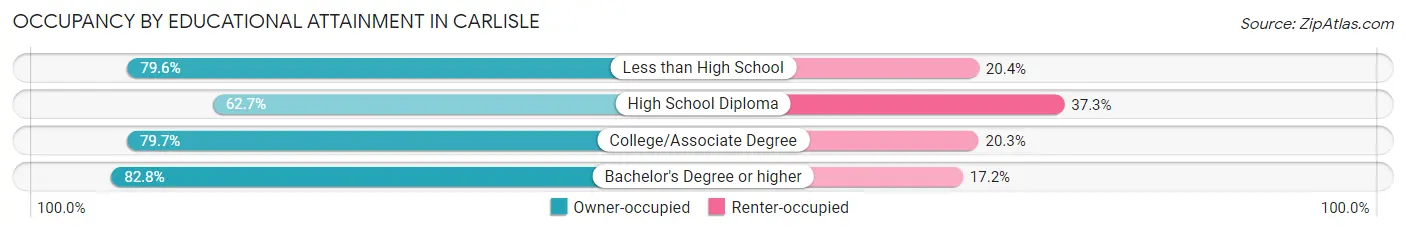
| Household Size | Owner-occupied | Renter-occupied |
| Less than High School | 129 (79.6%) | 33 (20.4%) |
| High School Diploma | 662 (62.7%) | 394 (37.3%) |
| College/Associate Degree | 585 (79.7%) | 149 (20.3%) |
| Bachelor's Degree or higher | 231 (82.8%) | 48 (17.2%) |
Occupancy by Age of Householder in Carlisle
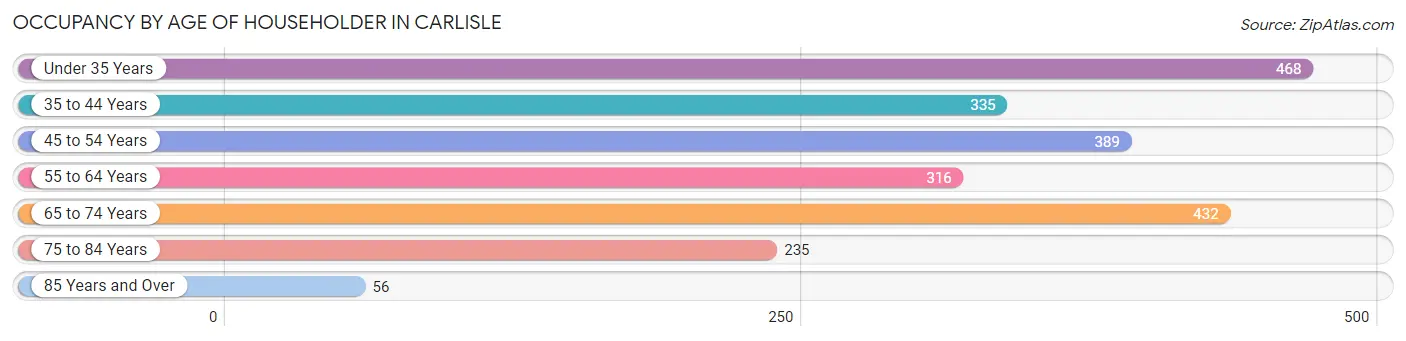
| Age Bracket | # Households | % Households |
| Under 35 Years | 468 | 21.0% |
| 35 to 44 Years | 335 | 15.0% |
| 45 to 54 Years | 389 | 17.4% |
| 55 to 64 Years | 316 | 14.2% |
| 65 to 74 Years | 432 | 19.4% |
| 75 to 84 Years | 235 | 10.5% |
| 85 Years and Over | 56 | 2.5% |
| Total | 2,231 | 100.0% |
Housing Finances in Carlisle
Median Income by Occupancy in Carlisle
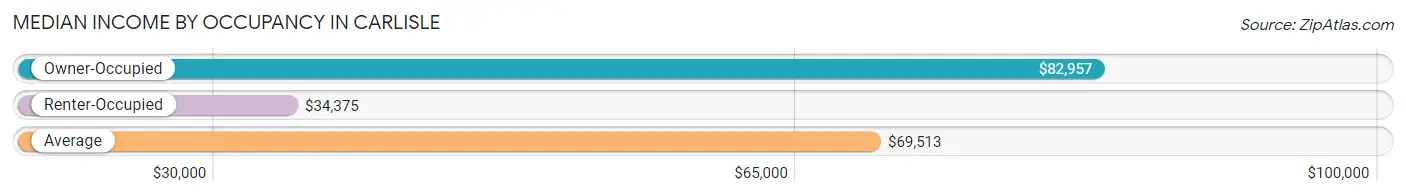
| Occupancy Type | # Households | Median Income |
| Owner-Occupied | 1,607 (72.0%) | $82,957 |
| Renter-Occupied | 624 (28.0%) | $34,375 |
| Average | 2,231 (100.0%) | $69,513 |
Occupancy by Householder Income Bracket in Carlisle
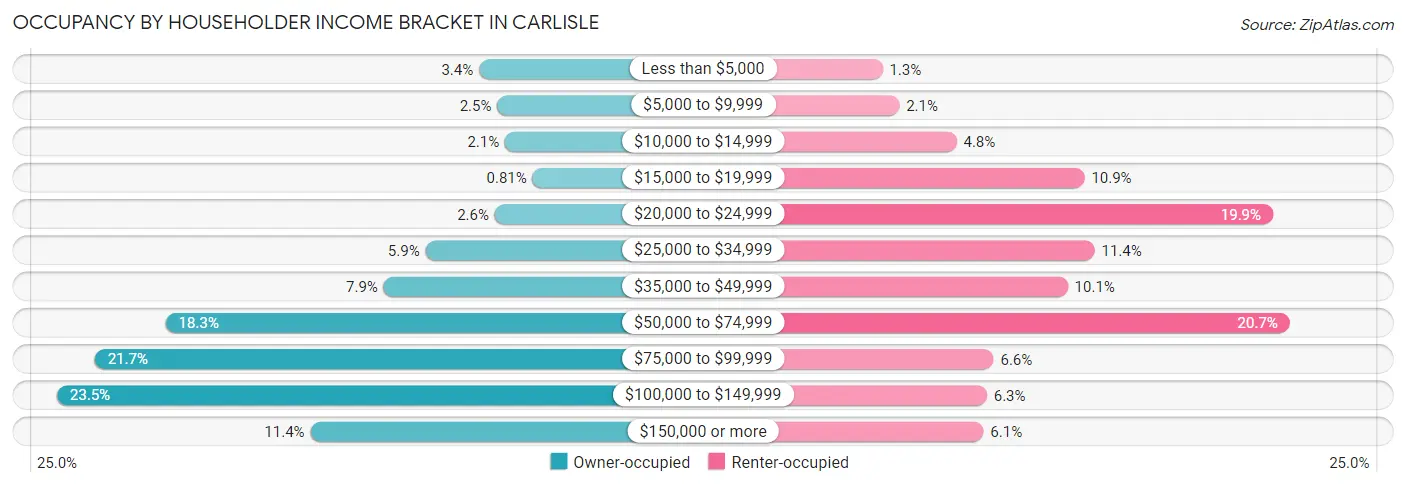
| Income Bracket | Owner-occupied | Renter-occupied |
| Less than $5,000 | 54 (3.4%) | 8 (1.3%) |
| $5,000 to $9,999 | 40 (2.5%) | 13 (2.1%) |
| $10,000 to $14,999 | 34 (2.1%) | 30 (4.8%) |
| $15,000 to $19,999 | 13 (0.8%) | 68 (10.9%) |
| $20,000 to $24,999 | 42 (2.6%) | 124 (19.9%) |
| $25,000 to $34,999 | 95 (5.9%) | 71 (11.4%) |
| $35,000 to $49,999 | 127 (7.9%) | 63 (10.1%) |
| $50,000 to $74,999 | 294 (18.3%) | 129 (20.7%) |
| $75,000 to $99,999 | 348 (21.7%) | 41 (6.6%) |
| $100,000 to $149,999 | 377 (23.5%) | 39 (6.2%) |
| $150,000 or more | 183 (11.4%) | 38 (6.1%) |
| Total | 1,607 (100.0%) | 624 (100.0%) |
Monthly Housing Cost Tiers in Carlisle
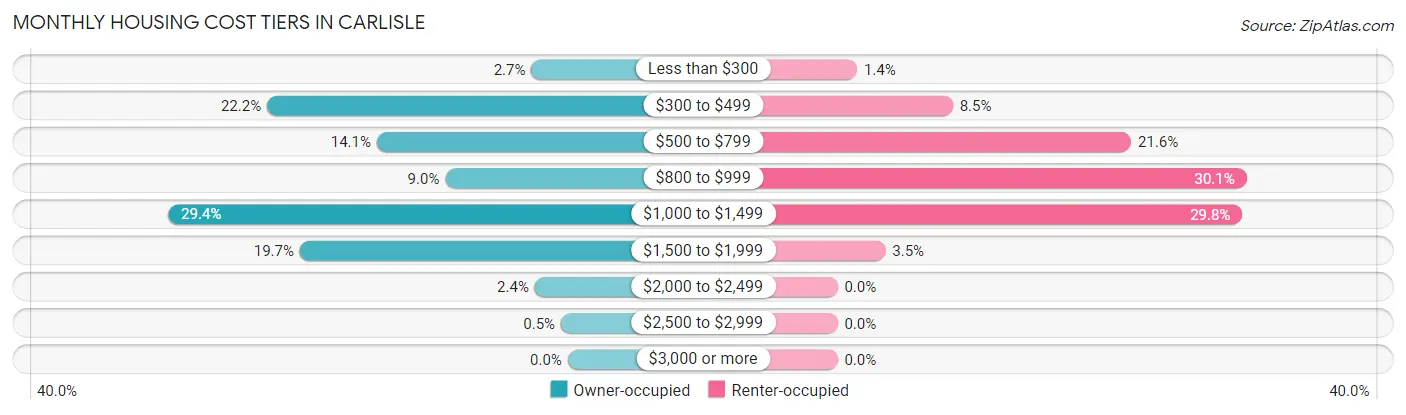
| Monthly Cost | Owner-occupied | Renter-occupied |
| Less than $300 | 43 (2.7%) | 9 (1.4%) |
| $300 to $499 | 356 (22.2%) | 53 (8.5%) |
| $500 to $799 | 226 (14.1%) | 135 (21.6%) |
| $800 to $999 | 145 (9.0%) | 188 (30.1%) |
| $1,000 to $1,499 | 473 (29.4%) | 186 (29.8%) |
| $1,500 to $1,999 | 317 (19.7%) | 22 (3.5%) |
| $2,000 to $2,499 | 39 (2.4%) | 0 (0.0%) |
| $2,500 to $2,999 | 8 (0.5%) | 0 (0.0%) |
| $3,000 or more | 0 (0.0%) | 0 (0.0%) |
| Total | 1,607 (100.0%) | 624 (100.0%) |
Physical Housing Characteristics in Carlisle
Housing Structures in Carlisle
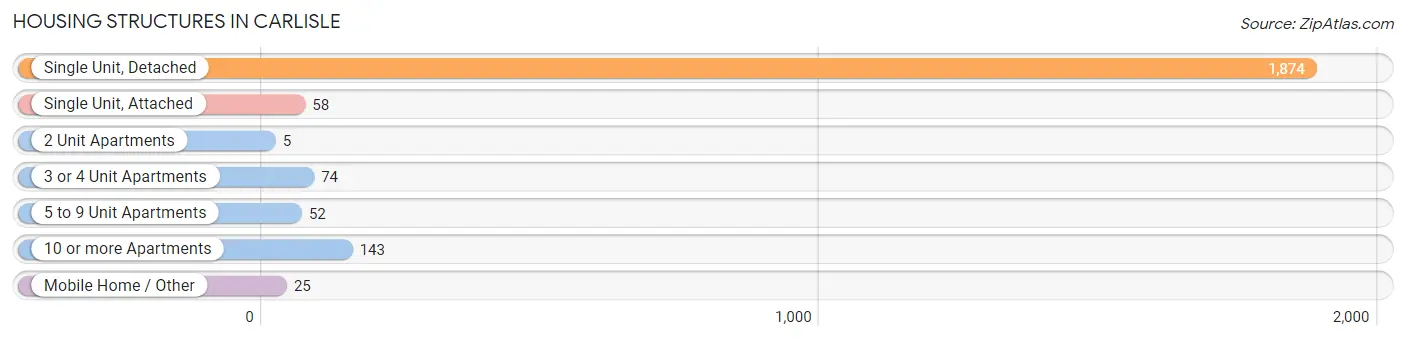
| Structure Type | # Housing Units | % Housing Units |
| Single Unit, Detached | 1,874 | 84.0% |
| Single Unit, Attached | 58 | 2.6% |
| 2 Unit Apartments | 5 | 0.2% |
| 3 or 4 Unit Apartments | 74 | 3.3% |
| 5 to 9 Unit Apartments | 52 | 2.3% |
| 10 or more Apartments | 143 | 6.4% |
| Mobile Home / Other | 25 | 1.1% |
| Total | 2,231 | 100.0% |
Housing Structures by Occupancy in Carlisle
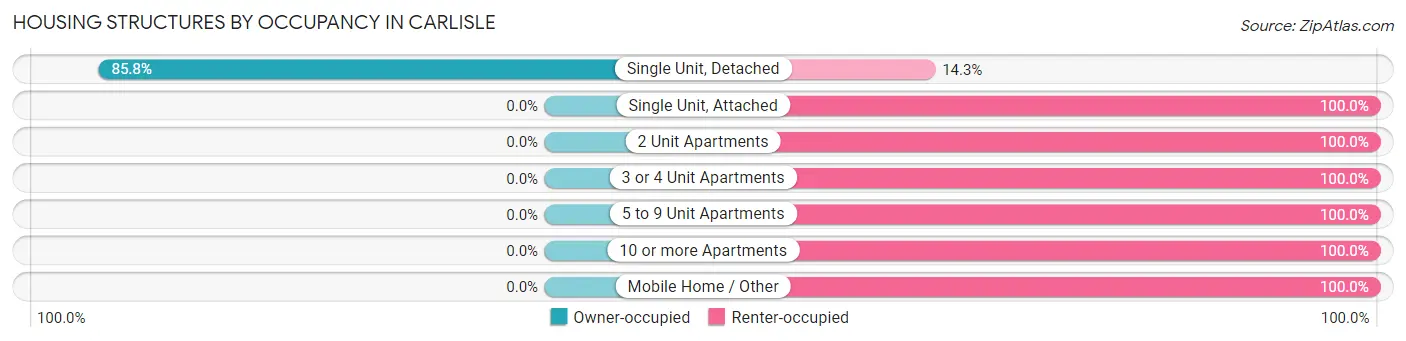
| Structure Type | Owner-occupied | Renter-occupied |
| Single Unit, Detached | 1,607 (85.8%) | 267 (14.2%) |
| Single Unit, Attached | 0 (0.0%) | 58 (100.0%) |
| 2 Unit Apartments | 0 (0.0%) | 5 (100.0%) |
| 3 or 4 Unit Apartments | 0 (0.0%) | 74 (100.0%) |
| 5 to 9 Unit Apartments | 0 (0.0%) | 52 (100.0%) |
| 10 or more Apartments | 0 (0.0%) | 143 (100.0%) |
| Mobile Home / Other | 0 (0.0%) | 25 (100.0%) |
| Total | 1,607 (72.0%) | 624 (28.0%) |
Housing Structures by Number of Rooms in Carlisle
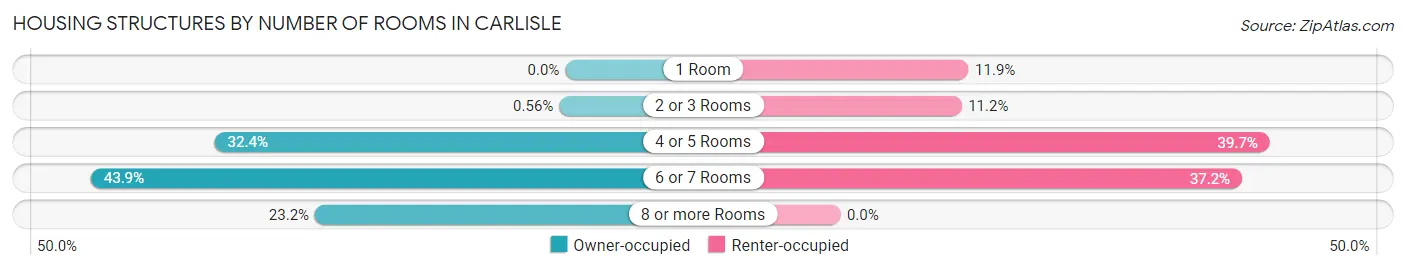
| Number of Rooms | Owner-occupied | Renter-occupied |
| 1 Room | 0 (0.0%) | 74 (11.9%) |
| 2 or 3 Rooms | 9 (0.6%) | 70 (11.2%) |
| 4 or 5 Rooms | 521 (32.4%) | 248 (39.7%) |
| 6 or 7 Rooms | 705 (43.9%) | 232 (37.2%) |
| 8 or more Rooms | 372 (23.2%) | 0 (0.0%) |
| Total | 1,607 (100.0%) | 624 (100.0%) |
Housing Structure by Heating Type in Carlisle
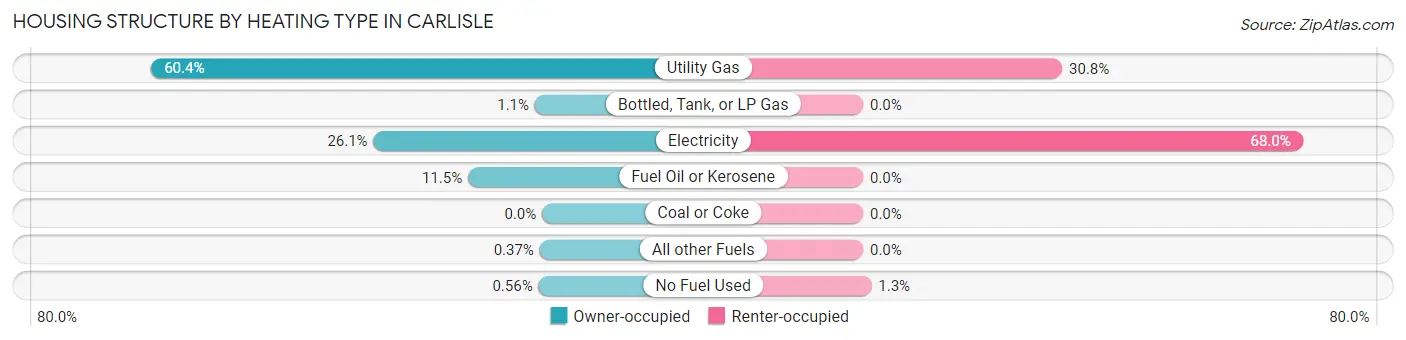
| Heating Type | Owner-occupied | Renter-occupied |
| Utility Gas | 971 (60.4%) | 192 (30.8%) |
| Bottled, Tank, or LP Gas | 18 (1.1%) | 0 (0.0%) |
| Electricity | 419 (26.1%) | 424 (67.9%) |
| Fuel Oil or Kerosene | 184 (11.5%) | 0 (0.0%) |
| Coal or Coke | 0 (0.0%) | 0 (0.0%) |
| All other Fuels | 6 (0.4%) | 0 (0.0%) |
| No Fuel Used | 9 (0.6%) | 8 (1.3%) |
| Total | 1,607 (100.0%) | 624 (100.0%) |
Household Vehicle Usage in Carlisle
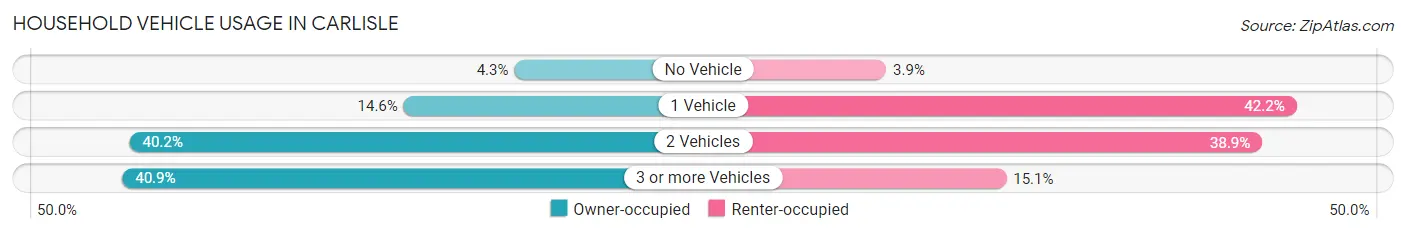
| Vehicles per Household | Owner-occupied | Renter-occupied |
| No Vehicle | 69 (4.3%) | 24 (3.8%) |
| 1 Vehicle | 235 (14.6%) | 263 (42.1%) |
| 2 Vehicles | 646 (40.2%) | 243 (38.9%) |
| 3 or more Vehicles | 657 (40.9%) | 94 (15.1%) |
| Total | 1,607 (100.0%) | 624 (100.0%) |
Real Estate & Mortgages in Carlisle
Real Estate and Mortgage Overview in Carlisle
| Characteristic | Without Mortgage | With Mortgage |
| Housing Units | 591 | 1,016 |
| Median Property Value | $159,900 | $178,200 |
| Median Household Income | $57,171 | $154 |
| Monthly Housing Costs | $450 | $0 |
| Real Estate Taxes | $1,820 | $25 |
Property Value by Mortgage Status in Carlisle
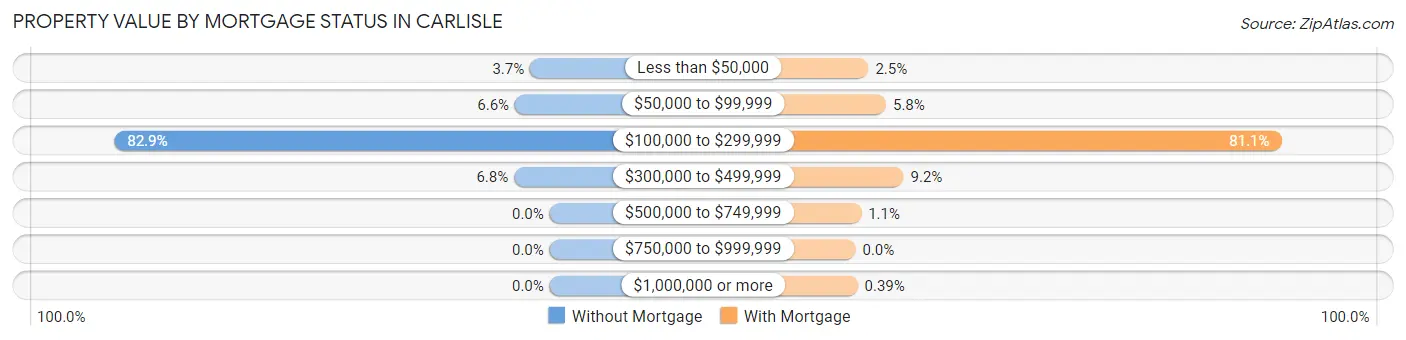
| Property Value | Without Mortgage | With Mortgage |
| Less than $50,000 | 22 (3.7%) | 25 (2.5%) |
| $50,000 to $99,999 | 39 (6.6%) | 59 (5.8%) |
| $100,000 to $299,999 | 490 (82.9%) | 824 (81.1%) |
| $300,000 to $499,999 | 40 (6.8%) | 93 (9.1%) |
| $500,000 to $749,999 | 0 (0.0%) | 11 (1.1%) |
| $750,000 to $999,999 | 0 (0.0%) | 0 (0.0%) |
| $1,000,000 or more | 0 (0.0%) | 4 (0.4%) |
| Total | 591 (100.0%) | 1,016 (100.0%) |
Household Income by Mortgage Status in Carlisle
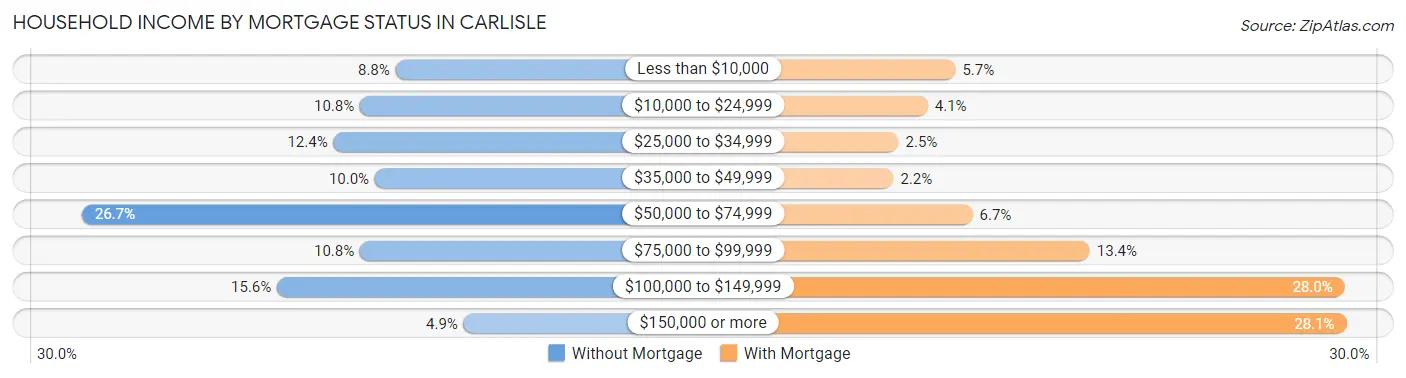
| Household Income | Without Mortgage | With Mortgage |
| Less than $10,000 | 52 (8.8%) | 58 (5.7%) |
| $10,000 to $24,999 | 64 (10.8%) | 42 (4.1%) |
| $25,000 to $34,999 | 73 (12.3%) | 25 (2.5%) |
| $35,000 to $49,999 | 59 (10.0%) | 22 (2.2%) |
| $50,000 to $74,999 | 158 (26.7%) | 68 (6.7%) |
| $75,000 to $99,999 | 64 (10.8%) | 136 (13.4%) |
| $100,000 to $149,999 | 92 (15.6%) | 284 (28.0%) |
| $150,000 or more | 29 (4.9%) | 285 (28.1%) |
| Total | 591 (100.0%) | 1,016 (100.0%) |
Property Value to Household Income Ratio in Carlisle
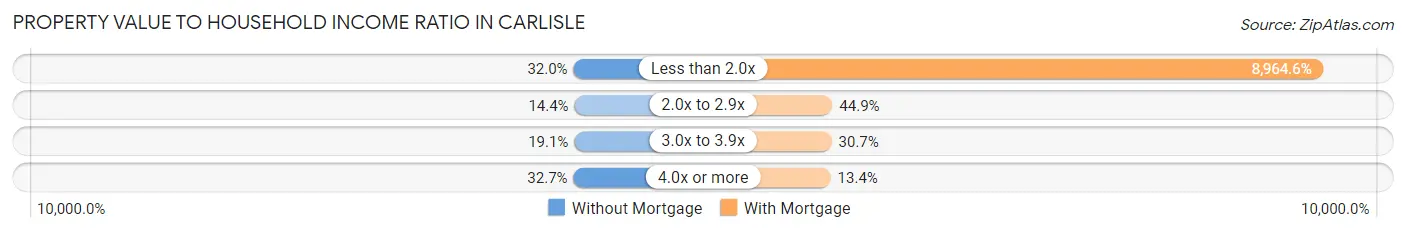
| Value-to-Income Ratio | Without Mortgage | With Mortgage |
| Less than 2.0x | 189 (32.0%) | 91,080 (8,964.6%) |
| 2.0x to 2.9x | 85 (14.4%) | 456 (44.9%) |
| 3.0x to 3.9x | 113 (19.1%) | 312 (30.7%) |
| 4.0x or more | 193 (32.7%) | 136 (13.4%) |
| Total | 591 (100.0%) | 1,016 (100.0%) |
Real Estate Taxes by Mortgage Status in Carlisle
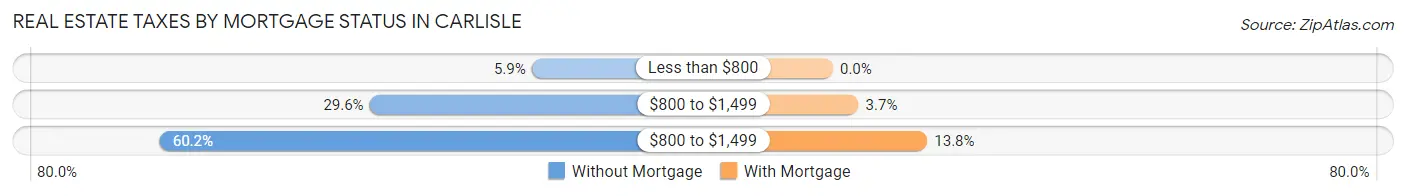
| Property Taxes | Without Mortgage | With Mortgage |
| Less than $800 | 35 (5.9%) | 0 (0.0%) |
| $800 to $1,499 | 175 (29.6%) | 38 (3.7%) |
| $800 to $1,499 | 356 (60.2%) | 140 (13.8%) |
| Total | 591 (100.0%) | 1,016 (100.0%) |
Health & Disability in Carlisle
Health Insurance Coverage by Age in Carlisle
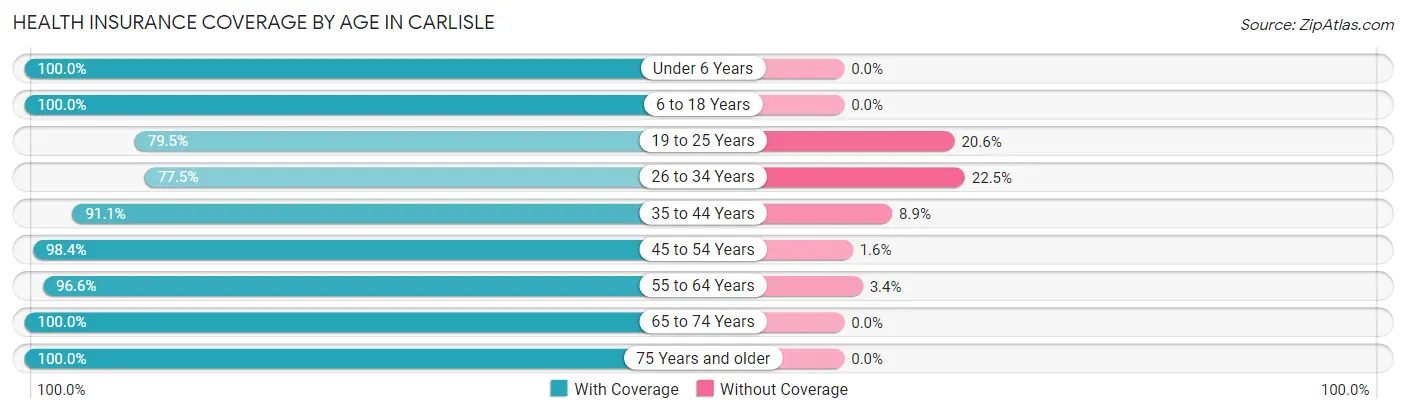
| Age Bracket | With Coverage | Without Coverage |
| Under 6 Years | 274 (100.0%) | 0 (0.0%) |
| 6 to 18 Years | 791 (100.0%) | 0 (0.0%) |
| 19 to 25 Years | 611 (79.4%) | 158 (20.5%) |
| 26 to 34 Years | 369 (77.5%) | 107 (22.5%) |
| 35 to 44 Years | 561 (91.1%) | 55 (8.9%) |
| 45 to 54 Years | 751 (98.4%) | 12 (1.6%) |
| 55 to 64 Years | 534 (96.6%) | 19 (3.4%) |
| 65 to 74 Years | 773 (100.0%) | 0 (0.0%) |
| 75 Years and older | 424 (100.0%) | 0 (0.0%) |
| Total | 5,088 (93.5%) | 351 (6.5%) |
Health Insurance Coverage by Citizenship Status in Carlisle
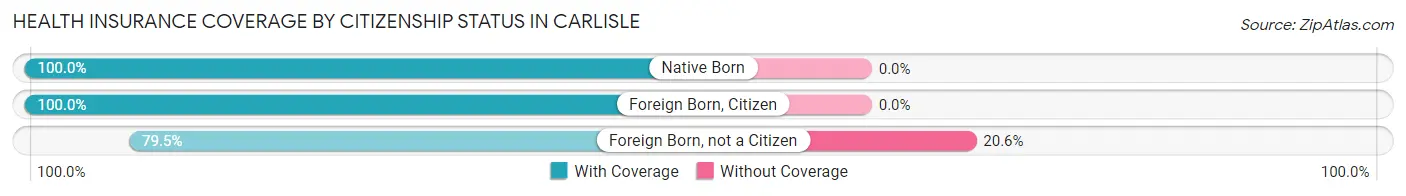
| Citizenship Status | With Coverage | Without Coverage |
| Native Born | 274 (100.0%) | 0 (0.0%) |
| Foreign Born, Citizen | 791 (100.0%) | 0 (0.0%) |
| Foreign Born, not a Citizen | 611 (79.4%) | 158 (20.5%) |
Health Insurance Coverage by Household Income in Carlisle
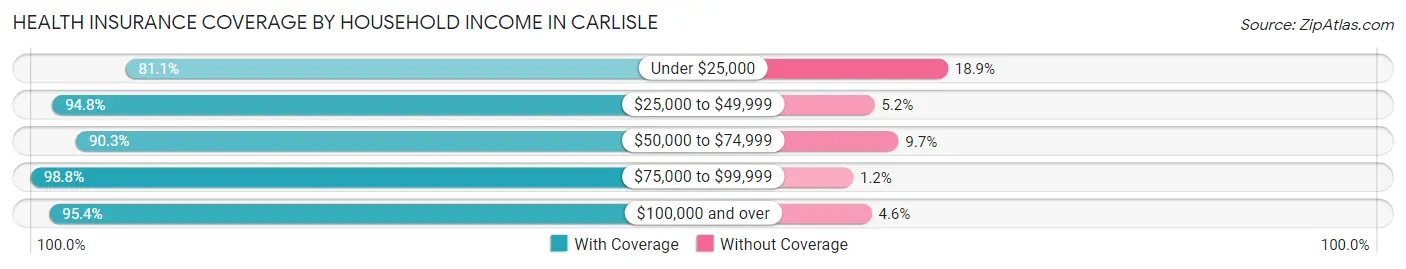
| Household Income | With Coverage | Without Coverage |
| Under $25,000 | 522 (81.1%) | 122 (18.9%) |
| $25,000 to $49,999 | 513 (94.8%) | 28 (5.2%) |
| $50,000 to $74,999 | 775 (90.3%) | 83 (9.7%) |
| $75,000 to $99,999 | 1,102 (98.8%) | 13 (1.2%) |
| $100,000 and over | 2,164 (95.4%) | 105 (4.6%) |
Public vs Private Health Insurance Coverage by Age in Carlisle
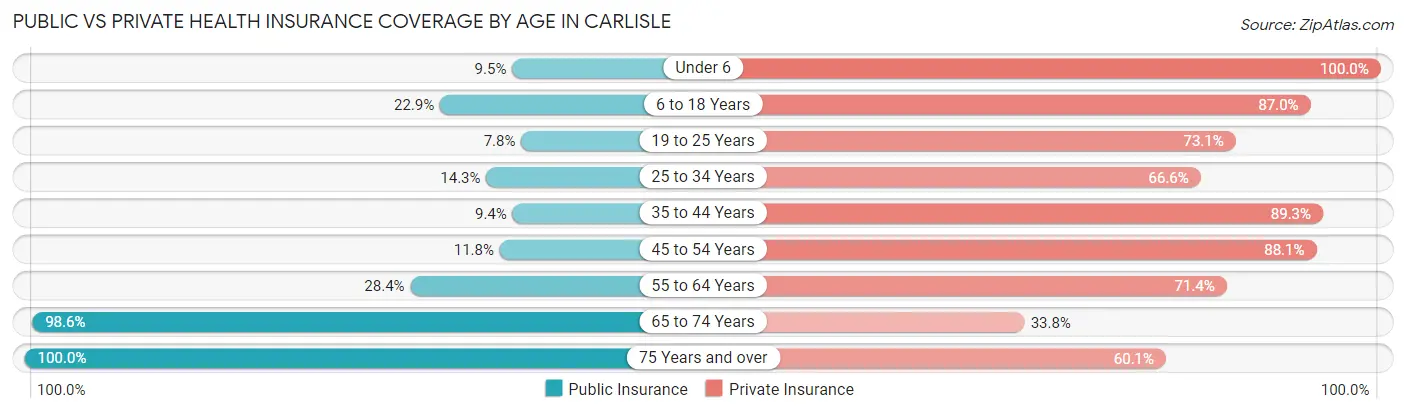
| Age Bracket | Public Insurance | Private Insurance |
| Under 6 | 26 (9.5%) | 274 (100.0%) |
| 6 to 18 Years | 181 (22.9%) | 688 (87.0%) |
| 19 to 25 Years | 60 (7.8%) | 562 (73.1%) |
| 25 to 34 Years | 68 (14.3%) | 317 (66.6%) |
| 35 to 44 Years | 58 (9.4%) | 550 (89.3%) |
| 45 to 54 Years | 90 (11.8%) | 672 (88.1%) |
| 55 to 64 Years | 157 (28.4%) | 395 (71.4%) |
| 65 to 74 Years | 762 (98.6%) | 261 (33.8%) |
| 75 Years and over | 424 (100.0%) | 255 (60.1%) |
| Total | 1,826 (33.6%) | 3,974 (73.1%) |
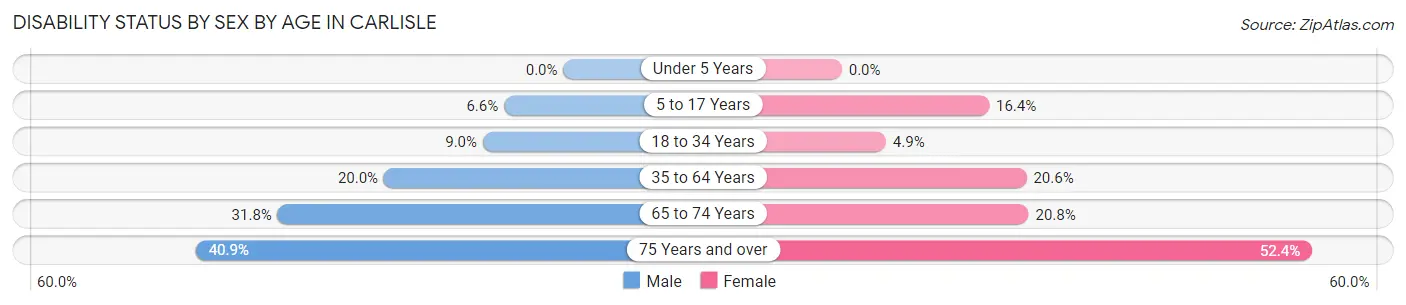
Disability Status by Sex by Age in Carlisle
| Age Bracket | Male | Female |
| Under 5 Years | 0 (0.0%) | 0 (0.0%) |
| 5 to 17 Years | 25 (6.6%) | 71 (16.4%) |
| 18 to 34 Years | 71 (9.0%) | 23 (4.9%) |
| 35 to 64 Years | 183 (20.0%) | 209 (20.6%) |
| 65 to 74 Years | 119 (31.8%) | 83 (20.8%) |
| 75 Years and over | 61 (40.9%) | 144 (52.4%) |
Disability Class by Sex by Age in Carlisle
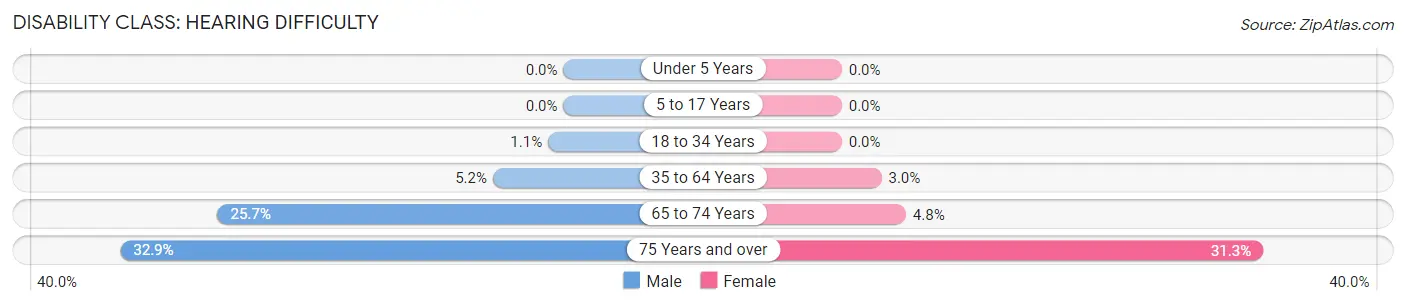
Disability Class: Hearing Difficulty
| Age Bracket | Male | Female |
| Under 5 Years | 0 (0.0%) | 0 (0.0%) |
| 5 to 17 Years | 0 (0.0%) | 0 (0.0%) |
| 18 to 34 Years | 9 (1.1%) | 0 (0.0%) |
| 35 to 64 Years | 48 (5.2%) | 30 (2.9%) |
| 65 to 74 Years | 96 (25.7%) | 19 (4.8%) |
| 75 Years and over | 49 (32.9%) | 86 (31.3%) |
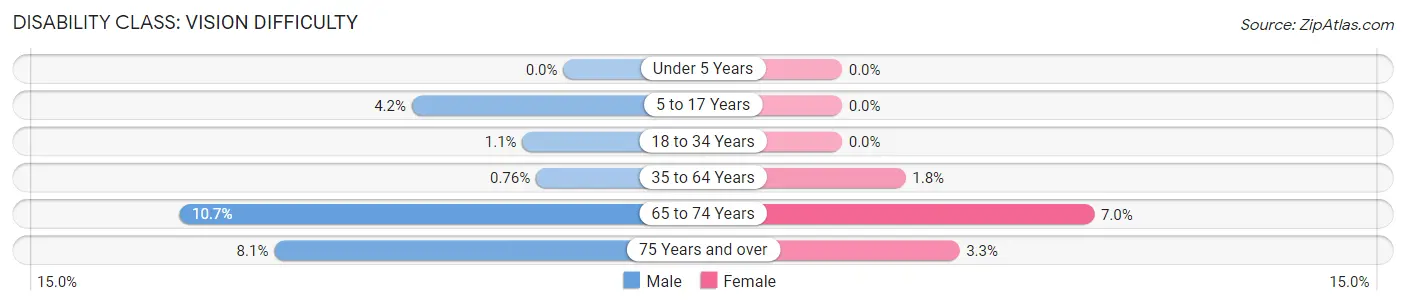
Disability Class: Vision Difficulty
| Age Bracket | Male | Female |
| Under 5 Years | 0 (0.0%) | 0 (0.0%) |
| 5 to 17 Years | 16 (4.2%) | 0 (0.0%) |
| 18 to 34 Years | 9 (1.1%) | 0 (0.0%) |
| 35 to 64 Years | 7 (0.8%) | 18 (1.8%) |
| 65 to 74 Years | 40 (10.7%) | 28 (7.0%) |
| 75 Years and over | 12 (8.1%) | 9 (3.3%) |
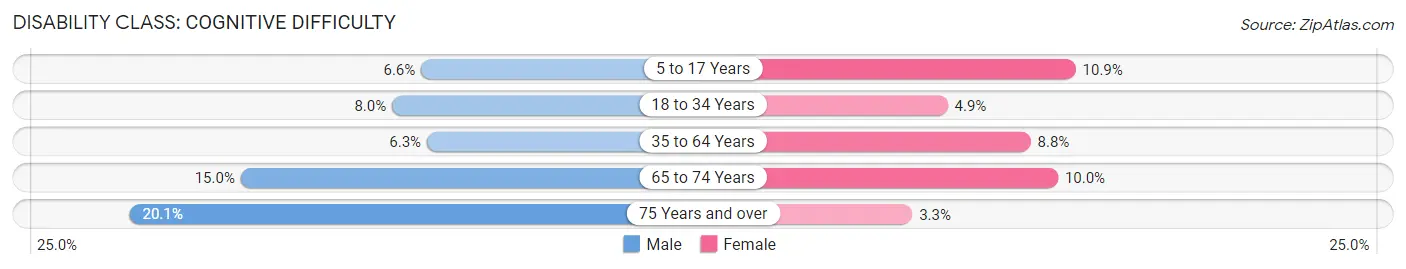
Disability Class: Cognitive Difficulty
| Age Bracket | Male | Female |
| 5 to 17 Years | 25 (6.6%) | 47 (10.8%) |
| 18 to 34 Years | 63 (8.0%) | 23 (4.9%) |
| 35 to 64 Years | 58 (6.3%) | 89 (8.8%) |
| 65 to 74 Years | 56 (15.0%) | 40 (10.0%) |
| 75 Years and over | 30 (20.1%) | 9 (3.3%) |
Disability Class: Ambulatory Difficulty
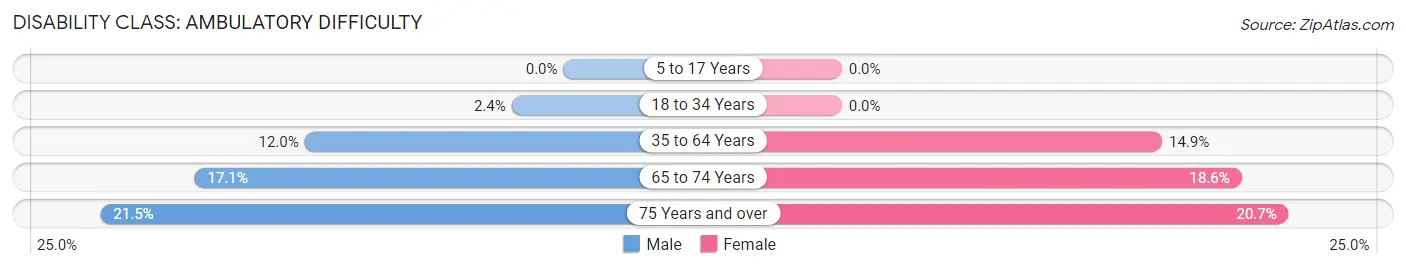
| Age Bracket | Male | Female |
| 5 to 17 Years | 0 (0.0%) | 0 (0.0%) |
| 18 to 34 Years | 19 (2.4%) | 0 (0.0%) |
| 35 to 64 Years | 110 (12.0%) | 151 (14.9%) |
| 65 to 74 Years | 64 (17.1%) | 74 (18.5%) |
| 75 Years and over | 32 (21.5%) | 57 (20.7%) |
Disability Class: Self-Care Difficulty
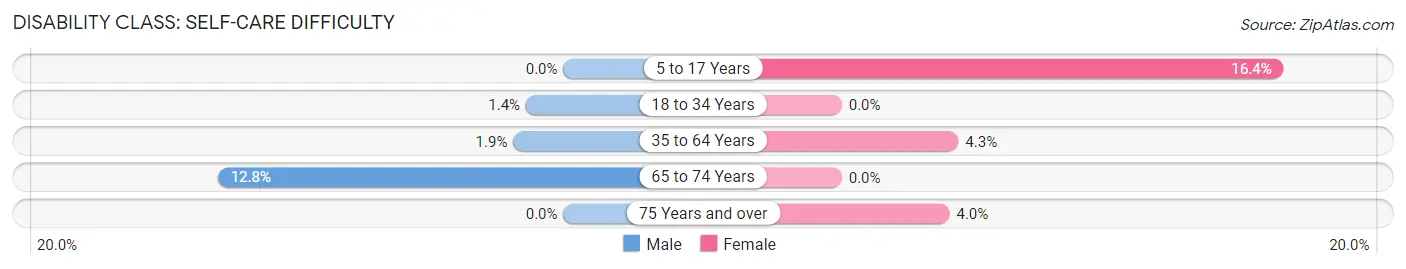
| Age Bracket | Male | Female |
| 5 to 17 Years | 0 (0.0%) | 71 (16.4%) |
| 18 to 34 Years | 11 (1.4%) | 0 (0.0%) |
| 35 to 64 Years | 17 (1.9%) | 44 (4.3%) |
| 65 to 74 Years | 48 (12.8%) | 0 (0.0%) |
| 75 Years and over | 0 (0.0%) | 11 (4.0%) |
Technology Access in Carlisle
Computing Device Access in Carlisle
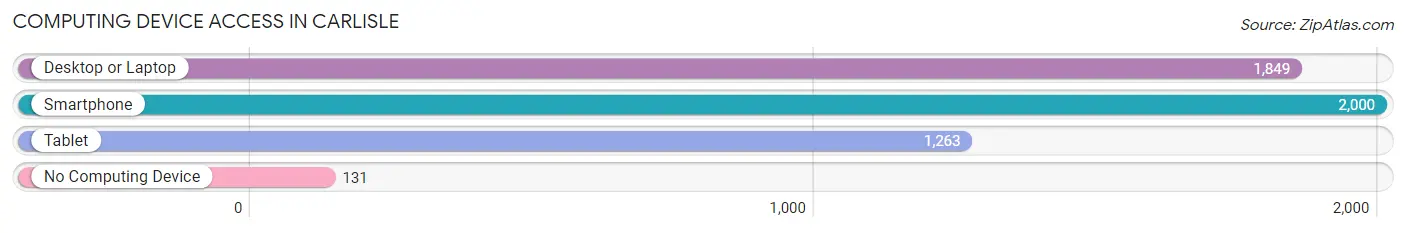
| Device Type | # Households | % Households |
| Desktop or Laptop | 1,849 | 82.9% |
| Smartphone | 2,000 | 89.6% |
| Tablet | 1,263 | 56.6% |
| No Computing Device | 131 | 5.9% |
| Total | 2,231 | 100.0% |
Internet Access in Carlisle
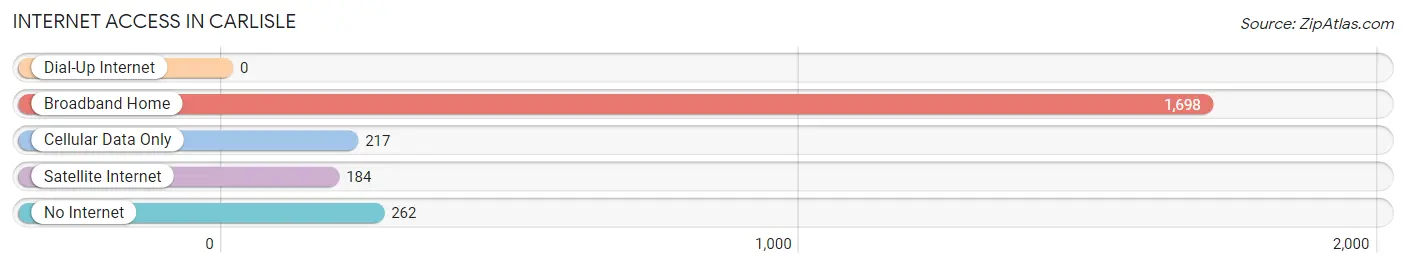
| Internet Type | # Households | % Households |
| Dial-Up Internet | 0 | 0.0% |
| Broadband Home | 1,698 | 76.1% |
| Cellular Data Only | 217 | 9.7% |
| Satellite Internet | 184 | 8.3% |
| No Internet | 262 | 11.7% |
| Total | 2,231 | 100.0% |
Carlisle Summary
Carlisle, Ohio is a small village located in the southwestern corner of Warren County, Ohio. It is situated on the banks of the Little Miami River, approximately 25 miles northeast of Cincinnati. The village was founded in 1817 and is named after the town of Carlisle, England. The population of Carlisle was 2,845 at the 2010 census.
History
The area that is now Carlisle was first settled in 1796 by a group of Quakers from North Carolina. The Quakers established a small settlement on the banks of the Little Miami River and named it Carlisle after the town of Carlisle, England. The settlement grew slowly over the next few decades, and in 1817, the village of Carlisle was officially incorporated.
In the early 19th century, Carlisle was a small agricultural community, with most of its residents engaged in farming and raising livestock. The village was also home to several small businesses, including a gristmill, a sawmill, and a blacksmith shop.
In the late 19th century, Carlisle began to experience a period of growth and development. The village was connected to the outside world by the Cincinnati, Lebanon and Northern Railway in 1881, and the population began to grow. The village also became home to several new businesses, including a brickyard, a furniture factory, and a canning factory.
Geography
Carlisle is located in southwestern Warren County, Ohio, approximately 25 miles northeast of Cincinnati. The village is situated on the banks of the Little Miami River, and is surrounded by rolling hills and farmland. The village covers an area of 1.3 square miles, and has a population of 2,845 as of the 2010 census.
Economy
The economy of Carlisle is largely based on agriculture and small businesses. The village is home to several small businesses, including a grocery store, a hardware store, and a restaurant. The village is also home to several manufacturing companies, including a furniture factory and a canning factory.
Demographics
As of the 2010 census, the population of Carlisle was 2,845. The racial makeup of the village was 97.3% White, 0.7% African American, 0.3% Native American, 0.3% Asian, 0.2% from other races, and 1.2% from two or more races. Hispanic or Latino of any race were 0.9% of the population.
The median income for a household in Carlisle was $45,938, and the median income for a family was $51,938. The per capita income for the village was $20,938. About 8.3% of families and 10.2% of the population were below the poverty line, including 14.2% of those under age 18 and 6.2% of those age 65 or over.
Common Questions
What is Per Capita Income in Carlisle?
Per Capita income in Carlisle is $36,020.
What is the Median Family Income in Carlisle?
Median Family Income in Carlisle is $86,955.
What is the Median Household income in Carlisle?
Median Household Income in Carlisle is $69,513.
What is Income or Wage Gap in Carlisle?
Income or Wage Gap in Carlisle is 23.3%.
Women in Carlisle earn 76.7 cents for every dollar earned by a man.
What is Inequality or Gini Index in Carlisle?
Inequality or Gini Index in Carlisle is 0.44.
What is the Total Population of Carlisle?
Total Population of Carlisle is 5,488.
What is the Total Male Population of Carlisle?
Total Male Population of Carlisle is 2,710.
What is the Total Female Population of Carlisle?
Total Female Population of Carlisle is 2,778.
What is the Ratio of Males per 100 Females in Carlisle?
There are 97.55 Males per 100 Females in Carlisle.
What is the Ratio of Females per 100 Males in Carlisle?
There are 102.51 Females per 100 Males in Carlisle.
What is the Median Population Age in Carlisle?
Median Population Age in Carlisle is 41.6 Years.
What is the Average Family Size in Carlisle
Average Family Size in Carlisle is 2.9 People.
What is the Average Household Size in Carlisle
Average Household Size in Carlisle is 2.4 People.
How Large is the Labor Force in Carlisle?
There are 2,856 People in the Labor Forcein in Carlisle.
What is the Percentage of People in the Labor Force in Carlisle?
61.1% of People are in the Labor Force in Carlisle.
What is the Unemployment Rate in Carlisle?
Unemployment Rate in Carlisle is 4.5%.