Zip Codes with the Highest Percentage of Population with a Degree in Physical and Health Sciences in Columbus, OH
RELATED REPORTS & OPTIONS
Physical and Health Sciences
Columbus
Compare Zip Codes
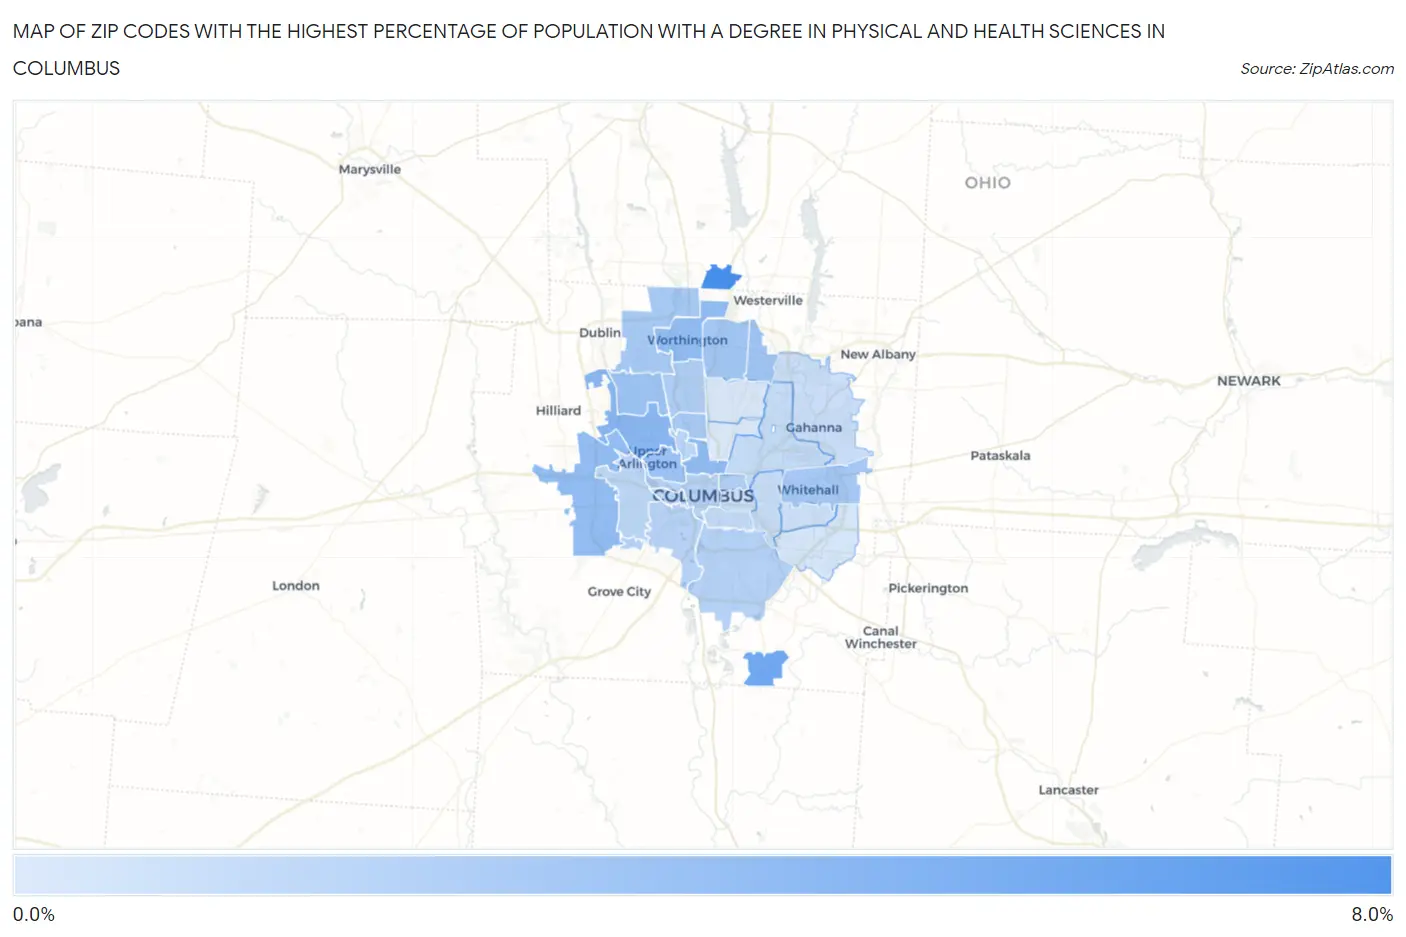
Map of Zip Codes with the Highest Percentage of Population with a Degree in Physical and Health Sciences in Columbus
0.78%
6.7%
Zip Codes with the Highest Percentage of Population with a Degree in Physical and Health Sciences in Columbus, OH
| Zip Code | % Graduates | vs State | vs National | |
| 1. | 43240 | 6.7% | 3.0%(+3.70)#92 | 3.1%(+3.56)#2,736 |
| 2. | 43217 | 5.0% | 3.0%(+2.04)#138 | 3.1%(+1.90)#4,543 |
| 3. | 43221 | 4.0% | 3.0%(+1.04)#219 | 3.1%(+0.895)#6,781 |
| 4. | 43201 | 3.7% | 3.0%(+0.785)#252 | 3.1%(+0.644)#7,558 |
| 5. | 43228 | 3.7% | 3.0%(+0.701)#260 | 3.1%(+0.560)#7,844 |
| 6. | 43085 | 3.6% | 3.0%(+0.677)#261 | 3.1%(+0.536)#7,941 |
| 7. | 43212 | 3.3% | 3.0%(+0.307)#308 | 3.1%(+0.165)#9,321 |
| 8. | 43220 | 3.2% | 3.0%(+0.207)#320 | 3.1%(+0.065)#9,703 |
| 9. | 43231 | 3.1% | 3.0%(+0.114)#342 | 3.1%(-0.027)#10,100 |
| 10. | 43229 | 3.0% | 3.0%(+0.016)#353 | 3.1%(-0.125)#10,534 |
| 11. | 43213 | 2.9% | 3.0%(-0.062)#364 | 3.1%(-0.203)#10,872 |
| 12. | 43235 | 2.8% | 3.0%(-0.135)#373 | 3.1%(-0.276)#11,205 |
| 13. | 43202 | 2.8% | 3.0%(-0.183)#386 | 3.1%(-0.324)#11,452 |
| 14. | 43214 | 2.6% | 3.0%(-0.373)#416 | 3.1%(-0.515)#12,325 |
| 15. | 43203 | 2.4% | 3.0%(-0.535)#447 | 3.1%(-0.676)#13,069 |
| 16. | 43207 | 2.3% | 3.0%(-0.702)#474 | 3.1%(-0.844)#13,883 |
| 17. | 43223 | 2.2% | 3.0%(-0.795)#498 | 3.1%(-0.937)#14,306 |
| 18. | 43215 | 2.2% | 3.0%(-0.796)#499 | 3.1%(-0.937)#14,309 |
| 19. | 43210 | 2.1% | 3.0%(-0.884)#517 | 3.1%(-1.03)#14,761 |
| 20. | 43204 | 2.0% | 3.0%(-0.924)#523 | 3.1%(-1.07)#14,964 |
| 21. | 43222 | 2.0% | 3.0%(-0.968)#531 | 3.1%(-1.11)#15,156 |
| 22. | 43206 | 1.8% | 3.0%(-1.17)#555 | 3.1%(-1.31)#16,072 |
| 23. | 43219 | 1.7% | 3.0%(-1.28)#568 | 3.1%(-1.42)#16,529 |
| 24. | 43209 | 1.5% | 3.0%(-1.42)#595 | 3.1%(-1.56)#17,133 |
| 25. | 43230 | 1.5% | 3.0%(-1.50)#603 | 3.1%(-1.64)#17,458 |
| 26. | 43227 | 1.4% | 3.0%(-1.52)#609 | 3.1%(-1.67)#17,587 |
| 27. | 43205 | 1.4% | 3.0%(-1.56)#614 | 3.1%(-1.70)#17,719 |
| 28. | 43232 | 1.0% | 3.0%(-1.92)#662 | 3.1%(-2.07)#19,132 |
| 29. | 43224 | 0.85% | 3.0%(-2.11)#687 | 3.1%(-2.25)#19,699 |
| 30. | 43211 | 0.78% | 3.0%(-2.18)#694 | 3.1%(-2.32)#19,910 |
1
Common Questions
What are the Top 10 Zip Codes with the Highest Percentage of Population with a Degree in Physical and Health Sciences in Columbus, OH?
Top 10 Zip Codes with the Highest Percentage of Population with a Degree in Physical and Health Sciences in Columbus, OH are:
What zip code has the Highest Percentage of Population with a Degree in Physical and Health Sciences in Columbus, OH?
43240 has the Highest Percentage of Population with a Degree in Physical and Health Sciences in Columbus, OH with 6.7%.
What is the Percentage of Population with a Degree in Physical and Health Sciences in Columbus, OH?
Percentage of Population with a Degree in Physical and Health Sciences in Columbus is 2.6%.
What is the Percentage of Population with a Degree in Physical and Health Sciences in Ohio?
Percentage of Population with a Degree in Physical and Health Sciences in Ohio is 3.0%.
What is the Percentage of Population with a Degree in Physical and Health Sciences in the United States?
Percentage of Population with a Degree in Physical and Health Sciences in the United States is 3.1%.