Malta, OH Map & Demographics
Malta Map
Malta Overview
$20,455
PER CAPITA INCOME
$49,750
AVG FAMILY INCOME
$30,625
AVG HOUSEHOLD INCOME
19.1%
WAGE / INCOME GAP [ % ]
80.9¢/ $1
WAGE / INCOME GAP [ $ ]
0.42
INEQUALITY / GINI INDEX
677
TOTAL POPULATION
321
MALE POPULATION
356
FEMALE POPULATION
90.17
MALES / 100 FEMALES
110.90
FEMALES / 100 MALES
32.3
MEDIAN AGE
2.9
AVG FAMILY SIZE
2.5
AVG HOUSEHOLD SIZE
267
LABOR FORCE [ PEOPLE ]
54.4%
PERCENT IN LABOR FORCE
11.6%
UNEMPLOYMENT RATE
Malta Zip Codes
Malta Area Codes
Income in Malta
Income Overview in Malta
Per Capita Income in Malta is $20,455, while median incomes of families and households are $49,750 and $30,625 respectively.
| Characteristic | Number | Measure |
| Per Capita Income | 677 | $20,455 |
| Median Family Income | 165 | $49,750 |
| Mean Family Income | 165 | $64,119 |
| Median Household Income | 275 | $30,625 |
| Mean Household Income | 275 | $49,617 |
| Income Deficit | 165 | $0 |
| Wage / Income Gap (%) | 677 | 19.13% |
| Wage / Income Gap ($) | 677 | 80.87¢ per $1 |
| Gini / Inequality Index | 677 | 0.42 |
Earnings by Sex in Malta
Average Earnings in Malta are $27,813, $28,750 for men and $23,250 for women, a difference of 19.1%.
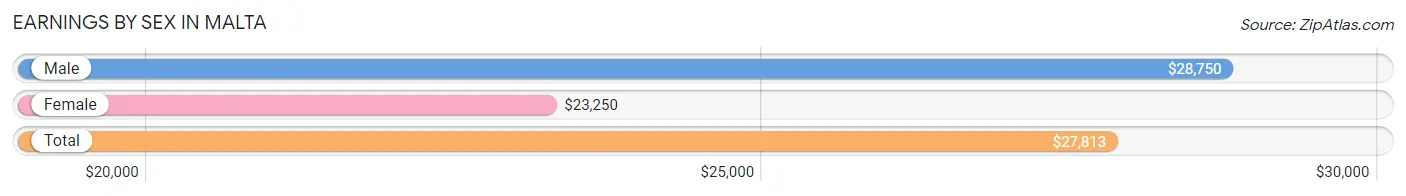
| Sex | Number | Average Earnings |
| Male | 114 (42.4%) | $28,750 |
| Female | 155 (57.6%) | $23,250 |
| Total | 269 (100.0%) | $27,813 |
Earnings by Sex by Income Bracket in Malta
The most common earnings brackets in Malta are $25,000 to $29,999 for men (32 | 28.1%) and $2,499 or less for women (19 | 12.3%).
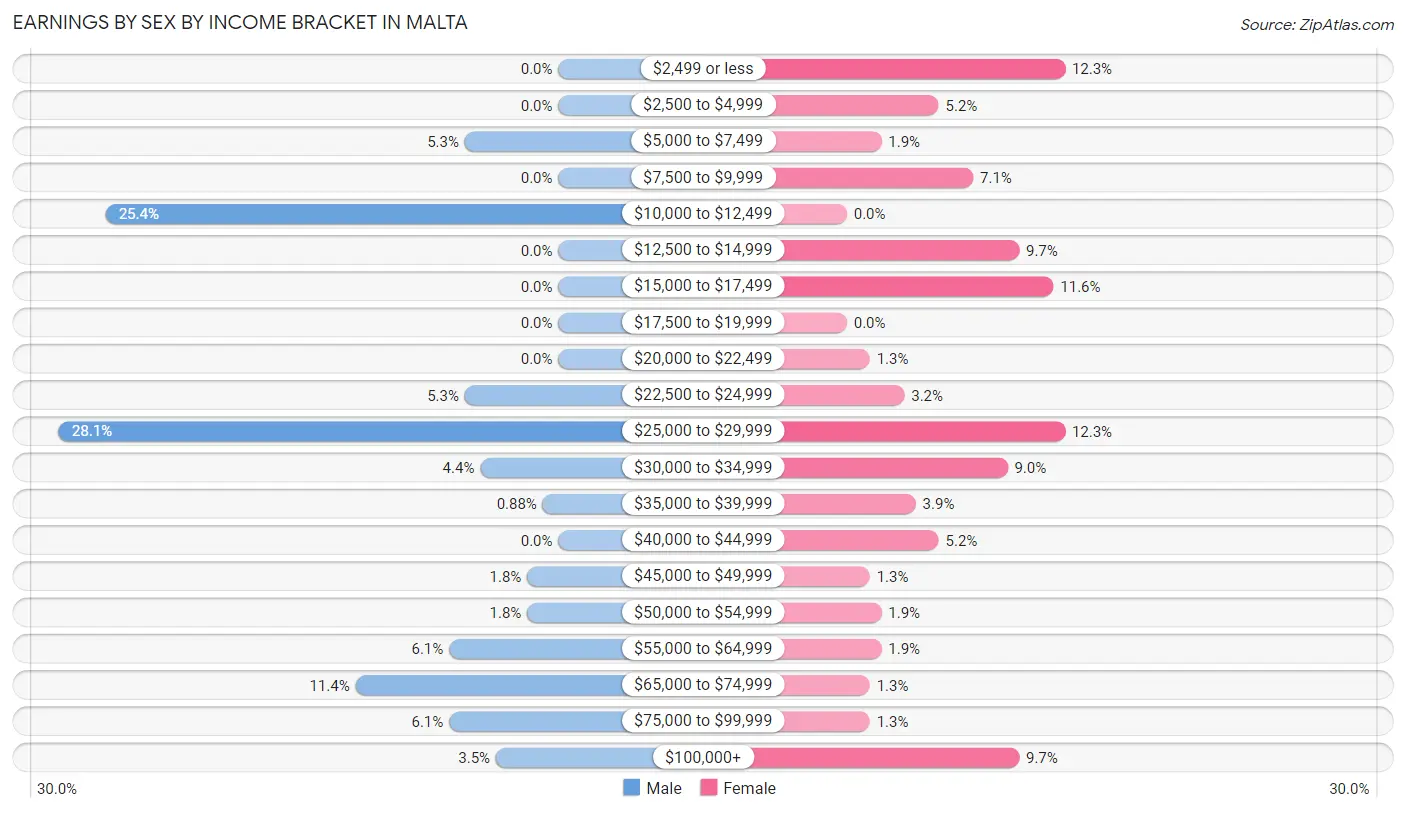
| Income | Male | Female |
| $2,499 or less | 0 (0.0%) | 19 (12.3%) |
| $2,500 to $4,999 | 0 (0.0%) | 8 (5.2%) |
| $5,000 to $7,499 | 6 (5.3%) | 3 (1.9%) |
| $7,500 to $9,999 | 0 (0.0%) | 11 (7.1%) |
| $10,000 to $12,499 | 29 (25.4%) | 0 (0.0%) |
| $12,500 to $14,999 | 0 (0.0%) | 15 (9.7%) |
| $15,000 to $17,499 | 0 (0.0%) | 18 (11.6%) |
| $17,500 to $19,999 | 0 (0.0%) | 0 (0.0%) |
| $20,000 to $22,499 | 0 (0.0%) | 2 (1.3%) |
| $22,500 to $24,999 | 6 (5.3%) | 5 (3.2%) |
| $25,000 to $29,999 | 32 (28.1%) | 19 (12.3%) |
| $30,000 to $34,999 | 5 (4.4%) | 14 (9.0%) |
| $35,000 to $39,999 | 1 (0.9%) | 6 (3.9%) |
| $40,000 to $44,999 | 0 (0.0%) | 8 (5.2%) |
| $45,000 to $49,999 | 2 (1.8%) | 2 (1.3%) |
| $50,000 to $54,999 | 2 (1.8%) | 3 (1.9%) |
| $55,000 to $64,999 | 7 (6.1%) | 3 (1.9%) |
| $65,000 to $74,999 | 13 (11.4%) | 2 (1.3%) |
| $75,000 to $99,999 | 7 (6.1%) | 2 (1.3%) |
| $100,000+ | 4 (3.5%) | 15 (9.7%) |
| Total | 114 (100.0%) | 155 (100.0%) |
Earnings by Sex by Educational Attainment in Malta
Average earnings in Malta are $28,867 for men and $24,000 for women, a difference of 16.9%. Men with an educational attainment of bachelor's degree enjoy the highest average annual earnings of $63,750, while those with high school diploma education earn the least with $29,191. Women with an educational attainment of high school diploma earn the most with the average annual earnings of $16,696, while those with college or associate's degree education have the smallest earnings of $16,250.
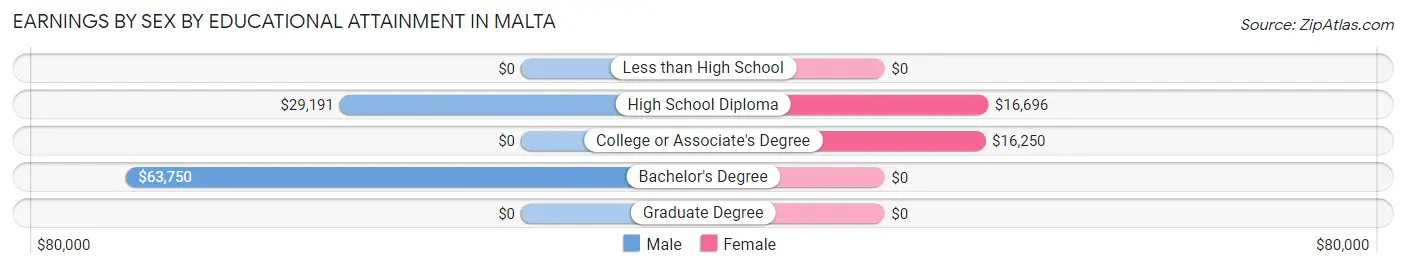
| Educational Attainment | Male Income | Female Income |
| Less than High School | - | - |
| High School Diploma | $29,191 | $16,696 |
| College or Associate's Degree | - | - |
| Bachelor's Degree | $63,750 | $0 |
| Graduate Degree | - | - |
| Total | $28,867 | $24,000 |
Family Income in Malta
Family Income Brackets in Malta
According to the Malta family income data, there are 37 families falling into the $25,000 to $34,999 income range, which is the most common income bracket and makes up 22.4% of all families. Conversely, the less than $10,000 income bracket is the least frequent group with only 2 families (1.2%) belonging to this category.

| Income Bracket | # Families | % Families |
| Less than $10,000 | 2 | 1.2% |
| $10,000 to $14,999 | 6 | 3.6% |
| $15,000 to $24,999 | 19 | 11.5% |
| $25,000 to $34,999 | 37 | 22.4% |
| $35,000 to $49,999 | 19 | 11.5% |
| $50,000 to $74,999 | 28 | 17.0% |
| $75,000 to $99,999 | 16 | 9.7% |
| $100,000 to $149,999 | 32 | 19.4% |
| $150,000 to $199,999 | 3 | 1.8% |
| $200,000+ | 3 | 1.8% |
Family Income by Famaliy Size in Malta
2-person families (89 | 53.9%) account for the highest median family income in Malta with $55,417 per family, while 2-person families (89 | 53.9%) have the highest median income of $27,708 per family member.
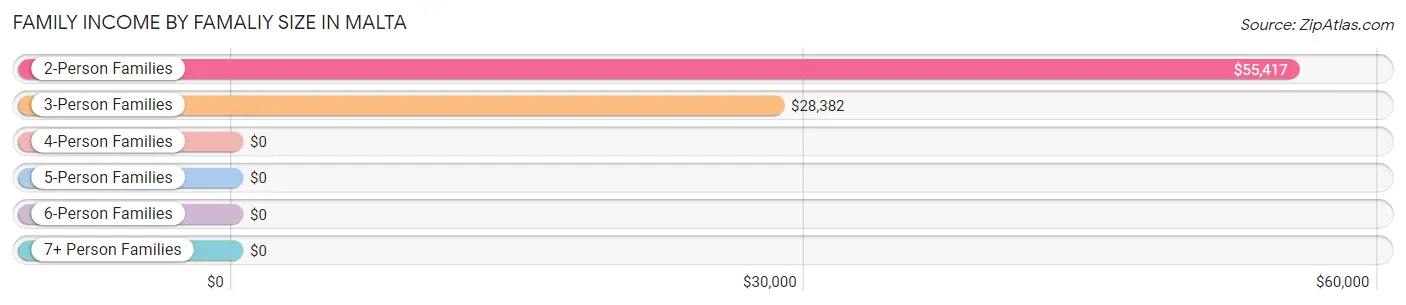
| Income Bracket | # Families | Median Income |
| 2-Person Families | 89 (53.9%) | $55,417 |
| 3-Person Families | 32 (19.4%) | $28,382 |
| 4-Person Families | 30 (18.2%) | $0 |
| 5-Person Families | 14 (8.5%) | $0 |
| 6-Person Families | 0 (0.0%) | $0 |
| 7+ Person Families | 0 (0.0%) | $0 |
| Total | 165 (100.0%) | $49,750 |
Family Income by Number of Earners in Malta
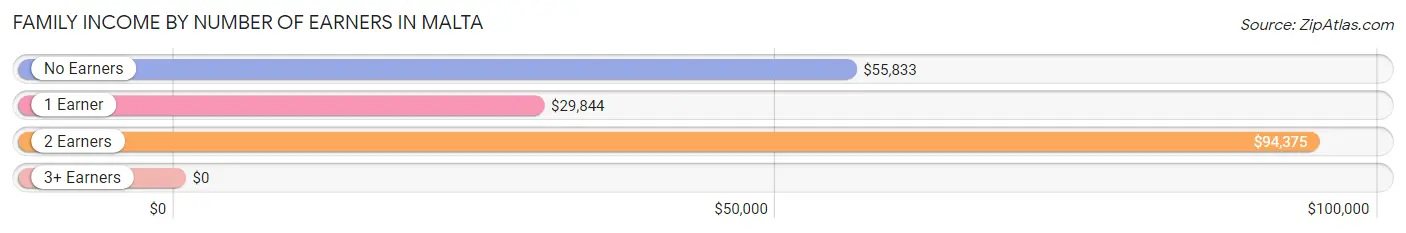
| Number of Earners | # Families | Median Income |
| No Earners | 28 (17.0%) | $55,833 |
| 1 Earner | 100 (60.6%) | $29,844 |
| 2 Earners | 31 (18.8%) | $94,375 |
| 3+ Earners | 6 (3.6%) | $0 |
| Total | 165 (100.0%) | $49,750 |
Household Income in Malta
Household Income Brackets in Malta
With 76 households falling in the category, the $25,000 to $34,999 income range is the most frequent in Malta, accounting for 27.6% of all households. In contrast, only 3 households (1.1%) fall into the $150,000 to $199,999 income bracket, making it the least populous group.
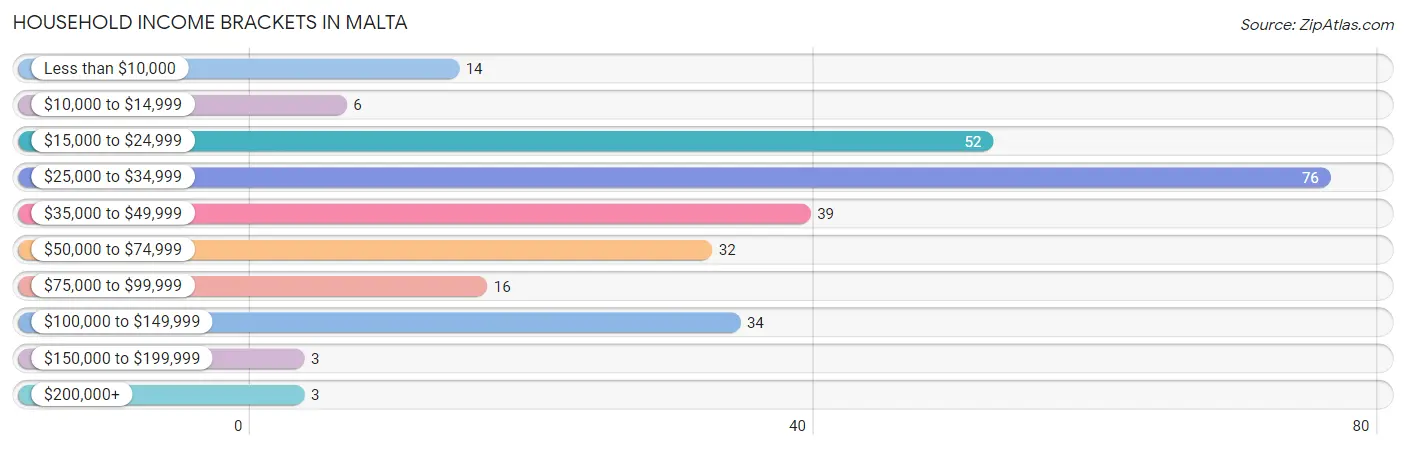
| Income Bracket | # Households | % Households |
| Less than $10,000 | 14 | 5.1% |
| $10,000 to $14,999 | 6 | 2.2% |
| $15,000 to $24,999 | 52 | 18.9% |
| $25,000 to $34,999 | 76 | 27.6% |
| $35,000 to $49,999 | 39 | 14.2% |
| $50,000 to $74,999 | 32 | 11.6% |
| $75,000 to $99,999 | 16 | 5.8% |
| $100,000 to $149,999 | 34 | 12.4% |
| $150,000 to $199,999 | 3 | 1.1% |
| $200,000+ | 3 | 1.1% |
Household Income by Householder Age in Malta
The median household income in Malta is $30,625, with the highest median household income of $38,438 found in the 65+ years age bracket for the primary householder. A total of 70 households (25.5%) fall into this category. Meanwhile, the 15 to 24 years age bracket for the primary householder has the lowest median household income of $0, with 2 households (0.7%) in this group.
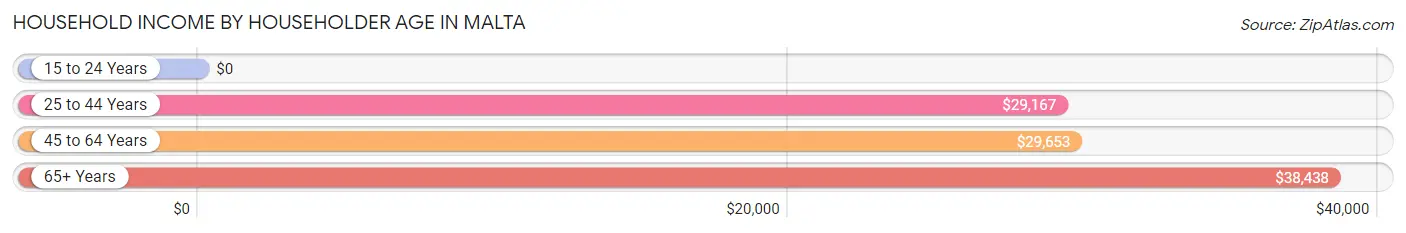
| Income Bracket | # Households | Median Income |
| 15 to 24 Years | 2 (0.7%) | $0 |
| 25 to 44 Years | 102 (37.1%) | $29,167 |
| 45 to 64 Years | 101 (36.7%) | $29,653 |
| 65+ Years | 70 (25.5%) | $38,438 |
| Total | 275 (100.0%) | $30,625 |
Poverty in Malta
Income Below Poverty by Sex and Age in Malta
With 26.3% poverty level for males and 39.3% for females among the residents of Malta, 18 to 24 year old males and 12 to 14 year old females are the most vulnerable to poverty, with 7 males (70.0%) and 7 females (100.0%) in their respective age groups living below the poverty level.
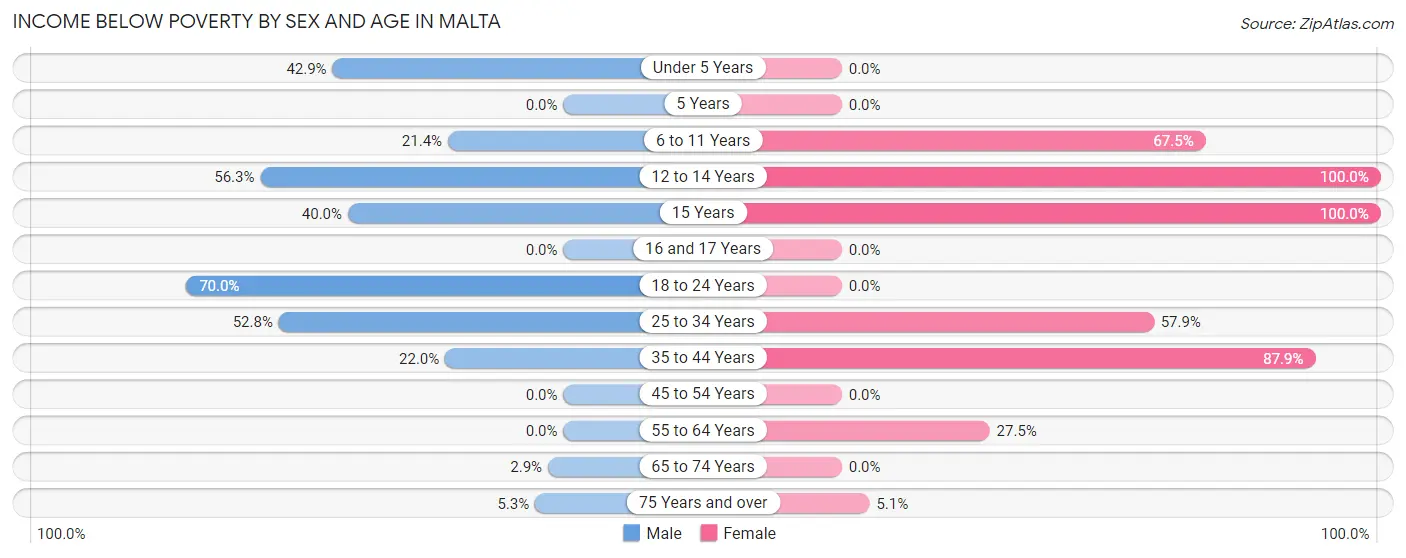
| Age Bracket | Male | Female |
| Under 5 Years | 15 (42.9%) | 0 (0.0%) |
| 5 Years | 0 (0.0%) | 0 (0.0%) |
| 6 to 11 Years | 9 (21.4%) | 27 (67.5%) |
| 12 to 14 Years | 9 (56.2%) | 7 (100.0%) |
| 15 Years | 2 (40.0%) | 6 (100.0%) |
| 16 and 17 Years | 0 (0.0%) | 0 (0.0%) |
| 18 to 24 Years | 7 (70.0%) | 0 (0.0%) |
| 25 to 34 Years | 28 (52.8%) | 55 (57.9%) |
| 35 to 44 Years | 9 (22.0%) | 29 (87.9%) |
| 45 to 54 Years | 0 (0.0%) | 0 (0.0%) |
| 55 to 64 Years | 0 (0.0%) | 14 (27.5%) |
| 65 to 74 Years | 1 (2.9%) | 0 (0.0%) |
| 75 Years and over | 1 (5.3%) | 2 (5.1%) |
| Total | 81 (26.3%) | 140 (39.3%) |
Income Above Poverty by Sex and Age in Malta
According to the poverty statistics in Malta, males aged 45 to 54 years and females aged under 5 years are the age groups that are most secure financially, with 100.0% of males and 100.0% of females in these age groups living above the poverty line.
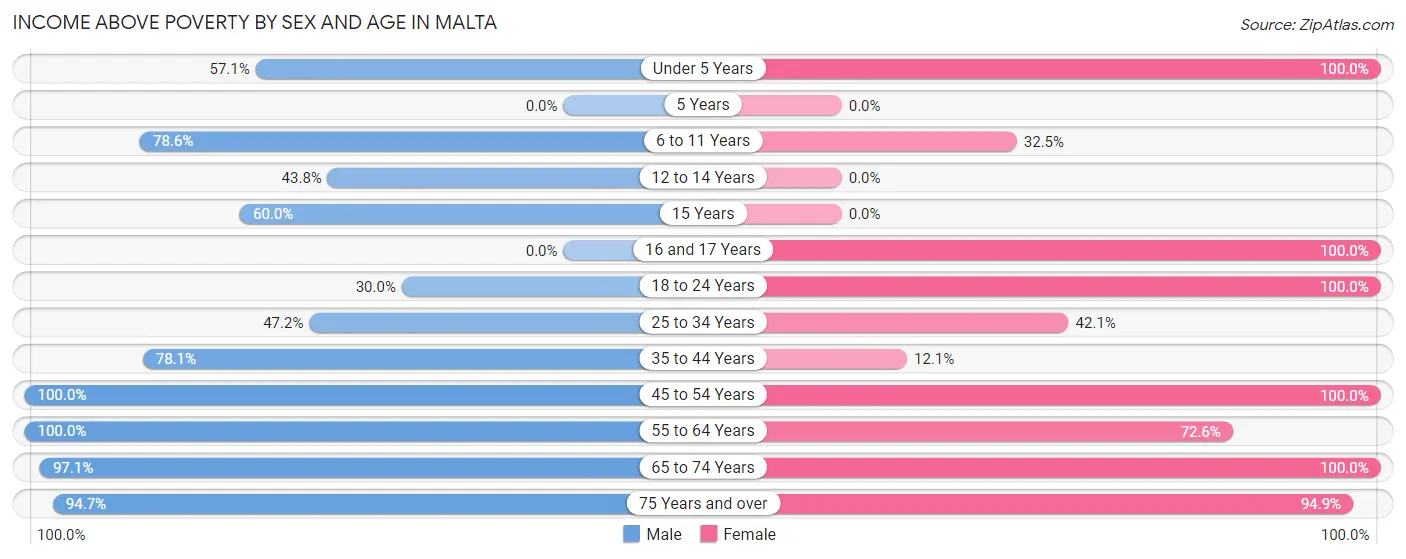
| Age Bracket | Male | Female |
| Under 5 Years | 20 (57.1%) | 22 (100.0%) |
| 5 Years | 0 (0.0%) | 0 (0.0%) |
| 6 to 11 Years | 33 (78.6%) | 13 (32.5%) |
| 12 to 14 Years | 7 (43.8%) | 0 (0.0%) |
| 15 Years | 3 (60.0%) | 0 (0.0%) |
| 16 and 17 Years | 0 (0.0%) | 4 (100.0%) |
| 18 to 24 Years | 3 (30.0%) | 7 (100.0%) |
| 25 to 34 Years | 25 (47.2%) | 40 (42.1%) |
| 35 to 44 Years | 32 (78.0%) | 4 (12.1%) |
| 45 to 54 Years | 11 (100.0%) | 26 (100.0%) |
| 55 to 64 Years | 41 (100.0%) | 37 (72.6%) |
| 65 to 74 Years | 34 (97.1%) | 26 (100.0%) |
| 75 Years and over | 18 (94.7%) | 37 (94.9%) |
| Total | 227 (73.7%) | 216 (60.7%) |
Income Below Poverty Among Married-Couple Families in Malta
The poverty statistics for married-couple families in Malta show that 11.7% or 11 of the total 94 families live below the poverty line. Families with 1 or 2 children have the highest poverty rate of 50.0%, comprising of 11 families. On the other hand, families with no children have the lowest poverty rate of 0.0%, which includes 0 families.
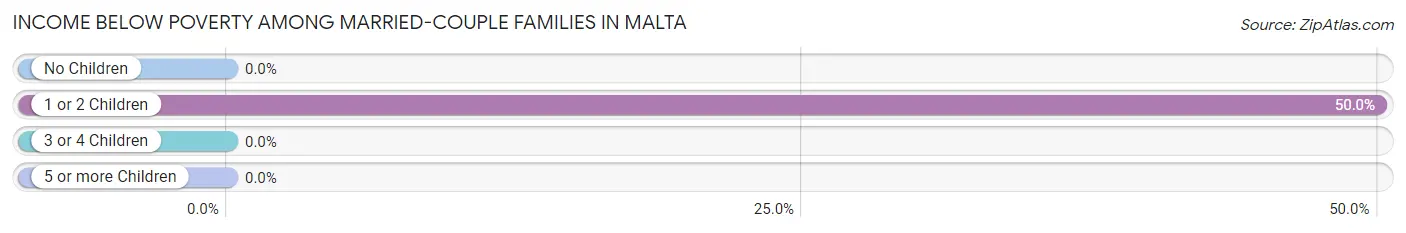
| Children | Above Poverty | Below Poverty |
| No Children | 60 (100.0%) | 0 (0.0%) |
| 1 or 2 Children | 11 (50.0%) | 11 (50.0%) |
| 3 or 4 Children | 12 (100.0%) | 0 (0.0%) |
| 5 or more Children | 0 (0.0%) | 0 (0.0%) |
| Total | 83 (88.3%) | 11 (11.7%) |
Income Below Poverty Among Single-Parent Households in Malta
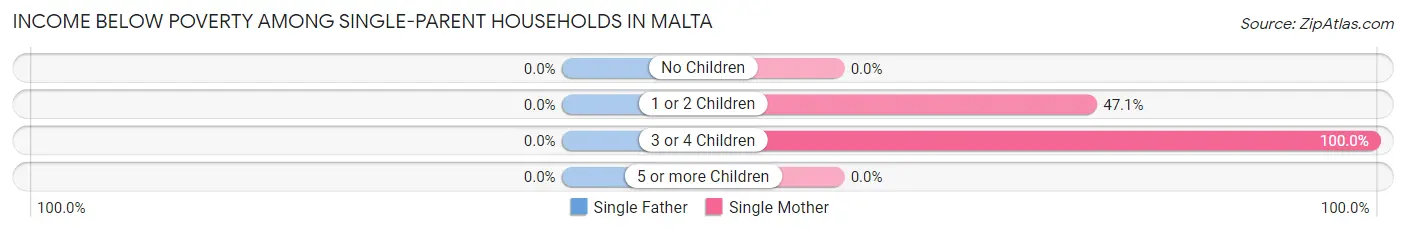
| Children | Single Father | Single Mother |
| No Children | 0 (0.0%) | 0 (0.0%) |
| 1 or 2 Children | 0 (0.0%) | 8 (47.1%) |
| 3 or 4 Children | 0 (0.0%) | 11 (100.0%) |
| 5 or more Children | 0 (0.0%) | 0 (0.0%) |
| Total | 0 (0.0%) | 19 (59.4%) |
Income Below Poverty Among Married-Couple vs Single-Parent Households in Malta
The poverty data for Malta shows that 11 of the married-couple family households (11.7%) and 19 of the single-parent households (26.8%) are living below the poverty level. Within the married-couple family households, those with 1 or 2 children have the highest poverty rate, with 11 households (50.0%) falling below the poverty line. Among the single-parent households, those with 3 or 4 children have the highest poverty rate, with 11 household (100.0%) living below poverty.
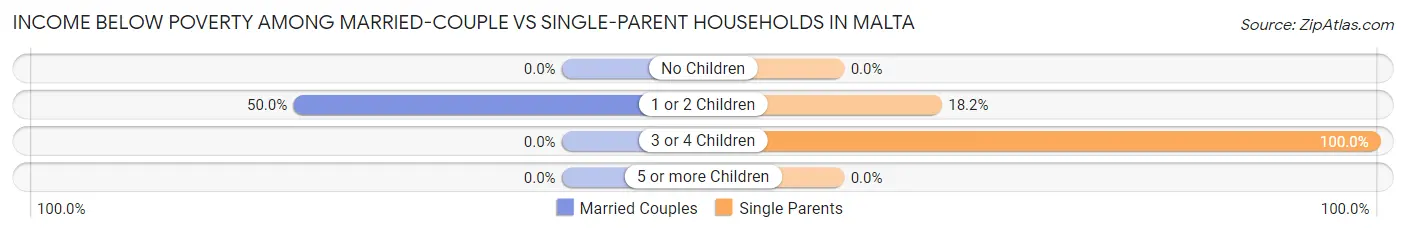
| Children | Married-Couple Families | Single-Parent Households |
| No Children | 0 (0.0%) | 0 (0.0%) |
| 1 or 2 Children | 11 (50.0%) | 8 (18.2%) |
| 3 or 4 Children | 0 (0.0%) | 11 (100.0%) |
| 5 or more Children | 0 (0.0%) | 0 (0.0%) |
| Total | 11 (11.7%) | 19 (26.8%) |
Race in Malta
The most populous races in Malta are White / Caucasian (617 | 91.1%), Black / African American (59 | 8.7%), and Two or more Races (1 | 0.2%).
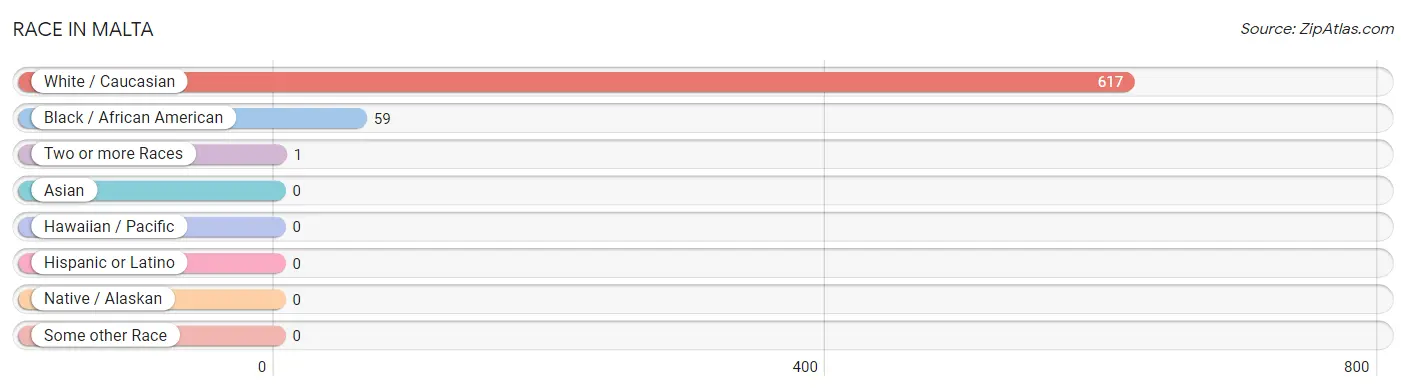
| Race | # Population | % Population |
| Asian | 0 | 0.0% |
| Black / African American | 59 | 8.7% |
| Hawaiian / Pacific | 0 | 0.0% |
| Hispanic or Latino | 0 | 0.0% |
| Native / Alaskan | 0 | 0.0% |
| White / Caucasian | 617 | 91.1% |
| Two or more Races | 1 | 0.2% |
| Some other Race | 0 | 0.0% |
| Total | 677 | 100.0% |
Ancestry in Malta
The most populous ancestries reported in Malta are German (101 | 14.9%), English (100 | 14.8%), Irish (77 | 11.4%), Swedish (50 | 7.4%), and American (21 | 3.1%), together accounting for 51.5% of all Malta residents.
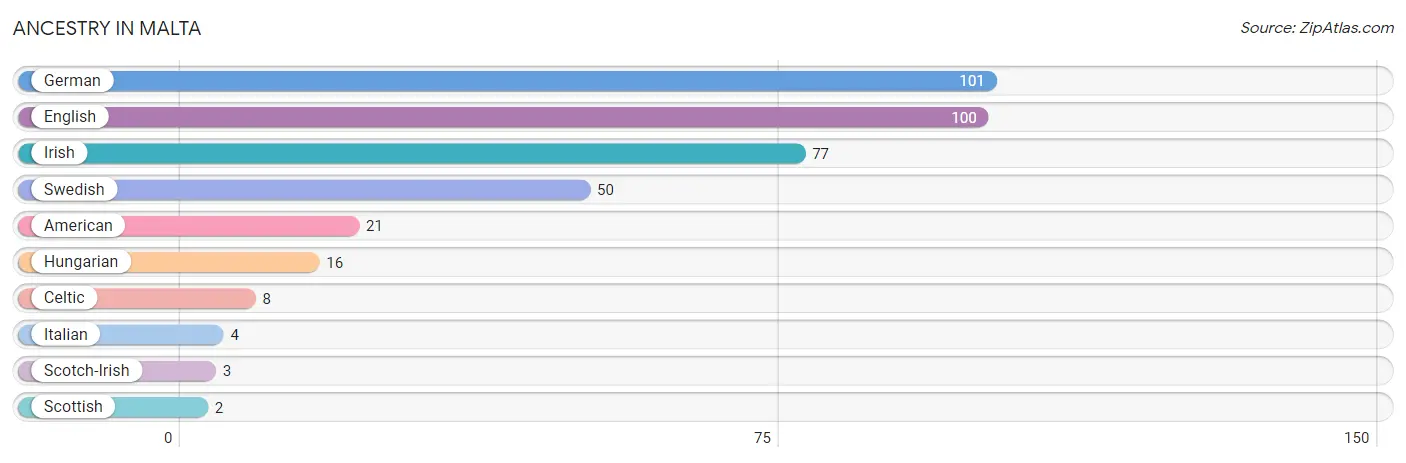
| Ancestry | # Population | % Population |
| American | 21 | 3.1% |
| Celtic | 8 | 1.2% |
| English | 100 | 14.8% |
| German | 101 | 14.9% |
| Hungarian | 16 | 2.4% |
| Irish | 77 | 11.4% |
| Italian | 4 | 0.6% |
| Scotch-Irish | 3 | 0.4% |
| Scottish | 2 | 0.3% |
| Swedish | 50 | 7.4% | View All 10 Rows |
Immigrants in Malta
The most numerous immigrant groups reported in Malta came from , and Canada (1 | 0.2%), together accounting for 0.2% of all Malta residents.

| Immigration Origin | # Population | % Population |
| Canada | 1 | 0.2% | View All 1 Rows |
Sex and Age in Malta
Sex and Age in Malta
The most populous age groups in Malta are 25 to 29 Years (53 | 16.5%) for men and 25 to 29 Years (62 | 17.4%) for women.
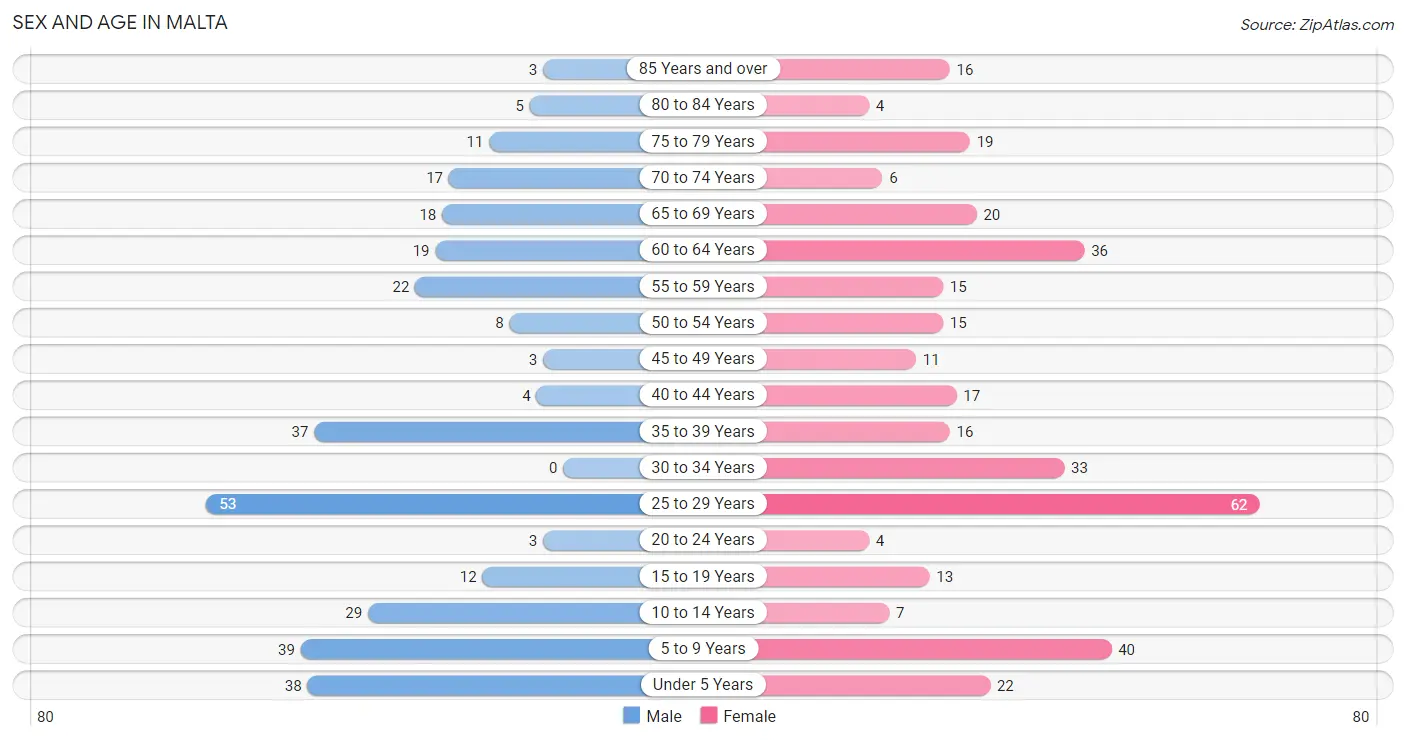
| Age Bracket | Male | Female |
| Under 5 Years | 38 (11.8%) | 22 (6.2%) |
| 5 to 9 Years | 39 (12.1%) | 40 (11.2%) |
| 10 to 14 Years | 29 (9.0%) | 7 (2.0%) |
| 15 to 19 Years | 12 (3.7%) | 13 (3.6%) |
| 20 to 24 Years | 3 (0.9%) | 4 (1.1%) |
| 25 to 29 Years | 53 (16.5%) | 62 (17.4%) |
| 30 to 34 Years | 0 (0.0%) | 33 (9.3%) |
| 35 to 39 Years | 37 (11.5%) | 16 (4.5%) |
| 40 to 44 Years | 4 (1.3%) | 17 (4.8%) |
| 45 to 49 Years | 3 (0.9%) | 11 (3.1%) |
| 50 to 54 Years | 8 (2.5%) | 15 (4.2%) |
| 55 to 59 Years | 22 (6.9%) | 15 (4.2%) |
| 60 to 64 Years | 19 (5.9%) | 36 (10.1%) |
| 65 to 69 Years | 18 (5.6%) | 20 (5.6%) |
| 70 to 74 Years | 17 (5.3%) | 6 (1.7%) |
| 75 to 79 Years | 11 (3.4%) | 19 (5.3%) |
| 80 to 84 Years | 5 (1.6%) | 4 (1.1%) |
| 85 Years and over | 3 (0.9%) | 16 (4.5%) |
| Total | 321 (100.0%) | 356 (100.0%) |
Families and Households in Malta
Median Family Size in Malta
The median family size in Malta is 2.87 persons per family, with single female/mother families (32 | 19.4%) accounting for the largest median family size of 3.38 persons per family. On the other hand, single male/father families (39 | 23.6%) represent the smallest median family size with 2.62 persons per family.
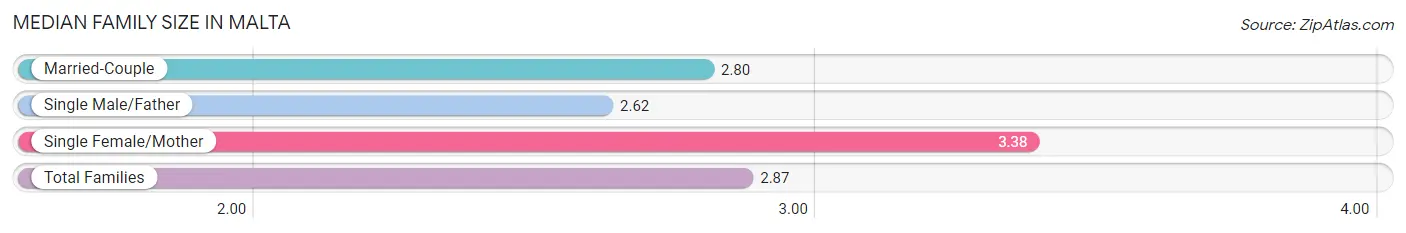
| Family Type | # Families | Family Size |
| Married-Couple | 94 (57.0%) | 2.80 |
| Single Male/Father | 39 (23.6%) | 2.62 |
| Single Female/Mother | 32 (19.4%) | 3.38 |
| Total Families | 165 (100.0%) | 2.87 |
Median Household Size in Malta
The median household size in Malta is 2.45 persons per household, with single male/father households (39 | 14.2%) accounting for the largest median household size of 3.51 persons per household. non-family households (110 | 40.0%) represent the smallest median household size with 1.48 persons per household.
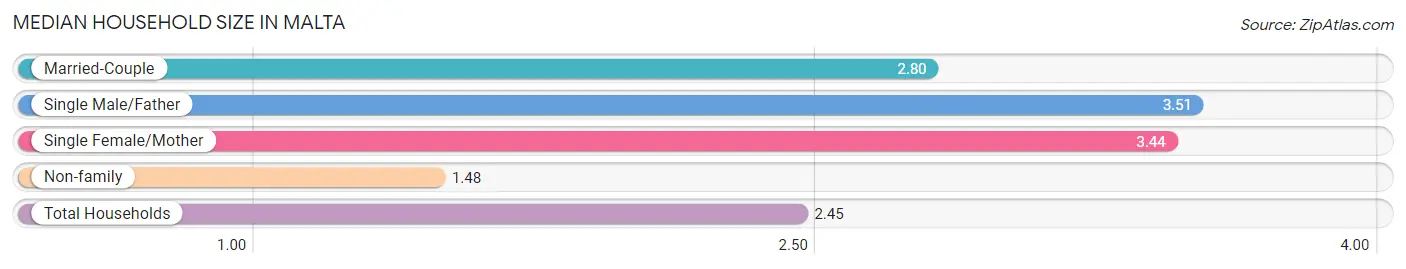
| Household Type | # Households | Household Size |
| Married-Couple | 94 (34.2%) | 2.80 |
| Single Male/Father | 39 (14.2%) | 3.51 |
| Single Female/Mother | 32 (11.6%) | 3.44 |
| Non-family | 110 (40.0%) | 1.48 |
| Total Households | 275 (100.0%) | 2.45 |
Household Size by Marriage Status in Malta
Out of a total of 275 households in Malta, 165 (60.0%) are family households, while 110 (40.0%) are nonfamily households. The most numerous type of family households are 2-person households, comprising 87, and the most common type of nonfamily households are 1-person households, comprising 78.
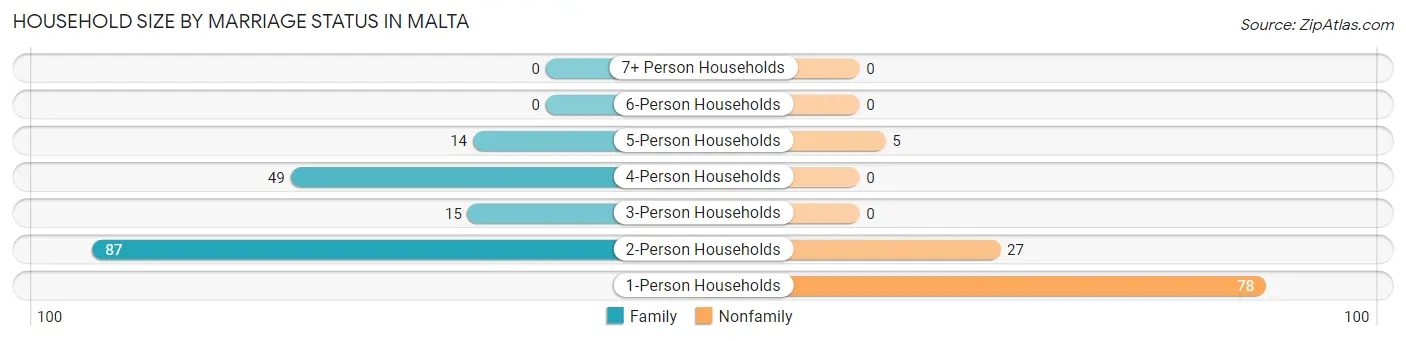
| Household Size | Family Households | Nonfamily Households |
| 1-Person Households | - | 78 (28.4%) |
| 2-Person Households | 87 (31.6%) | 27 (9.8%) |
| 3-Person Households | 15 (5.4%) | 0 (0.0%) |
| 4-Person Households | 49 (17.8%) | 0 (0.0%) |
| 5-Person Households | 14 (5.1%) | 5 (1.8%) |
| 6-Person Households | 0 (0.0%) | 0 (0.0%) |
| 7+ Person Households | 0 (0.0%) | 0 (0.0%) |
| Total | 165 (60.0%) | 110 (40.0%) |
Female Fertility in Malta
Fertility by Age in Malta
Average fertility rate in Malta is 38.0 births per 1,000 women. Women in the age bracket of 20 to 34 years have the highest fertility rate with 61.0 births per 1,000 women. Women in the age bracket of 20 to 34 years acount for 100.0% of all women with births.
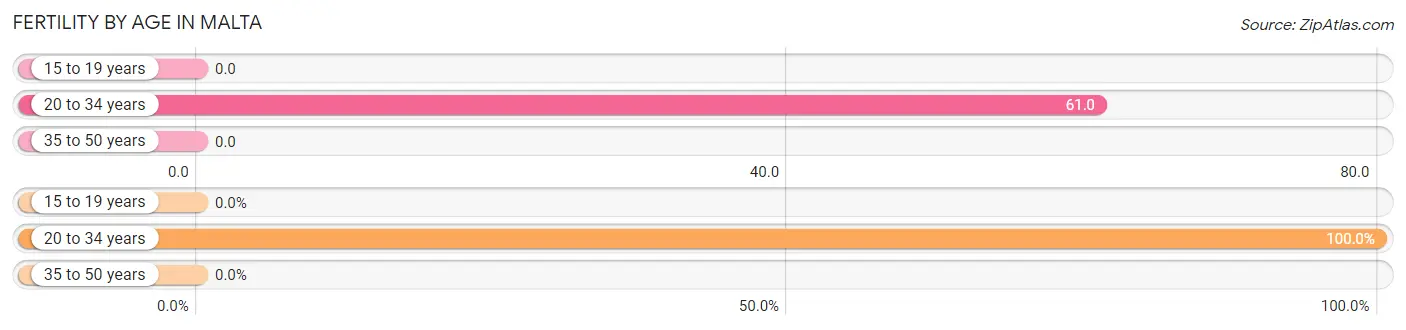
| Age Bracket | Women with Births | Births / 1,000 Women |
| 15 to 19 years | 0 (0.0%) | 0.0 |
| 20 to 34 years | 6 (100.0%) | 61.0 |
| 35 to 50 years | 0 (0.0%) | 0.0 |
| Total | 6 (100.0%) | 38.0 |
Fertility by Age by Marriage Status in Malta
66.7% of women with births (6) in Malta are married. The highest percentage of unmarried women with births falls into 20 to 34 years age bracket with 33.3% of them unmarried at the time of birth, while the lowest percentage of unmarried women with births belong to 20 to 34 years age bracket with 33.3% of them unmarried.
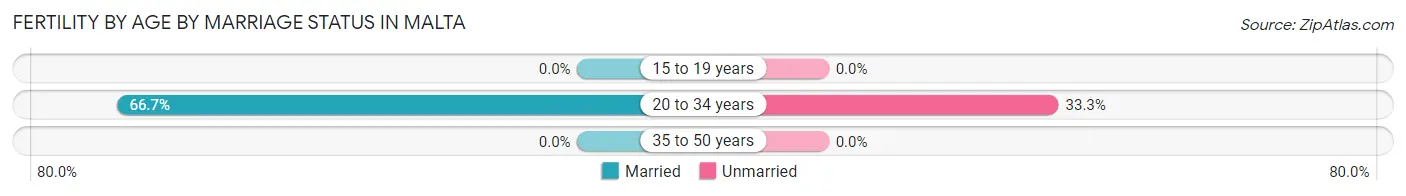
| Age Bracket | Married | Unmarried |
| 15 to 19 years | 0 (0.0%) | 0 (0.0%) |
| 20 to 34 years | 4 (66.7%) | 2 (33.3%) |
| 35 to 50 years | 0 (0.0%) | 0 (0.0%) |
| Total | 4 (66.7%) | 2 (33.3%) |
Fertility by Education in Malta
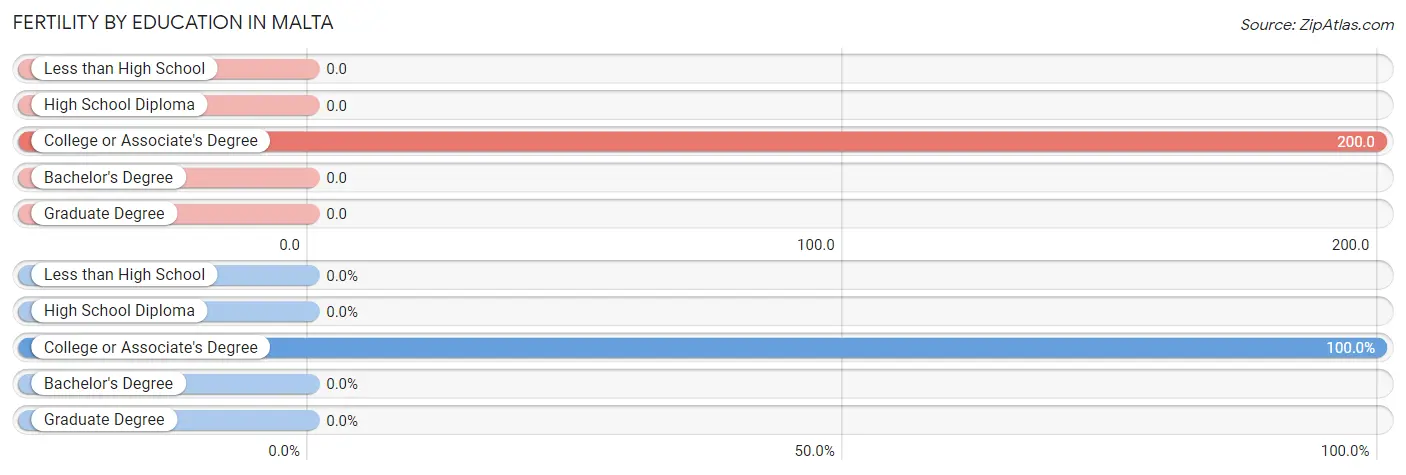
| Educational Attainment | Women with Births | Births / 1,000 Women |
| Less than High School | 0 (0.0%) | 0.0 |
| High School Diploma | 0 (0.0%) | 0.0 |
| College or Associate's Degree | 6 (100.0%) | 200.0 |
| Bachelor's Degree | 0 (0.0%) | 0.0 |
| Graduate Degree | 0 (0.0%) | 0.0 |
| Total | 6 (100.0%) | 38.0 |
Fertility by Education by Marriage Status in Malta
33.3% of women with births in Malta are unmarried. Women with the educational attainment of college or associate's degree are most likely to be married with 66.7% of them married at childbirth, while women with the educational attainment of college or associate's degree are least likely to be married with 33.3% of them unmarried at childbirth.
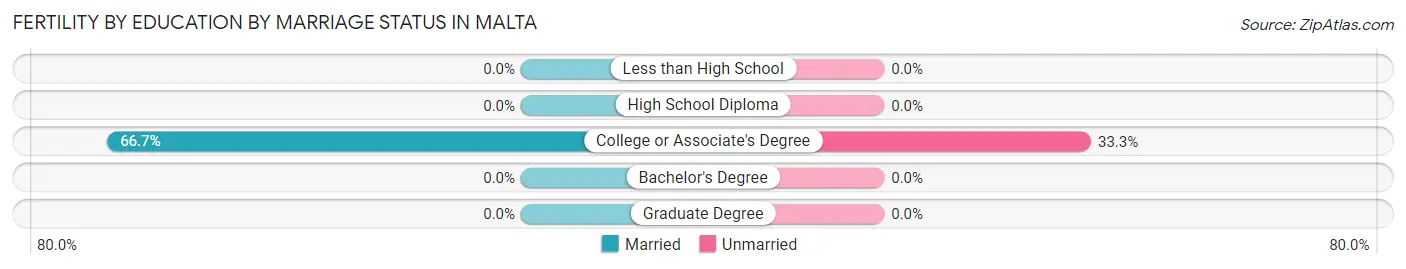
| Educational Attainment | Married | Unmarried |
| Less than High School | 0 (0.0%) | 0 (0.0%) |
| High School Diploma | 0 (0.0%) | 0 (0.0%) |
| College or Associate's Degree | 4 (66.7%) | 2 (33.3%) |
| Bachelor's Degree | 0 (0.0%) | 0 (0.0%) |
| Graduate Degree | 0 (0.0%) | 0 (0.0%) |
| Total | 4 (66.7%) | 2 (33.3%) |
Employment Characteristics in Malta
Employment by Class of Employer in Malta
Among the 236 employed individuals in Malta, private company employees (162 | 68.6%), local government employees (35 | 14.8%), and not-for-profit organizations (32 | 13.6%) make up the most common classes of employment.
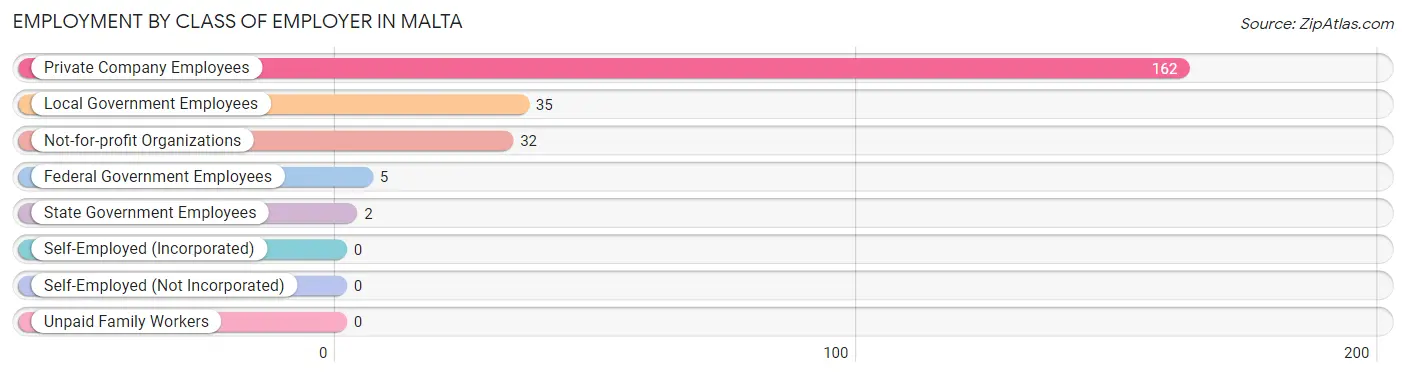
| Employer Class | # Employees | % Employees |
| Private Company Employees | 162 | 68.6% |
| Self-Employed (Incorporated) | 0 | 0.0% |
| Self-Employed (Not Incorporated) | 0 | 0.0% |
| Not-for-profit Organizations | 32 | 13.6% |
| Local Government Employees | 35 | 14.8% |
| State Government Employees | 2 | 0.9% |
| Federal Government Employees | 5 | 2.1% |
| Unpaid Family Workers | 0 | 0.0% |
| Total | 236 | 100.0% |
Employment Status by Age in Malta
According to the labor force statistics for Malta, out of the total population over 16 years of age (491), 54.4% or 267 individuals are in the labor force, with 11.6% or 31 of them unemployed. The age group with the highest labor force participation rate is 20 to 24 years, with 100.0% or 7 individuals in the labor force. Within the labor force, the 25 to 29 years age range has the highest percentage of unemployed individuals, with 28.8% or 23 of them being unemployed.
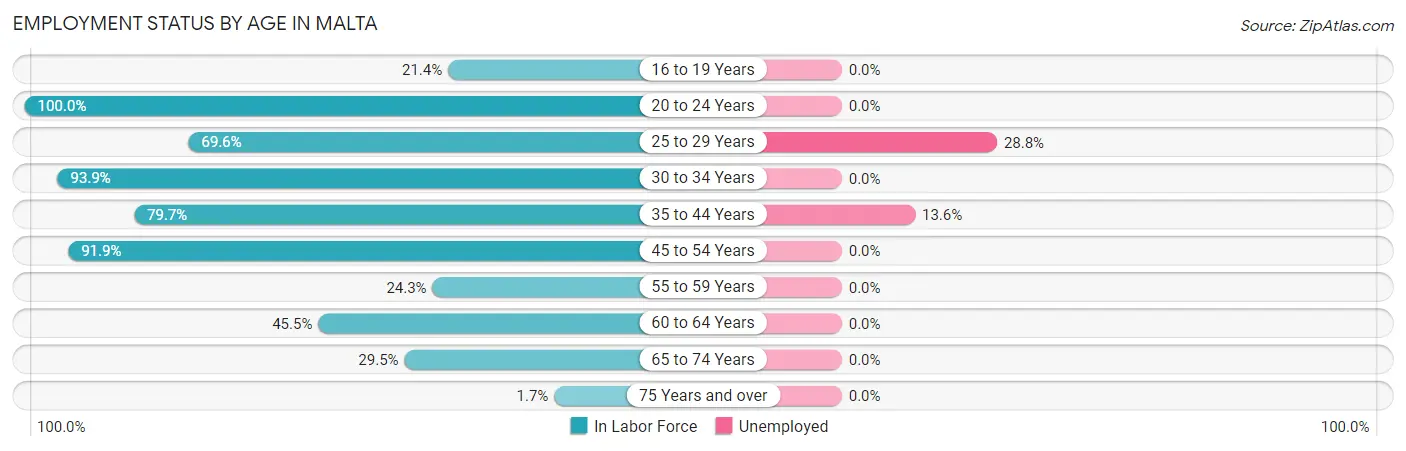
| Age Bracket | In Labor Force | Unemployed |
| 16 to 19 Years | 3 (21.4%) | 0 (0.0%) |
| 20 to 24 Years | 7 (100.0%) | 0 (0.0%) |
| 25 to 29 Years | 80 (69.6%) | 23 (28.8%) |
| 30 to 34 Years | 31 (93.9%) | 0 (0.0%) |
| 35 to 44 Years | 59 (79.7%) | 8 (13.6%) |
| 45 to 54 Years | 34 (91.9%) | 0 (0.0%) |
| 55 to 59 Years | 9 (24.3%) | 0 (0.0%) |
| 60 to 64 Years | 25 (45.5%) | 0 (0.0%) |
| 65 to 74 Years | 18 (29.5%) | 0 (0.0%) |
| 75 Years and over | 1 (1.7%) | 0 (0.0%) |
| Total | 267 (54.4%) | 31 (11.6%) |
Employment Status by Educational Attainment in Malta
According to labor force statistics for Malta, 67.8% of individuals (238) out of the total population between 25 and 64 years of age (351) are in the labor force, with 13.0% or 31 of them being unemployed. The group with the highest labor force participation rate are those with the educational attainment of bachelor's degree or higher, with 91.1% or 41 individuals in the labor force. Within the labor force, individuals with college / associate degree education have the highest percentage of unemployment, with 25.8% or 23 of them being unemployed.
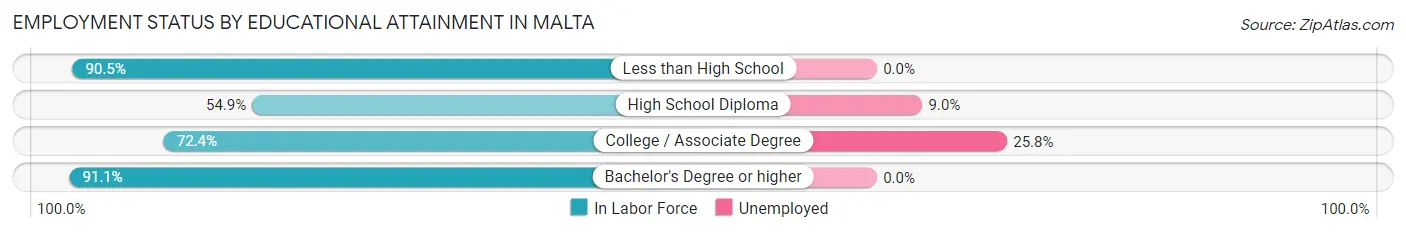
| Educational Attainment | In Labor Force | Unemployed |
| Less than High School | 19 (90.5%) | 0 (0.0%) |
| High School Diploma | 89 (54.9%) | 15 (9.0%) |
| College / Associate Degree | 89 (72.4%) | 32 (25.8%) |
| Bachelor's Degree or higher | 41 (91.1%) | 0 (0.0%) |
| Total | 238 (67.8%) | 46 (13.0%) |
Employment Occupations by Sex in Malta
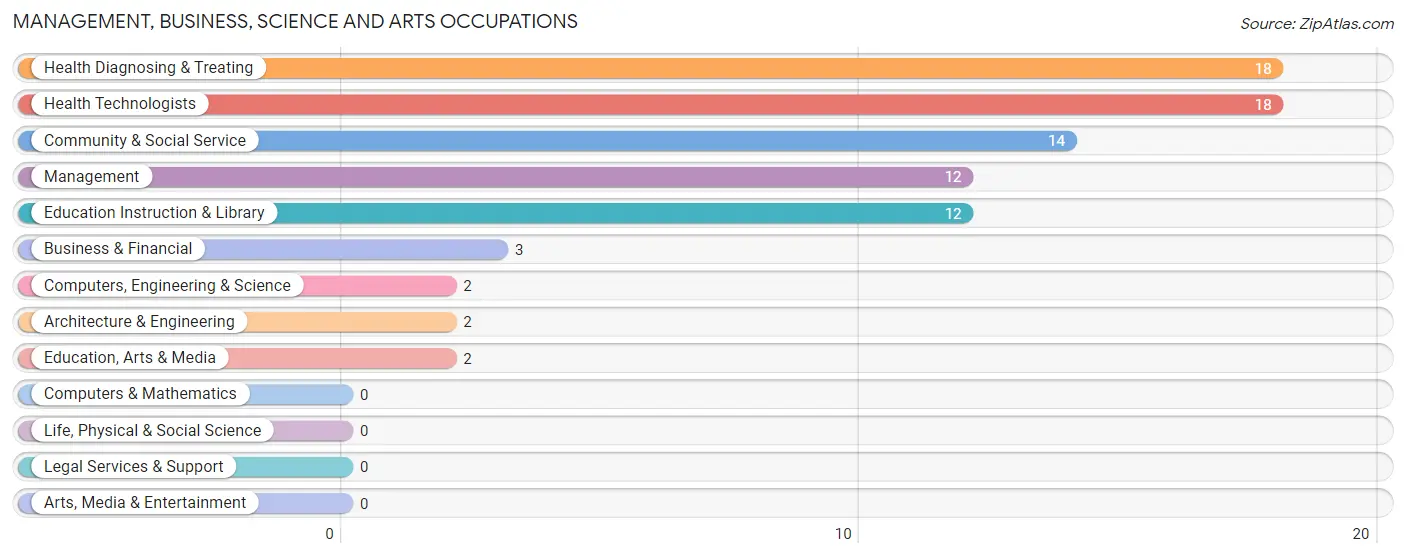
Management, Business, Science and Arts Occupations
The most common Management, Business, Science and Arts occupations in Malta are Health Diagnosing & Treating (18 | 7.6%), Health Technologists (18 | 7.6%), Community & Social Service (14 | 5.9%), Management (12 | 5.1%), and Education Instruction & Library (12 | 5.1%).
Management, Business, Science and Arts Occupations by Sex
Within the Management, Business, Science and Arts occupations in Malta, the most male-oriented occupations are Business & Financial (100.0%), Computers, Engineering & Science (100.0%), and Architecture & Engineering (100.0%), while the most female-oriented occupations are Education, Arts & Media (100.0%), Health Diagnosing & Treating (100.0%), and Health Technologists (100.0%).
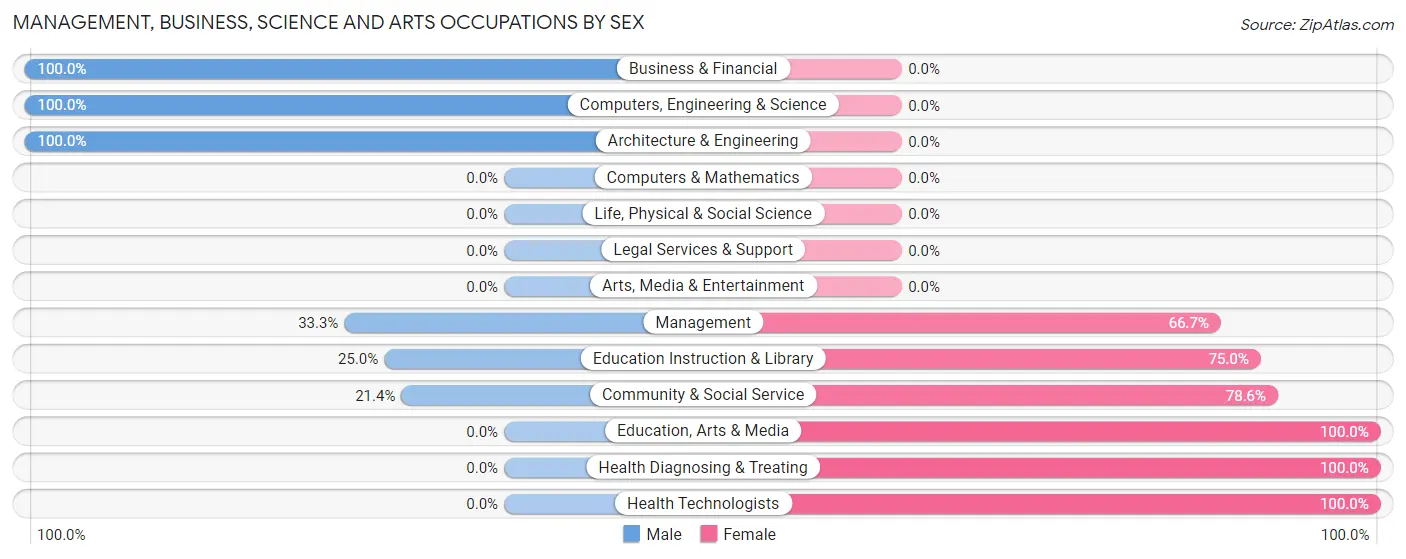
| Occupation | Male | Female |
| Management | 4 (33.3%) | 8 (66.7%) |
| Business & Financial | 3 (100.0%) | 0 (0.0%) |
| Computers, Engineering & Science | 2 (100.0%) | 0 (0.0%) |
| Computers & Mathematics | 0 (0.0%) | 0 (0.0%) |
| Architecture & Engineering | 2 (100.0%) | 0 (0.0%) |
| Life, Physical & Social Science | 0 (0.0%) | 0 (0.0%) |
| Community & Social Service | 3 (21.4%) | 11 (78.6%) |
| Education, Arts & Media | 0 (0.0%) | 2 (100.0%) |
| Legal Services & Support | 0 (0.0%) | 0 (0.0%) |
| Education Instruction & Library | 3 (25.0%) | 9 (75.0%) |
| Arts, Media & Entertainment | 0 (0.0%) | 0 (0.0%) |
| Health Diagnosing & Treating | 0 (0.0%) | 18 (100.0%) |
| Health Technologists | 0 (0.0%) | 18 (100.0%) |
| Total (Category) | 12 (24.5%) | 37 (75.5%) |
| Total (Overall) | 91 (38.6%) | 145 (61.4%) |
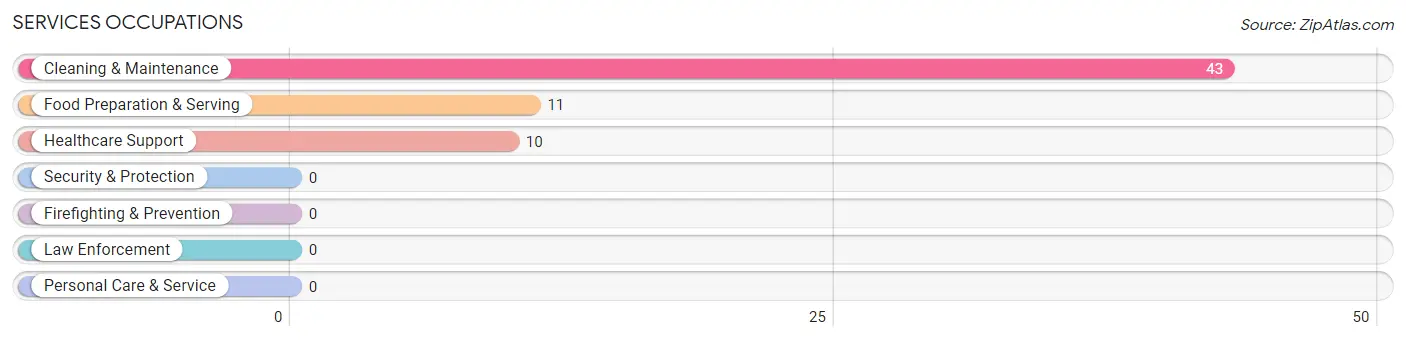
Services Occupations
The most common Services occupations in Malta are Cleaning & Maintenance (43 | 18.2%), Food Preparation & Serving (11 | 4.7%), and Healthcare Support (10 | 4.2%).
Services Occupations by Sex
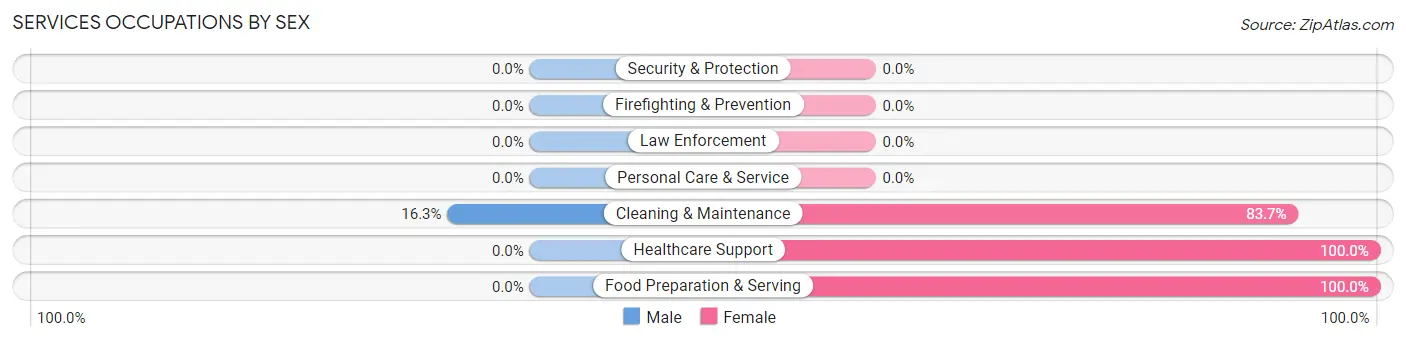
| Occupation | Male | Female |
| Healthcare Support | 0 (0.0%) | 10 (100.0%) |
| Security & Protection | 0 (0.0%) | 0 (0.0%) |
| Firefighting & Prevention | 0 (0.0%) | 0 (0.0%) |
| Law Enforcement | 0 (0.0%) | 0 (0.0%) |
| Food Preparation & Serving | 0 (0.0%) | 11 (100.0%) |
| Cleaning & Maintenance | 7 (16.3%) | 36 (83.7%) |
| Personal Care & Service | 0 (0.0%) | 0 (0.0%) |
| Total (Category) | 7 (10.9%) | 57 (89.1%) |
| Total (Overall) | 91 (38.6%) | 145 (61.4%) |
Sales and Office Occupations
The most common Sales and Office occupations in Malta are Office & Administration (21 | 8.9%), and Sales & Related (18 | 7.6%).

Sales and Office Occupations by Sex

| Occupation | Male | Female |
| Sales & Related | 1 (5.6%) | 17 (94.4%) |
| Office & Administration | 6 (28.6%) | 15 (71.4%) |
| Total (Category) | 7 (17.9%) | 32 (82.1%) |
| Total (Overall) | 91 (38.6%) | 145 (61.4%) |
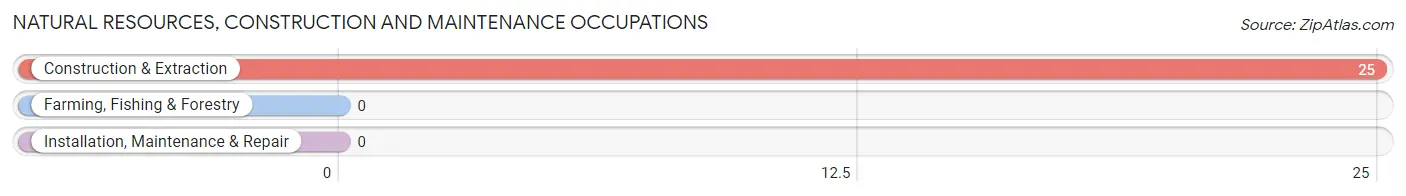
Natural Resources, Construction and Maintenance Occupations
The most common Natural Resources, Construction and Maintenance occupations in Malta are , and Construction & Extraction (25 | 10.6%).
Natural Resources, Construction and Maintenance Occupations by Sex
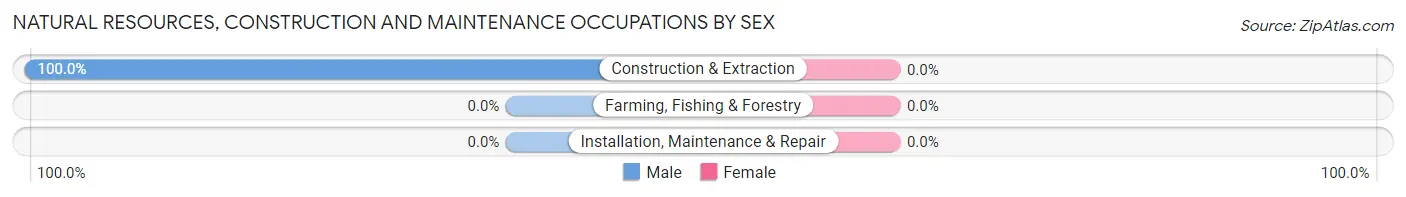
| Occupation | Male | Female |
| Farming, Fishing & Forestry | 0 (0.0%) | 0 (0.0%) |
| Construction & Extraction | 25 (100.0%) | 0 (0.0%) |
| Installation, Maintenance & Repair | 0 (0.0%) | 0 (0.0%) |
| Total (Category) | 25 (100.0%) | 0 (0.0%) |
| Total (Overall) | 91 (38.6%) | 145 (61.4%) |
Production, Transportation and Moving Occupations
The most common Production, Transportation and Moving occupations in Malta are Production (30 | 12.7%), Transportation (15 | 6.4%), and Material Moving (14 | 5.9%).
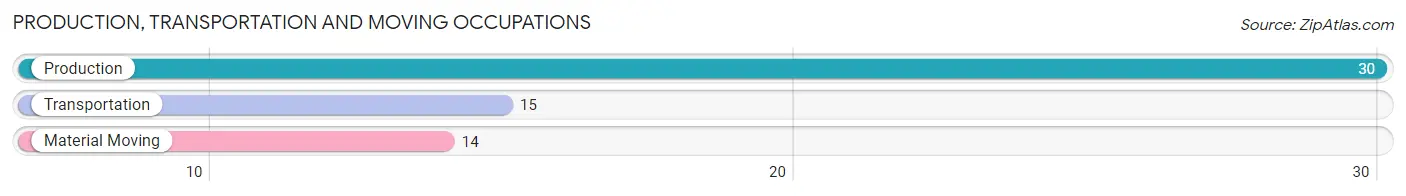
Production, Transportation and Moving Occupations by Sex
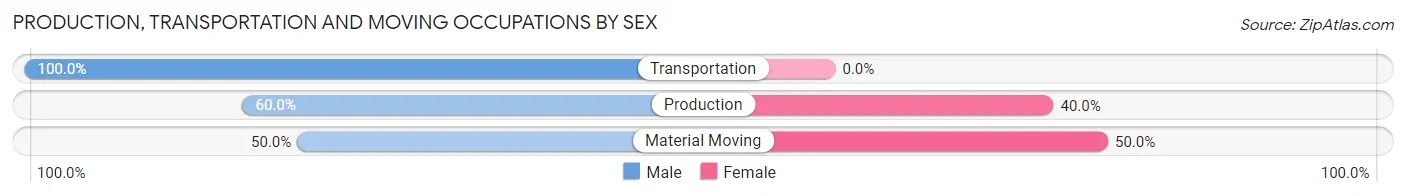
| Occupation | Male | Female |
| Production | 18 (60.0%) | 12 (40.0%) |
| Transportation | 15 (100.0%) | 0 (0.0%) |
| Material Moving | 7 (50.0%) | 7 (50.0%) |
| Total (Category) | 40 (67.8%) | 19 (32.2%) |
| Total (Overall) | 91 (38.6%) | 145 (61.4%) |
Employment Industries by Sex in Malta
Employment Industries in Malta
The major employment industries in Malta include Health Care & Social Assistance (72 | 30.5%), Accommodation & Food Services (31 | 13.1%), Manufacturing (23 | 9.8%), Construction (20 | 8.5%), and Educational Services (18 | 7.6%).
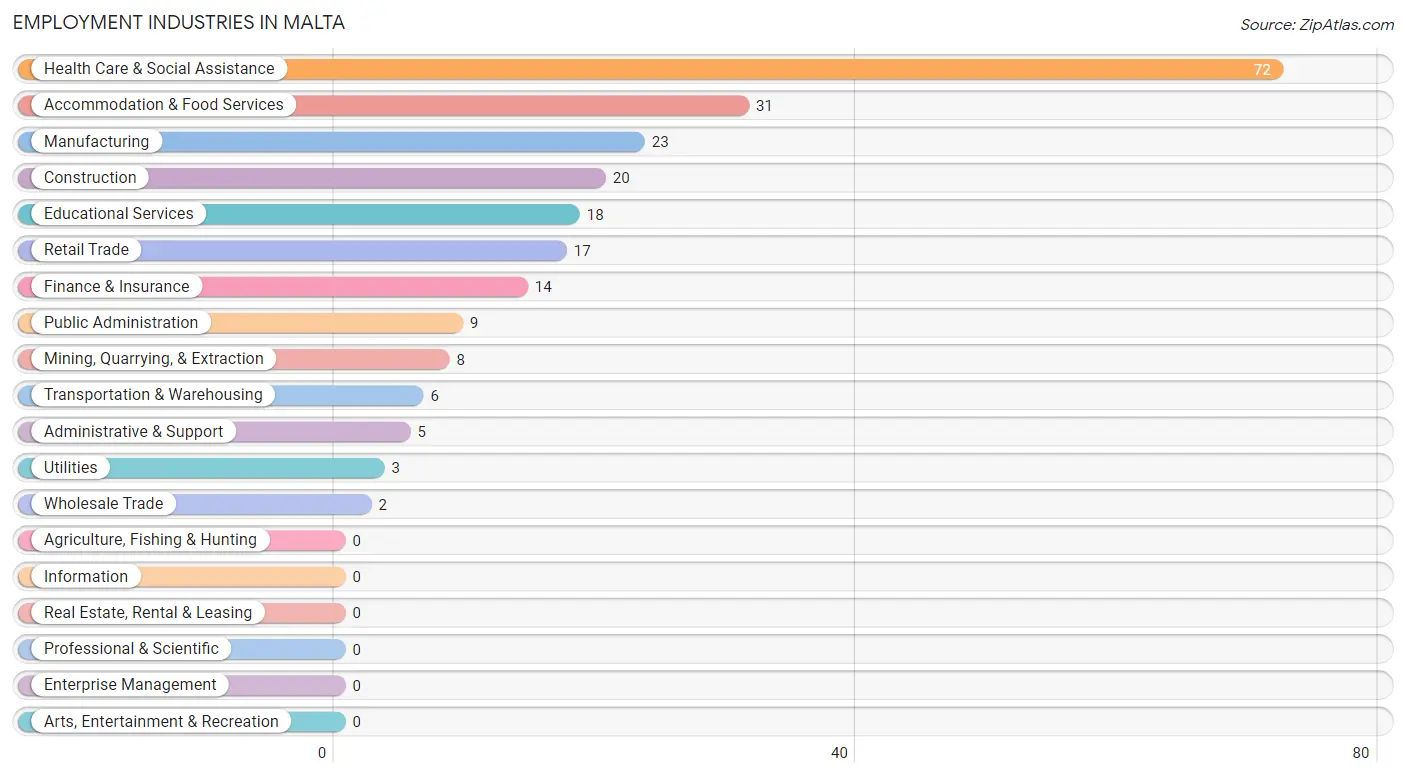
Employment Industries by Sex in Malta
The Malta industries that see more men than women are Mining, Quarrying, & Extraction (100.0%), Construction (100.0%), and Wholesale Trade (100.0%), whereas the industries that tend to have a higher number of women are Utilities (100.0%), Accommodation & Food Services (100.0%), and Health Care & Social Assistance (88.9%).

| Industry | Male | Female |
| Agriculture, Fishing & Hunting | 0 (0.0%) | 0 (0.0%) |
| Mining, Quarrying, & Extraction | 8 (100.0%) | 0 (0.0%) |
| Construction | 20 (100.0%) | 0 (0.0%) |
| Manufacturing | 19 (82.6%) | 4 (17.4%) |
| Wholesale Trade | 2 (100.0%) | 0 (0.0%) |
| Retail Trade | 5 (29.4%) | 12 (70.6%) |
| Transportation & Warehousing | 6 (100.0%) | 0 (0.0%) |
| Utilities | 0 (0.0%) | 3 (100.0%) |
| Information | 0 (0.0%) | 0 (0.0%) |
| Finance & Insurance | 2 (14.3%) | 12 (85.7%) |
| Real Estate, Rental & Leasing | 0 (0.0%) | 0 (0.0%) |
| Professional & Scientific | 0 (0.0%) | 0 (0.0%) |
| Enterprise Management | 0 (0.0%) | 0 (0.0%) |
| Administrative & Support | 5 (100.0%) | 0 (0.0%) |
| Educational Services | 4 (22.2%) | 14 (77.8%) |
| Health Care & Social Assistance | 8 (11.1%) | 64 (88.9%) |
| Arts, Entertainment & Recreation | 0 (0.0%) | 0 (0.0%) |
| Accommodation & Food Services | 0 (0.0%) | 31 (100.0%) |
| Public Administration | 9 (100.0%) | 0 (0.0%) |
| Total | 91 (38.6%) | 145 (61.4%) |
Education in Malta
School Enrollment in Malta
The most common levels of schooling among the 165 students in Malta are elementary school (79 | 47.9%), middle school (29 | 17.6%), and high school (29 | 17.6%).
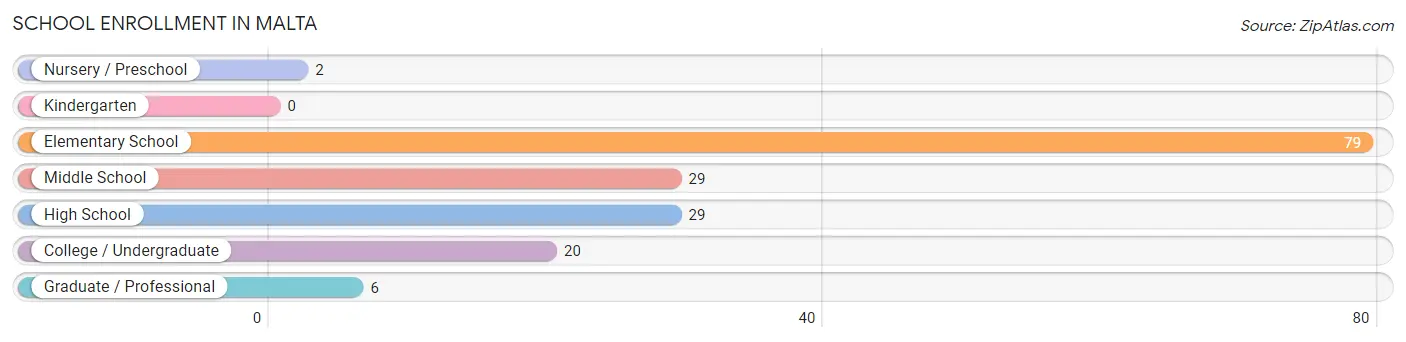
| School Level | # Students | % Students |
| Nursery / Preschool | 2 | 1.2% |
| Kindergarten | 0 | 0.0% |
| Elementary School | 79 | 47.9% |
| Middle School | 29 | 17.6% |
| High School | 29 | 17.6% |
| College / Undergraduate | 20 | 12.1% |
| Graduate / Professional | 6 | 3.6% |
| Total | 165 | 100.0% |
School Enrollment by Age by Funding Source in Malta
Out of a total of 165 students who are enrolled in schools in Malta, 17 (10.3%) attend a private institution, while the remaining 148 (89.7%) are enrolled in public schools. The age group of 35 years and over has the highest likelihood of being enrolled in private schools, with 2 (100.0% in the age bracket) enrolled. Conversely, the age group of 3 to 4 year olds has the lowest likelihood of being enrolled in a private school, with 2 (100.0% in the age bracket) attending a public institution.
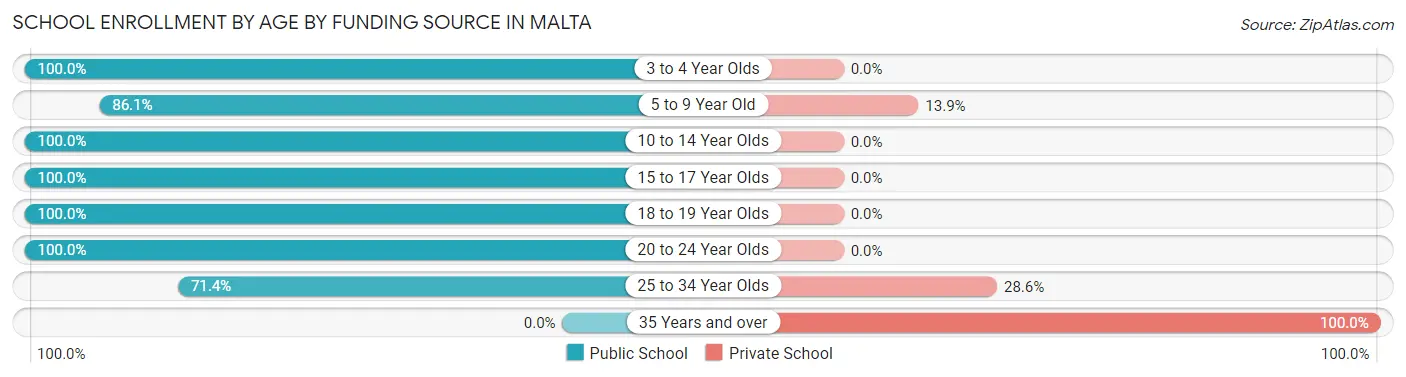
| Age Bracket | Public School | Private School |
| 3 to 4 Year Olds | 2 (100.0%) | 0 (0.0%) |
| 5 to 9 Year Old | 68 (86.1%) | 11 (13.9%) |
| 10 to 14 Year Olds | 36 (100.0%) | 0 (0.0%) |
| 15 to 17 Year Olds | 15 (100.0%) | 0 (0.0%) |
| 18 to 19 Year Olds | 10 (100.0%) | 0 (0.0%) |
| 20 to 24 Year Olds | 7 (100.0%) | 0 (0.0%) |
| 25 to 34 Year Olds | 10 (71.4%) | 4 (28.6%) |
| 35 Years and over | 0 (0.0%) | 2 (100.0%) |
| Total | 148 (89.7%) | 17 (10.3%) |
Educational Attainment by Field of Study in Malta
Science & technology (16 | 21.6%), communications (16 | 21.6%), physical & health sciences (11 | 14.9%), education (11 | 14.9%), and psychology (9 | 12.2%) are the most common fields of study among 74 individuals in Malta who have obtained a bachelor's degree or higher.
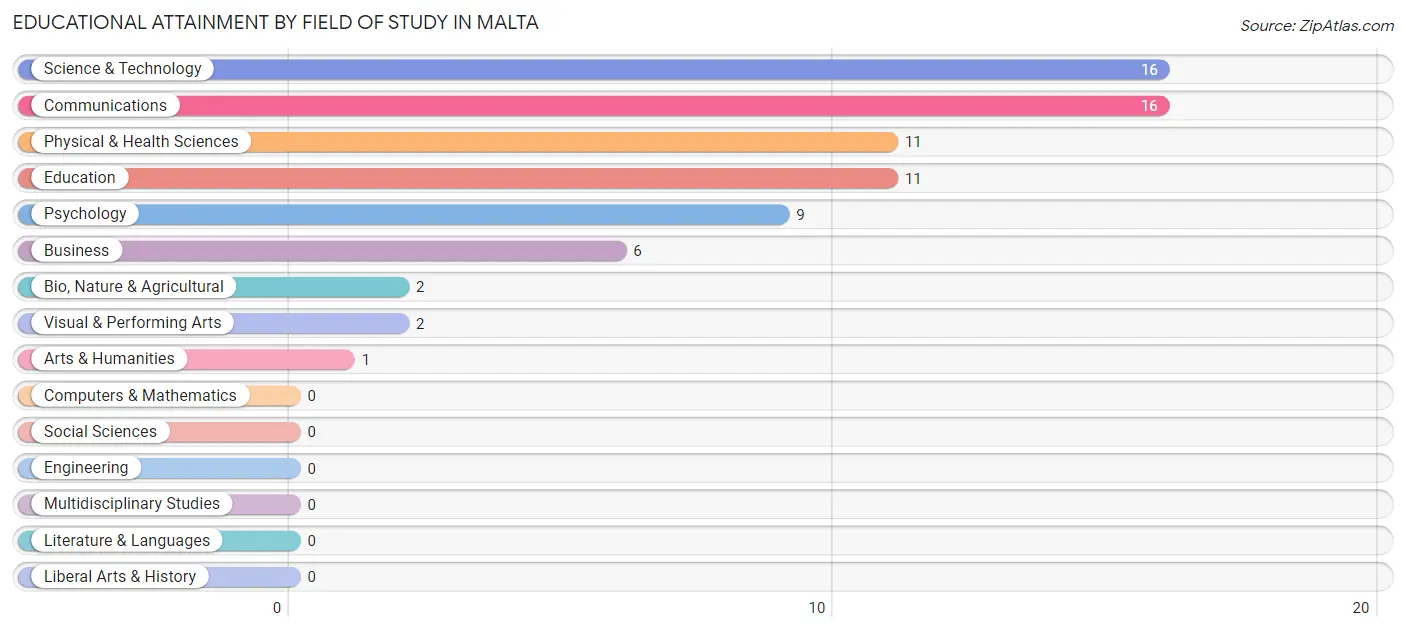
| Field of Study | # Graduates | % Graduates |
| Computers & Mathematics | 0 | 0.0% |
| Bio, Nature & Agricultural | 2 | 2.7% |
| Physical & Health Sciences | 11 | 14.9% |
| Psychology | 9 | 12.2% |
| Social Sciences | 0 | 0.0% |
| Engineering | 0 | 0.0% |
| Multidisciplinary Studies | 0 | 0.0% |
| Science & Technology | 16 | 21.6% |
| Business | 6 | 8.1% |
| Education | 11 | 14.9% |
| Literature & Languages | 0 | 0.0% |
| Liberal Arts & History | 0 | 0.0% |
| Visual & Performing Arts | 2 | 2.7% |
| Communications | 16 | 21.6% |
| Arts & Humanities | 1 | 1.3% |
| Total | 74 | 100.0% |
Transportation & Commute in Malta
Vehicle Availability by Sex in Malta
The most prevalent vehicle ownership categories in Malta are males with 2 vehicles (55, accounting for 60.4%) and females with 2 vehicles (39, making up 38.2%).
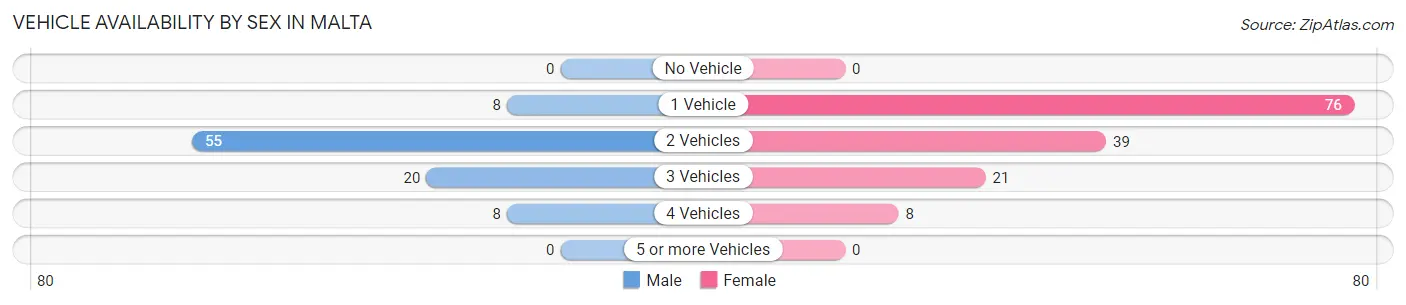
| Vehicles Available | Male | Female |
| No Vehicle | 0 (0.0%) | 0 (0.0%) |
| 1 Vehicle | 8 (8.8%) | 76 (52.8%) |
| 2 Vehicles | 55 (60.4%) | 39 (27.1%) |
| 3 Vehicles | 20 (22.0%) | 21 (14.6%) |
| 4 Vehicles | 8 (8.8%) | 8 (5.6%) |
| 5 or more Vehicles | 0 (0.0%) | 0 (0.0%) |
| Total | 91 (100.0%) | 144 (100.0%) |
Commute Time in Malta
The most frequently occuring commute durations in Malta are 5 to 9 minutes (52 commuters, 22.3%), 45 to 59 minutes (49 commuters, 21.0%), and less than 5 minutes (39 commuters, 16.7%).
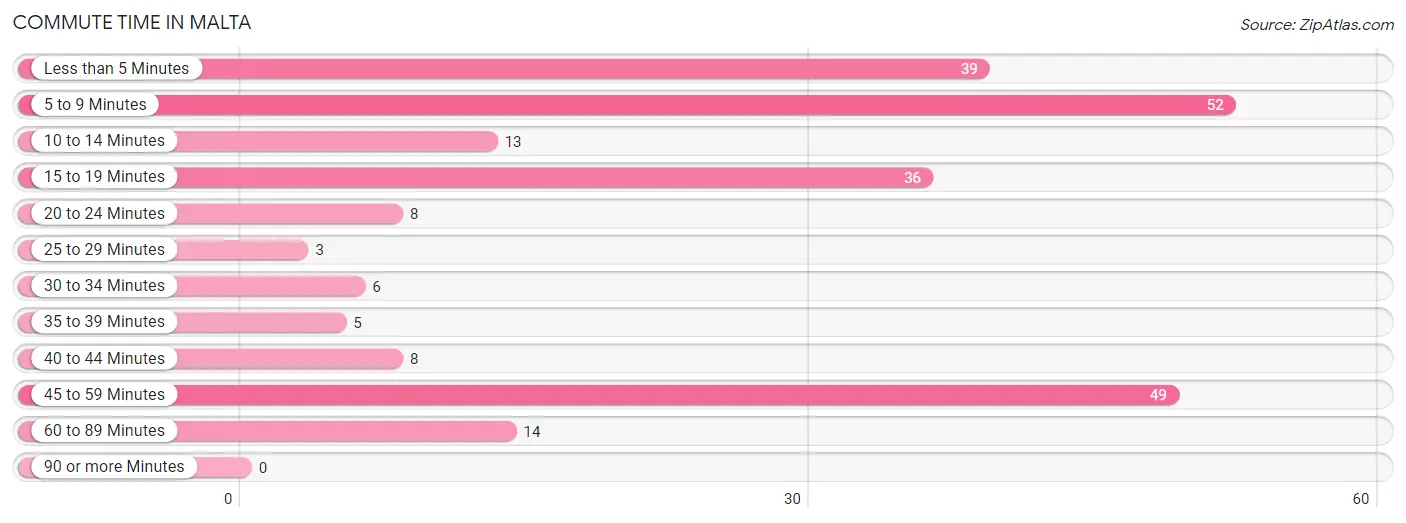
| Commute Time | # Commuters | % Commuters |
| Less than 5 Minutes | 39 | 16.7% |
| 5 to 9 Minutes | 52 | 22.3% |
| 10 to 14 Minutes | 13 | 5.6% |
| 15 to 19 Minutes | 36 | 15.4% |
| 20 to 24 Minutes | 8 | 3.4% |
| 25 to 29 Minutes | 3 | 1.3% |
| 30 to 34 Minutes | 6 | 2.6% |
| 35 to 39 Minutes | 5 | 2.1% |
| 40 to 44 Minutes | 8 | 3.4% |
| 45 to 59 Minutes | 49 | 21.0% |
| 60 to 89 Minutes | 14 | 6.0% |
| 90 or more Minutes | 0 | 0.0% |
Commute Time by Sex in Malta
The most common commute times in Malta are 5 to 9 minutes (29 commuters, 31.9%) for males and 15 to 19 minutes (31 commuters, 21.8%) for females.
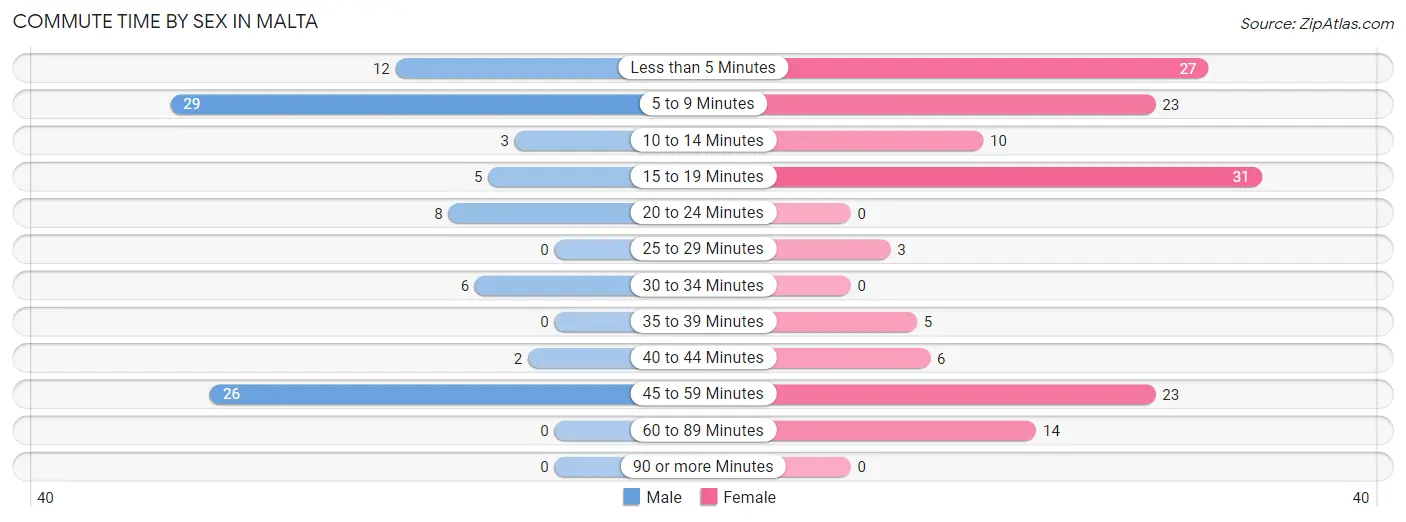
| Commute Time | Male | Female |
| Less than 5 Minutes | 12 (13.2%) | 27 (19.0%) |
| 5 to 9 Minutes | 29 (31.9%) | 23 (16.2%) |
| 10 to 14 Minutes | 3 (3.3%) | 10 (7.0%) |
| 15 to 19 Minutes | 5 (5.5%) | 31 (21.8%) |
| 20 to 24 Minutes | 8 (8.8%) | 0 (0.0%) |
| 25 to 29 Minutes | 0 (0.0%) | 3 (2.1%) |
| 30 to 34 Minutes | 6 (6.6%) | 0 (0.0%) |
| 35 to 39 Minutes | 0 (0.0%) | 5 (3.5%) |
| 40 to 44 Minutes | 2 (2.2%) | 6 (4.2%) |
| 45 to 59 Minutes | 26 (28.6%) | 23 (16.2%) |
| 60 to 89 Minutes | 0 (0.0%) | 14 (9.9%) |
| 90 or more Minutes | 0 (0.0%) | 0 (0.0%) |
Time of Departure to Work by Sex in Malta
The most frequent times of departure to work in Malta are 12:00 PM to 3:59 PM (25, 27.5%) for males and 8:00 AM to 8:29 AM (29, 20.4%) for females.
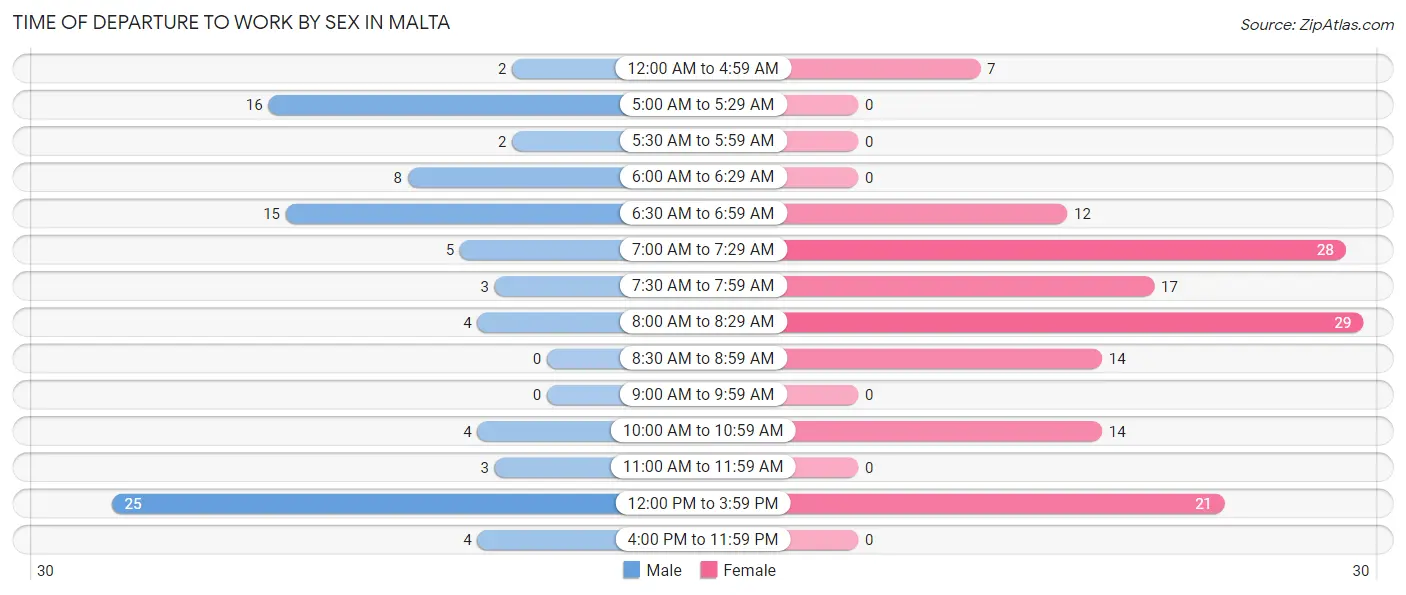
| Time of Departure | Male | Female |
| 12:00 AM to 4:59 AM | 2 (2.2%) | 7 (4.9%) |
| 5:00 AM to 5:29 AM | 16 (17.6%) | 0 (0.0%) |
| 5:30 AM to 5:59 AM | 2 (2.2%) | 0 (0.0%) |
| 6:00 AM to 6:29 AM | 8 (8.8%) | 0 (0.0%) |
| 6:30 AM to 6:59 AM | 15 (16.5%) | 12 (8.5%) |
| 7:00 AM to 7:29 AM | 5 (5.5%) | 28 (19.7%) |
| 7:30 AM to 7:59 AM | 3 (3.3%) | 17 (12.0%) |
| 8:00 AM to 8:29 AM | 4 (4.4%) | 29 (20.4%) |
| 8:30 AM to 8:59 AM | 0 (0.0%) | 14 (9.9%) |
| 9:00 AM to 9:59 AM | 0 (0.0%) | 0 (0.0%) |
| 10:00 AM to 10:59 AM | 4 (4.4%) | 14 (9.9%) |
| 11:00 AM to 11:59 AM | 3 (3.3%) | 0 (0.0%) |
| 12:00 PM to 3:59 PM | 25 (27.5%) | 21 (14.8%) |
| 4:00 PM to 11:59 PM | 4 (4.4%) | 0 (0.0%) |
| Total | 91 (100.0%) | 142 (100.0%) |
Housing Occupancy in Malta
Occupancy by Ownership in Malta
Of the total 275 dwellings in Malta, owner-occupied units account for 161 (58.6%), while renter-occupied units make up 114 (41.4%).
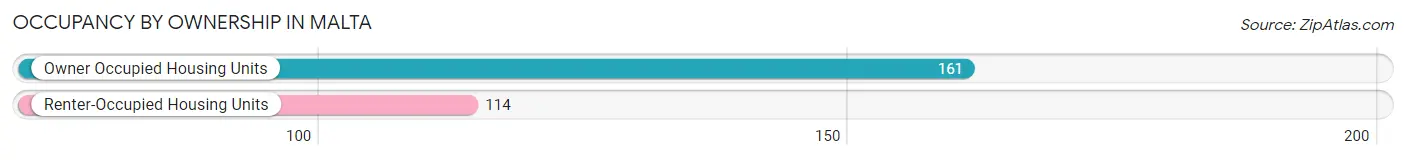
| Occupancy | # Housing Units | % Housing Units |
| Owner Occupied Housing Units | 161 | 58.6% |
| Renter-Occupied Housing Units | 114 | 41.4% |
| Total Occupied Housing Units | 275 | 100.0% |
Occupancy by Household Size in Malta
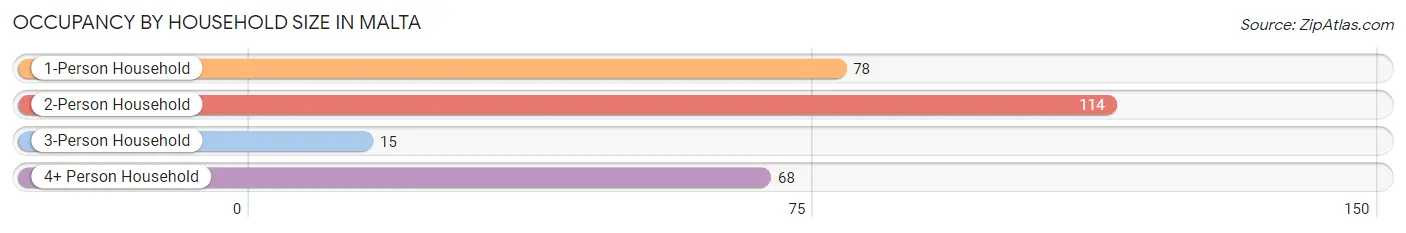
| Household Size | # Housing Units | % Housing Units |
| 1-Person Household | 78 | 28.4% |
| 2-Person Household | 114 | 41.4% |
| 3-Person Household | 15 | 5.4% |
| 4+ Person Household | 68 | 24.7% |
| Total Housing Units | 275 | 100.0% |
Occupancy by Ownership by Household Size in Malta
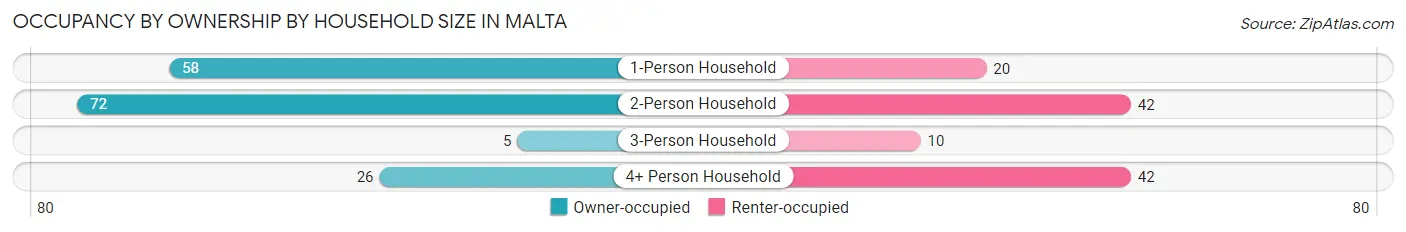
| Household Size | Owner-occupied | Renter-occupied |
| 1-Person Household | 58 (74.4%) | 20 (25.6%) |
| 2-Person Household | 72 (63.2%) | 42 (36.8%) |
| 3-Person Household | 5 (33.3%) | 10 (66.7%) |
| 4+ Person Household | 26 (38.2%) | 42 (61.8%) |
| Total Housing Units | 161 (58.6%) | 114 (41.4%) |
Occupancy by Educational Attainment in Malta
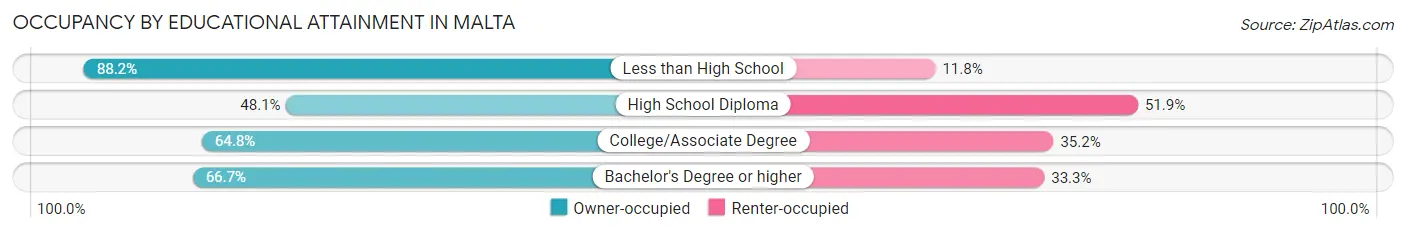
| Household Size | Owner-occupied | Renter-occupied |
| Less than High School | 15 (88.2%) | 2 (11.8%) |
| High School Diploma | 63 (48.1%) | 68 (51.9%) |
| College/Associate Degree | 59 (64.8%) | 32 (35.2%) |
| Bachelor's Degree or higher | 24 (66.7%) | 12 (33.3%) |
Occupancy by Age of Householder in Malta
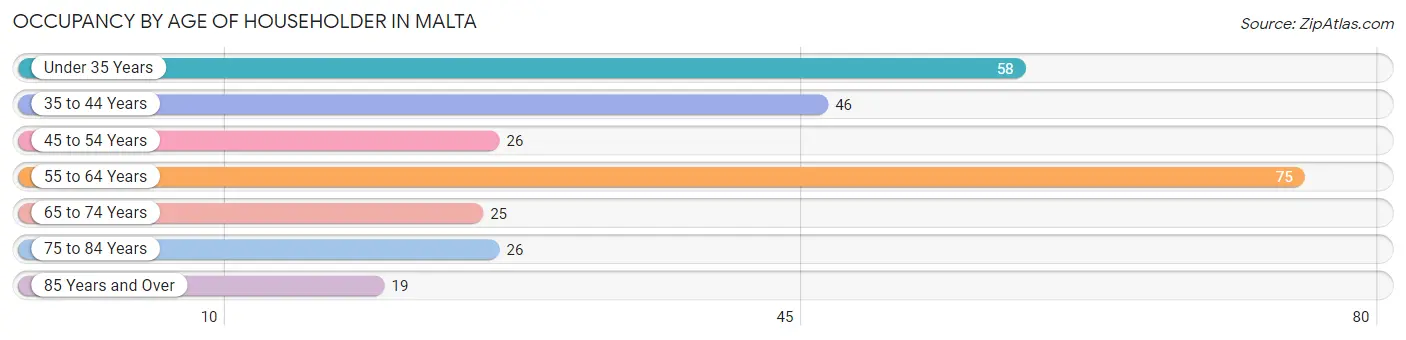
| Age Bracket | # Households | % Households |
| Under 35 Years | 58 | 21.1% |
| 35 to 44 Years | 46 | 16.7% |
| 45 to 54 Years | 26 | 9.5% |
| 55 to 64 Years | 75 | 27.3% |
| 65 to 74 Years | 25 | 9.1% |
| 75 to 84 Years | 26 | 9.5% |
| 85 Years and Over | 19 | 6.9% |
| Total | 275 | 100.0% |
Housing Finances in Malta
Median Income by Occupancy in Malta
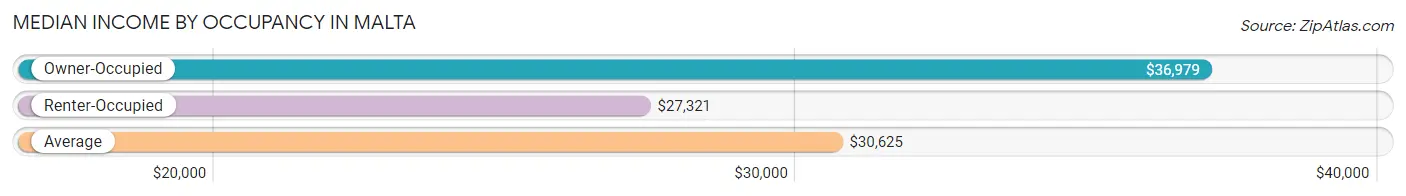
| Occupancy Type | # Households | Median Income |
| Owner-Occupied | 161 (58.6%) | $36,979 |
| Renter-Occupied | 114 (41.4%) | $27,321 |
| Average | 275 (100.0%) | $30,625 |
Occupancy by Householder Income Bracket in Malta
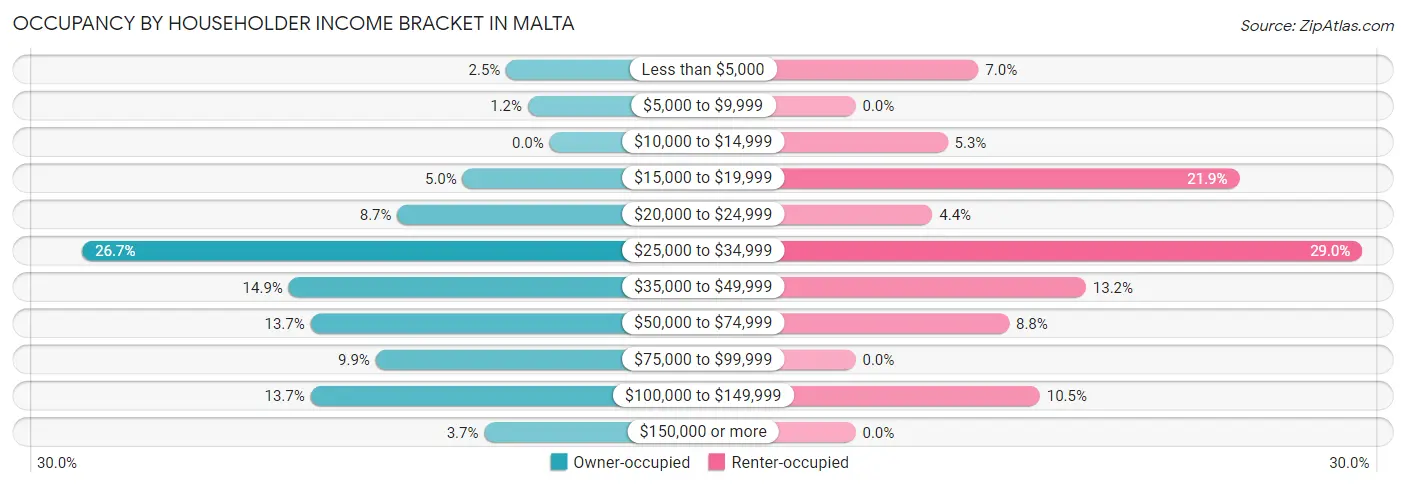
| Income Bracket | Owner-occupied | Renter-occupied |
| Less than $5,000 | 4 (2.5%) | 8 (7.0%) |
| $5,000 to $9,999 | 2 (1.2%) | 0 (0.0%) |
| $10,000 to $14,999 | 0 (0.0%) | 6 (5.3%) |
| $15,000 to $19,999 | 8 (5.0%) | 25 (21.9%) |
| $20,000 to $24,999 | 14 (8.7%) | 5 (4.4%) |
| $25,000 to $34,999 | 43 (26.7%) | 33 (28.9%) |
| $35,000 to $49,999 | 24 (14.9%) | 15 (13.2%) |
| $50,000 to $74,999 | 22 (13.7%) | 10 (8.8%) |
| $75,000 to $99,999 | 16 (9.9%) | 0 (0.0%) |
| $100,000 to $149,999 | 22 (13.7%) | 12 (10.5%) |
| $150,000 or more | 6 (3.7%) | 0 (0.0%) |
| Total | 161 (100.0%) | 114 (100.0%) |
Monthly Housing Cost Tiers in Malta
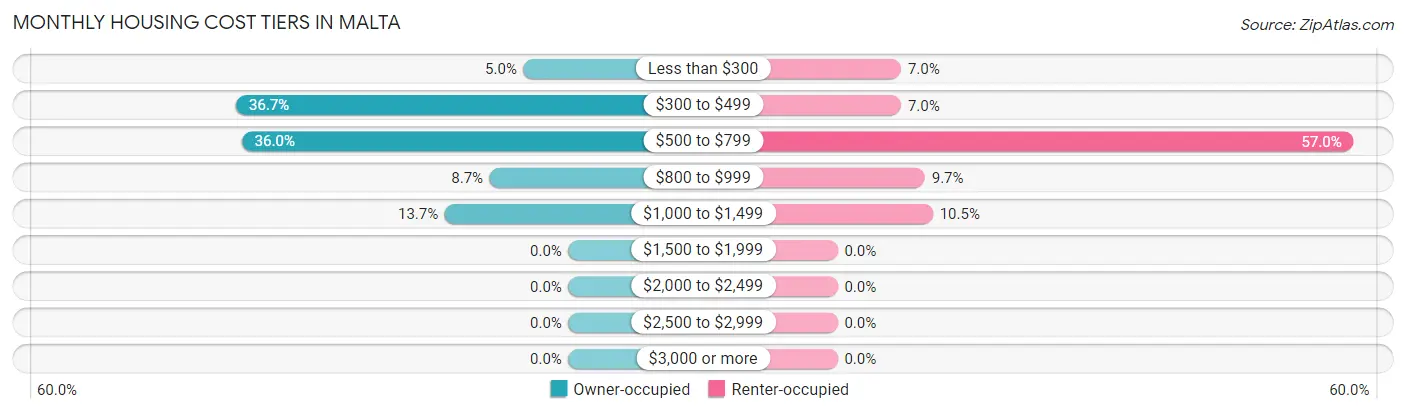
| Monthly Cost | Owner-occupied | Renter-occupied |
| Less than $300 | 8 (5.0%) | 8 (7.0%) |
| $300 to $499 | 59 (36.6%) | 8 (7.0%) |
| $500 to $799 | 58 (36.0%) | 65 (57.0%) |
| $800 to $999 | 14 (8.7%) | 11 (9.7%) |
| $1,000 to $1,499 | 22 (13.7%) | 12 (10.5%) |
| $1,500 to $1,999 | 0 (0.0%) | 0 (0.0%) |
| $2,000 to $2,499 | 0 (0.0%) | 0 (0.0%) |
| $2,500 to $2,999 | 0 (0.0%) | 0 (0.0%) |
| $3,000 or more | 0 (0.0%) | 0 (0.0%) |
| Total | 161 (100.0%) | 114 (100.0%) |
Physical Housing Characteristics in Malta
Housing Structures in Malta
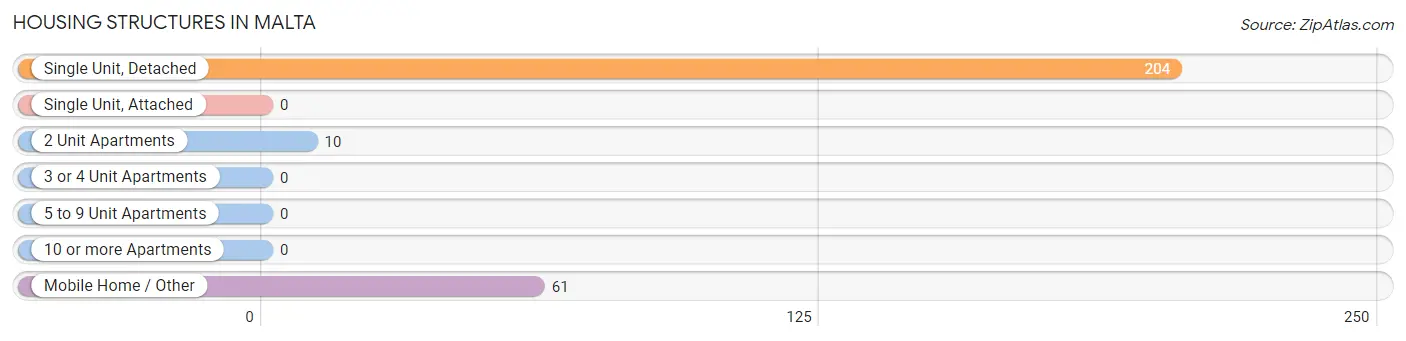
| Structure Type | # Housing Units | % Housing Units |
| Single Unit, Detached | 204 | 74.2% |
| Single Unit, Attached | 0 | 0.0% |
| 2 Unit Apartments | 10 | 3.6% |
| 3 or 4 Unit Apartments | 0 | 0.0% |
| 5 to 9 Unit Apartments | 0 | 0.0% |
| 10 or more Apartments | 0 | 0.0% |
| Mobile Home / Other | 61 | 22.2% |
| Total | 275 | 100.0% |
Housing Structures by Occupancy in Malta
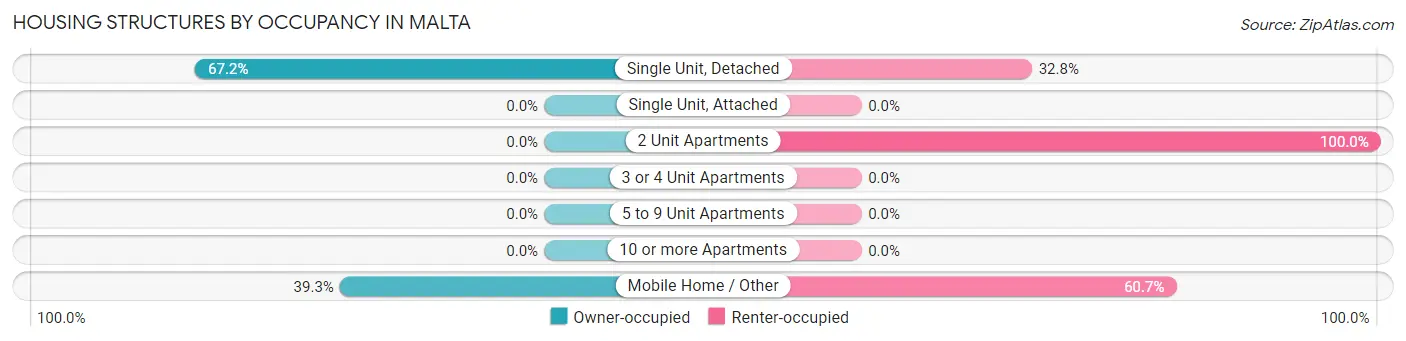
| Structure Type | Owner-occupied | Renter-occupied |
| Single Unit, Detached | 137 (67.2%) | 67 (32.8%) |
| Single Unit, Attached | 0 (0.0%) | 0 (0.0%) |
| 2 Unit Apartments | 0 (0.0%) | 10 (100.0%) |
| 3 or 4 Unit Apartments | 0 (0.0%) | 0 (0.0%) |
| 5 to 9 Unit Apartments | 0 (0.0%) | 0 (0.0%) |
| 10 or more Apartments | 0 (0.0%) | 0 (0.0%) |
| Mobile Home / Other | 24 (39.3%) | 37 (60.7%) |
| Total | 161 (58.6%) | 114 (41.4%) |
Housing Structures by Number of Rooms in Malta
| Number of Rooms | Owner-occupied | Renter-occupied |
| 1 Room | 0 (0.0%) | 0 (0.0%) |
| 2 or 3 Rooms | 8 (5.0%) | 0 (0.0%) |
| 4 or 5 Rooms | 38 (23.6%) | 74 (64.9%) |
| 6 or 7 Rooms | 64 (39.8%) | 34 (29.8%) |
| 8 or more Rooms | 51 (31.7%) | 6 (5.3%) |
| Total | 161 (100.0%) | 114 (100.0%) |
Housing Structure by Heating Type in Malta
| Heating Type | Owner-occupied | Renter-occupied |
| Utility Gas | 130 (80.7%) | 75 (65.8%) |
| Bottled, Tank, or LP Gas | 1 (0.6%) | 0 (0.0%) |
| Electricity | 30 (18.6%) | 39 (34.2%) |
| Fuel Oil or Kerosene | 0 (0.0%) | 0 (0.0%) |
| Coal or Coke | 0 (0.0%) | 0 (0.0%) |
| All other Fuels | 0 (0.0%) | 0 (0.0%) |
| No Fuel Used | 0 (0.0%) | 0 (0.0%) |
| Total | 161 (100.0%) | 114 (100.0%) |
Household Vehicle Usage in Malta
| Vehicles per Household | Owner-occupied | Renter-occupied |
| No Vehicle | 11 (6.8%) | 8 (7.0%) |
| 1 Vehicle | 52 (32.3%) | 65 (57.0%) |
| 2 Vehicles | 68 (42.2%) | 33 (28.9%) |
| 3 or more Vehicles | 30 (18.6%) | 8 (7.0%) |
| Total | 161 (100.0%) | 114 (100.0%) |
Real Estate & Mortgages in Malta
Real Estate and Mortgage Overview in Malta
| Characteristic | Without Mortgage | With Mortgage |
| Housing Units | 83 | 78 |
| Median Property Value | $86,800 | $92,900 |
| Median Household Income | $29,875 | $6 |
| Monthly Housing Costs | $435 | $0 |
| Real Estate Taxes | $665 | $14 |
Property Value by Mortgage Status in Malta
| Property Value | Without Mortgage | With Mortgage |
| Less than $50,000 | 18 (21.7%) | 3 (3.8%) |
| $50,000 to $99,999 | 37 (44.6%) | 46 (59.0%) |
| $100,000 to $299,999 | 28 (33.7%) | 29 (37.2%) |
| $300,000 to $499,999 | 0 (0.0%) | 0 (0.0%) |
| $500,000 to $749,999 | 0 (0.0%) | 0 (0.0%) |
| $750,000 to $999,999 | 0 (0.0%) | 0 (0.0%) |
| $1,000,000 or more | 0 (0.0%) | 0 (0.0%) |
| Total | 83 (100.0%) | 78 (100.0%) |
Household Income by Mortgage Status in Malta
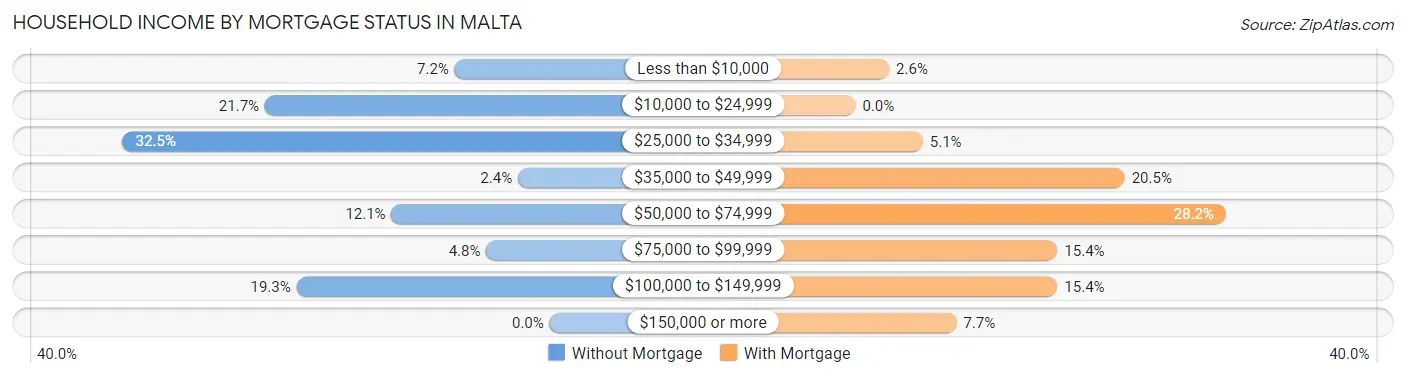
| Household Income | Without Mortgage | With Mortgage |
| Less than $10,000 | 6 (7.2%) | 2 (2.6%) |
| $10,000 to $24,999 | 18 (21.7%) | 0 (0.0%) |
| $25,000 to $34,999 | 27 (32.5%) | 4 (5.1%) |
| $35,000 to $49,999 | 2 (2.4%) | 16 (20.5%) |
| $50,000 to $74,999 | 10 (12.0%) | 22 (28.2%) |
| $75,000 to $99,999 | 4 (4.8%) | 12 (15.4%) |
| $100,000 to $149,999 | 16 (19.3%) | 12 (15.4%) |
| $150,000 or more | 0 (0.0%) | 6 (7.7%) |
| Total | 83 (100.0%) | 78 (100.0%) |
Property Value to Household Income Ratio in Malta
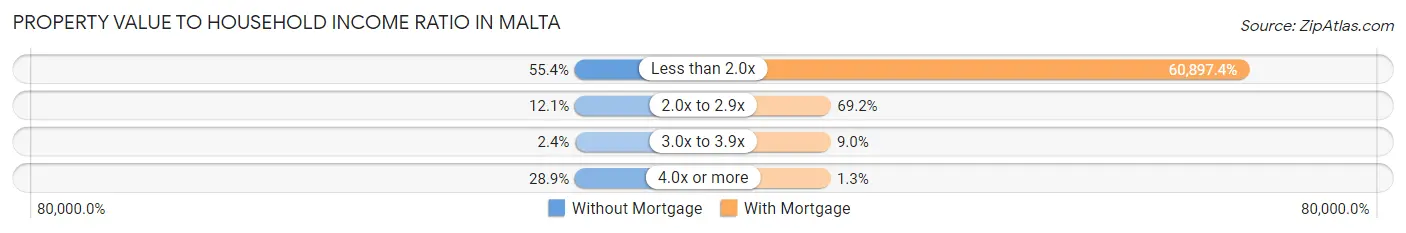
| Value-to-Income Ratio | Without Mortgage | With Mortgage |
| Less than 2.0x | 46 (55.4%) | 47,500 (60,897.4%) |
| 2.0x to 2.9x | 10 (12.0%) | 54 (69.2%) |
| 3.0x to 3.9x | 2 (2.4%) | 7 (9.0%) |
| 4.0x or more | 24 (28.9%) | 1 (1.3%) |
| Total | 83 (100.0%) | 78 (100.0%) |
Real Estate Taxes by Mortgage Status in Malta
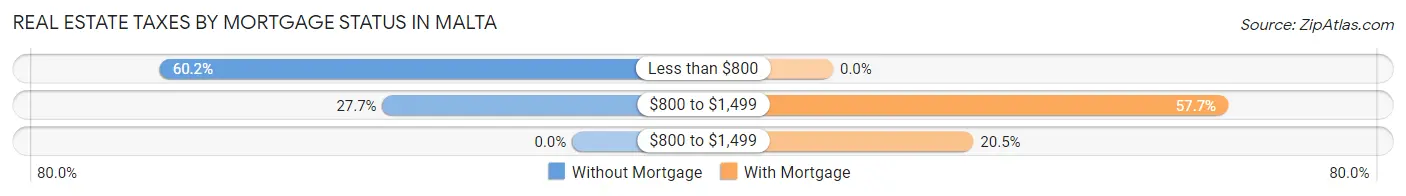
| Property Taxes | Without Mortgage | With Mortgage |
| Less than $800 | 50 (60.2%) | 0 (0.0%) |
| $800 to $1,499 | 23 (27.7%) | 45 (57.7%) |
| $800 to $1,499 | 0 (0.0%) | 16 (20.5%) |
| Total | 83 (100.0%) | 78 (100.0%) |
Health & Disability in Malta
Health Insurance Coverage by Age in Malta
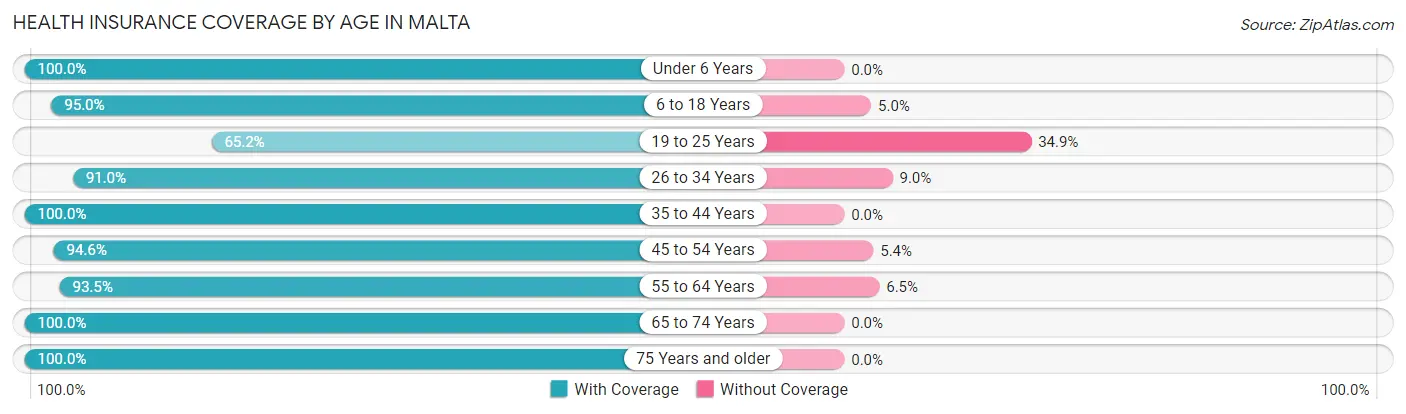
| Age Bracket | With Coverage | Without Coverage |
| Under 6 Years | 60 (100.0%) | 0 (0.0%) |
| 6 to 18 Years | 133 (95.0%) | 7 (5.0%) |
| 19 to 25 Years | 43 (65.1%) | 23 (34.8%) |
| 26 to 34 Years | 81 (91.0%) | 8 (9.0%) |
| 35 to 44 Years | 74 (100.0%) | 0 (0.0%) |
| 45 to 54 Years | 35 (94.6%) | 2 (5.4%) |
| 55 to 64 Years | 86 (93.5%) | 6 (6.5%) |
| 65 to 74 Years | 61 (100.0%) | 0 (0.0%) |
| 75 Years and older | 58 (100.0%) | 0 (0.0%) |
| Total | 631 (93.2%) | 46 (6.8%) |
Health Insurance Coverage by Citizenship Status in Malta

| Citizenship Status | With Coverage | Without Coverage |
| Native Born | 60 (100.0%) | 0 (0.0%) |
| Foreign Born, Citizen | 133 (95.0%) | 7 (5.0%) |
| Foreign Born, not a Citizen | 43 (65.1%) | 23 (34.8%) |
Health Insurance Coverage by Household Income in Malta

| Household Income | With Coverage | Without Coverage |
| Under $25,000 | 138 (95.2%) | 7 (4.8%) |
| $25,000 to $49,999 | 241 (89.6%) | 28 (10.4%) |
| $50,000 to $74,999 | 90 (93.8%) | 6 (6.2%) |
| $75,000 to $99,999 | 32 (100.0%) | 0 (0.0%) |
| $100,000 and over | 126 (96.2%) | 5 (3.8%) |
Public vs Private Health Insurance Coverage by Age in Malta
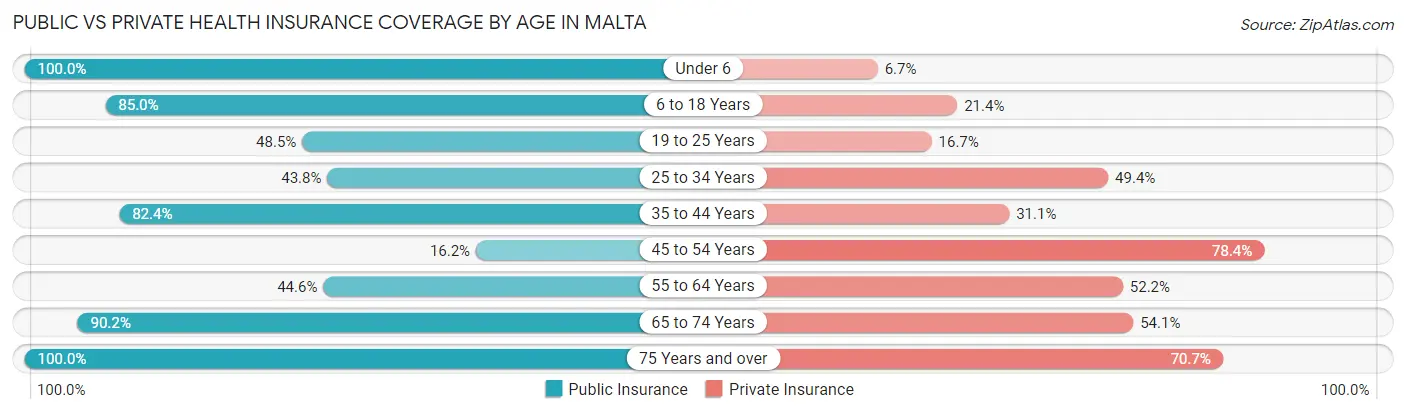
| Age Bracket | Public Insurance | Private Insurance |
| Under 6 | 60 (100.0%) | 4 (6.7%) |
| 6 to 18 Years | 119 (85.0%) | 30 (21.4%) |
| 19 to 25 Years | 32 (48.5%) | 11 (16.7%) |
| 25 to 34 Years | 39 (43.8%) | 44 (49.4%) |
| 35 to 44 Years | 61 (82.4%) | 23 (31.1%) |
| 45 to 54 Years | 6 (16.2%) | 29 (78.4%) |
| 55 to 64 Years | 41 (44.6%) | 48 (52.2%) |
| 65 to 74 Years | 55 (90.2%) | 33 (54.1%) |
| 75 Years and over | 58 (100.0%) | 41 (70.7%) |
| Total | 471 (69.6%) | 263 (38.9%) |
Disability Status by Sex by Age in Malta
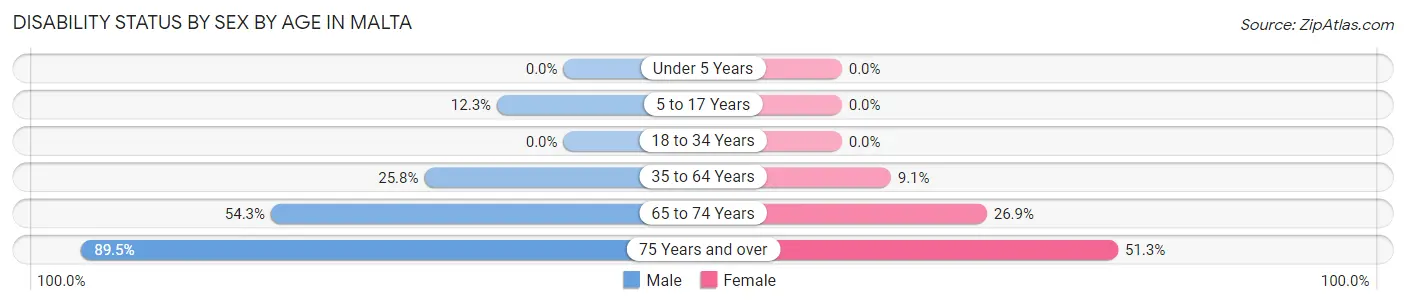
| Age Bracket | Male | Female |
| Under 5 Years | 0 (0.0%) | 0 (0.0%) |
| 5 to 17 Years | 9 (12.3%) | 0 (0.0%) |
| 18 to 34 Years | 0 (0.0%) | 0 (0.0%) |
| 35 to 64 Years | 24 (25.8%) | 10 (9.1%) |
| 65 to 74 Years | 19 (54.3%) | 7 (26.9%) |
| 75 Years and over | 17 (89.5%) | 20 (51.3%) |
Disability Class by Sex by Age in Malta
Disability Class: Hearing Difficulty
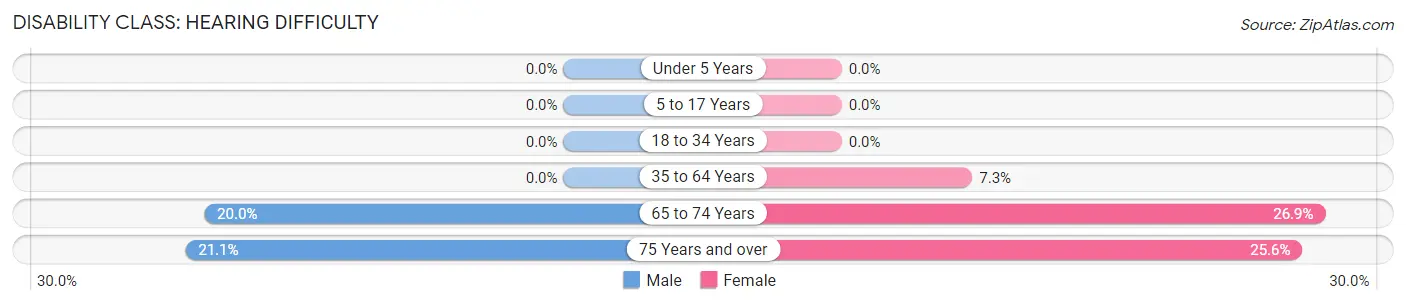
| Age Bracket | Male | Female |
| Under 5 Years | 0 (0.0%) | 0 (0.0%) |
| 5 to 17 Years | 0 (0.0%) | 0 (0.0%) |
| 18 to 34 Years | 0 (0.0%) | 0 (0.0%) |
| 35 to 64 Years | 0 (0.0%) | 8 (7.3%) |
| 65 to 74 Years | 7 (20.0%) | 7 (26.9%) |
| 75 Years and over | 4 (21.0%) | 10 (25.6%) |
Disability Class: Vision Difficulty
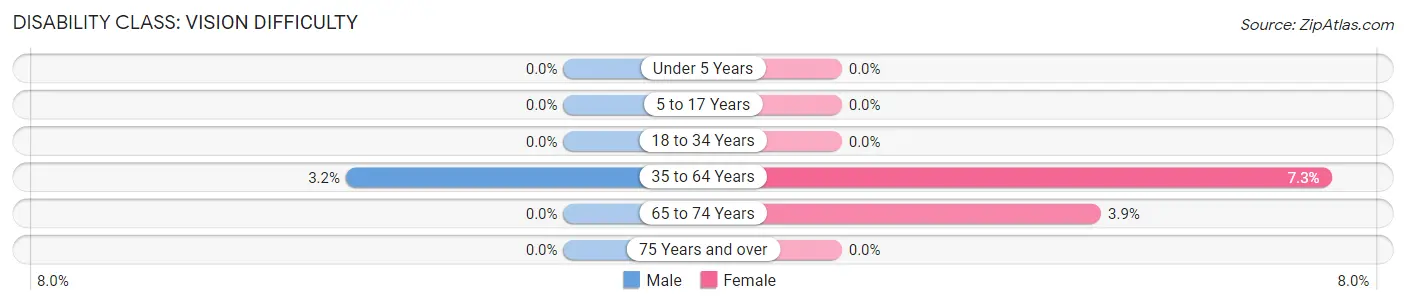
| Age Bracket | Male | Female |
| Under 5 Years | 0 (0.0%) | 0 (0.0%) |
| 5 to 17 Years | 0 (0.0%) | 0 (0.0%) |
| 18 to 34 Years | 0 (0.0%) | 0 (0.0%) |
| 35 to 64 Years | 3 (3.2%) | 8 (7.3%) |
| 65 to 74 Years | 0 (0.0%) | 1 (3.8%) |
| 75 Years and over | 0 (0.0%) | 0 (0.0%) |
Disability Class: Cognitive Difficulty
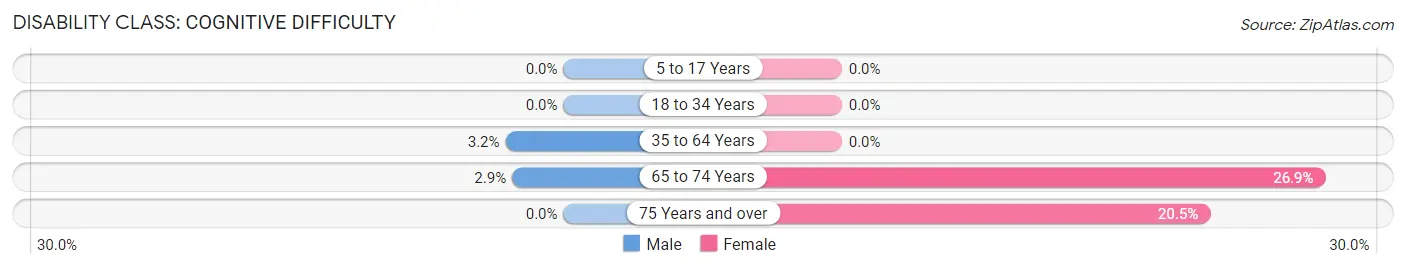
| Age Bracket | Male | Female |
| 5 to 17 Years | 0 (0.0%) | 0 (0.0%) |
| 18 to 34 Years | 0 (0.0%) | 0 (0.0%) |
| 35 to 64 Years | 3 (3.2%) | 0 (0.0%) |
| 65 to 74 Years | 1 (2.9%) | 7 (26.9%) |
| 75 Years and over | 0 (0.0%) | 8 (20.5%) |
Disability Class: Ambulatory Difficulty
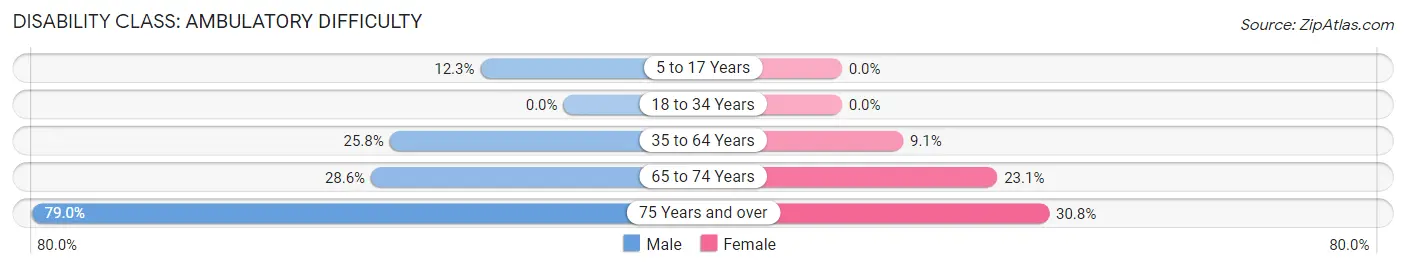
| Age Bracket | Male | Female |
| 5 to 17 Years | 9 (12.3%) | 0 (0.0%) |
| 18 to 34 Years | 0 (0.0%) | 0 (0.0%) |
| 35 to 64 Years | 24 (25.8%) | 10 (9.1%) |
| 65 to 74 Years | 10 (28.6%) | 6 (23.1%) |
| 75 Years and over | 15 (78.9%) | 12 (30.8%) |
Disability Class: Self-Care Difficulty
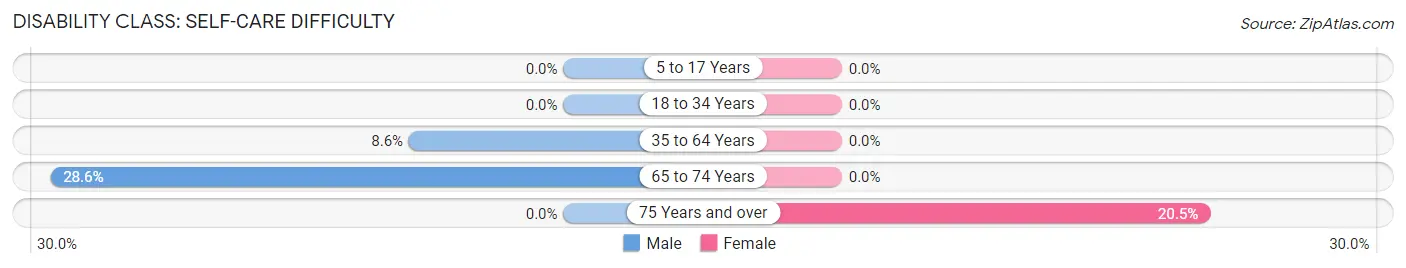
| Age Bracket | Male | Female |
| 5 to 17 Years | 0 (0.0%) | 0 (0.0%) |
| 18 to 34 Years | 0 (0.0%) | 0 (0.0%) |
| 35 to 64 Years | 8 (8.6%) | 0 (0.0%) |
| 65 to 74 Years | 10 (28.6%) | 0 (0.0%) |
| 75 Years and over | 0 (0.0%) | 8 (20.5%) |
Technology Access in Malta
Computing Device Access in Malta
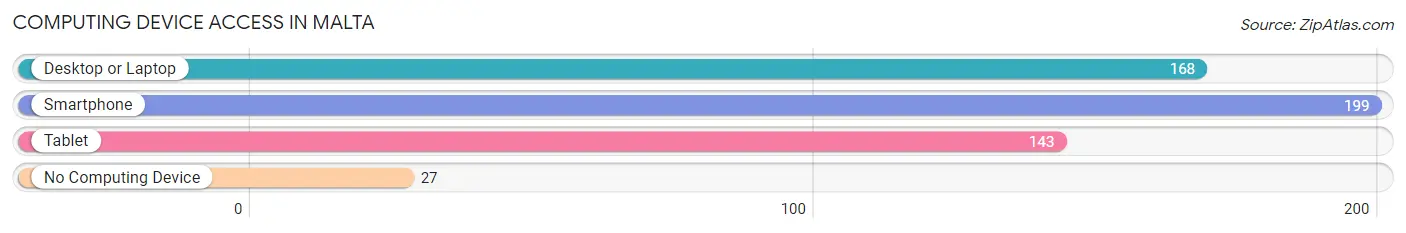
| Device Type | # Households | % Households |
| Desktop or Laptop | 168 | 61.1% |
| Smartphone | 199 | 72.4% |
| Tablet | 143 | 52.0% |
| No Computing Device | 27 | 9.8% |
| Total | 275 | 100.0% |
Internet Access in Malta
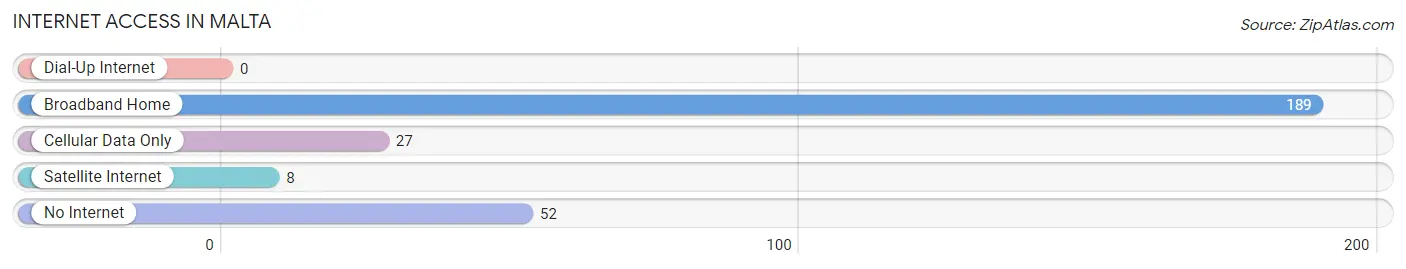
| Internet Type | # Households | % Households |
| Dial-Up Internet | 0 | 0.0% |
| Broadband Home | 189 | 68.7% |
| Cellular Data Only | 27 | 9.8% |
| Satellite Internet | 8 | 2.9% |
| No Internet | 52 | 18.9% |
| Total | 275 | 100.0% |
Malta Summary
Malta, Ohio is a small village located in Morgan County, Ohio. It is situated on the banks of the Muskingum River, approximately 25 miles southeast of Zanesville. The village has a population of approximately 500 people and covers an area of 0.6 square miles.
History
Malta was founded in 1817 by a group of settlers from Pennsylvania. The village was named after the island of Malta, located in the Mediterranean Sea. The settlers were attracted to the area due to its fertile soil and abundant natural resources. The village was incorporated in 1837 and quickly became a thriving agricultural community.
In the late 19th century, the village began to experience a period of growth and development. The construction of the Ohio and Erie Canal in 1825 provided a major boost to the local economy. The canal allowed for the transportation of goods and services to and from the village. The village also benefited from the construction of the Baltimore and Ohio Railroad in 1853.
Geography
Malta is located in Morgan County, Ohio. It is situated on the banks of the Muskingum River, approximately 25 miles southeast of Zanesville. The village has a total area of 0.6 square miles, all of which is land. The village is located in a rural area and is surrounded by rolling hills and farmland.
Economy
Malta’s economy is largely based on agriculture. The village is home to several farms, which produce a variety of crops, including corn, soybeans, wheat, and hay. The village also has a few small businesses, including a grocery store, a hardware store, and a few restaurants.
Demographics
As of the 2010 census, the population of Malta was 498. The racial makeup of the village was 97.2% White, 0.2% African American, 0.2% Native American, 0.4% Asian, 0.2% from other races, and 1.9% from two or more races. The median household income was $37,500 and the median family income was $45,000.
Malta is a small village with a rich history and a strong agricultural economy. The village is home to a diverse population and offers a variety of amenities and services. The village is a great place to live and work, and is a great place to raise a family.
Common Questions
What is Per Capita Income in Malta?
Per Capita income in Malta is $20,455.
What is the Median Family Income in Malta?
Median Family Income in Malta is $49,750.
What is the Median Household income in Malta?
Median Household Income in Malta is $30,625.
What is Income or Wage Gap in Malta?
Income or Wage Gap in Malta is 19.1%.
Women in Malta earn 80.9 cents for every dollar earned by a man.
What is Inequality or Gini Index in Malta?
Inequality or Gini Index in Malta is 0.42.
What is the Total Population of Malta?
Total Population of Malta is 677.
What is the Total Male Population of Malta?
Total Male Population of Malta is 321.
What is the Total Female Population of Malta?
Total Female Population of Malta is 356.
What is the Ratio of Males per 100 Females in Malta?
There are 90.17 Males per 100 Females in Malta.
What is the Ratio of Females per 100 Males in Malta?
There are 110.90 Females per 100 Males in Malta.
What is the Median Population Age in Malta?
Median Population Age in Malta is 32.3 Years.
What is the Average Family Size in Malta
Average Family Size in Malta is 2.9 People.
What is the Average Household Size in Malta
Average Household Size in Malta is 2.5 People.
How Large is the Labor Force in Malta?
There are 267 People in the Labor Forcein in Malta.
What is the Percentage of People in the Labor Force in Malta?
54.4% of People are in the Labor Force in Malta.
What is the Unemployment Rate in Malta?
Unemployment Rate in Malta is 11.6%.