Zip Codes with the Highest Percentage of Population with a Degree in Physical and Health Sciences in Ohio
RELATED REPORTS & OPTIONS
Physical and Health Sciences
Ohio
Compare Zip Codes
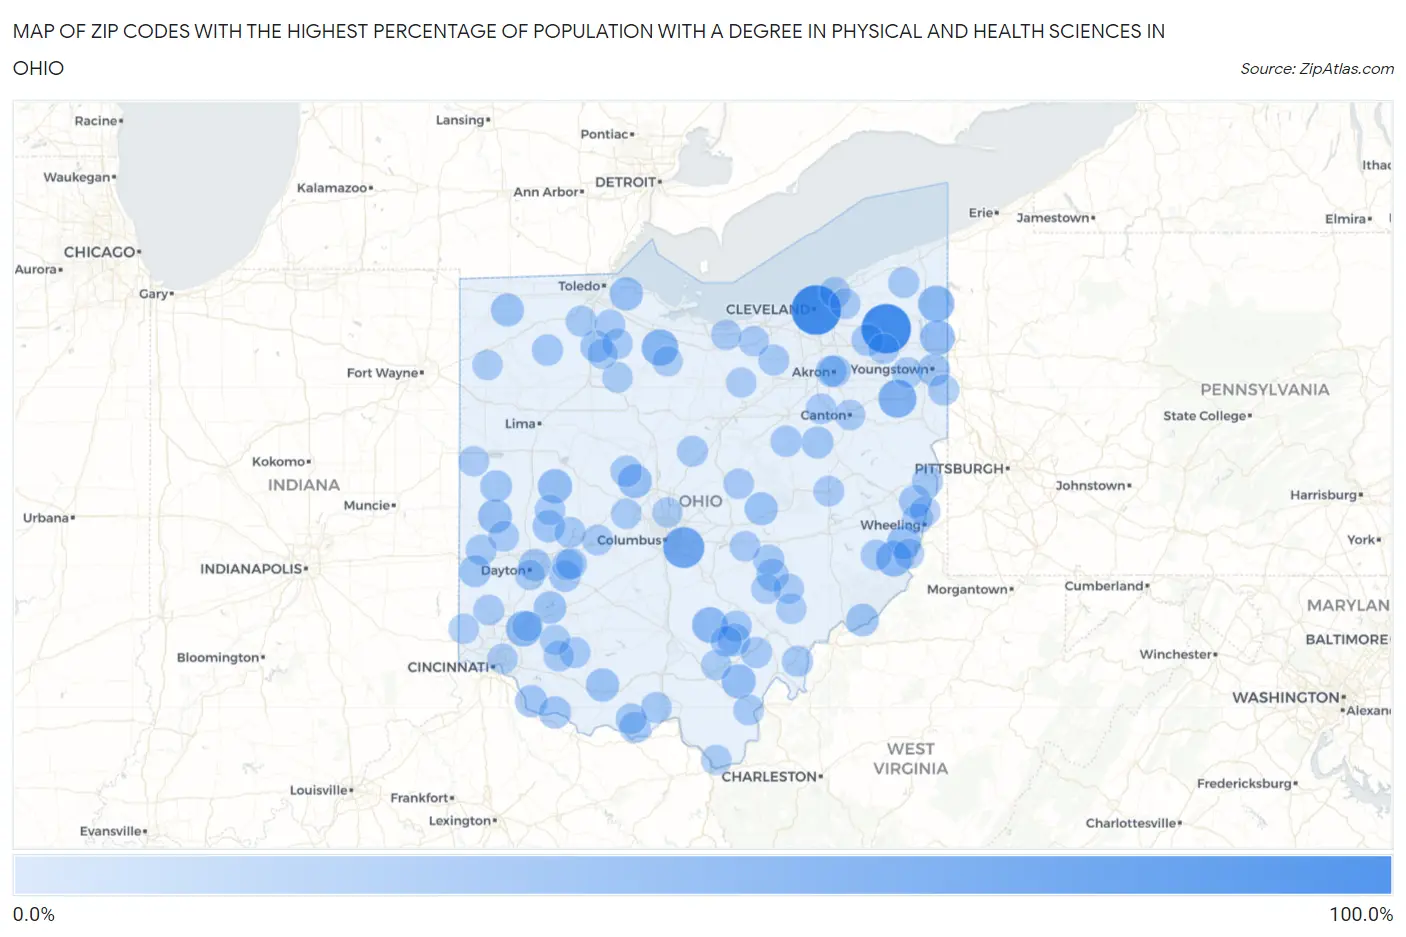
Map of Zip Codes with the Highest Percentage of Population with a Degree in Physical and Health Sciences in Ohio
0.0%
100.0%
Zip Codes with the Highest Percentage of Population with a Degree in Physical and Health Sciences in Ohio
| Zip Code | % Graduates | vs State | vs National | |
| 1. | 44101 | 100.0% | 3.0%(+97.0)#1 | 3.1%(+96.9)#5 |
| 2. | 44080 | 100.0% | 3.0%(+97.0)#2 | 3.1%(+96.9)#14 |
| 3. | 43109 | 58.0% | 3.0%(+55.0)#3 | 3.1%(+54.9)#44 |
| 4. | 44619 | 43.2% | 3.0%(+40.2)#4 | 3.1%(+40.1)#93 |
| 5. | 44836 | 36.1% | 3.0%(+33.2)#5 | 3.1%(+33.0)#131 |
| 6. | 44093 | 34.5% | 3.0%(+31.5)#6 | 3.1%(+31.4)#141 |
| 7. | 43152 | 32.0% | 3.0%(+29.1)#7 | 3.1%(+28.9)#168 |
| 8. | 45034 | 31.3% | 3.0%(+28.3)#8 | 3.1%(+28.2)#179 |
| 9. | 43716 | 31.2% | 3.0%(+28.3)#9 | 3.1%(+28.2)#180 |
| 10. | 44418 | 27.6% | 3.0%(+24.6)#10 | 3.1%(+24.5)#219 |
| 11. | 43343 | 25.0% | 3.0%(+22.0)#11 | 3.1%(+21.9)#270 |
| 12. | 45686 | 24.3% | 3.0%(+21.3)#12 | 3.1%(+21.2)#291 |
| 13. | 45328 | 23.3% | 3.0%(+20.3)#13 | 3.1%(+20.2)#309 |
| 14. | 43036 | 22.6% | 3.0%(+19.6)#14 | 3.1%(+19.5)#329 |
| 15. | 43933 | 22.0% | 3.0%(+19.0)#15 | 3.1%(+18.9)#347 |
| 16. | 43468 | 20.3% | 3.0%(+17.4)#16 | 3.1%(+17.2)#398 |
| 17. | 45679 | 20.2% | 3.0%(+17.2)#17 | 3.1%(+17.1)#400 |
| 18. | 43822 | 19.7% | 3.0%(+16.8)#18 | 3.1%(+16.6)#415 |
| 19. | 43557 | 19.4% | 3.0%(+16.5)#19 | 3.1%(+16.3)#429 |
| 20. | 45698 | 17.9% | 3.0%(+14.9)#20 | 3.1%(+14.8)#506 |
| 21. | 45768 | 16.7% | 3.0%(+13.7)#21 | 3.1%(+13.6)#556 |
| 22. | 45032 | 16.7% | 3.0%(+13.7)#22 | 3.1%(+13.6)#558 |
| 23. | 44502 | 16.1% | 3.0%(+13.1)#23 | 3.1%(+13.0)#593 |
| 24. | 45153 | 15.9% | 3.0%(+13.0)#24 | 3.1%(+12.8)#605 |
| 25. | 43731 | 15.9% | 3.0%(+12.9)#25 | 3.1%(+12.8)#608 |
| 26. | 45389 | 15.4% | 3.0%(+12.4)#26 | 3.1%(+12.3)#637 |
| 27. | 45131 | 15.4% | 3.0%(+12.4)#27 | 3.1%(+12.3)#639 |
| 28. | 45404 | 15.0% | 3.0%(+12.0)#28 | 3.1%(+11.9)#676 |
| 29. | 43917 | 14.6% | 3.0%(+11.7)#29 | 3.1%(+11.5)#699 |
| 30. | 44255 | 14.2% | 3.0%(+11.2)#30 | 3.1%(+11.1)#749 |
| 31. | 45388 | 13.8% | 3.0%(+10.9)#31 | 3.1%(+10.7)#778 |
| 32. | 44624 | 13.7% | 3.0%(+10.7)#32 | 3.1%(+10.6)#804 |
| 33. | 45320 | 13.6% | 3.0%(+10.6)#33 | 3.1%(+10.5)#816 |
| 34. | 43437 | 13.5% | 3.0%(+10.6)#34 | 3.1%(+10.4)#822 |
| 35. | 44304 | 12.7% | 3.0%(+9.75)#35 | 3.1%(+9.61)#913 |
| 36. | 43344 | 11.7% | 3.0%(+8.75)#36 | 3.1%(+8.61)#1,053 |
| 37. | 44633 | 11.3% | 3.0%(+8.38)#37 | 3.1%(+8.24)#1,100 |
| 38. | 43524 | 11.0% | 3.0%(+8.02)#38 | 3.1%(+7.88)#1,167 |
| 39. | 45654 | 10.9% | 3.0%(+7.97)#39 | 3.1%(+7.83)#1,180 |
| 40. | 45684 | 10.8% | 3.0%(+7.89)#40 | 3.1%(+7.74)#1,198 |
| 41. | 45384 | 10.8% | 3.0%(+7.84)#41 | 3.1%(+7.70)#1,203 |
| 42. | 45387 | 10.5% | 3.0%(+7.56)#42 | 3.1%(+7.41)#1,259 |
| 43. | 44302 | 10.3% | 3.0%(+7.37)#43 | 3.1%(+7.23)#1,297 |
| 44. | 45316 | 10.2% | 3.0%(+7.25)#44 | 3.1%(+7.10)#1,324 |
| 45. | 45772 | 10.2% | 3.0%(+7.24)#45 | 3.1%(+7.09)#1,325 |
| 46. | 45710 | 10.1% | 3.0%(+7.15)#46 | 3.1%(+7.01)#1,340 |
| 47. | 44084 | 10.0% | 3.0%(+7.01)#47 | 3.1%(+6.87)#1,378 |
| 48. | 43777 | 9.9% | 3.0%(+6.99)#48 | 3.1%(+6.85)#1,382 |
| 49. | 43338 | 9.7% | 3.0%(+6.77)#49 | 3.1%(+6.63)#1,429 |
| 50. | 44132 | 9.7% | 3.0%(+6.76)#50 | 3.1%(+6.61)#1,435 |
| 51. | 45651 | 9.7% | 3.0%(+6.70)#51 | 3.1%(+6.56)#1,453 |
| 52. | 44442 | 9.6% | 3.0%(+6.67)#52 | 3.1%(+6.53)#1,461 |
| 53. | 45652 | 9.6% | 3.0%(+6.67)#53 | 3.1%(+6.53)#1,463 |
| 54. | 43565 | 9.5% | 3.0%(+6.57)#54 | 3.1%(+6.42)#1,490 |
| 55. | 45372 | 9.4% | 3.0%(+6.42)#55 | 3.1%(+6.28)#1,535 |
| 56. | 43953 | 9.3% | 3.0%(+6.38)#56 | 3.1%(+6.23)#1,541 |
| 57. | 45382 | 9.3% | 3.0%(+6.34)#57 | 3.1%(+6.20)#1,550 |
| 58. | 45142 | 9.3% | 3.0%(+6.31)#58 | 3.1%(+6.17)#1,560 |
| 59. | 44253 | 9.3% | 3.0%(+6.30)#59 | 3.1%(+6.16)#1,564 |
| 60. | 43747 | 9.1% | 3.0%(+6.13)#60 | 3.1%(+5.99)#1,622 |
| 61. | 45616 | 9.0% | 3.0%(+6.01)#61 | 3.1%(+5.87)#1,673 |
| 62. | 43832 | 8.8% | 3.0%(+5.80)#62 | 3.1%(+5.66)#1,745 |
| 63. | 45337 | 8.6% | 3.0%(+5.65)#63 | 3.1%(+5.51)#1,799 |
| 64. | 45369 | 8.5% | 3.0%(+5.51)#64 | 3.1%(+5.37)#1,850 |
| 65. | 44666 | 8.4% | 3.0%(+5.45)#65 | 3.1%(+5.31)#1,862 |
| 66. | 44040 | 8.4% | 3.0%(+5.45)#66 | 3.1%(+5.31)#1,865 |
| 67. | 45062 | 8.1% | 3.0%(+5.12)#67 | 3.1%(+4.98)#1,986 |
| 68. | 43739 | 7.9% | 3.0%(+4.93)#68 | 3.1%(+4.79)#2,061 |
| 69. | 45118 | 7.8% | 3.0%(+4.88)#69 | 3.1%(+4.74)#2,078 |
| 70. | 44288 | 7.8% | 3.0%(+4.86)#70 | 3.1%(+4.72)#2,092 |
| 71. | 43912 | 7.6% | 3.0%(+4.67)#71 | 3.1%(+4.53)#2,190 |
| 72. | 44802 | 7.6% | 3.0%(+4.62)#72 | 3.1%(+4.48)#2,209 |
| 73. | 43450 | 7.5% | 3.0%(+4.58)#73 | 3.1%(+4.44)#2,227 |
| 74. | 44074 | 7.5% | 3.0%(+4.56)#74 | 3.1%(+4.42)#2,241 |
| 75. | 45631 | 7.5% | 3.0%(+4.55)#75 | 3.1%(+4.41)#2,244 |
| 76. | 43942 | 7.5% | 3.0%(+4.51)#76 | 3.1%(+4.37)#2,262 |
| 77. | 43022 | 7.5% | 3.0%(+4.50)#77 | 3.1%(+4.36)#2,268 |
| 78. | 44451 | 7.4% | 3.0%(+4.43)#78 | 3.1%(+4.28)#2,306 |
| 79. | 43457 | 7.3% | 3.0%(+4.36)#79 | 3.1%(+4.22)#2,341 |
| 80. | 43971 | 7.3% | 3.0%(+4.36)#80 | 3.1%(+4.22)#2,342 |
| 81. | 44814 | 7.2% | 3.0%(+4.28)#81 | 3.1%(+4.14)#2,387 |
| 82. | 44817 | 7.2% | 3.0%(+4.28)#82 | 3.1%(+4.13)#2,392 |
| 83. | 43077 | 7.1% | 3.0%(+4.18)#83 | 3.1%(+4.04)#2,440 |
| 84. | 44702 | 7.1% | 3.0%(+4.11)#84 | 3.1%(+3.97)#2,468 |
| 85. | 43728 | 7.0% | 3.0%(+4.08)#85 | 3.1%(+3.94)#2,473 |
| 86. | 45692 | 7.0% | 3.0%(+4.08)#86 | 3.1%(+3.94)#2,476 |
| 87. | 45317 | 7.0% | 3.0%(+4.07)#87 | 3.1%(+3.93)#2,483 |
| 88. | 43758 | 7.0% | 3.0%(+4.05)#88 | 3.1%(+3.90)#2,495 |
| 89. | 45828 | 7.0% | 3.0%(+3.99)#89 | 3.1%(+3.85)#2,532 |
| 90. | 45680 | 6.9% | 3.0%(+3.98)#90 | 3.1%(+3.84)#2,545 |
| 91. | 45107 | 6.9% | 3.0%(+3.91)#91 | 3.1%(+3.77)#2,590 |
| 92. | 43240 | 6.7% | 3.0%(+3.70)#92 | 3.1%(+3.56)#2,736 |
| 93. | 45879 | 6.6% | 3.0%(+3.65)#93 | 3.1%(+3.51)#2,763 |
| 94. | 44867 | 6.5% | 3.0%(+3.53)#94 | 3.1%(+3.39)#2,833 |
| 95. | 44859 | 6.4% | 3.0%(+3.45)#95 | 3.1%(+3.31)#2,894 |
| 96. | 45209 | 6.4% | 3.0%(+3.40)#96 | 3.1%(+3.26)#2,942 |
| 97. | 45065 | 6.3% | 3.0%(+3.33)#97 | 3.1%(+3.19)#3,007 |
| 98. | 45053 | 6.2% | 3.0%(+3.20)#98 | 3.1%(+3.06)#3,116 |
| 99. | 43730 | 6.1% | 3.0%(+3.15)#99 | 3.1%(+3.01)#3,160 |
| 100. | 45409 | 6.1% | 3.0%(+3.14)#100 | 3.1%(+3.00)#3,168 |
Common Questions
What are the Top 10 Zip Codes with the Highest Percentage of Population with a Degree in Physical and Health Sciences in Ohio?
Top 10 Zip Codes with the Highest Percentage of Population with a Degree in Physical and Health Sciences in Ohio are:
What zip code has the Highest Percentage of Population with a Degree in Physical and Health Sciences in Ohio?
44101 has the Highest Percentage of Population with a Degree in Physical and Health Sciences in Ohio with 100.0%.
What is the Percentage of Population with a Degree in Physical and Health Sciences in the State of Ohio?
Percentage of Population with a Degree in Physical and Health Sciences in Ohio is 3.0%.
What is the Percentage of Population with a Degree in Physical and Health Sciences in the United States?
Percentage of Population with a Degree in Physical and Health Sciences in the United States is 3.1%.