Wintersville, OH Map & Demographics
Wintersville Map
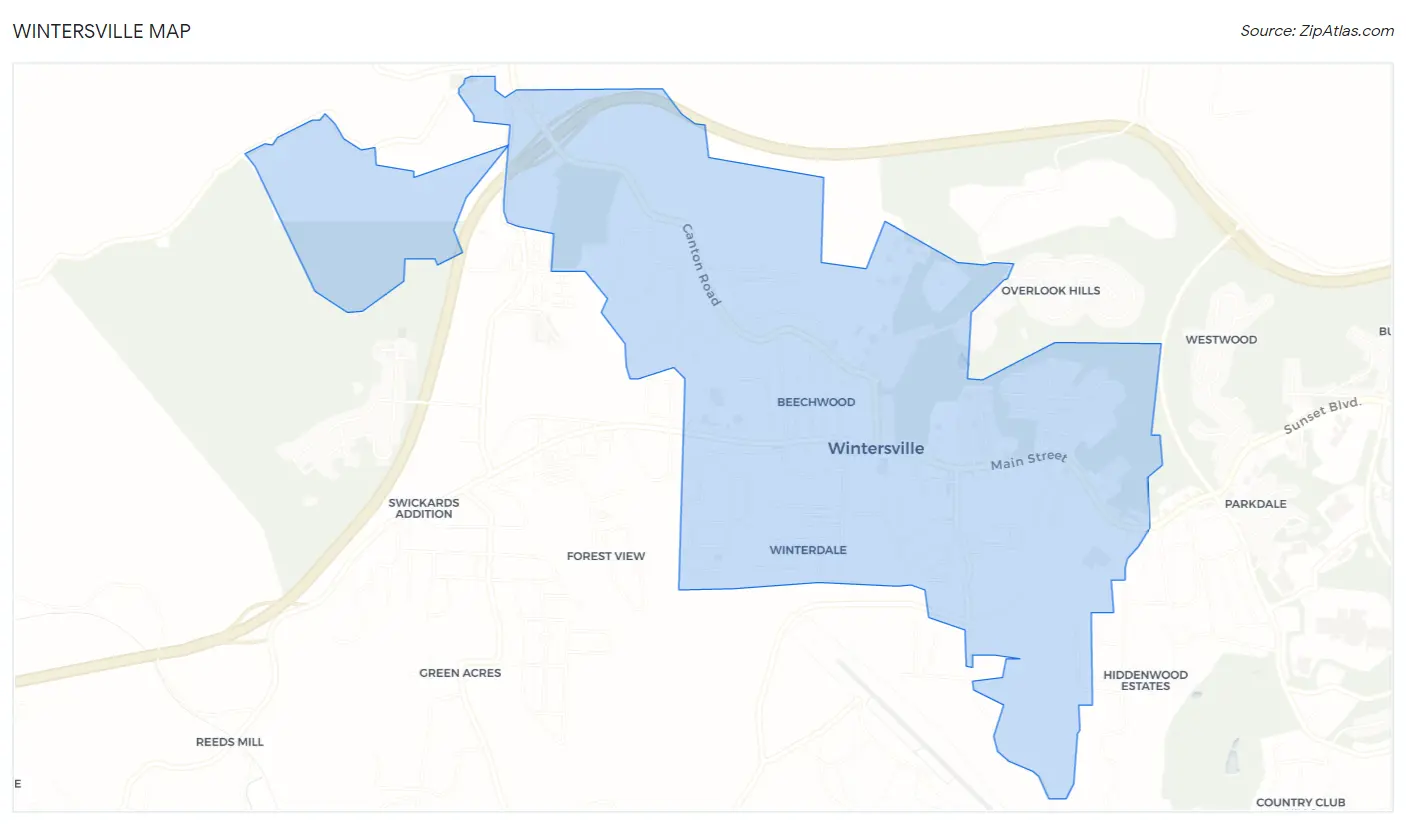
Wintersville Overview
$34,632
PER CAPITA INCOME
$88,021
AVG FAMILY INCOME
$70,607
AVG HOUSEHOLD INCOME
9.6%
WAGE / INCOME GAP [ % ]
90.4¢/ $1
WAGE / INCOME GAP [ $ ]
0.42
INEQUALITY / GINI INDEX
3,983
TOTAL POPULATION
2,004
MALE POPULATION
1,979
FEMALE POPULATION
101.26
MALES / 100 FEMALES
98.75
FEMALES / 100 MALES
47.2
MEDIAN AGE
3.0
AVG FAMILY SIZE
2.3
AVG HOUSEHOLD SIZE
1,658
LABOR FORCE [ PEOPLE ]
51.3%
PERCENT IN LABOR FORCE
5.0%
UNEMPLOYMENT RATE
Wintersville Area Codes
Income in Wintersville
Income Overview in Wintersville
Per Capita Income in Wintersville is $34,632, while median incomes of families and households are $88,021 and $70,607 respectively.
| Characteristic | Number | Measure |
| Per Capita Income | 3,983 | $34,632 |
| Median Family Income | 1,043 | $88,021 |
| Mean Family Income | 1,043 | $96,890 |
| Median Household Income | 1,688 | $70,607 |
| Mean Household Income | 1,688 | $77,556 |
| Income Deficit | 1,043 | $0 |
| Wage / Income Gap (%) | 3,983 | 9.57% |
| Wage / Income Gap ($) | 3,983 | 90.43¢ per $1 |
| Gini / Inequality Index | 3,983 | 0.42 |
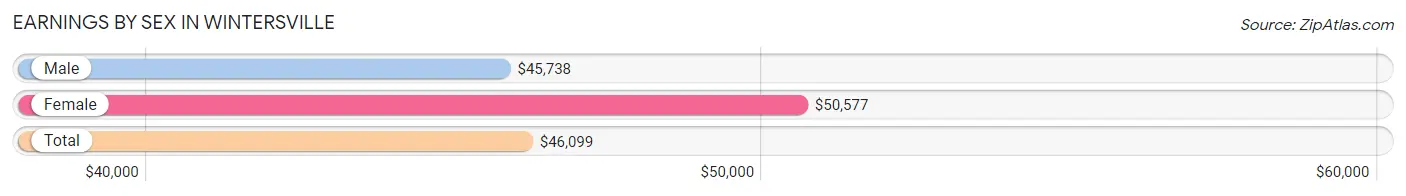
Earnings by Sex in Wintersville
Average Earnings in Wintersville are $46,099, $45,738 for men and $50,577 for women, a difference of 9.6%.
| Sex | Number | Average Earnings |
| Male | 1,071 (62.5%) | $45,738 |
| Female | 642 (37.5%) | $50,577 |
| Total | 1,713 (100.0%) | $46,099 |
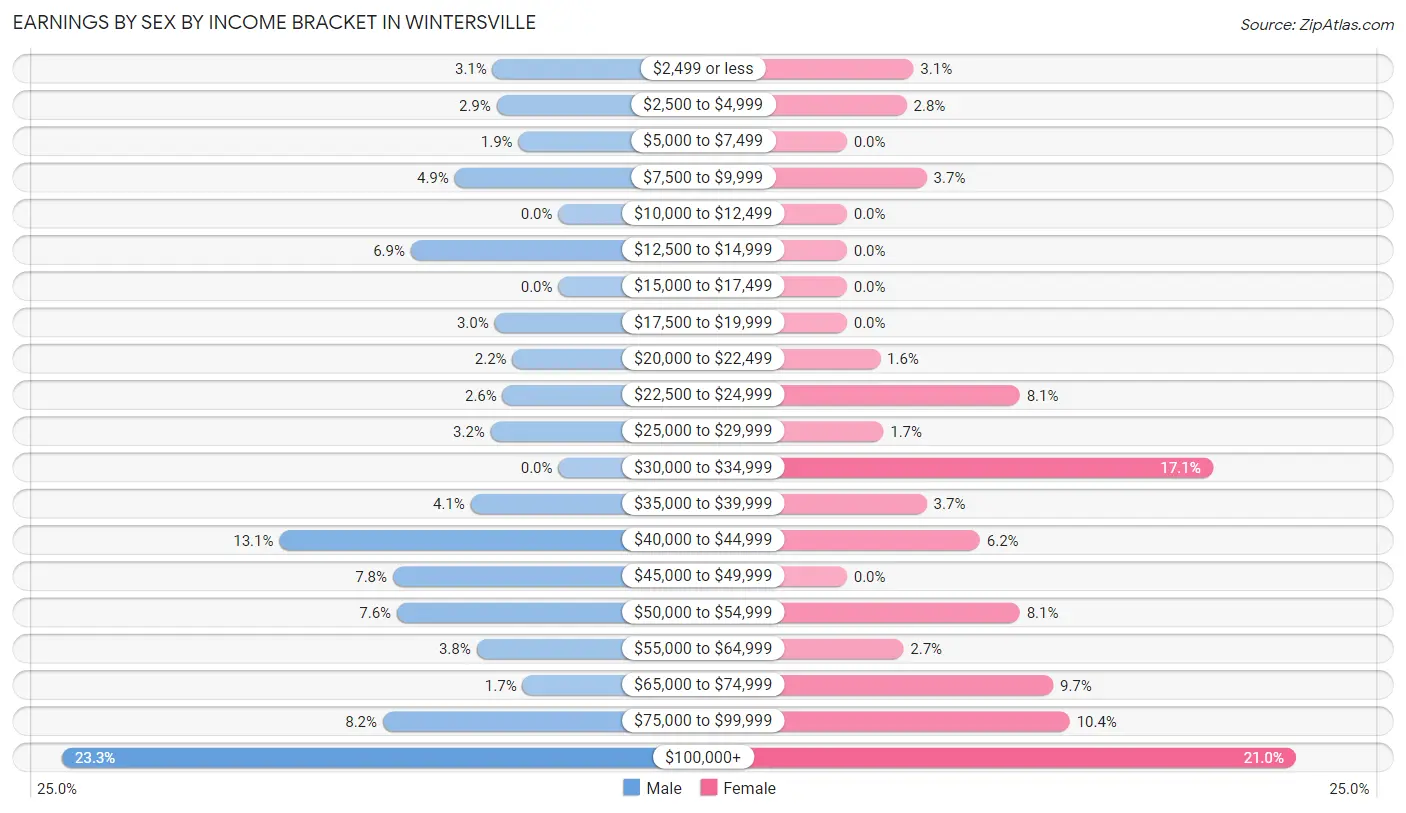
Earnings by Sex by Income Bracket in Wintersville
The most common earnings brackets in Wintersville are $100,000+ for men (249 | 23.3%) and $100,000+ for women (135 | 21.0%).
| Income | Male | Female |
| $2,499 or less | 33 (3.1%) | 20 (3.1%) |
| $2,500 to $4,999 | 31 (2.9%) | 18 (2.8%) |
| $5,000 to $7,499 | 20 (1.9%) | 0 (0.0%) |
| $7,500 to $9,999 | 52 (4.9%) | 24 (3.7%) |
| $10,000 to $12,499 | 0 (0.0%) | 0 (0.0%) |
| $12,500 to $14,999 | 74 (6.9%) | 0 (0.0%) |
| $15,000 to $17,499 | 0 (0.0%) | 0 (0.0%) |
| $17,500 to $19,999 | 32 (3.0%) | 0 (0.0%) |
| $20,000 to $22,499 | 23 (2.1%) | 10 (1.6%) |
| $22,500 to $24,999 | 28 (2.6%) | 52 (8.1%) |
| $25,000 to $29,999 | 34 (3.2%) | 11 (1.7%) |
| $30,000 to $34,999 | 0 (0.0%) | 110 (17.1%) |
| $35,000 to $39,999 | 44 (4.1%) | 24 (3.7%) |
| $40,000 to $44,999 | 140 (13.1%) | 40 (6.2%) |
| $45,000 to $49,999 | 83 (7.7%) | 0 (0.0%) |
| $50,000 to $54,999 | 81 (7.6%) | 52 (8.1%) |
| $55,000 to $64,999 | 41 (3.8%) | 17 (2.6%) |
| $65,000 to $74,999 | 18 (1.7%) | 62 (9.7%) |
| $75,000 to $99,999 | 88 (8.2%) | 67 (10.4%) |
| $100,000+ | 249 (23.3%) | 135 (21.0%) |
| Total | 1,071 (100.0%) | 642 (100.0%) |
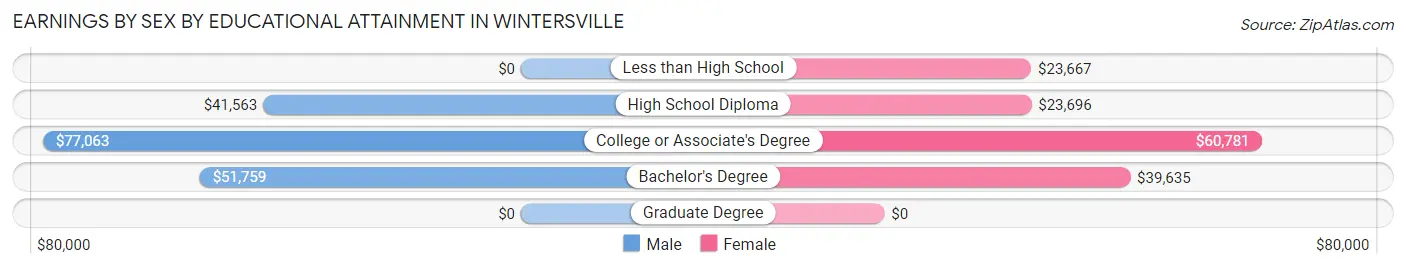
Earnings by Sex by Educational Attainment in Wintersville
Average earnings in Wintersville are $50,741 for men and $51,346 for women, a difference of 1.2%. Men with an educational attainment of college or associate's degree enjoy the highest average annual earnings of $77,063, while those with high school diploma education earn the least with $41,563. Women with an educational attainment of college or associate's degree earn the most with the average annual earnings of $60,781, while those with less than high school education have the smallest earnings of $23,667.
| Educational Attainment | Male Income | Female Income |
| Less than High School | - | - |
| High School Diploma | $41,563 | $23,696 |
| College or Associate's Degree | $77,063 | $60,781 |
| Bachelor's Degree | $51,759 | $39,635 |
| Graduate Degree | - | - |
| Total | $50,741 | $51,346 |
Family Income in Wintersville
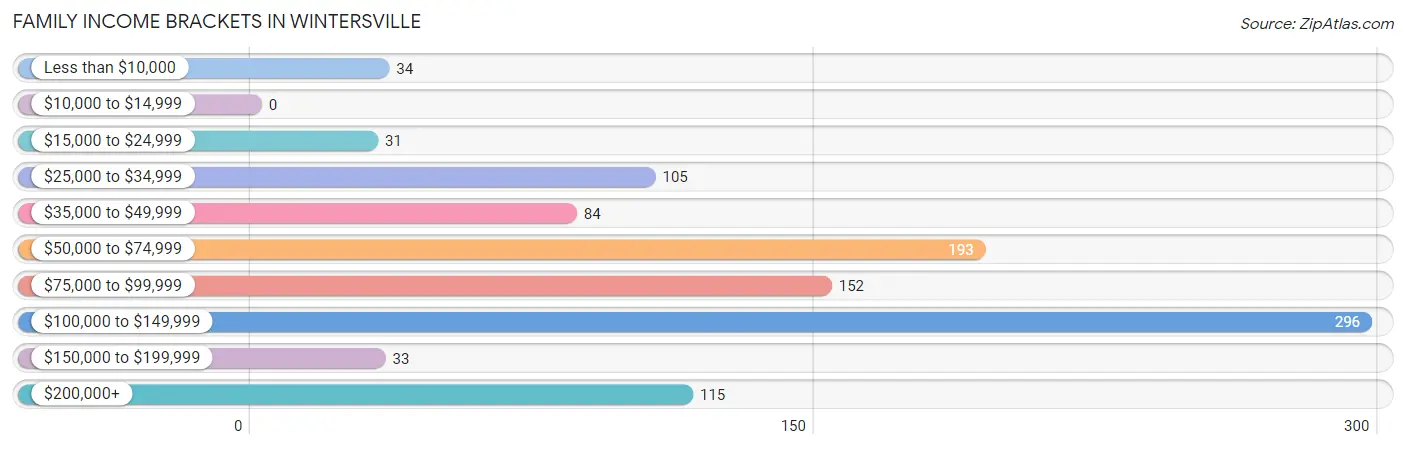
Family Income Brackets in Wintersville
According to the Wintersville family income data, there are 296 families falling into the $100,000 to $149,999 income range, which is the most common income bracket and makes up 28.4% of all families.
| Income Bracket | # Families | % Families |
| Less than $10,000 | 34 | 3.3% |
| $10,000 to $14,999 | 0 | 0.0% |
| $15,000 to $24,999 | 31 | 3.0% |
| $25,000 to $34,999 | 105 | 10.1% |
| $35,000 to $49,999 | 84 | 8.1% |
| $50,000 to $74,999 | 193 | 18.5% |
| $75,000 to $99,999 | 152 | 14.6% |
| $100,000 to $149,999 | 296 | 28.4% |
| $150,000 to $199,999 | 33 | 3.2% |
| $200,000+ | 115 | 11.0% |
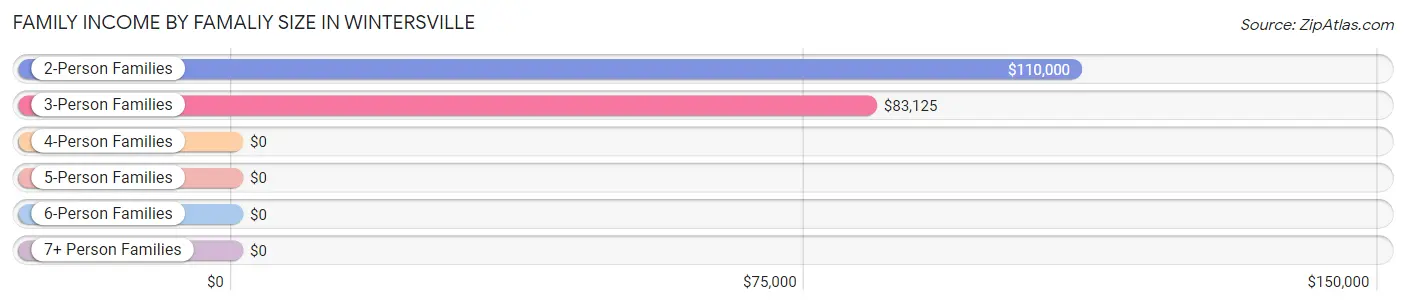
Family Income by Famaliy Size in Wintersville
2-person families (474 | 45.5%) account for the highest median family income in Wintersville with $110,000 per family, while 2-person families (474 | 45.5%) have the highest median income of $55,000 per family member.
| Income Bracket | # Families | Median Income |
| 2-Person Families | 474 (45.5%) | $110,000 |
| 3-Person Families | 335 (32.1%) | $83,125 |
| 4-Person Families | 145 (13.9%) | $0 |
| 5-Person Families | 15 (1.4%) | $0 |
| 6-Person Families | 74 (7.1%) | $0 |
| 7+ Person Families | 0 (0.0%) | $0 |
| Total | 1,043 (100.0%) | $88,021 |
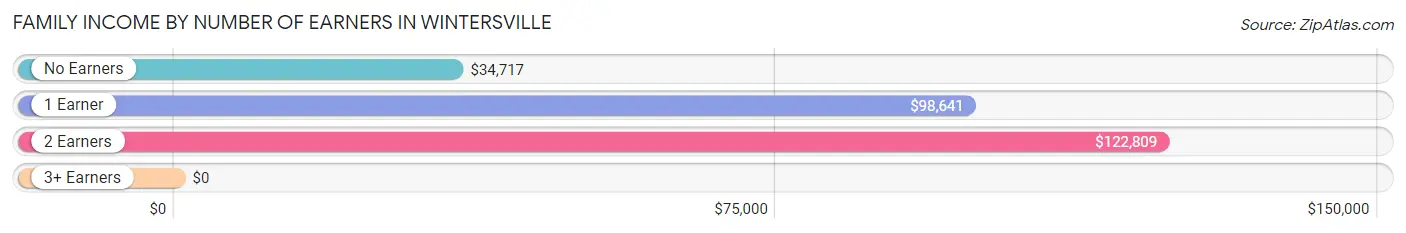
Family Income by Number of Earners in Wintersville
| Number of Earners | # Families | Median Income |
| No Earners | 146 (14.0%) | $34,717 |
| 1 Earner | 455 (43.6%) | $98,641 |
| 2 Earners | 418 (40.1%) | $122,809 |
| 3+ Earners | 24 (2.3%) | $0 |
| Total | 1,043 (100.0%) | $88,021 |
Household Income in Wintersville
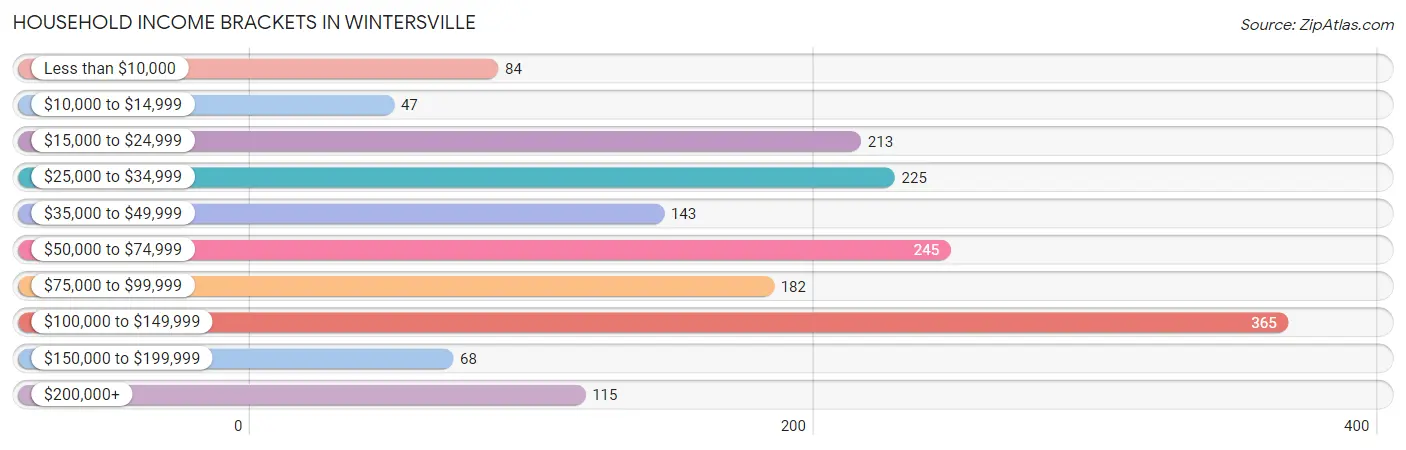
Household Income Brackets in Wintersville
With 365 households falling in the category, the $100,000 to $149,999 income range is the most frequent in Wintersville, accounting for 21.6% of all households. In contrast, only 47 households (2.8%) fall into the $10,000 to $14,999 income bracket, making it the least populous group.
| Income Bracket | # Households | % Households |
| Less than $10,000 | 84 | 5.0% |
| $10,000 to $14,999 | 47 | 2.8% |
| $15,000 to $24,999 | 213 | 12.6% |
| $25,000 to $34,999 | 225 | 13.3% |
| $35,000 to $49,999 | 143 | 8.5% |
| $50,000 to $74,999 | 245 | 14.5% |
| $75,000 to $99,999 | 182 | 10.8% |
| $100,000 to $149,999 | 365 | 21.6% |
| $150,000 to $199,999 | 68 | 4.0% |
| $200,000+ | 115 | 6.8% |
Household Income by Householder Age in Wintersville
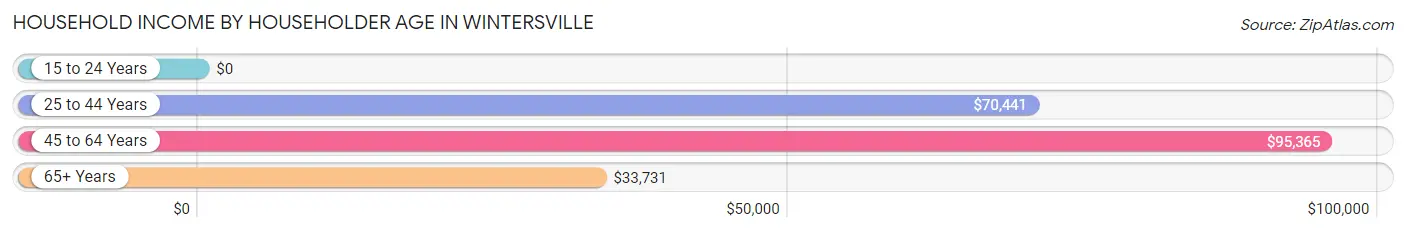
The median household income in Wintersville is $70,607, with the highest median household income of $95,365 found in the 45 to 64 years age bracket for the primary householder. A total of 701 households (41.5%) fall into this category. Meanwhile, the 15 to 24 years age bracket for the primary householder has the lowest median household income of $0, with 20 households (1.2%) in this group.
| Income Bracket | # Households | Median Income |
| 15 to 24 Years | 20 (1.2%) | $0 |
| 25 to 44 Years | 354 (21.0%) | $70,441 |
| 45 to 64 Years | 701 (41.5%) | $95,365 |
| 65+ Years | 613 (36.3%) | $33,731 |
| Total | 1,688 (100.0%) | $70,607 |
Poverty in Wintersville
Income Below Poverty by Sex and Age in Wintersville
With 15.6% poverty level for males and 10.8% for females among the residents of Wintersville, under 5 year old males and 35 to 44 year old females are the most vulnerable to poverty, with 54 males (49.5%) and 31 females (27.2%) in their respective age groups living below the poverty level.
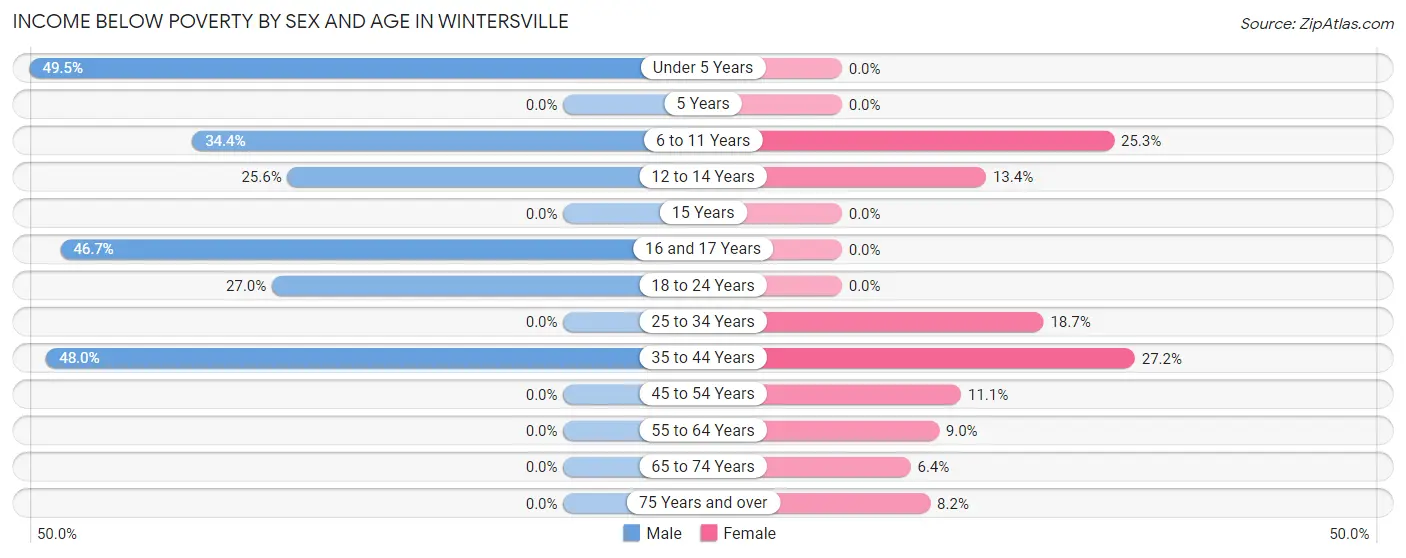
| Age Bracket | Male | Female |
| Under 5 Years | 54 (49.5%) | 0 (0.0%) |
| 5 Years | 0 (0.0%) | 0 (0.0%) |
| 6 to 11 Years | 52 (34.4%) | 23 (25.3%) |
| 12 to 14 Years | 32 (25.6%) | 19 (13.4%) |
| 15 Years | 0 (0.0%) | 0 (0.0%) |
| 16 and 17 Years | 28 (46.7%) | 0 (0.0%) |
| 18 to 24 Years | 60 (27.0%) | 0 (0.0%) |
| 25 to 34 Years | 0 (0.0%) | 35 (18.7%) |
| 35 to 44 Years | 83 (48.0%) | 31 (27.2%) |
| 45 to 54 Years | 0 (0.0%) | 28 (11.1%) |
| 55 to 64 Years | 0 (0.0%) | 30 (9.0%) |
| 65 to 74 Years | 0 (0.0%) | 21 (6.4%) |
| 75 Years and over | 0 (0.0%) | 20 (8.2%) |
| Total | 309 (15.6%) | 207 (10.8%) |
Income Above Poverty by Sex and Age in Wintersville
According to the poverty statistics in Wintersville, males aged 5 years and females aged under 5 years are the age groups that are most secure financially, with 100.0% of males and 100.0% of females in these age groups living above the poverty line.
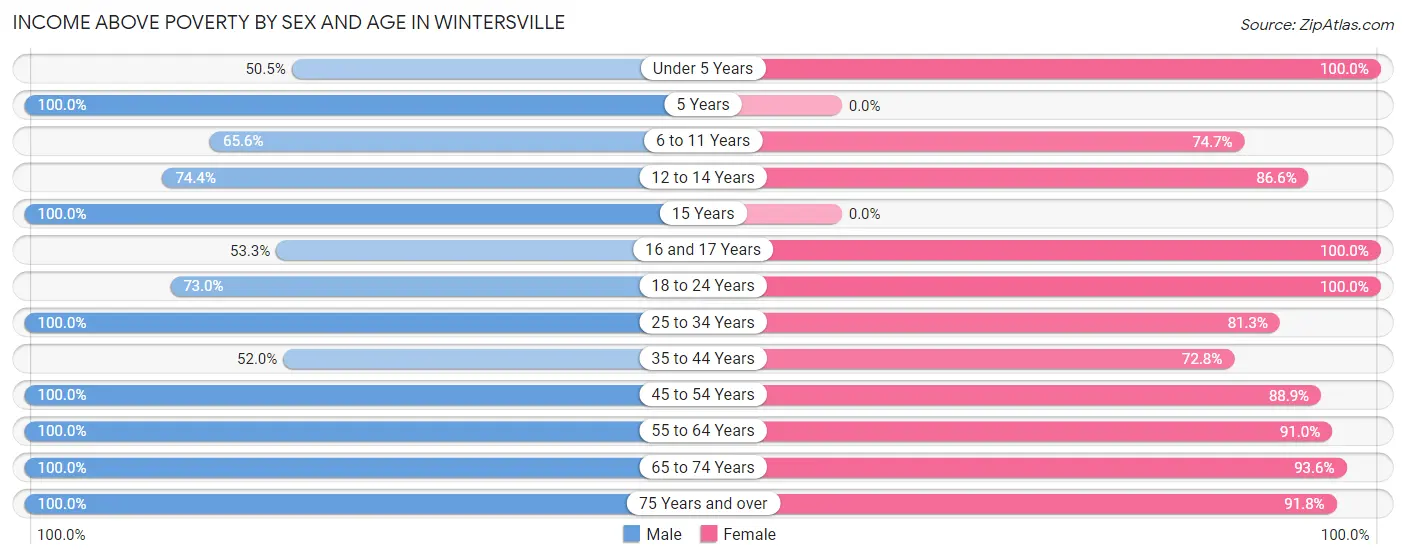
| Age Bracket | Male | Female |
| Under 5 Years | 55 (50.5%) | 45 (100.0%) |
| 5 Years | 34 (100.0%) | 0 (0.0%) |
| 6 to 11 Years | 99 (65.6%) | 68 (74.7%) |
| 12 to 14 Years | 93 (74.4%) | 123 (86.6%) |
| 15 Years | 55 (100.0%) | 0 (0.0%) |
| 16 and 17 Years | 32 (53.3%) | 143 (100.0%) |
| 18 to 24 Years | 162 (73.0%) | 30 (100.0%) |
| 25 to 34 Years | 192 (100.0%) | 152 (81.3%) |
| 35 to 44 Years | 90 (52.0%) | 83 (72.8%) |
| 45 to 54 Years | 427 (100.0%) | 225 (88.9%) |
| 55 to 64 Years | 182 (100.0%) | 303 (91.0%) |
| 65 to 74 Years | 111 (100.0%) | 308 (93.6%) |
| 75 Years and over | 145 (100.0%) | 224 (91.8%) |
| Total | 1,677 (84.4%) | 1,704 (89.2%) |
Income Below Poverty Among Married-Couple Families in Wintersville
The poverty statistics for married-couple families in Wintersville show that 4.6% or 31 of the total 676 families live below the poverty line. Families with 1 or 2 children have the highest poverty rate of 13.2%, comprising of 31 families. On the other hand, families with no children have the lowest poverty rate of 0.0%, which includes 0 families.
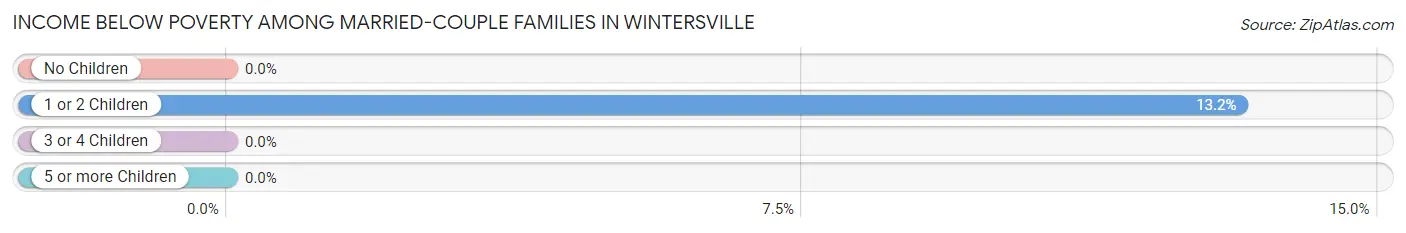
| Children | Above Poverty | Below Poverty |
| No Children | 367 (100.0%) | 0 (0.0%) |
| 1 or 2 Children | 204 (86.8%) | 31 (13.2%) |
| 3 or 4 Children | 74 (100.0%) | 0 (0.0%) |
| 5 or more Children | 0 (0.0%) | 0 (0.0%) |
| Total | 645 (95.4%) | 31 (4.6%) |
Income Below Poverty Among Single-Parent Households in Wintersville
According to the poverty data in Wintersville, 32.7% or 52 single-father households and 16.4% or 34 single-mother households are living below the poverty line. Among single-father households, those with 1 or 2 children have the highest poverty rate, with 52 households (74.3%) experiencing poverty. Likewise, among single-mother households, those with 1 or 2 children have the highest poverty rate, with 34 households (24.5%) falling below the poverty line.
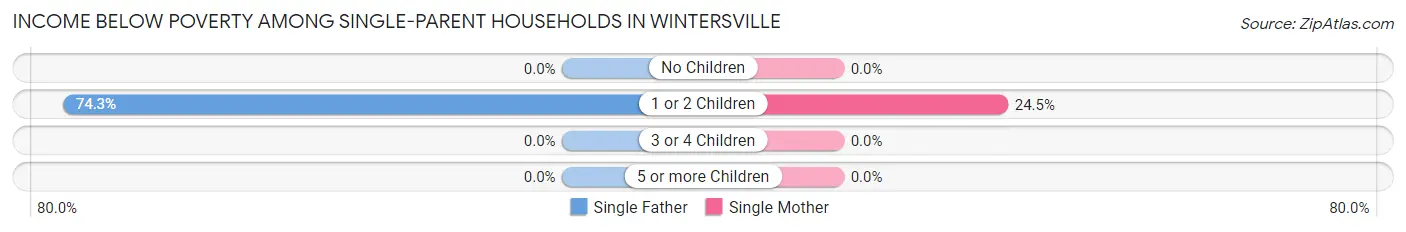
| Children | Single Father | Single Mother |
| No Children | 0 (0.0%) | 0 (0.0%) |
| 1 or 2 Children | 52 (74.3%) | 34 (24.5%) |
| 3 or 4 Children | 0 (0.0%) | 0 (0.0%) |
| 5 or more Children | 0 (0.0%) | 0 (0.0%) |
| Total | 52 (32.7%) | 34 (16.4%) |
Income Below Poverty Among Married-Couple vs Single-Parent Households in Wintersville
The poverty data for Wintersville shows that 31 of the married-couple family households (4.6%) and 86 of the single-parent households (23.4%) are living below the poverty level. Within the married-couple family households, those with 1 or 2 children have the highest poverty rate, with 31 households (13.2%) falling below the poverty line. Among the single-parent households, those with 1 or 2 children have the highest poverty rate, with 86 household (41.1%) living below poverty.
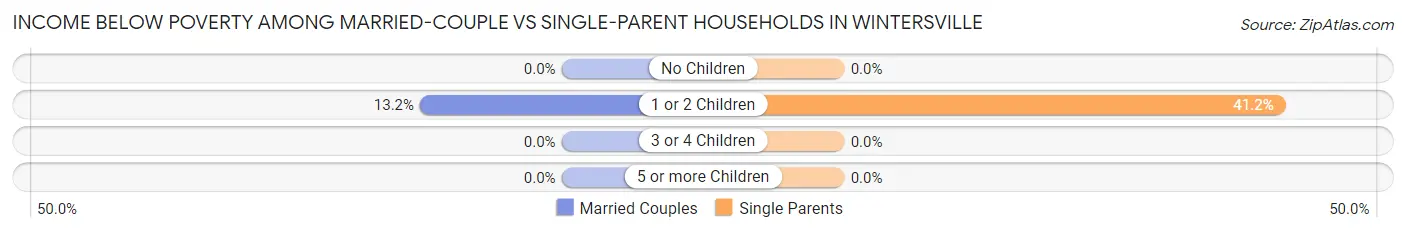
| Children | Married-Couple Families | Single-Parent Households |
| No Children | 0 (0.0%) | 0 (0.0%) |
| 1 or 2 Children | 31 (13.2%) | 86 (41.1%) |
| 3 or 4 Children | 0 (0.0%) | 0 (0.0%) |
| 5 or more Children | 0 (0.0%) | 0 (0.0%) |
| Total | 31 (4.6%) | 86 (23.4%) |
Race in Wintersville
The most populous races in Wintersville are White / Caucasian (3,731 | 93.7%), Black / African American (139 | 3.5%), and Two or more Races (89 | 2.2%).
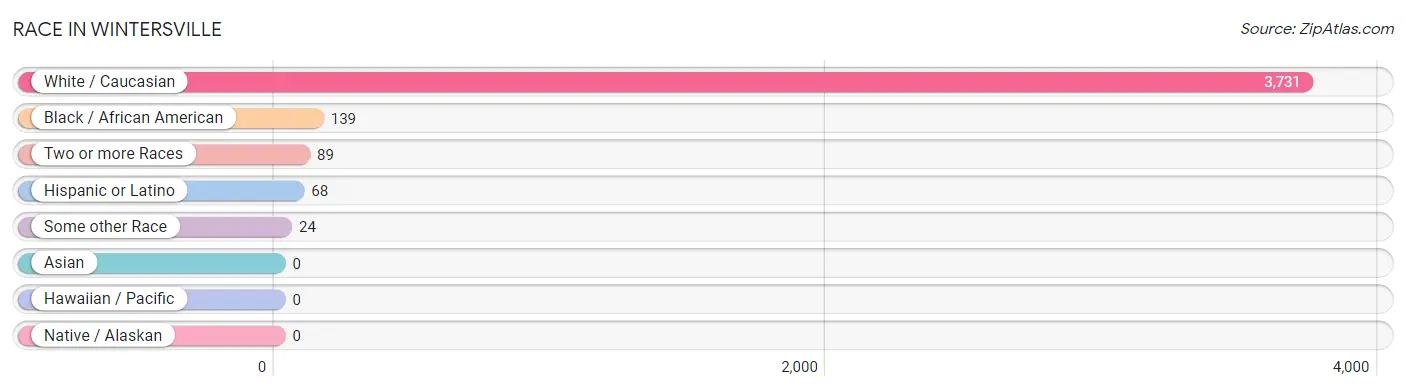
| Race | # Population | % Population |
| Asian | 0 | 0.0% |
| Black / African American | 139 | 3.5% |
| Hawaiian / Pacific | 0 | 0.0% |
| Hispanic or Latino | 68 | 1.7% |
| Native / Alaskan | 0 | 0.0% |
| White / Caucasian | 3,731 | 93.7% |
| Two or more Races | 89 | 2.2% |
| Some other Race | 24 | 0.6% |
| Total | 3,983 | 100.0% |
Ancestry in Wintersville
The most populous ancestries reported in Wintersville are Irish (890 | 22.3%), German (840 | 21.1%), Italian (586 | 14.7%), English (459 | 11.5%), and Polish (336 | 8.4%), together accounting for 78.1% of all Wintersville residents.
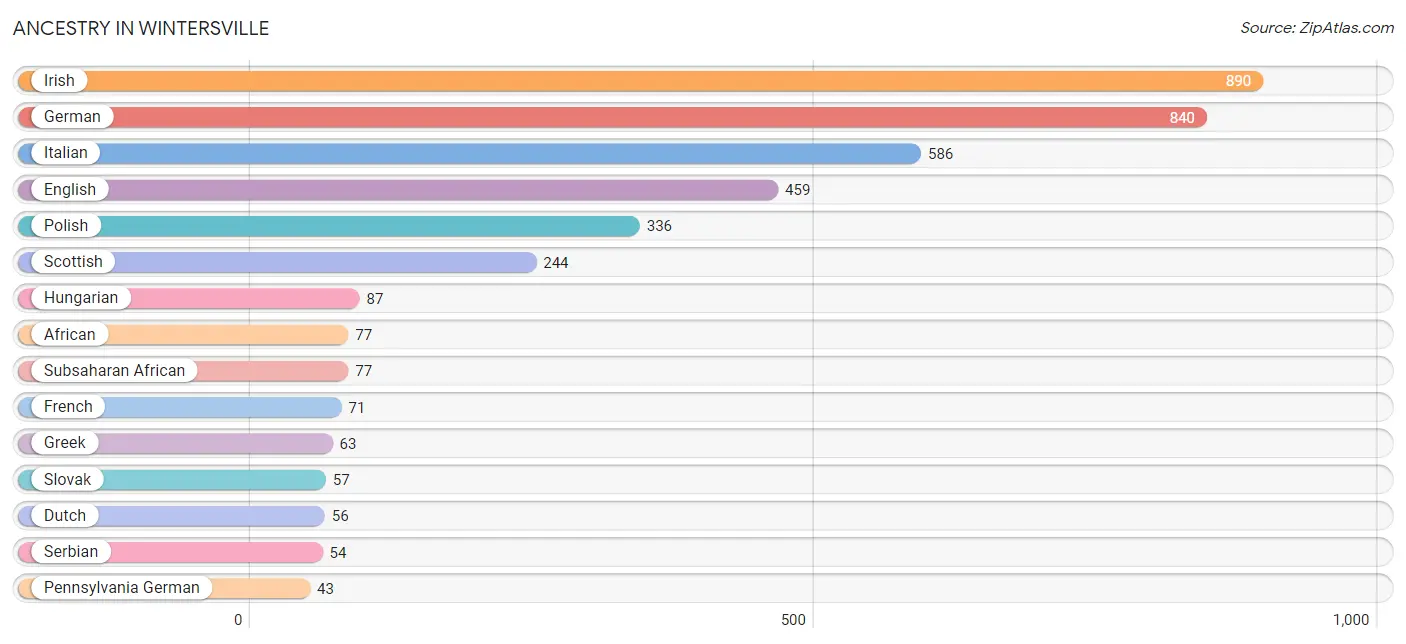
| Ancestry | # Population | % Population |
| African | 77 | 1.9% |
| American | 41 | 1.0% |
| British | 13 | 0.3% |
| Burmese | 12 | 0.3% |
| Czech | 17 | 0.4% |
| Dutch | 56 | 1.4% |
| Eastern European | 40 | 1.0% |
| English | 459 | 11.5% |
| French | 71 | 1.8% |
| German | 840 | 21.1% |
| Greek | 63 | 1.6% |
| Hungarian | 87 | 2.2% |
| Irish | 890 | 22.3% |
| Italian | 586 | 14.7% |
| Mexican | 12 | 0.3% |
| Pennsylvania German | 43 | 1.1% |
| Polish | 336 | 8.4% |
| Portuguese | 24 | 0.6% |
| Puerto Rican | 32 | 0.8% |
| Russian | 14 | 0.4% |
| Scotch-Irish | 43 | 1.1% |
| Scottish | 244 | 6.1% |
| Serbian | 54 | 1.4% |
| Slovak | 57 | 1.4% |
| South American | 24 | 0.6% |
| Subsaharan African | 77 | 1.9% |
| Ukrainian | 5 | 0.1% | View All 27 Rows |
Immigrants in Wintersville
The most numerous immigrant groups reported in Wintersville came from Eastern Europe (10 | 0.3%), Europe (10 | 0.3%), Lithuania (10 | 0.3%), and Canada (7 | 0.2%), together accounting for 0.9% of all Wintersville residents.
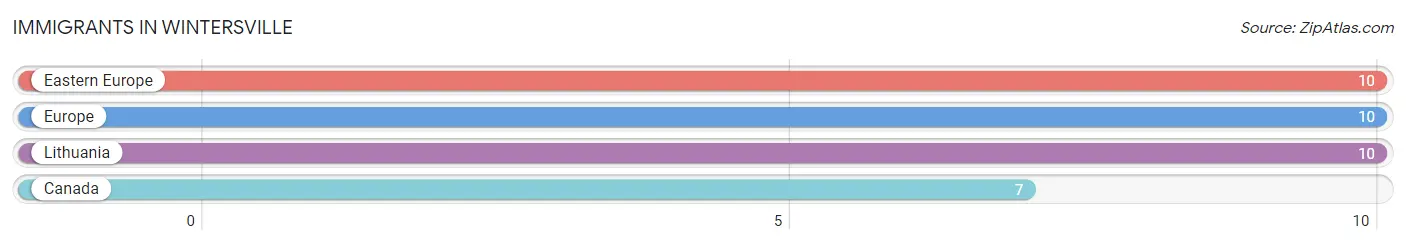
| Immigration Origin | # Population | % Population |
| Canada | 7 | 0.2% |
| Eastern Europe | 10 | 0.3% |
| Europe | 10 | 0.3% |
| Lithuania | 10 | 0.3% | View All 4 Rows |
Sex and Age in Wintersville
Sex and Age in Wintersville
The most populous age groups in Wintersville are 45 to 49 Years (249 | 12.4%) for men and 60 to 64 Years (225 | 11.4%) for women.
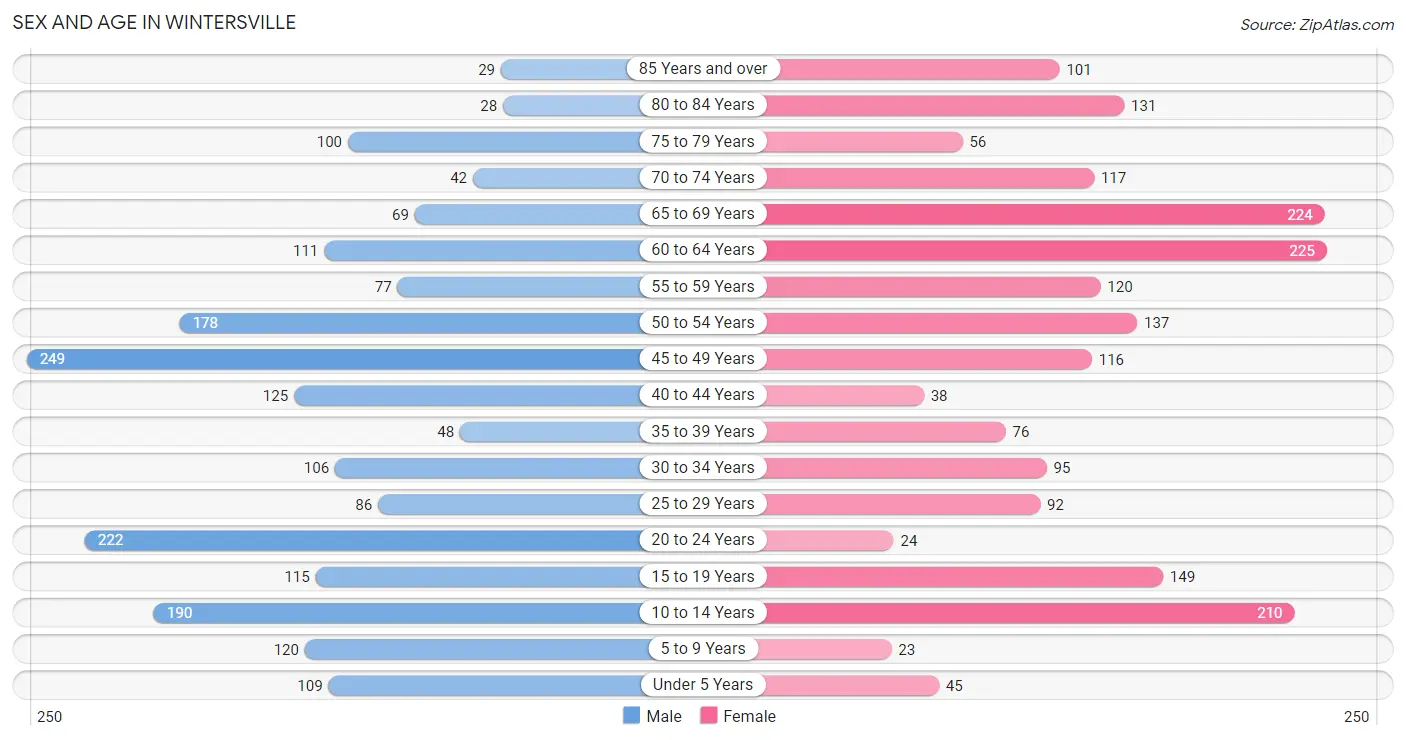
| Age Bracket | Male | Female |
| Under 5 Years | 109 (5.4%) | 45 (2.3%) |
| 5 to 9 Years | 120 (6.0%) | 23 (1.2%) |
| 10 to 14 Years | 190 (9.5%) | 210 (10.6%) |
| 15 to 19 Years | 115 (5.7%) | 149 (7.5%) |
| 20 to 24 Years | 222 (11.1%) | 24 (1.2%) |
| 25 to 29 Years | 86 (4.3%) | 92 (4.6%) |
| 30 to 34 Years | 106 (5.3%) | 95 (4.8%) |
| 35 to 39 Years | 48 (2.4%) | 76 (3.8%) |
| 40 to 44 Years | 125 (6.2%) | 38 (1.9%) |
| 45 to 49 Years | 249 (12.4%) | 116 (5.9%) |
| 50 to 54 Years | 178 (8.9%) | 137 (6.9%) |
| 55 to 59 Years | 77 (3.8%) | 120 (6.1%) |
| 60 to 64 Years | 111 (5.5%) | 225 (11.4%) |
| 65 to 69 Years | 69 (3.4%) | 224 (11.3%) |
| 70 to 74 Years | 42 (2.1%) | 117 (5.9%) |
| 75 to 79 Years | 100 (5.0%) | 56 (2.8%) |
| 80 to 84 Years | 28 (1.4%) | 131 (6.6%) |
| 85 Years and over | 29 (1.5%) | 101 (5.1%) |
| Total | 2,004 (100.0%) | 1,979 (100.0%) |
Families and Households in Wintersville
Median Family Size in Wintersville
The median family size in Wintersville is 3.05 persons per family, with single female/mother families (208 | 19.9%) accounting for the largest median family size of 3.37 persons per family. On the other hand, single male/father families (159 | 15.2%) represent the smallest median family size with 2.86 persons per family.
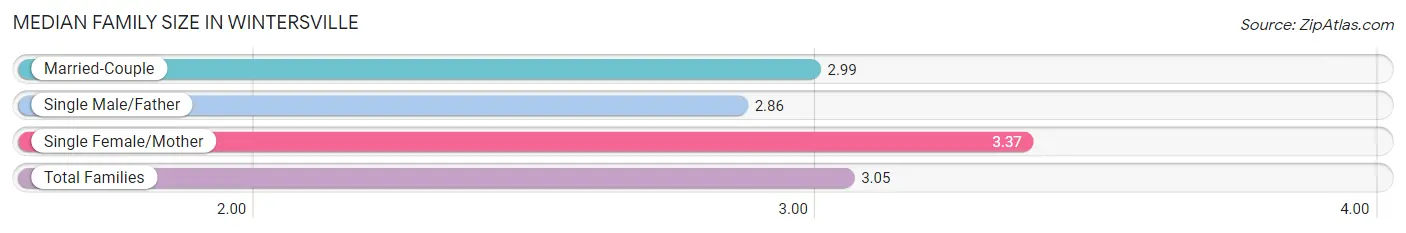
| Family Type | # Families | Family Size |
| Married-Couple | 676 (64.8%) | 2.99 |
| Single Male/Father | 159 (15.2%) | 2.86 |
| Single Female/Mother | 208 (19.9%) | 3.37 |
| Total Families | 1,043 (100.0%) | 3.05 |
Median Household Size in Wintersville
The median household size in Wintersville is 2.31 persons per household, with single female/mother households (208 | 12.3%) accounting for the largest median household size of 3.58 persons per household. non-family households (645 | 38.2%) represent the smallest median household size with 1.02 persons per household.
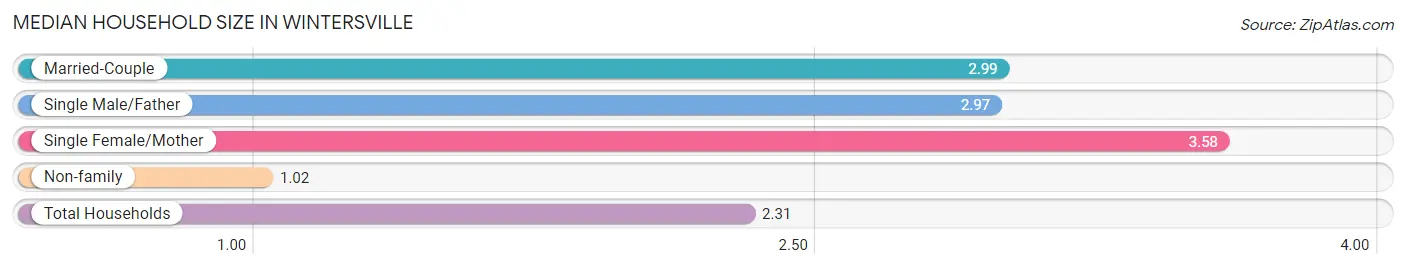
| Household Type | # Households | Household Size |
| Married-Couple | 676 (40.1%) | 2.99 |
| Single Male/Father | 159 (9.4%) | 2.97 |
| Single Female/Mother | 208 (12.3%) | 3.58 |
| Non-family | 645 (38.2%) | 1.02 |
| Total Households | 1,688 (100.0%) | 2.31 |
Household Size by Marriage Status in Wintersville
Out of a total of 1,688 households in Wintersville, 1,043 (61.8%) are family households, while 645 (38.2%) are nonfamily households. The most numerous type of family households are 2-person households, comprising 466, and the most common type of nonfamily households are 1-person households, comprising 628.
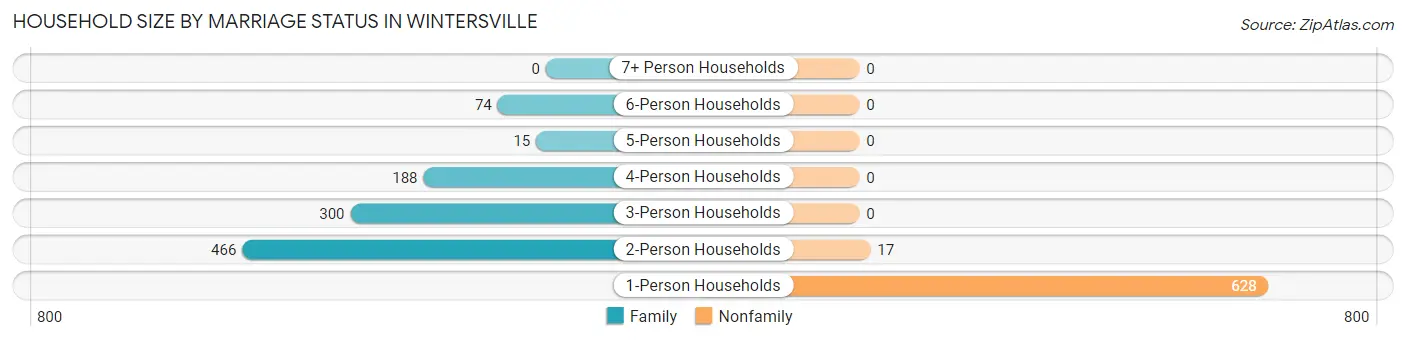
| Household Size | Family Households | Nonfamily Households |
| 1-Person Households | - | 628 (37.2%) |
| 2-Person Households | 466 (27.6%) | 17 (1.0%) |
| 3-Person Households | 300 (17.8%) | 0 (0.0%) |
| 4-Person Households | 188 (11.1%) | 0 (0.0%) |
| 5-Person Households | 15 (0.9%) | 0 (0.0%) |
| 6-Person Households | 74 (4.4%) | 0 (0.0%) |
| 7+ Person Households | 0 (0.0%) | 0 (0.0%) |
| Total | 1,043 (61.8%) | 645 (38.2%) |
Female Fertility in Wintersville
Fertility by Age in Wintersville
| Age Bracket | Women with Births | Births / 1,000 Women |
| 15 to 19 years | 0 (0.0%) | 0.0 |
| 20 to 34 years | 0 (0.0%) | 0.0 |
| 35 to 50 years | 0 (0.0%) | 0.0 |
| Total | 0 (0.0%) | 0.0 |
Fertility by Age by Marriage Status in Wintersville
| Age Bracket | Married | Unmarried |
| 15 to 19 years | 0 (0.0%) | 0 (0.0%) |
| 20 to 34 years | 0 (0.0%) | 0 (0.0%) |
| 35 to 50 years | 0 (0.0%) | 0 (0.0%) |
| Total | 0 (0.0%) | 0 (0.0%) |
Fertility by Education in Wintersville

| Educational Attainment | Women with Births | Births / 1,000 Women |
| Less than High School | 0 (0.0%) | 0.0 |
| High School Diploma | 0 (0.0%) | 0.0 |
| College or Associate's Degree | 0 (0.0%) | 0.0 |
| Bachelor's Degree | 0 (0.0%) | 0.0 |
| Graduate Degree | 0 (0.0%) | 0.0 |
| Total | 0 (0.0%) | 0.0 |
Fertility by Education by Marriage Status in Wintersville
| Educational Attainment | Married | Unmarried |
| Less than High School | 0 (0.0%) | 0 (0.0%) |
| High School Diploma | 0 (0.0%) | 0 (0.0%) |
| College or Associate's Degree | 0 (0.0%) | 0 (0.0%) |
| Bachelor's Degree | 0 (0.0%) | 0 (0.0%) |
| Graduate Degree | 0 (0.0%) | 0 (0.0%) |
| Total | 0 (0.0%) | 0 (0.0%) |
Employment Characteristics in Wintersville
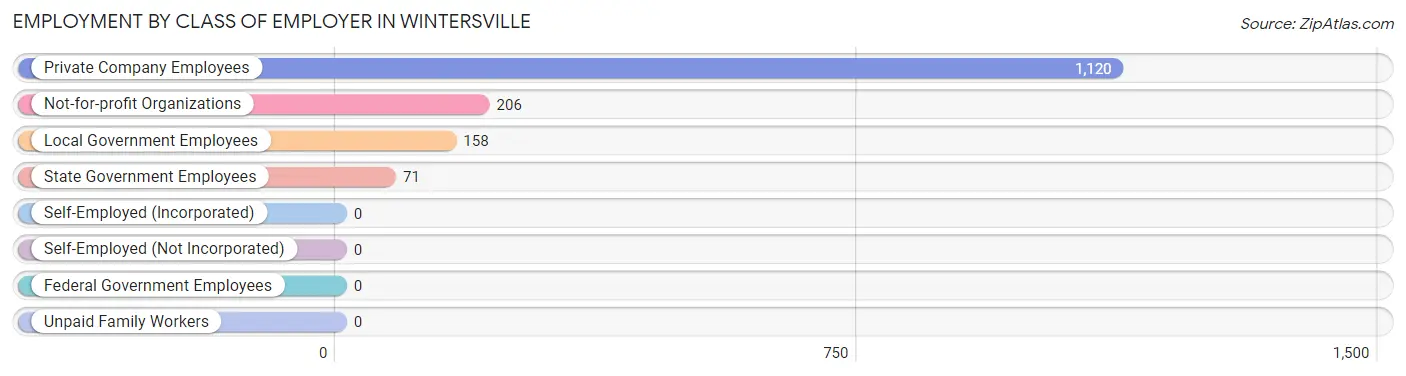
Employment by Class of Employer in Wintersville
Among the 1,555 employed individuals in Wintersville, private company employees (1,120 | 72.0%), not-for-profit organizations (206 | 13.3%), and local government employees (158 | 10.2%) make up the most common classes of employment.
| Employer Class | # Employees | % Employees |
| Private Company Employees | 1,120 | 72.0% |
| Self-Employed (Incorporated) | 0 | 0.0% |
| Self-Employed (Not Incorporated) | 0 | 0.0% |
| Not-for-profit Organizations | 206 | 13.3% |
| Local Government Employees | 158 | 10.2% |
| State Government Employees | 71 | 4.6% |
| Federal Government Employees | 0 | 0.0% |
| Unpaid Family Workers | 0 | 0.0% |
| Total | 1,555 | 100.0% |
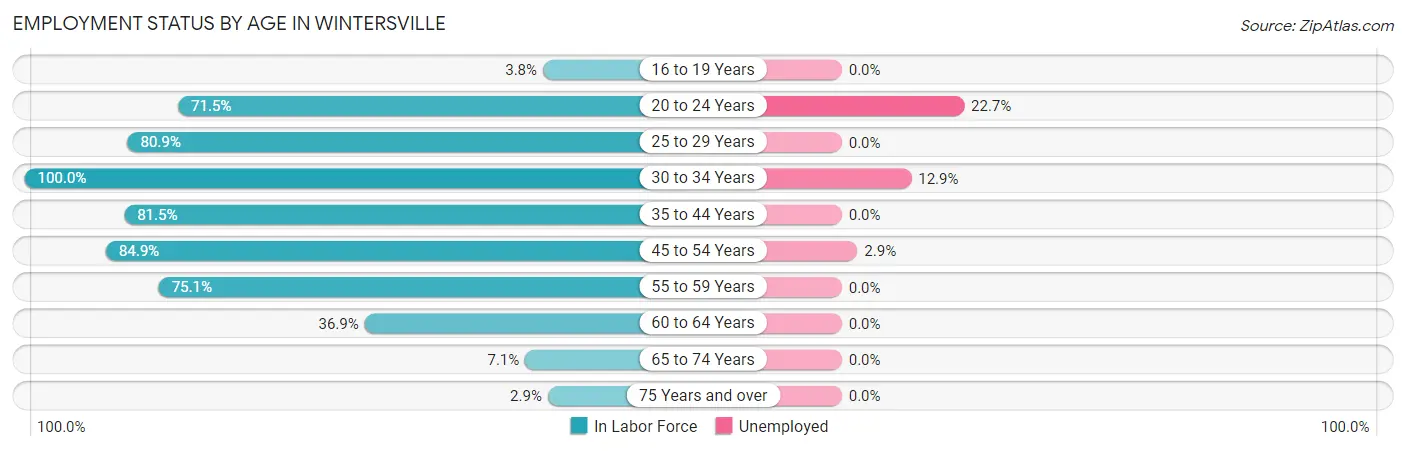
Employment Status by Age in Wintersville
According to the labor force statistics for Wintersville, out of the total population over 16 years of age (3,231), 51.3% or 1,658 individuals are in the labor force, with 5.0% or 83 of them unemployed. The age group with the highest labor force participation rate is 30 to 34 years, with 100.0% or 201 individuals in the labor force. Within the labor force, the 20 to 24 years age range has the highest percentage of unemployed individuals, with 22.7% or 40 of them being unemployed.
| Age Bracket | In Labor Force | Unemployed |
| 16 to 19 Years | 8 (3.8%) | 0 (0.0%) |
| 20 to 24 Years | 176 (71.5%) | 40 (22.7%) |
| 25 to 29 Years | 144 (80.9%) | 0 (0.0%) |
| 30 to 34 Years | 201 (100.0%) | 26 (12.9%) |
| 35 to 44 Years | 234 (81.5%) | 0 (0.0%) |
| 45 to 54 Years | 577 (84.9%) | 17 (2.9%) |
| 55 to 59 Years | 148 (75.1%) | 0 (0.0%) |
| 60 to 64 Years | 124 (36.9%) | 0 (0.0%) |
| 65 to 74 Years | 32 (7.1%) | 0 (0.0%) |
| 75 Years and over | 13 (2.9%) | 0 (0.0%) |
| Total | 1,658 (51.3%) | 83 (5.0%) |
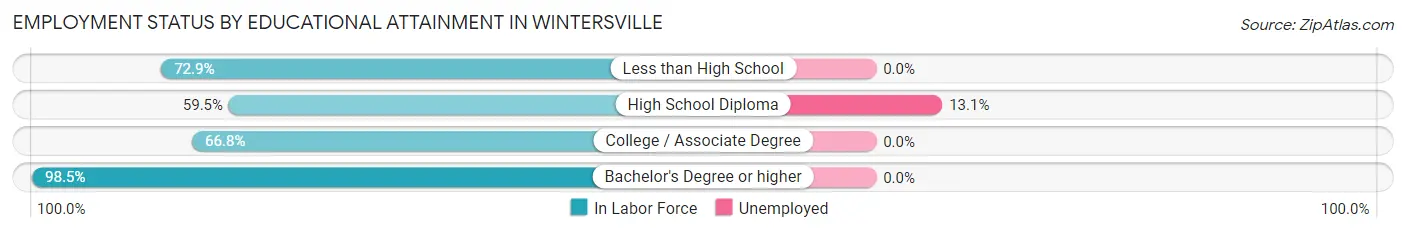
Employment Status by Educational Attainment in Wintersville
According to labor force statistics for Wintersville, 76.0% of individuals (1,428) out of the total population between 25 and 64 years of age (1,879) are in the labor force, with 3.0% or 43 of them being unemployed. The group with the highest labor force participation rate are those with the educational attainment of bachelor's degree or higher, with 98.5% or 641 individuals in the labor force. Within the labor force, individuals with high school diploma education have the highest percentage of unemployment, with 13.1% or 43 of them being unemployed.
| Educational Attainment | In Labor Force | Unemployed |
| Less than High School | 78 (72.9%) | 0 (0.0%) |
| High School Diploma | 328 (59.5%) | 72 (13.1%) |
| College / Associate Degree | 381 (66.8%) | 0 (0.0%) |
| Bachelor's Degree or higher | 641 (98.5%) | 0 (0.0%) |
| Total | 1,428 (76.0%) | 56 (3.0%) |
Employment Occupations by Sex in Wintersville
Management, Business, Science and Arts Occupations
The most common Management, Business, Science and Arts occupations in Wintersville are Management (344 | 21.9%), Health Diagnosing & Treating (137 | 8.7%), Community & Social Service (111 | 7.0%), Computers, Engineering & Science (102 | 6.5%), and Business & Financial (73 | 4.6%).
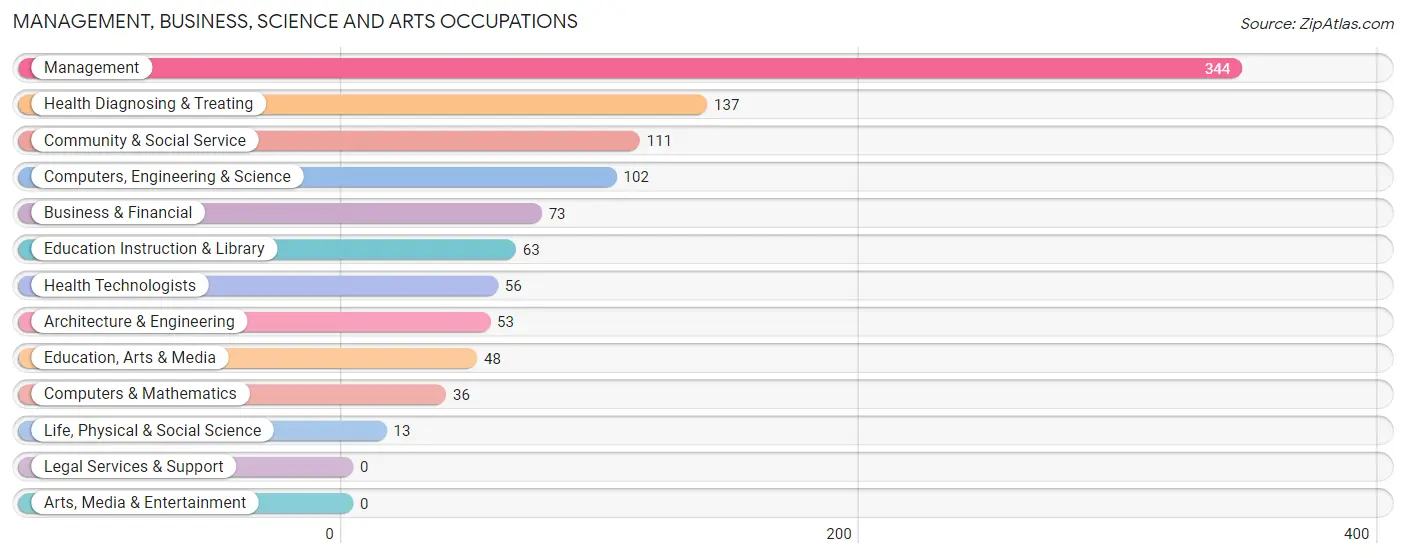
Management, Business, Science and Arts Occupations by Sex
Within the Management, Business, Science and Arts occupations in Wintersville, the most male-oriented occupations are Architecture & Engineering (100.0%), Life, Physical & Social Science (100.0%), and Health Diagnosing & Treating (73.7%), while the most female-oriented occupations are Computers & Mathematics (100.0%), Education, Arts & Media (87.5%), and Community & Social Service (75.7%).
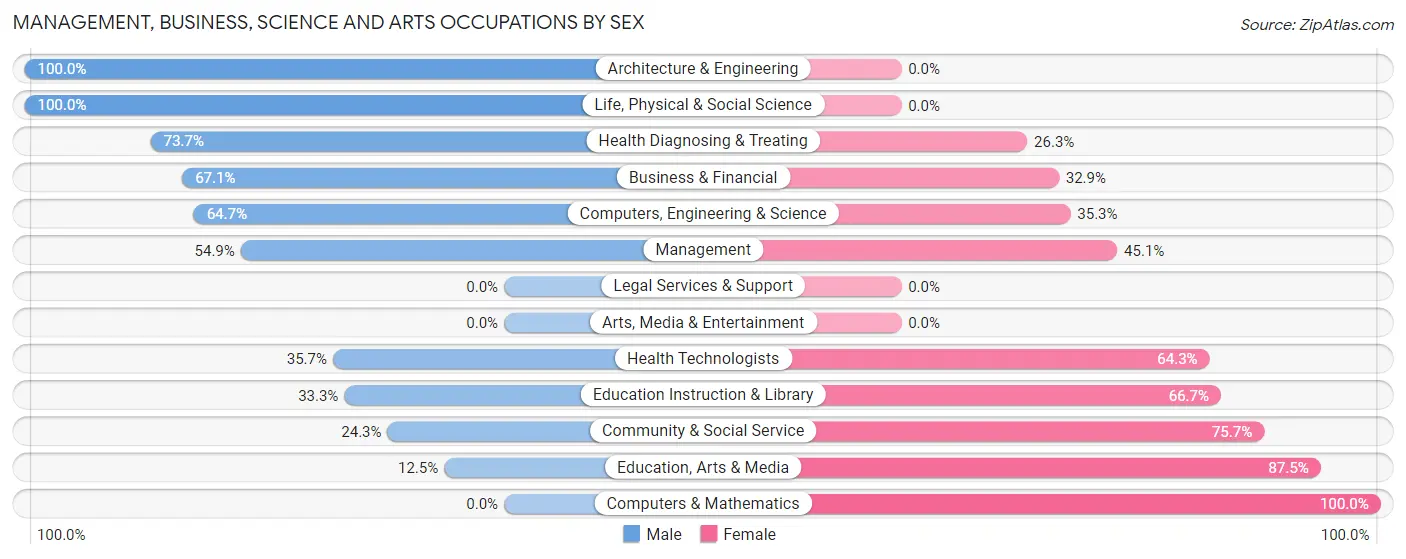
| Occupation | Male | Female |
| Management | 189 (54.9%) | 155 (45.1%) |
| Business & Financial | 49 (67.1%) | 24 (32.9%) |
| Computers, Engineering & Science | 66 (64.7%) | 36 (35.3%) |
| Computers & Mathematics | 0 (0.0%) | 36 (100.0%) |
| Architecture & Engineering | 53 (100.0%) | 0 (0.0%) |
| Life, Physical & Social Science | 13 (100.0%) | 0 (0.0%) |
| Community & Social Service | 27 (24.3%) | 84 (75.7%) |
| Education, Arts & Media | 6 (12.5%) | 42 (87.5%) |
| Legal Services & Support | 0 (0.0%) | 0 (0.0%) |
| Education Instruction & Library | 21 (33.3%) | 42 (66.7%) |
| Arts, Media & Entertainment | 0 (0.0%) | 0 (0.0%) |
| Health Diagnosing & Treating | 101 (73.7%) | 36 (26.3%) |
| Health Technologists | 20 (35.7%) | 36 (64.3%) |
| Total (Category) | 432 (56.3%) | 335 (43.7%) |
| Total (Overall) | 974 (61.9%) | 600 (38.1%) |
Services Occupations
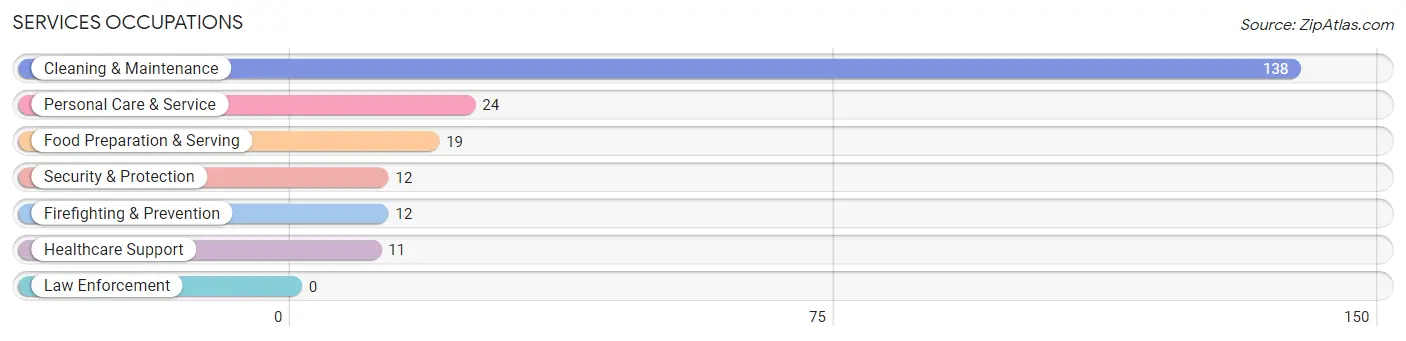
The most common Services occupations in Wintersville are Cleaning & Maintenance (138 | 8.8%), Personal Care & Service (24 | 1.5%), Food Preparation & Serving (19 | 1.2%), Security & Protection (12 | 0.8%), and Firefighting & Prevention (12 | 0.8%).
Services Occupations by Sex
Within the Services occupations in Wintersville, the most male-oriented occupations are Security & Protection (100.0%), Firefighting & Prevention (100.0%), and Cleaning & Maintenance (100.0%), while the most female-oriented occupations are Healthcare Support (100.0%), Food Preparation & Serving (100.0%), and Personal Care & Service (100.0%).
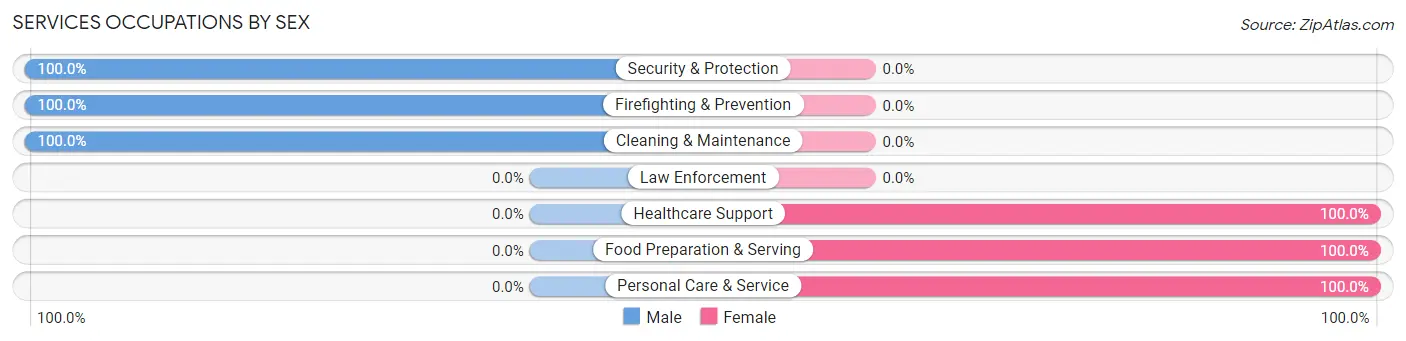
| Occupation | Male | Female |
| Healthcare Support | 0 (0.0%) | 11 (100.0%) |
| Security & Protection | 12 (100.0%) | 0 (0.0%) |
| Firefighting & Prevention | 12 (100.0%) | 0 (0.0%) |
| Law Enforcement | 0 (0.0%) | 0 (0.0%) |
| Food Preparation & Serving | 0 (0.0%) | 19 (100.0%) |
| Cleaning & Maintenance | 138 (100.0%) | 0 (0.0%) |
| Personal Care & Service | 0 (0.0%) | 24 (100.0%) |
| Total (Category) | 150 (73.5%) | 54 (26.5%) |
| Total (Overall) | 974 (61.9%) | 600 (38.1%) |
Sales and Office Occupations
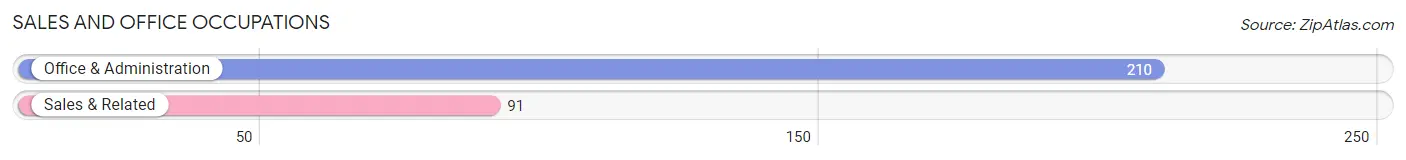
The most common Sales and Office occupations in Wintersville are Office & Administration (210 | 13.3%), and Sales & Related (91 | 5.8%).
Sales and Office Occupations by Sex
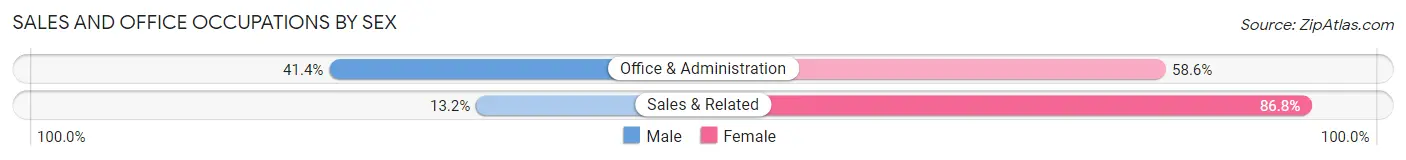
| Occupation | Male | Female |
| Sales & Related | 12 (13.2%) | 79 (86.8%) |
| Office & Administration | 87 (41.4%) | 123 (58.6%) |
| Total (Category) | 99 (32.9%) | 202 (67.1%) |
| Total (Overall) | 974 (61.9%) | 600 (38.1%) |
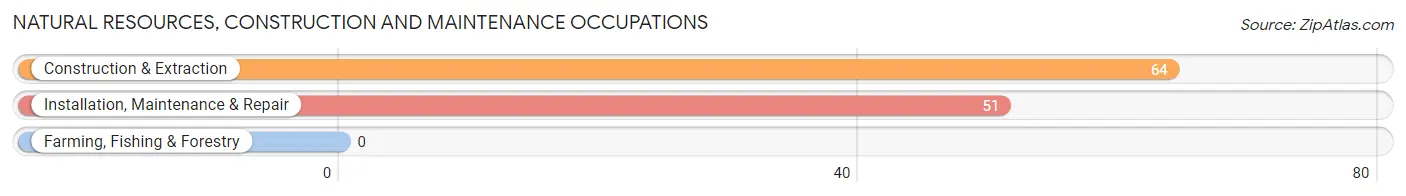
Natural Resources, Construction and Maintenance Occupations
The most common Natural Resources, Construction and Maintenance occupations in Wintersville are Construction & Extraction (64 | 4.1%), and Installation, Maintenance & Repair (51 | 3.2%).
Natural Resources, Construction and Maintenance Occupations by Sex
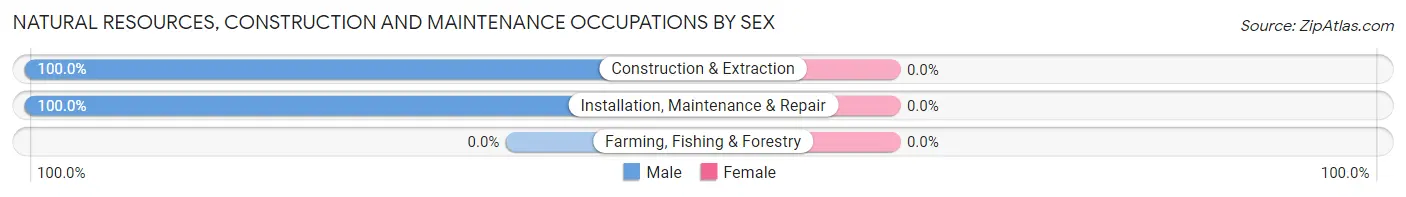
| Occupation | Male | Female |
| Farming, Fishing & Forestry | 0 (0.0%) | 0 (0.0%) |
| Construction & Extraction | 64 (100.0%) | 0 (0.0%) |
| Installation, Maintenance & Repair | 51 (100.0%) | 0 (0.0%) |
| Total (Category) | 115 (100.0%) | 0 (0.0%) |
| Total (Overall) | 974 (61.9%) | 600 (38.1%) |
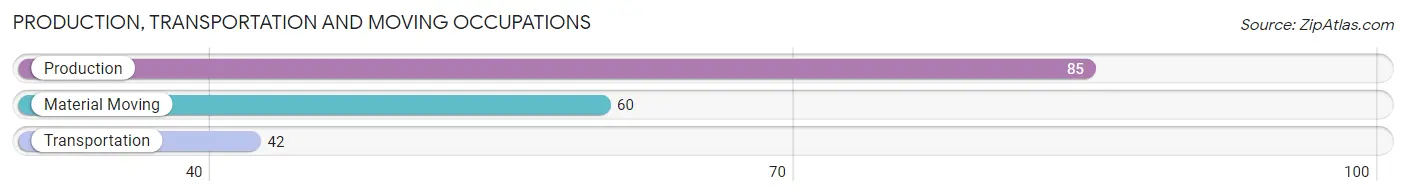
Production, Transportation and Moving Occupations
The most common Production, Transportation and Moving occupations in Wintersville are Production (85 | 5.4%), Material Moving (60 | 3.8%), and Transportation (42 | 2.7%).
Production, Transportation and Moving Occupations by Sex
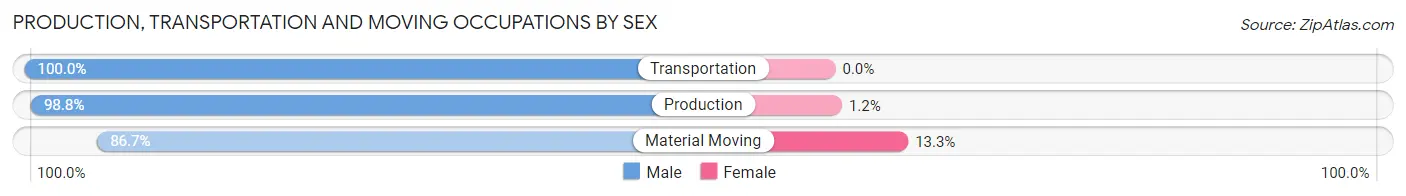
| Occupation | Male | Female |
| Production | 84 (98.8%) | 1 (1.2%) |
| Transportation | 42 (100.0%) | 0 (0.0%) |
| Material Moving | 52 (86.7%) | 8 (13.3%) |
| Total (Category) | 178 (95.2%) | 9 (4.8%) |
| Total (Overall) | 974 (61.9%) | 600 (38.1%) |
Employment Industries by Sex in Wintersville
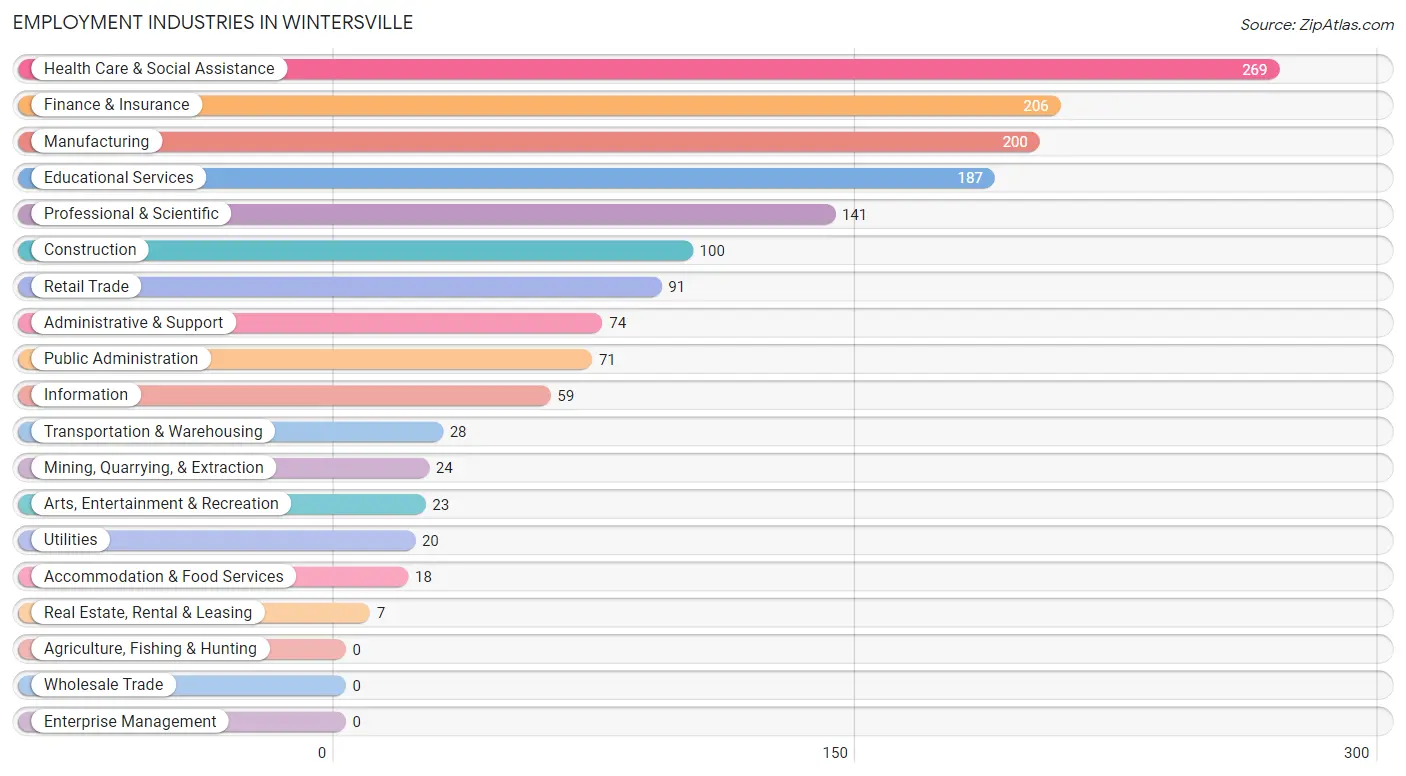
Employment Industries in Wintersville
The major employment industries in Wintersville include Health Care & Social Assistance (269 | 17.1%), Finance & Insurance (206 | 13.1%), Manufacturing (200 | 12.7%), Educational Services (187 | 11.9%), and Professional & Scientific (141 | 9.0%).
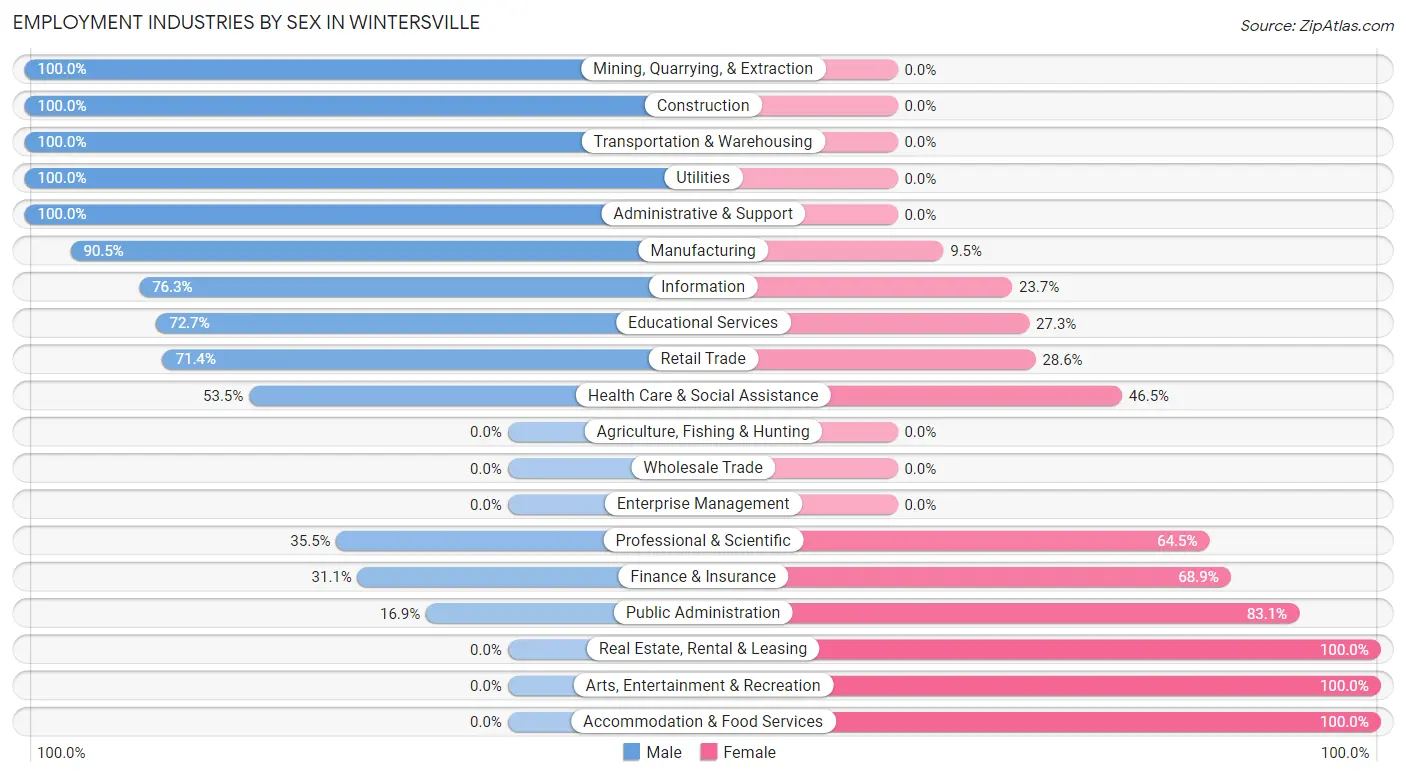
Employment Industries by Sex in Wintersville
The Wintersville industries that see more men than women are Mining, Quarrying, & Extraction (100.0%), Construction (100.0%), and Transportation & Warehousing (100.0%), whereas the industries that tend to have a higher number of women are Real Estate, Rental & Leasing (100.0%), Arts, Entertainment & Recreation (100.0%), and Accommodation & Food Services (100.0%).
| Industry | Male | Female |
| Agriculture, Fishing & Hunting | 0 (0.0%) | 0 (0.0%) |
| Mining, Quarrying, & Extraction | 24 (100.0%) | 0 (0.0%) |
| Construction | 100 (100.0%) | 0 (0.0%) |
| Manufacturing | 181 (90.5%) | 19 (9.5%) |
| Wholesale Trade | 0 (0.0%) | 0 (0.0%) |
| Retail Trade | 65 (71.4%) | 26 (28.6%) |
| Transportation & Warehousing | 28 (100.0%) | 0 (0.0%) |
| Utilities | 20 (100.0%) | 0 (0.0%) |
| Information | 45 (76.3%) | 14 (23.7%) |
| Finance & Insurance | 64 (31.1%) | 142 (68.9%) |
| Real Estate, Rental & Leasing | 0 (0.0%) | 7 (100.0%) |
| Professional & Scientific | 50 (35.5%) | 91 (64.5%) |
| Enterprise Management | 0 (0.0%) | 0 (0.0%) |
| Administrative & Support | 74 (100.0%) | 0 (0.0%) |
| Educational Services | 136 (72.7%) | 51 (27.3%) |
| Health Care & Social Assistance | 144 (53.5%) | 125 (46.5%) |
| Arts, Entertainment & Recreation | 0 (0.0%) | 23 (100.0%) |
| Accommodation & Food Services | 0 (0.0%) | 18 (100.0%) |
| Public Administration | 12 (16.9%) | 59 (83.1%) |
| Total | 974 (61.9%) | 600 (38.1%) |
Education in Wintersville
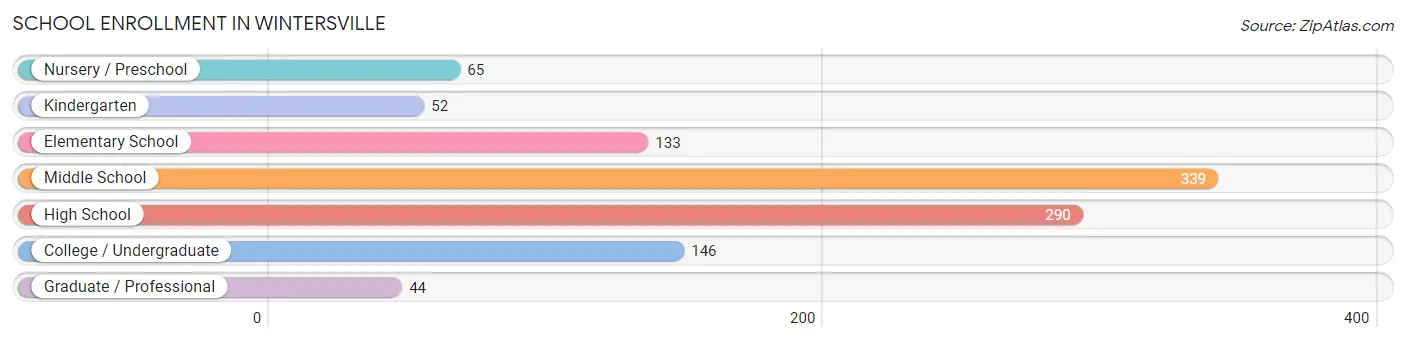
School Enrollment in Wintersville
The most common levels of schooling among the 1,069 students in Wintersville are middle school (339 | 31.7%), high school (290 | 27.1%), and college / undergraduate (146 | 13.7%).
| School Level | # Students | % Students |
| Nursery / Preschool | 65 | 6.1% |
| Kindergarten | 52 | 4.9% |
| Elementary School | 133 | 12.4% |
| Middle School | 339 | 31.7% |
| High School | 290 | 27.1% |
| College / Undergraduate | 146 | 13.7% |
| Graduate / Professional | 44 | 4.1% |
| Total | 1,069 | 100.0% |
School Enrollment by Age by Funding Source in Wintersville
Out of a total of 1,069 students who are enrolled in schools in Wintersville, 215 (20.1%) attend a private institution, while the remaining 854 (79.9%) are enrolled in public schools. The age group of 25 to 34 year olds has the highest likelihood of being enrolled in private schools, with 33 (45.2% in the age bracket) enrolled. Conversely, the age group of 3 to 4 year olds has the lowest likelihood of being enrolled in a private school, with 65 (100.0% in the age bracket) attending a public institution.
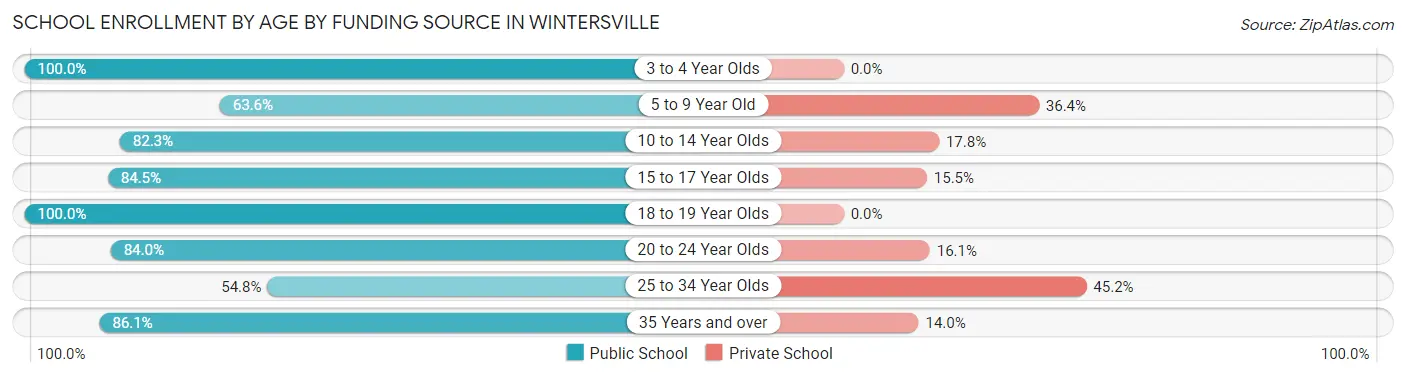
| Age Bracket | Public School | Private School |
| 3 to 4 Year Olds | 65 (100.0%) | 0 (0.0%) |
| 5 to 9 Year Old | 91 (63.6%) | 52 (36.4%) |
| 10 to 14 Year Olds | 329 (82.3%) | 71 (17.7%) |
| 15 to 17 Year Olds | 218 (84.5%) | 40 (15.5%) |
| 18 to 19 Year Olds | 6 (100.0%) | 0 (0.0%) |
| 20 to 24 Year Olds | 68 (84.0%) | 13 (16.1%) |
| 25 to 34 Year Olds | 40 (54.8%) | 33 (45.2%) |
| 35 Years and over | 37 (86.1%) | 6 (14.0%) |
| Total | 854 (79.9%) | 215 (20.1%) |
Educational Attainment by Field of Study in Wintersville
Arts & humanities (193 | 26.5%), science & technology (178 | 24.4%), education (122 | 16.8%), business (81 | 11.1%), and physical & health sciences (55 | 7.5%) are the most common fields of study among 728 individuals in Wintersville who have obtained a bachelor's degree or higher.
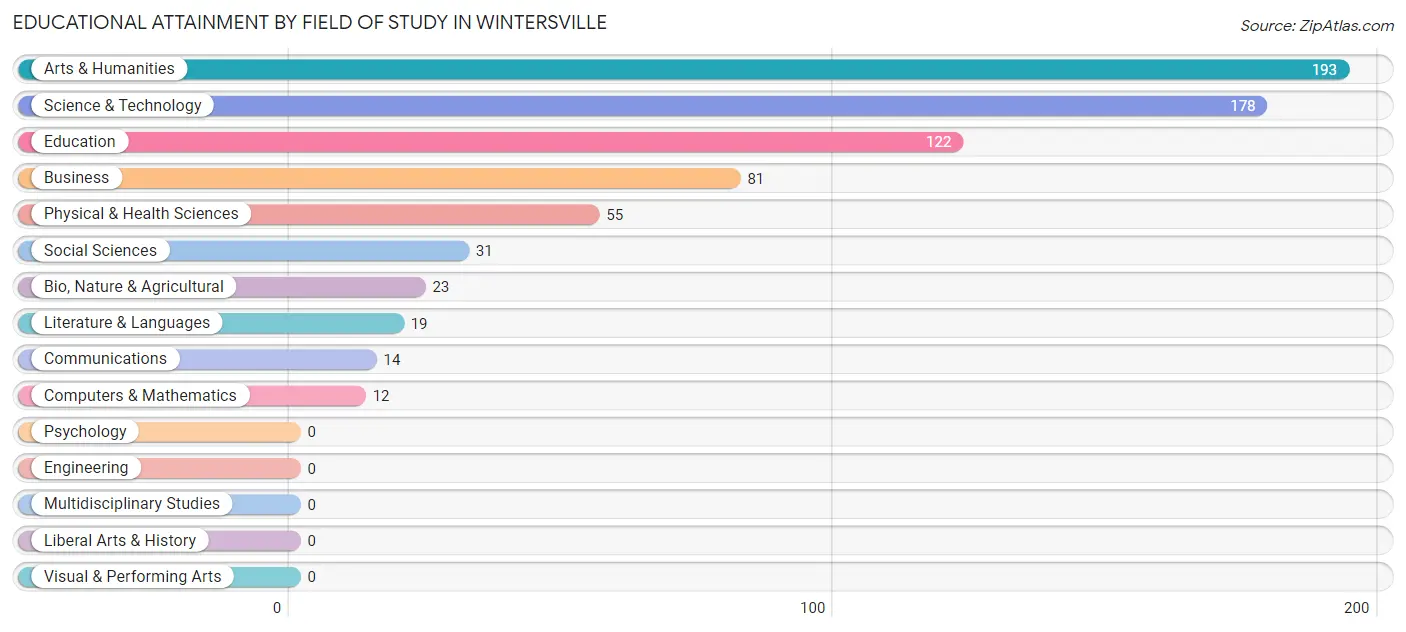
| Field of Study | # Graduates | % Graduates |
| Computers & Mathematics | 12 | 1.7% |
| Bio, Nature & Agricultural | 23 | 3.2% |
| Physical & Health Sciences | 55 | 7.5% |
| Psychology | 0 | 0.0% |
| Social Sciences | 31 | 4.3% |
| Engineering | 0 | 0.0% |
| Multidisciplinary Studies | 0 | 0.0% |
| Science & Technology | 178 | 24.4% |
| Business | 81 | 11.1% |
| Education | 122 | 16.8% |
| Literature & Languages | 19 | 2.6% |
| Liberal Arts & History | 0 | 0.0% |
| Visual & Performing Arts | 0 | 0.0% |
| Communications | 14 | 1.9% |
| Arts & Humanities | 193 | 26.5% |
| Total | 728 | 100.0% |
Transportation & Commute in Wintersville
Vehicle Availability by Sex in Wintersville
The most prevalent vehicle ownership categories in Wintersville are males with 2 vehicles (412, accounting for 42.3%) and females with 2 vehicles (225, making up 71.2%).
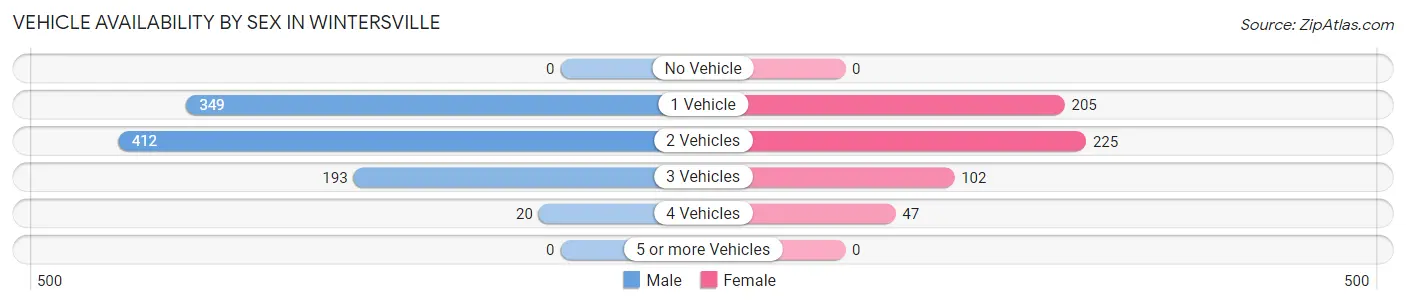
| Vehicles Available | Male | Female |
| No Vehicle | 0 (0.0%) | 0 (0.0%) |
| 1 Vehicle | 349 (35.8%) | 205 (35.4%) |
| 2 Vehicles | 412 (42.3%) | 225 (38.9%) |
| 3 Vehicles | 193 (19.8%) | 102 (17.6%) |
| 4 Vehicles | 20 (2.1%) | 47 (8.1%) |
| 5 or more Vehicles | 0 (0.0%) | 0 (0.0%) |
| Total | 974 (100.0%) | 579 (100.0%) |
Commute Time in Wintersville
The most frequently occuring commute durations in Wintersville are 10 to 14 minutes (310 commuters, 23.3%), 5 to 9 minutes (222 commuters, 16.7%), and 35 to 39 minutes (177 commuters, 13.3%).
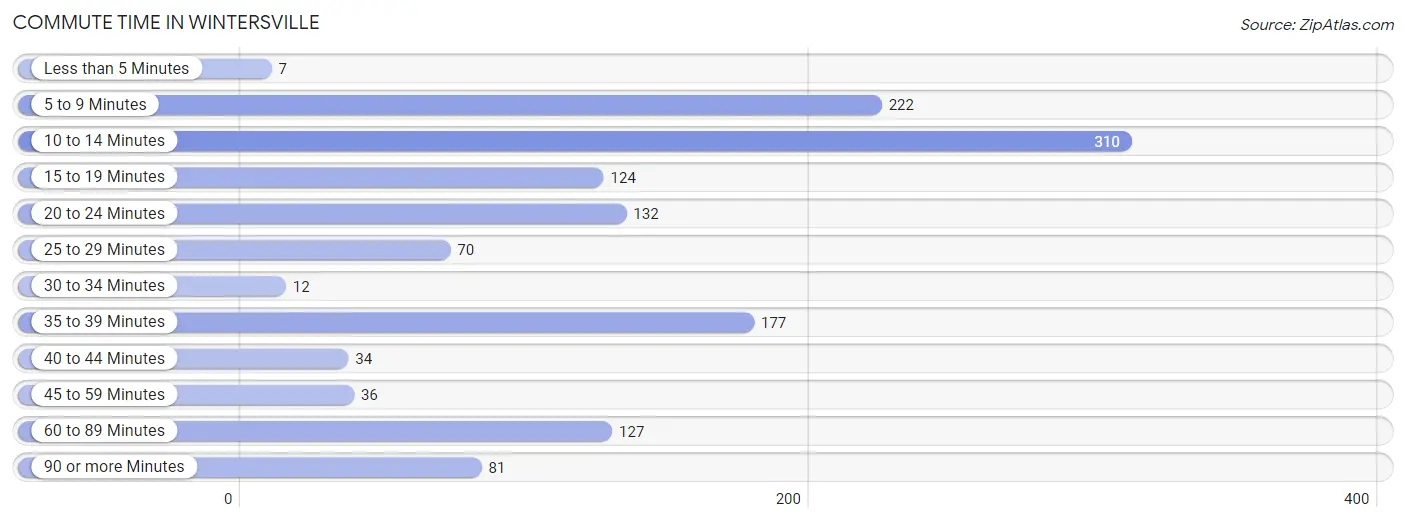
| Commute Time | # Commuters | % Commuters |
| Less than 5 Minutes | 7 | 0.5% |
| 5 to 9 Minutes | 222 | 16.7% |
| 10 to 14 Minutes | 310 | 23.3% |
| 15 to 19 Minutes | 124 | 9.3% |
| 20 to 24 Minutes | 132 | 9.9% |
| 25 to 29 Minutes | 70 | 5.3% |
| 30 to 34 Minutes | 12 | 0.9% |
| 35 to 39 Minutes | 177 | 13.3% |
| 40 to 44 Minutes | 34 | 2.5% |
| 45 to 59 Minutes | 36 | 2.7% |
| 60 to 89 Minutes | 127 | 9.5% |
| 90 or more Minutes | 81 | 6.1% |
Commute Time by Sex in Wintersville
The most common commute times in Wintersville are 5 to 9 minutes (204 commuters, 21.7%) for males and 10 to 14 minutes (150 commuters, 38.4%) for females.
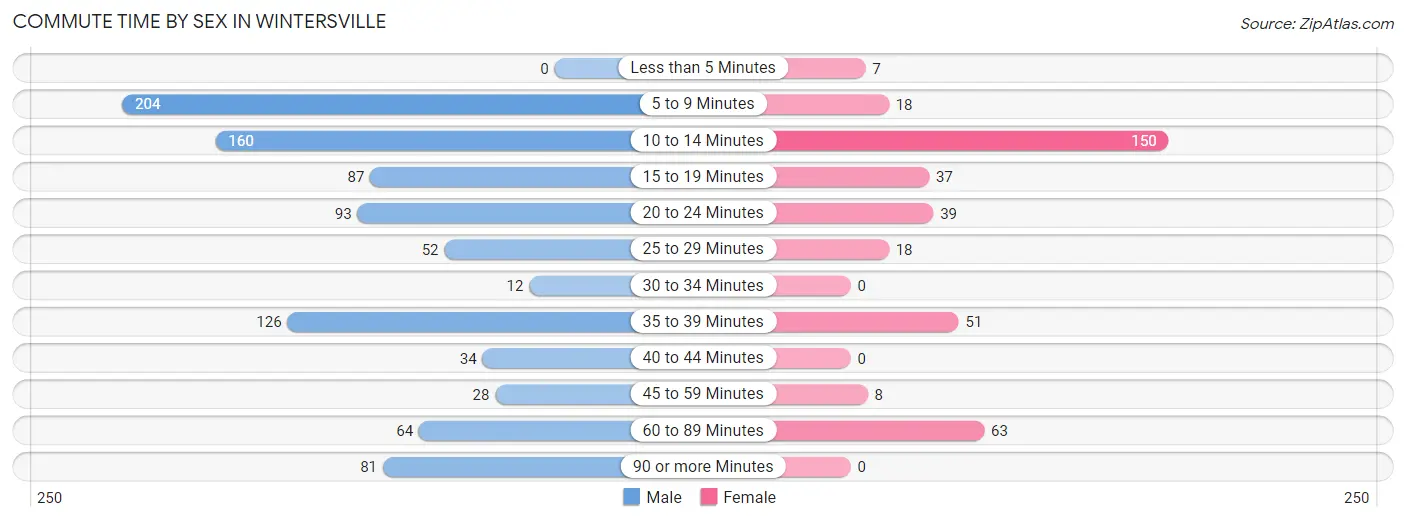
| Commute Time | Male | Female |
| Less than 5 Minutes | 0 (0.0%) | 7 (1.8%) |
| 5 to 9 Minutes | 204 (21.7%) | 18 (4.6%) |
| 10 to 14 Minutes | 160 (17.0%) | 150 (38.4%) |
| 15 to 19 Minutes | 87 (9.2%) | 37 (9.5%) |
| 20 to 24 Minutes | 93 (9.9%) | 39 (10.0%) |
| 25 to 29 Minutes | 52 (5.5%) | 18 (4.6%) |
| 30 to 34 Minutes | 12 (1.3%) | 0 (0.0%) |
| 35 to 39 Minutes | 126 (13.4%) | 51 (13.0%) |
| 40 to 44 Minutes | 34 (3.6%) | 0 (0.0%) |
| 45 to 59 Minutes | 28 (3.0%) | 8 (2.1%) |
| 60 to 89 Minutes | 64 (6.8%) | 63 (16.1%) |
| 90 or more Minutes | 81 (8.6%) | 0 (0.0%) |
Time of Departure to Work by Sex in Wintersville
The most frequent times of departure to work in Wintersville are 7:30 AM to 7:59 AM (198, 21.0%) for males and 12:00 PM to 3:59 PM (107, 27.4%) for females.
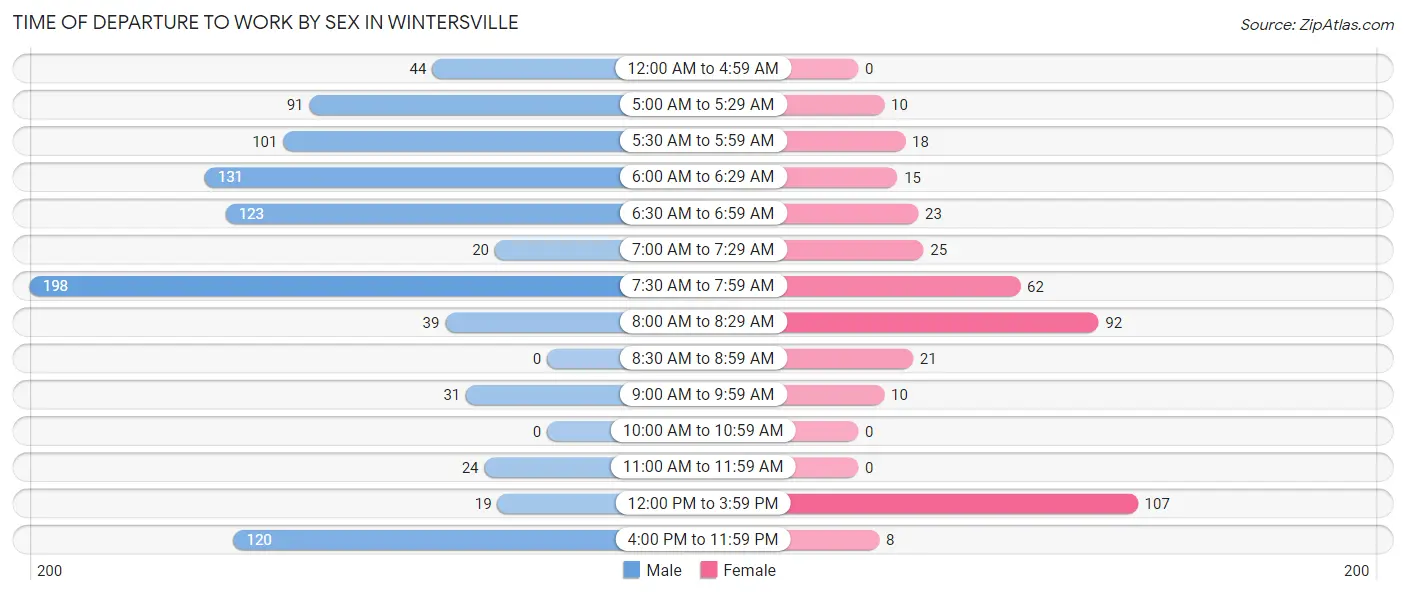
| Time of Departure | Male | Female |
| 12:00 AM to 4:59 AM | 44 (4.7%) | 0 (0.0%) |
| 5:00 AM to 5:29 AM | 91 (9.7%) | 10 (2.6%) |
| 5:30 AM to 5:59 AM | 101 (10.7%) | 18 (4.6%) |
| 6:00 AM to 6:29 AM | 131 (13.9%) | 15 (3.8%) |
| 6:30 AM to 6:59 AM | 123 (13.1%) | 23 (5.9%) |
| 7:00 AM to 7:29 AM | 20 (2.1%) | 25 (6.4%) |
| 7:30 AM to 7:59 AM | 198 (21.0%) | 62 (15.9%) |
| 8:00 AM to 8:29 AM | 39 (4.1%) | 92 (23.5%) |
| 8:30 AM to 8:59 AM | 0 (0.0%) | 21 (5.4%) |
| 9:00 AM to 9:59 AM | 31 (3.3%) | 10 (2.6%) |
| 10:00 AM to 10:59 AM | 0 (0.0%) | 0 (0.0%) |
| 11:00 AM to 11:59 AM | 24 (2.5%) | 0 (0.0%) |
| 12:00 PM to 3:59 PM | 19 (2.0%) | 107 (27.4%) |
| 4:00 PM to 11:59 PM | 120 (12.8%) | 8 (2.1%) |
| Total | 941 (100.0%) | 391 (100.0%) |
Housing Occupancy in Wintersville
Occupancy by Ownership in Wintersville
Of the total 1,688 dwellings in Wintersville, owner-occupied units account for 956 (56.6%), while renter-occupied units make up 732 (43.4%).
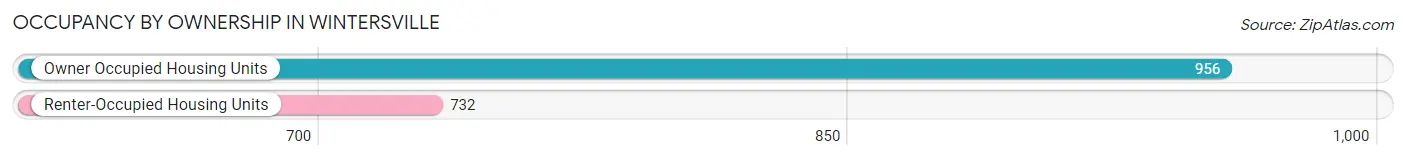
| Occupancy | # Housing Units | % Housing Units |
| Owner Occupied Housing Units | 956 | 56.6% |
| Renter-Occupied Housing Units | 732 | 43.4% |
| Total Occupied Housing Units | 1,688 | 100.0% |
Occupancy by Household Size in Wintersville
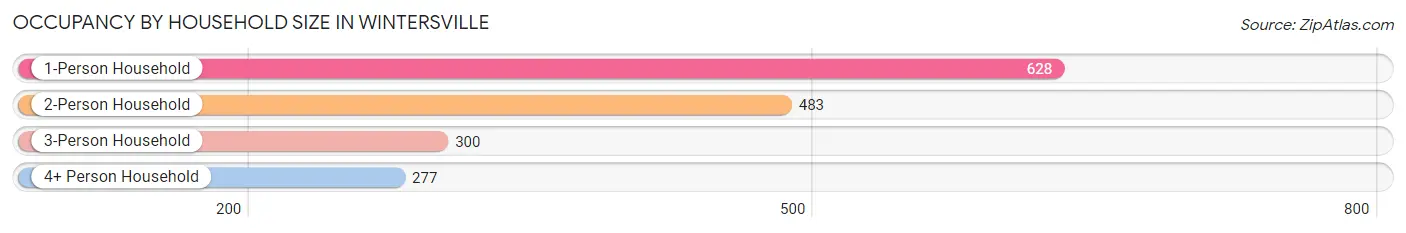
| Household Size | # Housing Units | % Housing Units |
| 1-Person Household | 628 | 37.2% |
| 2-Person Household | 483 | 28.6% |
| 3-Person Household | 300 | 17.8% |
| 4+ Person Household | 277 | 16.4% |
| Total Housing Units | 1,688 | 100.0% |
Occupancy by Ownership by Household Size in Wintersville
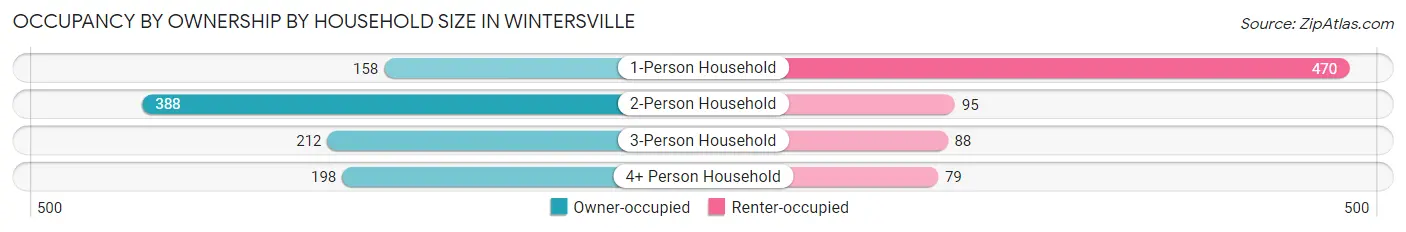
| Household Size | Owner-occupied | Renter-occupied |
| 1-Person Household | 158 (25.2%) | 470 (74.8%) |
| 2-Person Household | 388 (80.3%) | 95 (19.7%) |
| 3-Person Household | 212 (70.7%) | 88 (29.3%) |
| 4+ Person Household | 198 (71.5%) | 79 (28.5%) |
| Total Housing Units | 956 (56.6%) | 732 (43.4%) |
Occupancy by Educational Attainment in Wintersville
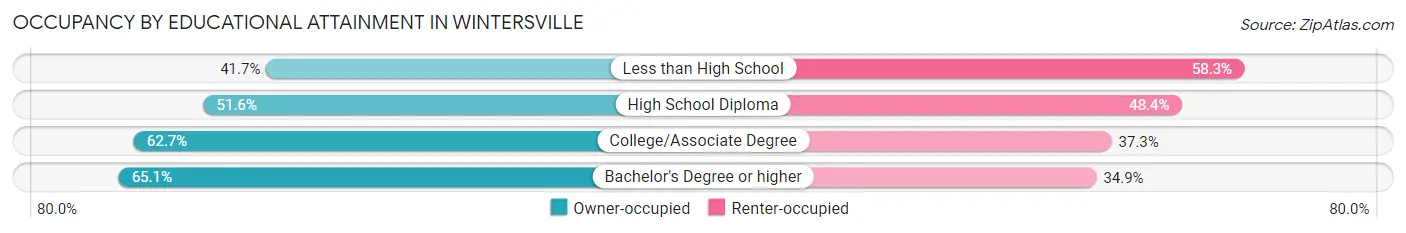
| Household Size | Owner-occupied | Renter-occupied |
| Less than High School | 60 (41.7%) | 84 (58.3%) |
| High School Diploma | 387 (51.6%) | 363 (48.4%) |
| College/Associate Degree | 198 (62.7%) | 118 (37.3%) |
| Bachelor's Degree or higher | 311 (65.1%) | 167 (34.9%) |
Occupancy by Age of Householder in Wintersville
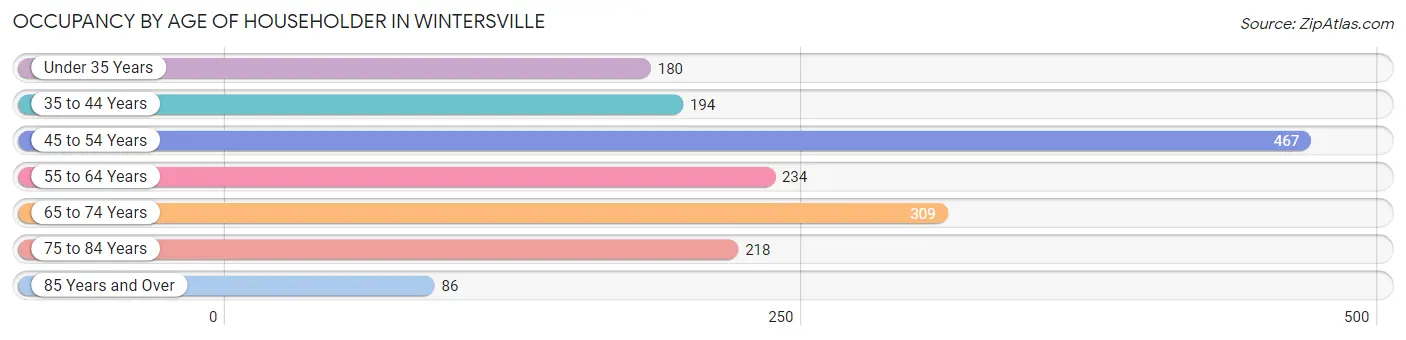
| Age Bracket | # Households | % Households |
| Under 35 Years | 180 | 10.7% |
| 35 to 44 Years | 194 | 11.5% |
| 45 to 54 Years | 467 | 27.7% |
| 55 to 64 Years | 234 | 13.9% |
| 65 to 74 Years | 309 | 18.3% |
| 75 to 84 Years | 218 | 12.9% |
| 85 Years and Over | 86 | 5.1% |
| Total | 1,688 | 100.0% |
Housing Finances in Wintersville
Median Income by Occupancy in Wintersville
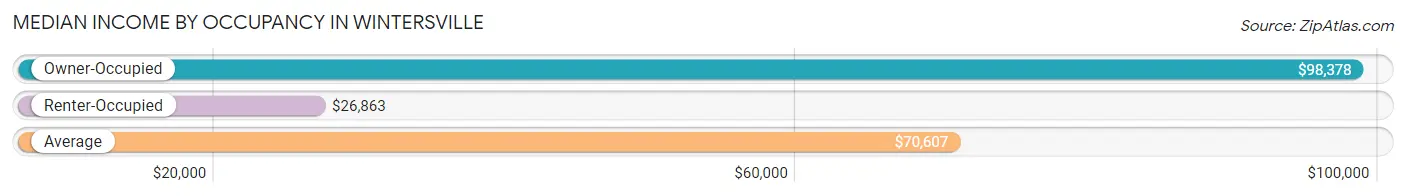
| Occupancy Type | # Households | Median Income |
| Owner-Occupied | 956 (56.6%) | $98,378 |
| Renter-Occupied | 732 (43.4%) | $26,863 |
| Average | 1,688 (100.0%) | $70,607 |
Occupancy by Householder Income Bracket in Wintersville
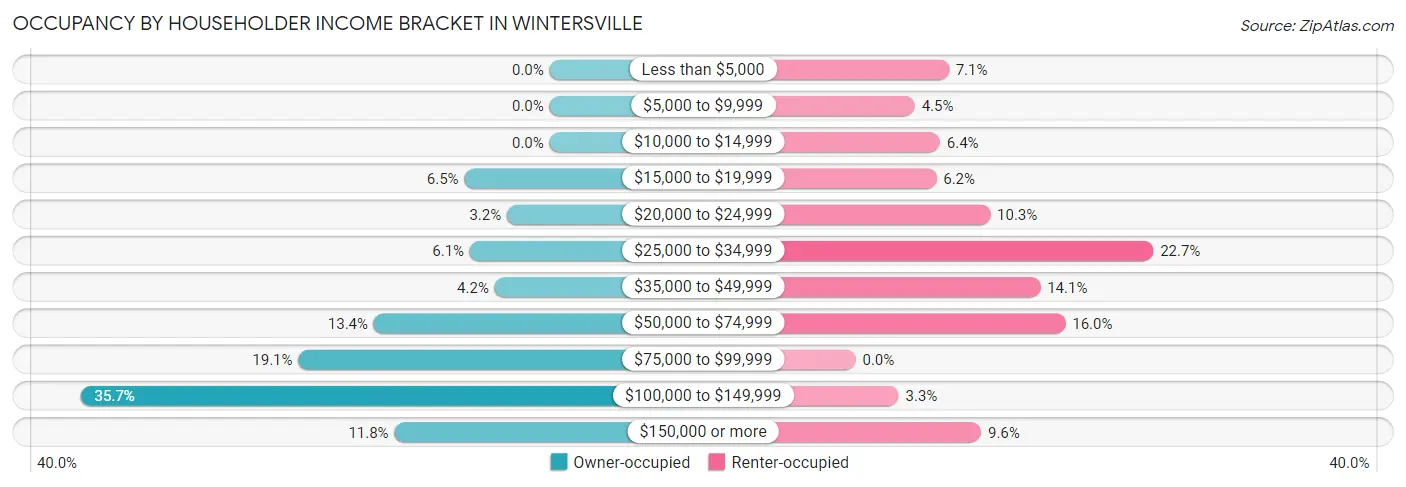
| Income Bracket | Owner-occupied | Renter-occupied |
| Less than $5,000 | 0 (0.0%) | 52 (7.1%) |
| $5,000 to $9,999 | 0 (0.0%) | 33 (4.5%) |
| $10,000 to $14,999 | 0 (0.0%) | 47 (6.4%) |
| $15,000 to $19,999 | 62 (6.5%) | 45 (6.1%) |
| $20,000 to $24,999 | 31 (3.2%) | 75 (10.2%) |
| $25,000 to $34,999 | 58 (6.1%) | 166 (22.7%) |
| $35,000 to $49,999 | 40 (4.2%) | 103 (14.1%) |
| $50,000 to $74,999 | 128 (13.4%) | 117 (16.0%) |
| $75,000 to $99,999 | 183 (19.1%) | 0 (0.0%) |
| $100,000 to $149,999 | 341 (35.7%) | 24 (3.3%) |
| $150,000 or more | 113 (11.8%) | 70 (9.6%) |
| Total | 956 (100.0%) | 732 (100.0%) |
Monthly Housing Cost Tiers in Wintersville
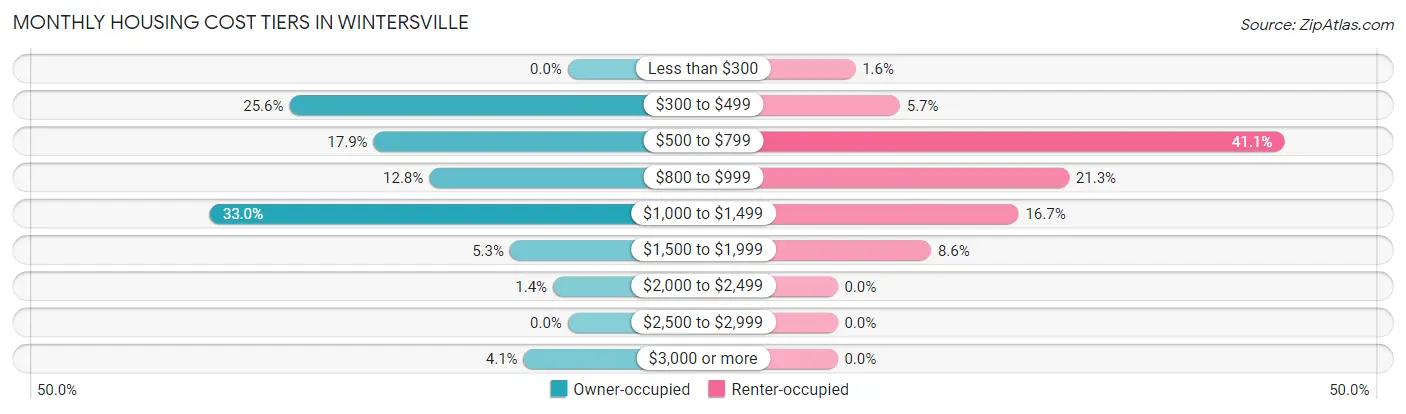
| Monthly Cost | Owner-occupied | Renter-occupied |
| Less than $300 | 0 (0.0%) | 12 (1.6%) |
| $300 to $499 | 245 (25.6%) | 42 (5.7%) |
| $500 to $799 | 171 (17.9%) | 301 (41.1%) |
| $800 to $999 | 122 (12.8%) | 156 (21.3%) |
| $1,000 to $1,499 | 315 (33.0%) | 122 (16.7%) |
| $1,500 to $1,999 | 51 (5.3%) | 63 (8.6%) |
| $2,000 to $2,499 | 13 (1.4%) | 0 (0.0%) |
| $2,500 to $2,999 | 0 (0.0%) | 0 (0.0%) |
| $3,000 or more | 39 (4.1%) | 0 (0.0%) |
| Total | 956 (100.0%) | 732 (100.0%) |
Physical Housing Characteristics in Wintersville
Housing Structures in Wintersville
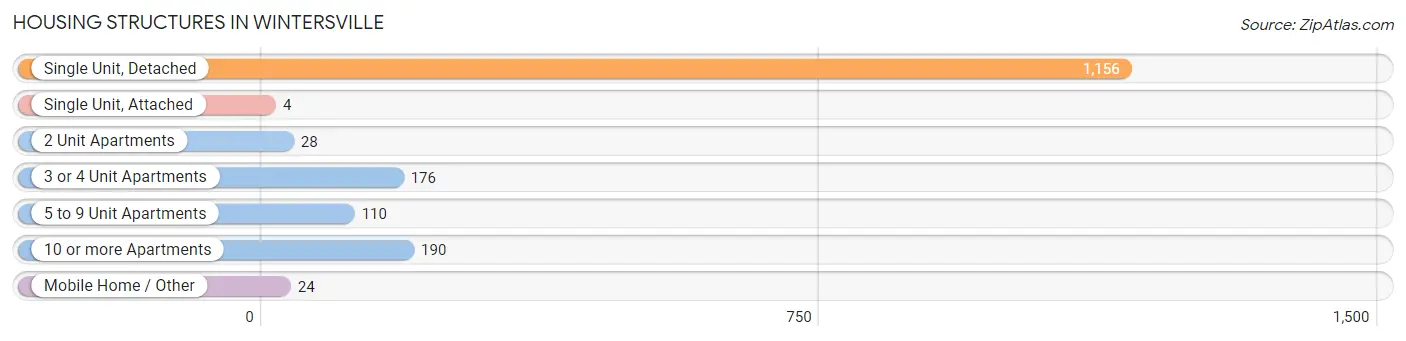
| Structure Type | # Housing Units | % Housing Units |
| Single Unit, Detached | 1,156 | 68.5% |
| Single Unit, Attached | 4 | 0.2% |
| 2 Unit Apartments | 28 | 1.7% |
| 3 or 4 Unit Apartments | 176 | 10.4% |
| 5 to 9 Unit Apartments | 110 | 6.5% |
| 10 or more Apartments | 190 | 11.3% |
| Mobile Home / Other | 24 | 1.4% |
| Total | 1,688 | 100.0% |
Housing Structures by Occupancy in Wintersville
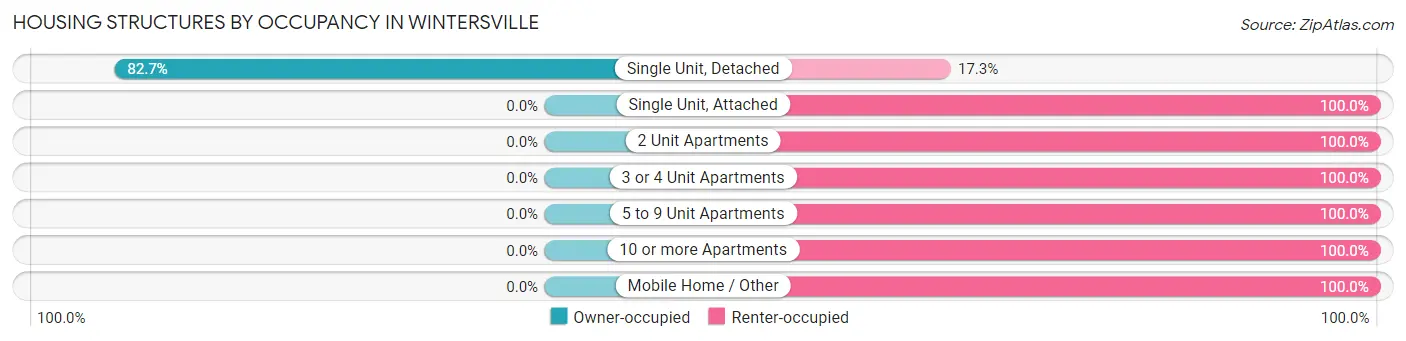
| Structure Type | Owner-occupied | Renter-occupied |
| Single Unit, Detached | 956 (82.7%) | 200 (17.3%) |
| Single Unit, Attached | 0 (0.0%) | 4 (100.0%) |
| 2 Unit Apartments | 0 (0.0%) | 28 (100.0%) |
| 3 or 4 Unit Apartments | 0 (0.0%) | 176 (100.0%) |
| 5 to 9 Unit Apartments | 0 (0.0%) | 110 (100.0%) |
| 10 or more Apartments | 0 (0.0%) | 190 (100.0%) |
| Mobile Home / Other | 0 (0.0%) | 24 (100.0%) |
| Total | 956 (56.6%) | 732 (43.4%) |
Housing Structures by Number of Rooms in Wintersville
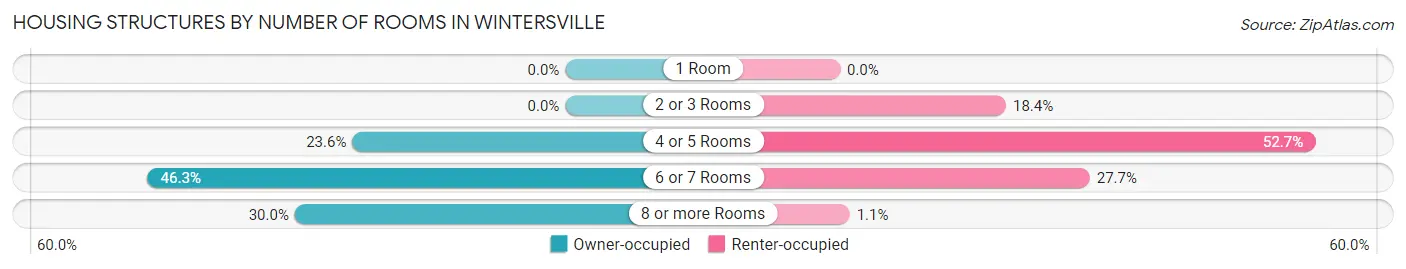
| Number of Rooms | Owner-occupied | Renter-occupied |
| 1 Room | 0 (0.0%) | 0 (0.0%) |
| 2 or 3 Rooms | 0 (0.0%) | 135 (18.4%) |
| 4 or 5 Rooms | 226 (23.6%) | 386 (52.7%) |
| 6 or 7 Rooms | 443 (46.3%) | 203 (27.7%) |
| 8 or more Rooms | 287 (30.0%) | 8 (1.1%) |
| Total | 956 (100.0%) | 732 (100.0%) |
Housing Structure by Heating Type in Wintersville
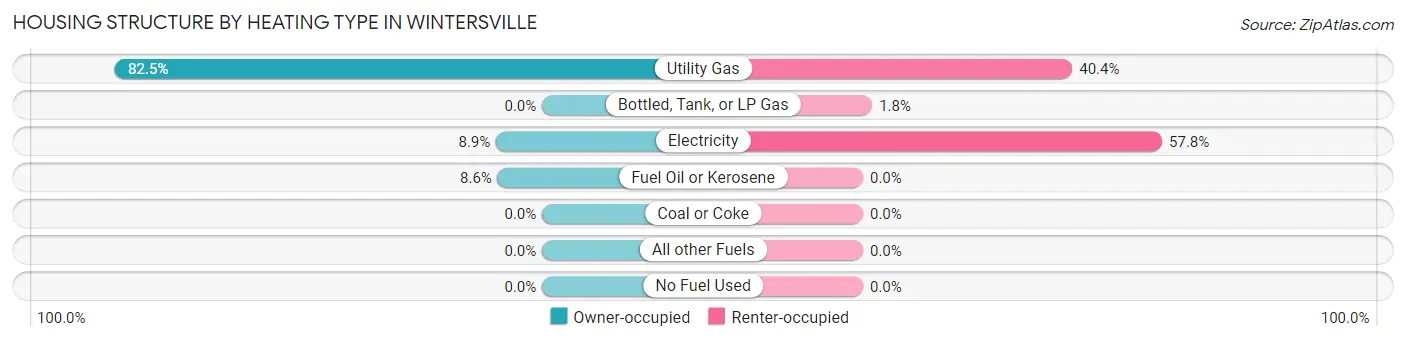
| Heating Type | Owner-occupied | Renter-occupied |
| Utility Gas | 789 (82.5%) | 296 (40.4%) |
| Bottled, Tank, or LP Gas | 0 (0.0%) | 13 (1.8%) |
| Electricity | 85 (8.9%) | 423 (57.8%) |
| Fuel Oil or Kerosene | 82 (8.6%) | 0 (0.0%) |
| Coal or Coke | 0 (0.0%) | 0 (0.0%) |
| All other Fuels | 0 (0.0%) | 0 (0.0%) |
| No Fuel Used | 0 (0.0%) | 0 (0.0%) |
| Total | 956 (100.0%) | 732 (100.0%) |
Household Vehicle Usage in Wintersville
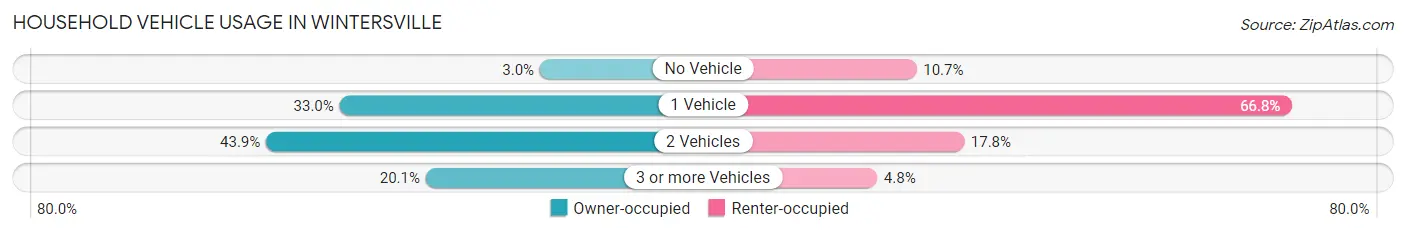
| Vehicles per Household | Owner-occupied | Renter-occupied |
| No Vehicle | 29 (3.0%) | 78 (10.7%) |
| 1 Vehicle | 315 (33.0%) | 489 (66.8%) |
| 2 Vehicles | 420 (43.9%) | 130 (17.8%) |
| 3 or more Vehicles | 192 (20.1%) | 35 (4.8%) |
| Total | 956 (100.0%) | 732 (100.0%) |
Real Estate & Mortgages in Wintersville
Real Estate and Mortgage Overview in Wintersville
| Characteristic | Without Mortgage | With Mortgage |
| Housing Units | 359 | 597 |
| Median Property Value | $129,900 | $99,100 |
| Median Household Income | $112,786 | $85 |
| Monthly Housing Costs | $458 | $39 |
| Real Estate Taxes | $1,793 | $0 |
Property Value by Mortgage Status in Wintersville
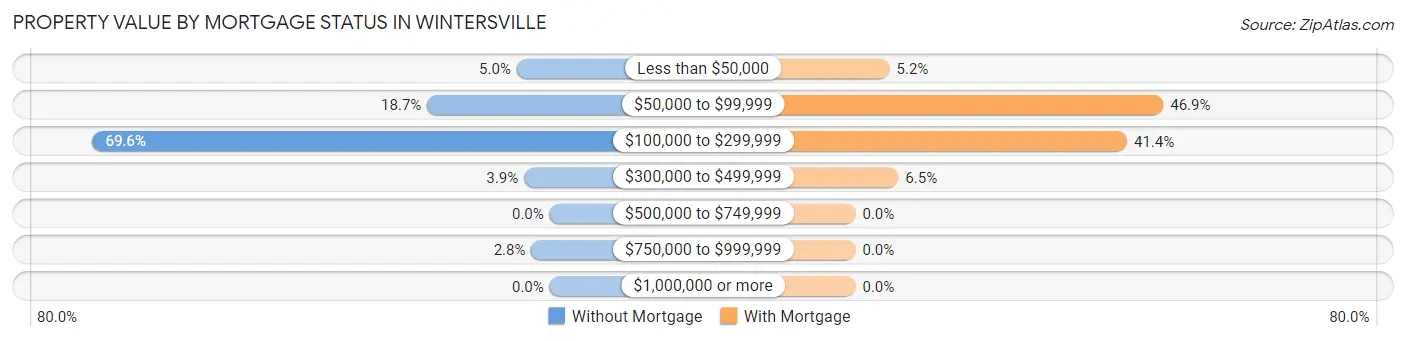
| Property Value | Without Mortgage | With Mortgage |
| Less than $50,000 | 18 (5.0%) | 31 (5.2%) |
| $50,000 to $99,999 | 67 (18.7%) | 280 (46.9%) |
| $100,000 to $299,999 | 250 (69.6%) | 247 (41.4%) |
| $300,000 to $499,999 | 14 (3.9%) | 39 (6.5%) |
| $500,000 to $749,999 | 0 (0.0%) | 0 (0.0%) |
| $750,000 to $999,999 | 10 (2.8%) | 0 (0.0%) |
| $1,000,000 or more | 0 (0.0%) | 0 (0.0%) |
| Total | 359 (100.0%) | 597 (100.0%) |
Household Income by Mortgage Status in Wintersville
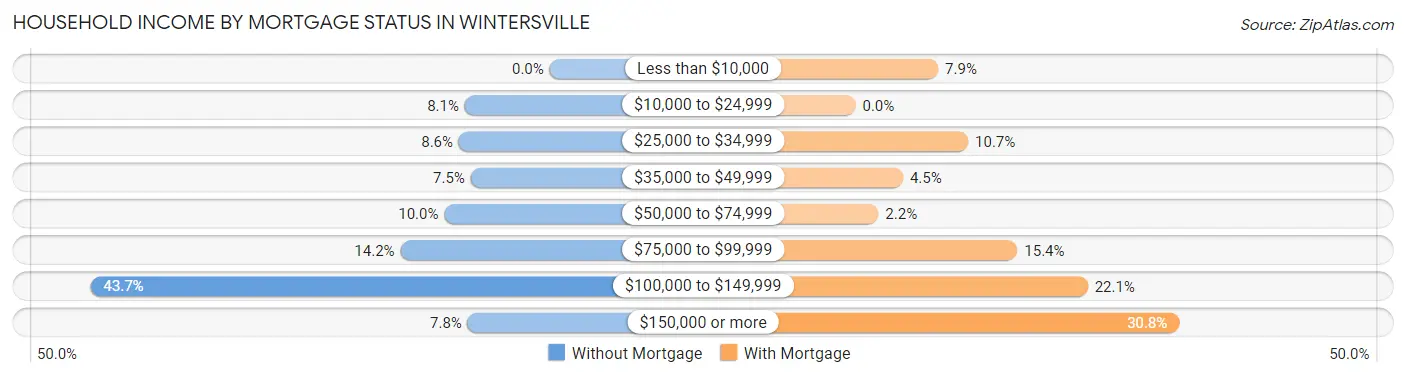
| Household Income | Without Mortgage | With Mortgage |
| Less than $10,000 | 0 (0.0%) | 47 (7.9%) |
| $10,000 to $24,999 | 29 (8.1%) | 0 (0.0%) |
| $25,000 to $34,999 | 31 (8.6%) | 64 (10.7%) |
| $35,000 to $49,999 | 27 (7.5%) | 27 (4.5%) |
| $50,000 to $74,999 | 36 (10.0%) | 13 (2.2%) |
| $75,000 to $99,999 | 51 (14.2%) | 92 (15.4%) |
| $100,000 to $149,999 | 157 (43.7%) | 132 (22.1%) |
| $150,000 or more | 28 (7.8%) | 184 (30.8%) |
| Total | 359 (100.0%) | 597 (100.0%) |
Property Value to Household Income Ratio in Wintersville
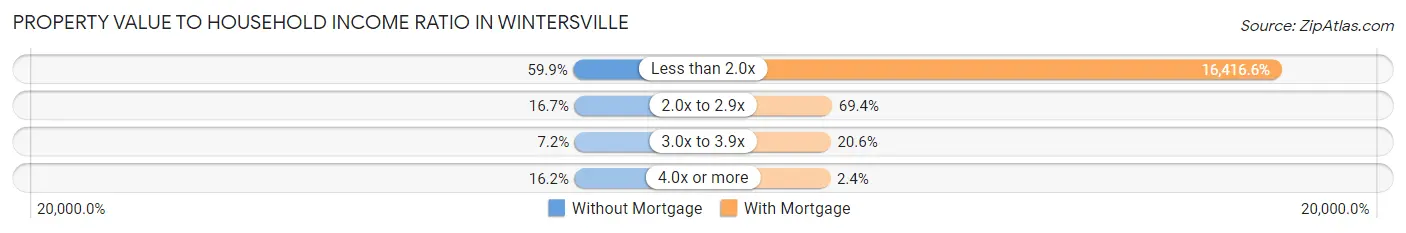
| Value-to-Income Ratio | Without Mortgage | With Mortgage |
| Less than 2.0x | 215 (59.9%) | 98,007 (16,416.6%) |
| 2.0x to 2.9x | 60 (16.7%) | 414 (69.4%) |
| 3.0x to 3.9x | 26 (7.2%) | 123 (20.6%) |
| 4.0x or more | 58 (16.2%) | 14 (2.4%) |
| Total | 359 (100.0%) | 597 (100.0%) |
Real Estate Taxes by Mortgage Status in Wintersville
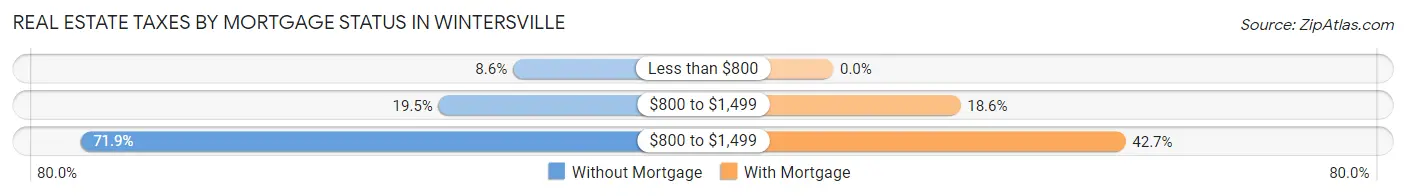
| Property Taxes | Without Mortgage | With Mortgage |
| Less than $800 | 31 (8.6%) | 0 (0.0%) |
| $800 to $1,499 | 70 (19.5%) | 111 (18.6%) |
| $800 to $1,499 | 258 (71.9%) | 255 (42.7%) |
| Total | 359 (100.0%) | 597 (100.0%) |
Health & Disability in Wintersville
Health Insurance Coverage by Age in Wintersville
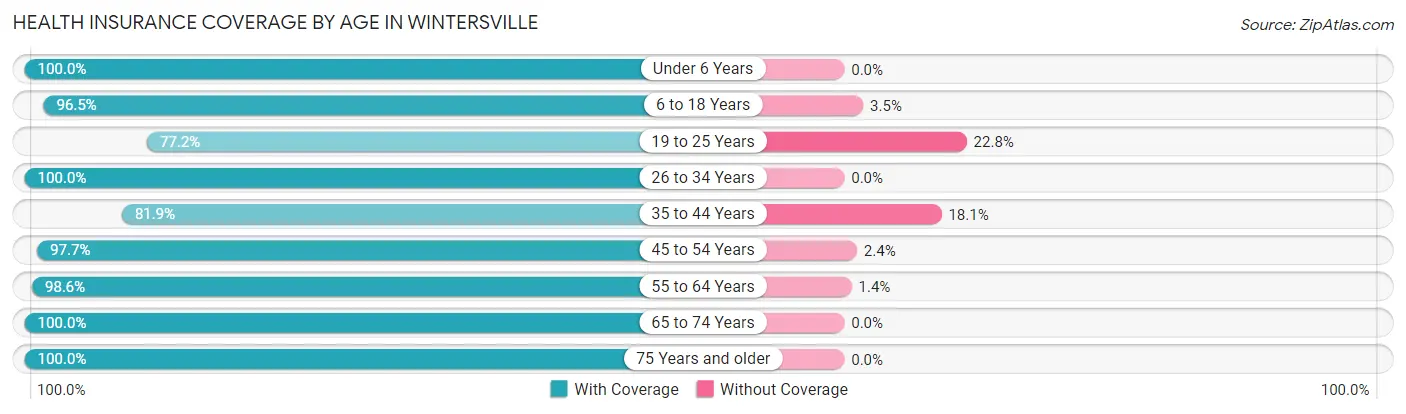
| Age Bracket | With Coverage | Without Coverage |
| Under 6 Years | 188 (100.0%) | 0 (0.0%) |
| 6 to 18 Years | 740 (96.5%) | 27 (3.5%) |
| 19 to 25 Years | 230 (77.2%) | 68 (22.8%) |
| 26 to 34 Years | 333 (100.0%) | 0 (0.0%) |
| 35 to 44 Years | 235 (81.9%) | 52 (18.1%) |
| 45 to 54 Years | 664 (97.7%) | 16 (2.4%) |
| 55 to 64 Years | 508 (98.6%) | 7 (1.4%) |
| 65 to 74 Years | 440 (100.0%) | 0 (0.0%) |
| 75 Years and older | 389 (100.0%) | 0 (0.0%) |
| Total | 3,727 (95.6%) | 170 (4.4%) |
Health Insurance Coverage by Citizenship Status in Wintersville
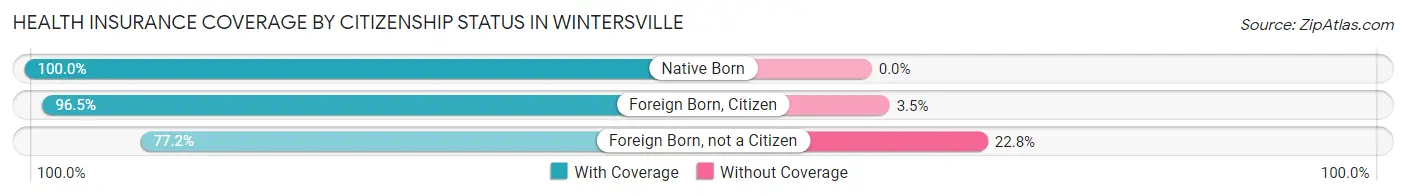
| Citizenship Status | With Coverage | Without Coverage |
| Native Born | 188 (100.0%) | 0 (0.0%) |
| Foreign Born, Citizen | 740 (96.5%) | 27 (3.5%) |
| Foreign Born, not a Citizen | 230 (77.2%) | 68 (22.8%) |
Health Insurance Coverage by Household Income in Wintersville
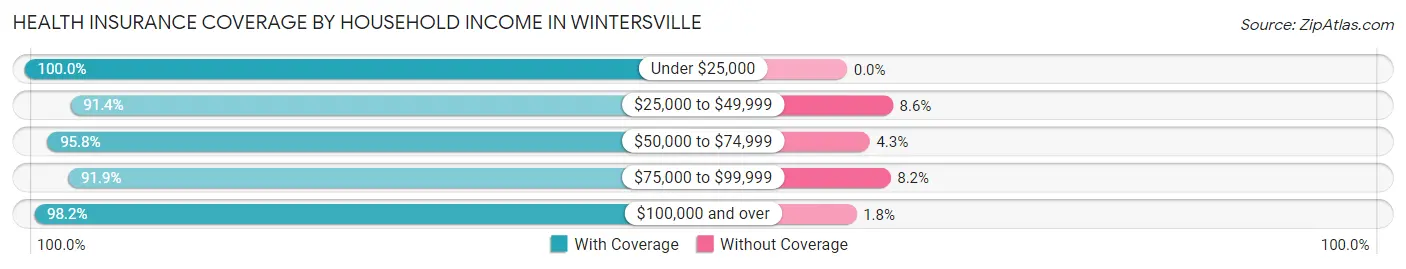
| Household Income | With Coverage | Without Coverage |
| Under $25,000 | 478 (100.0%) | 0 (0.0%) |
| $25,000 to $49,999 | 671 (91.4%) | 63 (8.6%) |
| $50,000 to $74,999 | 609 (95.8%) | 27 (4.3%) |
| $75,000 to $99,999 | 631 (91.8%) | 56 (8.2%) |
| $100,000 and over | 1,335 (98.2%) | 24 (1.8%) |
Public vs Private Health Insurance Coverage by Age in Wintersville
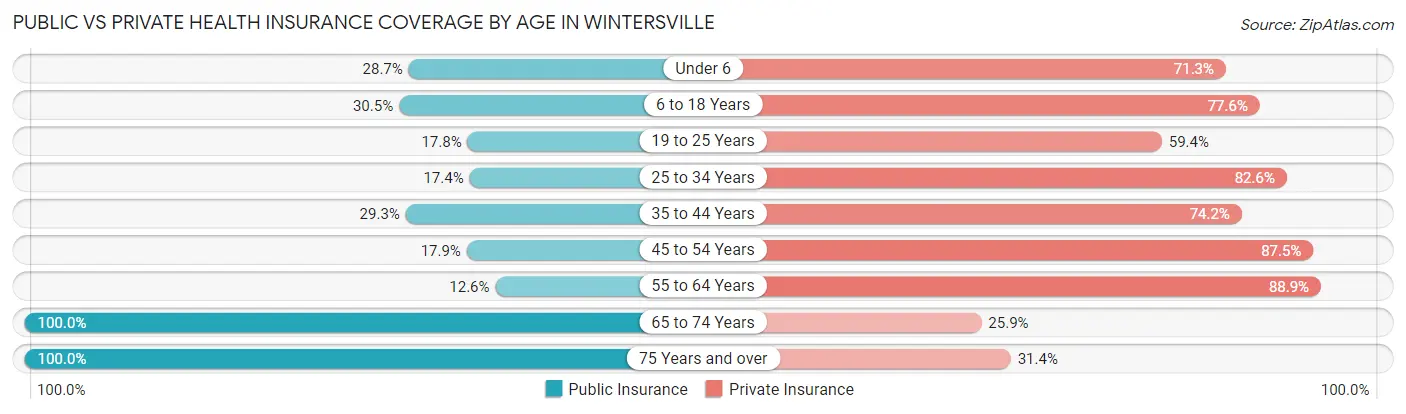
| Age Bracket | Public Insurance | Private Insurance |
| Under 6 | 54 (28.7%) | 134 (71.3%) |
| 6 to 18 Years | 234 (30.5%) | 595 (77.6%) |
| 19 to 25 Years | 53 (17.8%) | 177 (59.4%) |
| 25 to 34 Years | 58 (17.4%) | 275 (82.6%) |
| 35 to 44 Years | 84 (29.3%) | 213 (74.2%) |
| 45 to 54 Years | 122 (17.9%) | 595 (87.5%) |
| 55 to 64 Years | 65 (12.6%) | 458 (88.9%) |
| 65 to 74 Years | 440 (100.0%) | 114 (25.9%) |
| 75 Years and over | 389 (100.0%) | 122 (31.4%) |
| Total | 1,499 (38.5%) | 2,683 (68.9%) |
Disability Status by Sex by Age in Wintersville
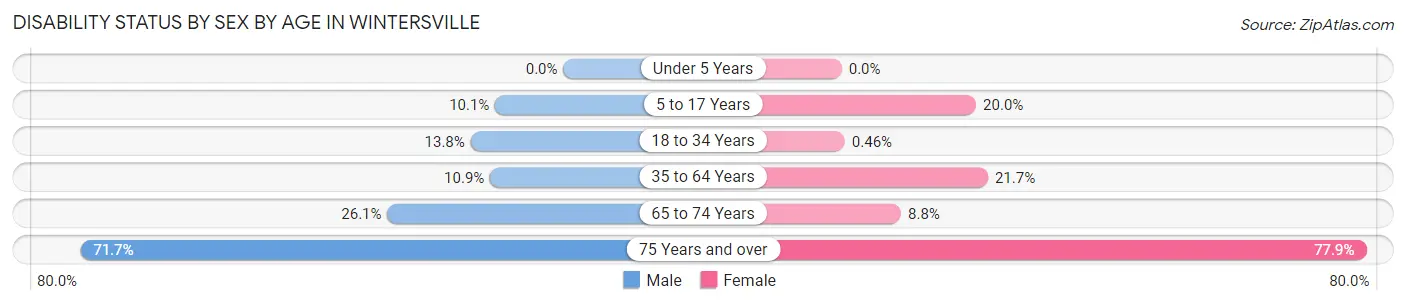
| Age Bracket | Male | Female |
| Under 5 Years | 0 (0.0%) | 0 (0.0%) |
| 5 to 17 Years | 43 (10.1%) | 75 (20.0%) |
| 18 to 34 Years | 57 (13.8%) | 1 (0.5%) |
| 35 to 64 Years | 85 (10.9%) | 152 (21.7%) |
| 65 to 74 Years | 29 (26.1%) | 29 (8.8%) |
| 75 Years and over | 104 (71.7%) | 190 (77.9%) |
Disability Class by Sex by Age in Wintersville
Disability Class: Hearing Difficulty
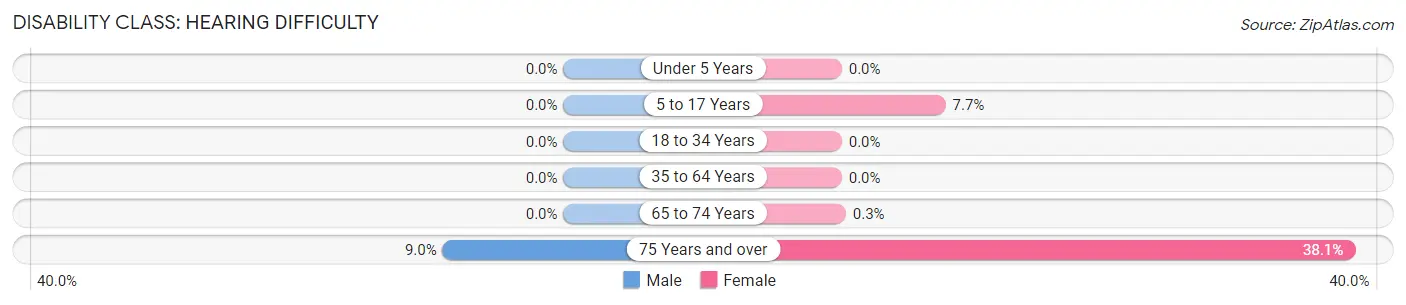
| Age Bracket | Male | Female |
| Under 5 Years | 0 (0.0%) | 0 (0.0%) |
| 5 to 17 Years | 0 (0.0%) | 29 (7.7%) |
| 18 to 34 Years | 0 (0.0%) | 0 (0.0%) |
| 35 to 64 Years | 0 (0.0%) | 0 (0.0%) |
| 65 to 74 Years | 0 (0.0%) | 1 (0.3%) |
| 75 Years and over | 13 (9.0%) | 93 (38.1%) |
Disability Class: Vision Difficulty
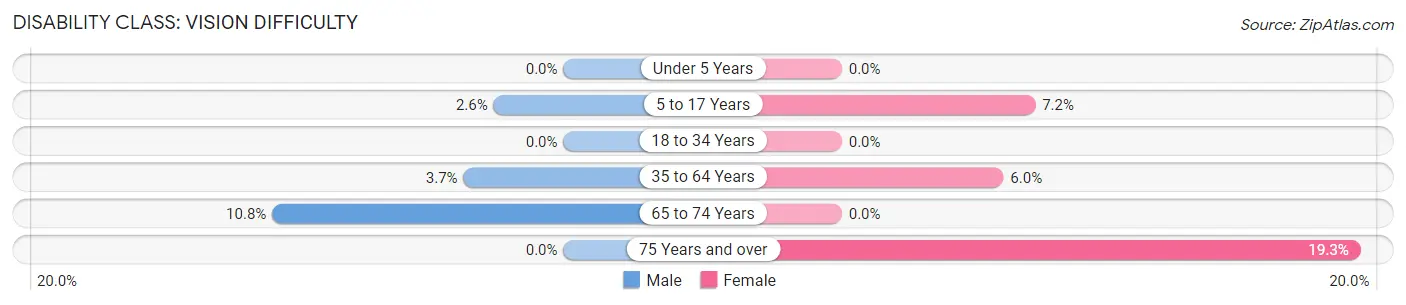
| Age Bracket | Male | Female |
| Under 5 Years | 0 (0.0%) | 0 (0.0%) |
| 5 to 17 Years | 11 (2.6%) | 27 (7.2%) |
| 18 to 34 Years | 0 (0.0%) | 0 (0.0%) |
| 35 to 64 Years | 29 (3.7%) | 42 (6.0%) |
| 65 to 74 Years | 12 (10.8%) | 0 (0.0%) |
| 75 Years and over | 0 (0.0%) | 47 (19.3%) |
Disability Class: Cognitive Difficulty
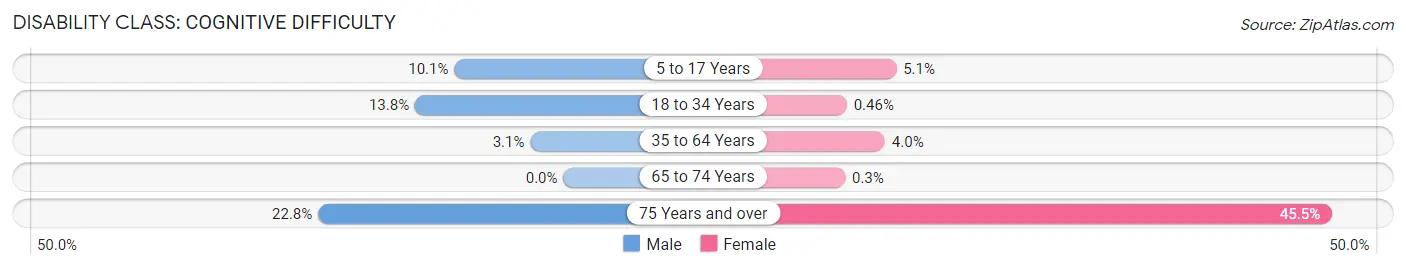
| Age Bracket | Male | Female |
| 5 to 17 Years | 43 (10.1%) | 19 (5.1%) |
| 18 to 34 Years | 57 (13.8%) | 1 (0.5%) |
| 35 to 64 Years | 24 (3.1%) | 28 (4.0%) |
| 65 to 74 Years | 0 (0.0%) | 1 (0.3%) |
| 75 Years and over | 33 (22.8%) | 111 (45.5%) |
Disability Class: Ambulatory Difficulty
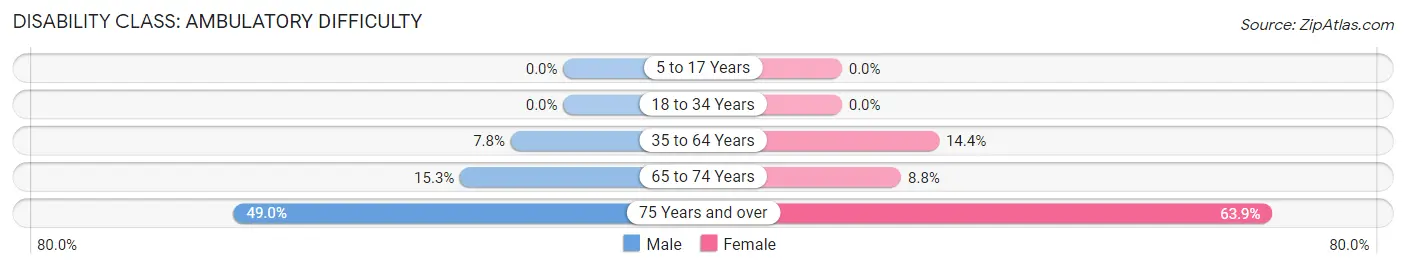
| Age Bracket | Male | Female |
| 5 to 17 Years | 0 (0.0%) | 0 (0.0%) |
| 18 to 34 Years | 0 (0.0%) | 0 (0.0%) |
| 35 to 64 Years | 61 (7.8%) | 101 (14.4%) |
| 65 to 74 Years | 17 (15.3%) | 29 (8.8%) |
| 75 Years and over | 71 (49.0%) | 156 (63.9%) |
Disability Class: Self-Care Difficulty
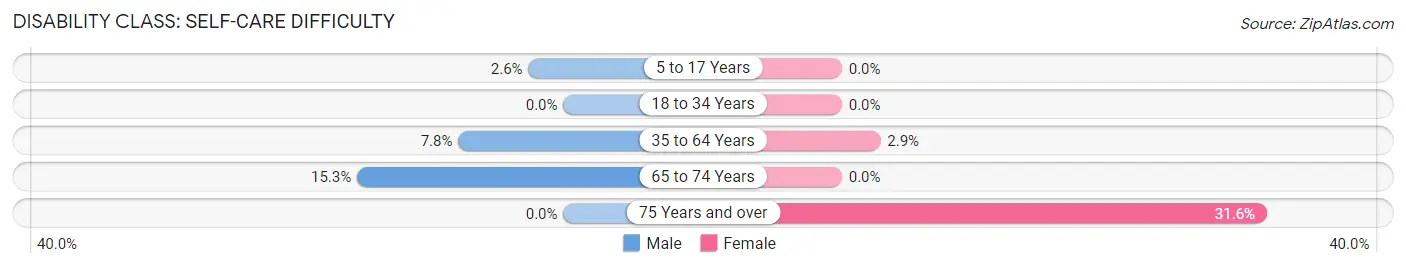
| Age Bracket | Male | Female |
| 5 to 17 Years | 11 (2.6%) | 0 (0.0%) |
| 18 to 34 Years | 0 (0.0%) | 0 (0.0%) |
| 35 to 64 Years | 61 (7.8%) | 20 (2.9%) |
| 65 to 74 Years | 17 (15.3%) | 0 (0.0%) |
| 75 Years and over | 0 (0.0%) | 77 (31.6%) |
Technology Access in Wintersville
Computing Device Access in Wintersville
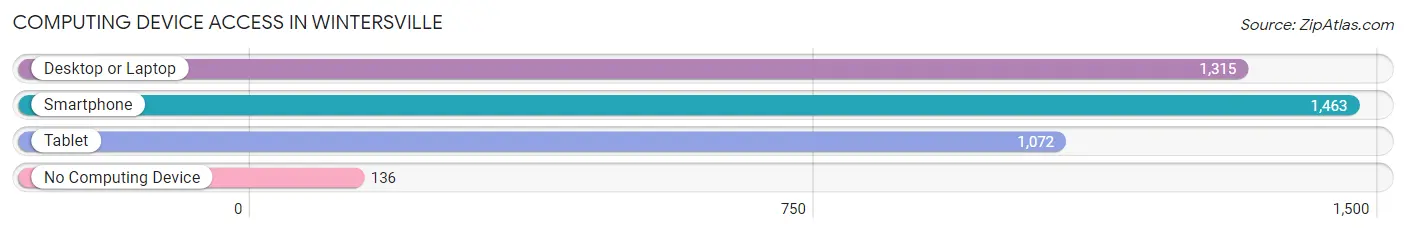
| Device Type | # Households | % Households |
| Desktop or Laptop | 1,315 | 77.9% |
| Smartphone | 1,463 | 86.7% |
| Tablet | 1,072 | 63.5% |
| No Computing Device | 136 | 8.1% |
| Total | 1,688 | 100.0% |
Internet Access in Wintersville
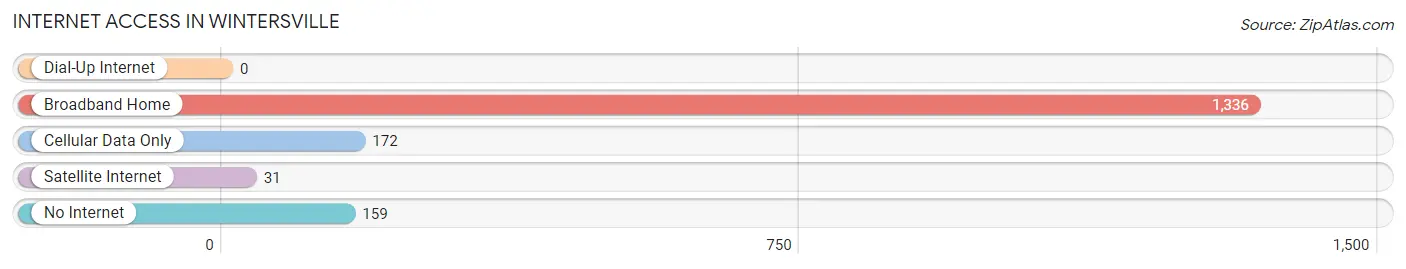
| Internet Type | # Households | % Households |
| Dial-Up Internet | 0 | 0.0% |
| Broadband Home | 1,336 | 79.1% |
| Cellular Data Only | 172 | 10.2% |
| Satellite Internet | 31 | 1.8% |
| No Internet | 159 | 9.4% |
| Total | 1,688 | 100.0% |
Wintersville Summary
Wintersville is a village located in Jefferson County, Ohio, United States. It is part of the Steubenville-Weirton Metropolitan Statistical Area. The population was 3,717 at the 2010 census.
History
The area that is now Wintersville was first settled in 1798 by John Winter, who built a log cabin near the present-day intersection of Main Street and University Boulevard. The village was officially founded in 1817 and was named after Winter.
In 1819, the first post office was established in the village. The first school was built in 1820 and the first church was built in 1822.
In 1836, the village was incorporated and the first mayor was elected. The first newspaper, the Wintersville Gazette, was established in 1837.
In 1845, the first railroad line was built through the village, connecting it to Steubenville and Pittsburgh. This allowed for the growth of the village and the development of industry.
In 1871, the village was connected to the Ohio River by a canal. This allowed for the transportation of goods and people to and from the village.
In 1876, the village was connected to the national railway system. This allowed for the transportation of goods and people to and from the village.
In 1887, the village was connected to the electric grid. This allowed for the development of industry and the growth of the village.
In the early 1900s, the village was home to several factories, including a glass factory, a brick factory, a furniture factory, and a canning factory.
Geography
Wintersville is located at 40 22 25 North 80 37 17 West 40 373611 80 621389
According to the United States Census Bureau, the village has a total area of 1.3 square miles (3.4 km2), all land.
Economy
The economy of Wintersville is largely based on manufacturing and retail. The village is home to several factories, including a glass factory, a brick factory, a furniture factory, and a canning factory.
The village is also home to several retail stores, including a grocery store, a hardware store, and a pharmacy.
Demographics
As of the census of 2010, there were 3,717 people, 1,541 households, and 990 families residing in the village. The population density was 2,845.4 people per square mile (1,098.7/km2). There were 1,717 housing units at an average density of 1,323.1 per square mile (507.7/km2). The racial makeup of the village was 97.2% White, 0.7% African American, 0.2% Native American, 0.4% Asian, 0.2% from other races, and 1.3% from two or more races. Hispanic or Latino of any race were 0.9% of the population.
There were 1,541 households, out of which 28.2% had children under the age of 18 living with them, 46.2% were married couples living together, 13.2% had a female householder with no husband present, and 36.2% were non-families. 32.2% of all households were made up of individuals, and 15.2% had someone living alone who was 65 years of age or older. The average household size was 2.41 and the average family size was 3.04.
In the village, the population was spread out, with 24.2% under the age of 18, 8.2% from 18 to 24, 27.2% from 25 to 44, 22.7% from 45 to 64, and 17.7% who were 65 years of age or older. The median age was 38 years. For every 100 females, there were 87.2 males. For every 100 females age 18 and over, there were 83.2 males.
The median income for a household in the village was $33,958, and the median income for a family was $41,964. Males had a median income of $32,917 versus $22,917 for females. The per capita income for the village was $17,845. About 8.2% of families and 10.2% of the population were below the poverty line, including 14.2% of those under age 18 and 8.2% of those age 65 or over.
Common Questions
What is Per Capita Income in Wintersville?
Per Capita income in Wintersville is $34,632.
What is the Median Family Income in Wintersville?
Median Family Income in Wintersville is $88,021.
What is the Median Household income in Wintersville?
Median Household Income in Wintersville is $70,607.
What is Income or Wage Gap in Wintersville?
Income or Wage Gap in Wintersville is 9.6%.
Women in Wintersville earn 90.4 cents for every dollar earned by a man.
What is Inequality or Gini Index in Wintersville?
Inequality or Gini Index in Wintersville is 0.42.
What is the Total Population of Wintersville?
Total Population of Wintersville is 3,983.
What is the Total Male Population of Wintersville?
Total Male Population of Wintersville is 2,004.
What is the Total Female Population of Wintersville?
Total Female Population of Wintersville is 1,979.
What is the Ratio of Males per 100 Females in Wintersville?
There are 101.26 Males per 100 Females in Wintersville.
What is the Ratio of Females per 100 Males in Wintersville?
There are 98.75 Females per 100 Males in Wintersville.
What is the Median Population Age in Wintersville?
Median Population Age in Wintersville is 47.2 Years.
What is the Average Family Size in Wintersville
Average Family Size in Wintersville is 3.0 People.
What is the Average Household Size in Wintersville
Average Household Size in Wintersville is 2.3 People.
How Large is the Labor Force in Wintersville?
There are 1,658 People in the Labor Forcein in Wintersville.
What is the Percentage of People in the Labor Force in Wintersville?
51.3% of People are in the Labor Force in Wintersville.
What is the Unemployment Rate in Wintersville?
Unemployment Rate in Wintersville is 5.0%.