Zip Codes with the Highest Percentage of Population with a Degree in Physical and Health Sciences in Cincinnati, OH
RELATED REPORTS & OPTIONS
Physical and Health Sciences
Cincinnati
Compare Zip Codes
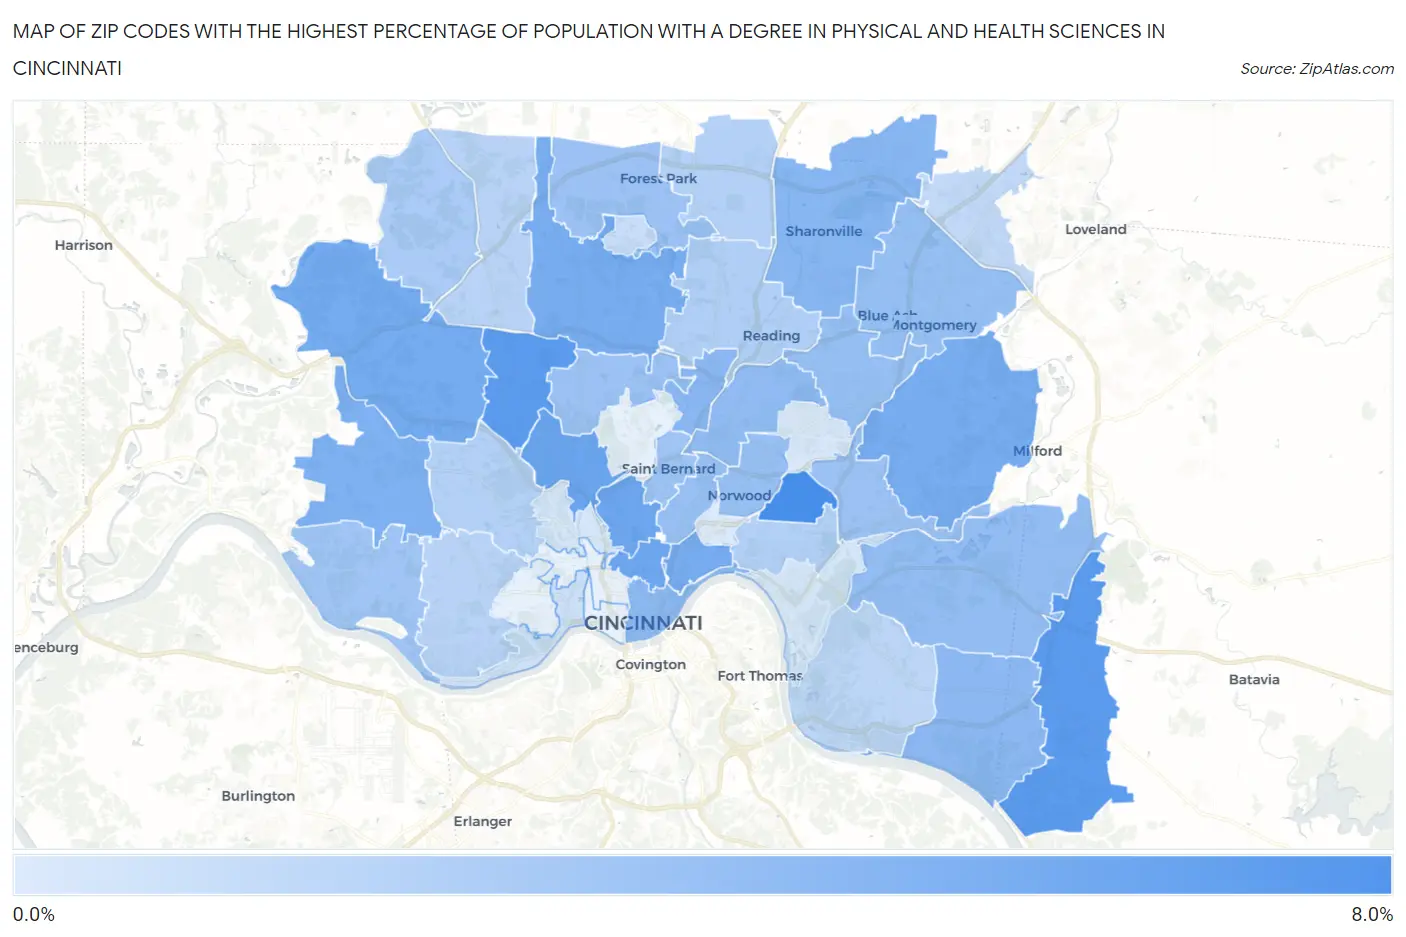
Map of Zip Codes with the Highest Percentage of Population with a Degree in Physical and Health Sciences in Cincinnati
0.95%
6.4%
Zip Codes with the Highest Percentage of Population with a Degree in Physical and Health Sciences in Cincinnati, OH
| Zip Code | % Graduates | vs State | vs National | |
| 1. | 45209 | 6.4% | 3.0%(+3.40)#96 | 3.1%(+3.26)#2,942 |
| 2. | 45239 | 5.7% | 3.0%(+2.73)#106 | 3.1%(+2.59)#3,579 |
| 3. | 45245 | 5.7% | 3.0%(+2.71)#108 | 3.1%(+2.57)#3,598 |
| 4. | 45223 | 5.0% | 3.0%(+2.01)#141 | 3.1%(+1.87)#4,623 |
| 5. | 45219 | 4.9% | 3.0%(+1.97)#144 | 3.1%(+1.83)#4,690 |
| 6. | 45220 | 4.9% | 3.0%(+1.92)#148 | 3.1%(+1.78)#4,773 |
| 7. | 45247 | 4.7% | 3.0%(+1.73)#165 | 3.1%(+1.59)#5,135 |
| 8. | 45206 | 4.6% | 3.0%(+1.66)#167 | 3.1%(+1.52)#5,282 |
| 9. | 45231 | 4.6% | 3.0%(+1.63)#170 | 3.1%(+1.49)#5,351 |
| 10. | 45243 | 4.6% | 3.0%(+1.63)#171 | 3.1%(+1.49)#5,356 |
| 11. | 45248 | 4.3% | 3.0%(+1.37)#192 | 3.1%(+1.23)#5,907 |
| 12. | 45241 | 4.0% | 3.0%(+1.01)#226 | 3.1%(+0.868)#6,852 |
| 13. | 45216 | 3.9% | 3.0%(+0.960)#233 | 3.1%(+0.818)#6,982 |
| 14. | 45255 | 3.8% | 3.0%(+0.852)#242 | 3.1%(+0.710)#7,323 |
| 15. | 45202 | 3.8% | 3.0%(+0.846)#243 | 3.1%(+0.704)#7,352 |
| 16. | 45237 | 3.7% | 3.0%(+0.733)#258 | 3.1%(+0.592)#7,743 |
| 17. | 45244 | 3.6% | 3.0%(+0.657)#265 | 3.1%(+0.516)#8,003 |
| 18. | 45236 | 3.5% | 3.0%(+0.528)#279 | 3.1%(+0.387)#8,481 |
| 19. | 45242 | 3.5% | 3.0%(+0.511)#282 | 3.1%(+0.370)#8,559 |
| 20. | 45212 | 3.4% | 3.0%(+0.488)#286 | 3.1%(+0.347)#8,643 |
| 21. | 45229 | 3.4% | 3.0%(+0.467)#290 | 3.1%(+0.325)#8,712 |
| 22. | 45240 | 3.3% | 3.0%(+0.379)#301 | 3.1%(+0.237)#9,049 |
| 23. | 45227 | 3.3% | 3.0%(+0.310)#307 | 3.1%(+0.169)#9,305 |
| 24. | 45224 | 3.3% | 3.0%(+0.302)#309 | 3.1%(+0.161)#9,340 |
| 25. | 45217 | 3.2% | 3.0%(+0.205)#321 | 3.1%(+0.064)#9,712 |
| 26. | 45233 | 3.1% | 3.0%(+0.119)#341 | 3.1%(-0.022)#10,076 |
| 27. | 45252 | 2.7% | 3.0%(-0.222)#390 | 3.1%(-0.363)#11,613 |
| 28. | 45215 | 2.5% | 3.0%(-0.424)#424 | 3.1%(-0.566)#12,562 |
| 29. | 45211 | 2.4% | 3.0%(-0.513)#445 | 3.1%(-0.654)#12,983 |
| 30. | 45246 | 2.4% | 3.0%(-0.545)#450 | 3.1%(-0.686)#13,120 |
| 31. | 45208 | 2.4% | 3.0%(-0.569)#454 | 3.1%(-0.710)#13,242 |
| 32. | 45251 | 2.3% | 3.0%(-0.703)#476 | 3.1%(-0.845)#13,893 |
| 33. | 45238 | 2.2% | 3.0%(-0.721)#481 | 3.1%(-0.862)#13,982 |
| 34. | 45230 | 2.1% | 3.0%(-0.878)#514 | 3.1%(-1.02)#14,740 |
| 35. | 45249 | 1.9% | 3.0%(-1.07)#541 | 3.1%(-1.21)#15,588 |
| 36. | 45218 | 1.7% | 3.0%(-1.29)#570 | 3.1%(-1.43)#16,541 |
| 37. | 45204 | 1.5% | 3.0%(-1.44)#598 | 3.1%(-1.58)#17,202 |
| 38. | 45225 | 1.2% | 3.0%(-1.73)#644 | 3.1%(-1.87)#18,415 |
| 39. | 45226 | 1.2% | 3.0%(-1.81)#651 | 3.1%(-1.95)#18,702 |
| 40. | 45213 | 1.1% | 3.0%(-1.86)#656 | 3.1%(-2.01)#18,899 |
| 41. | 45207 | 0.95% | 3.0%(-2.01)#671 | 3.1%(-2.15)#19,416 |
1
Common Questions
What are the Top 10 Zip Codes with the Highest Percentage of Population with a Degree in Physical and Health Sciences in Cincinnati, OH?
Top 10 Zip Codes with the Highest Percentage of Population with a Degree in Physical and Health Sciences in Cincinnati, OH are:
What zip code has the Highest Percentage of Population with a Degree in Physical and Health Sciences in Cincinnati, OH?
45209 has the Highest Percentage of Population with a Degree in Physical and Health Sciences in Cincinnati, OH with 6.4%.
What is the Percentage of Population with a Degree in Physical and Health Sciences in Cincinnati, OH?
Percentage of Population with a Degree in Physical and Health Sciences in Cincinnati is 3.3%.
What is the Percentage of Population with a Degree in Physical and Health Sciences in Ohio?
Percentage of Population with a Degree in Physical and Health Sciences in Ohio is 3.0%.
What is the Percentage of Population with a Degree in Physical and Health Sciences in the United States?
Percentage of Population with a Degree in Physical and Health Sciences in the United States is 3.1%.