New Miami, OH Map & Demographics
New Miami Map
New Miami Overview
$21,350
PER CAPITA INCOME
$54,583
AVG FAMILY INCOME
$45,046
AVG HOUSEHOLD INCOME
20.3%
WAGE / INCOME GAP [ % ]
79.7¢/ $1
WAGE / INCOME GAP [ $ ]
0.41
INEQUALITY / GINI INDEX
2,411
TOTAL POPULATION
1,298
MALE POPULATION
1,113
FEMALE POPULATION
116.62
MALES / 100 FEMALES
85.75
FEMALES / 100 MALES
37.0
MEDIAN AGE
3.5
AVG FAMILY SIZE
3.0
AVG HOUSEHOLD SIZE
1,140
LABOR FORCE [ PEOPLE ]
61.9%
PERCENT IN LABOR FORCE
16.8%
UNEMPLOYMENT RATE
Income in New Miami
Income Overview in New Miami
Per Capita Income in New Miami is $21,350, while median incomes of families and households are $54,583 and $45,046 respectively.
| Characteristic | Number | Measure |
| Per Capita Income | 2,411 | $21,350 |
| Median Family Income | 590 | $54,583 |
| Mean Family Income | 590 | $64,521 |
| Median Household Income | 815 | $45,046 |
| Mean Household Income | 815 | $59,364 |
| Income Deficit | 590 | $0 |
| Wage / Income Gap (%) | 2,411 | 20.31% |
| Wage / Income Gap ($) | 2,411 | 79.69¢ per $1 |
| Gini / Inequality Index | 2,411 | 0.41 |
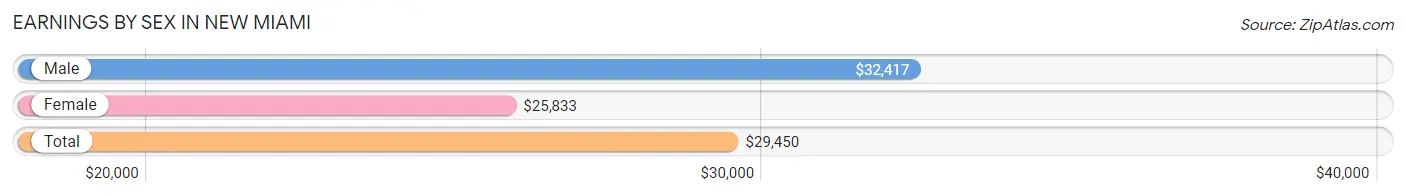
Earnings by Sex in New Miami
Average Earnings in New Miami are $29,450, $32,417 for men and $25,833 for women, a difference of 20.3%.
| Sex | Number | Average Earnings |
| Male | 598 (55.7%) | $32,417 |
| Female | 476 (44.3%) | $25,833 |
| Total | 1,074 (100.0%) | $29,450 |
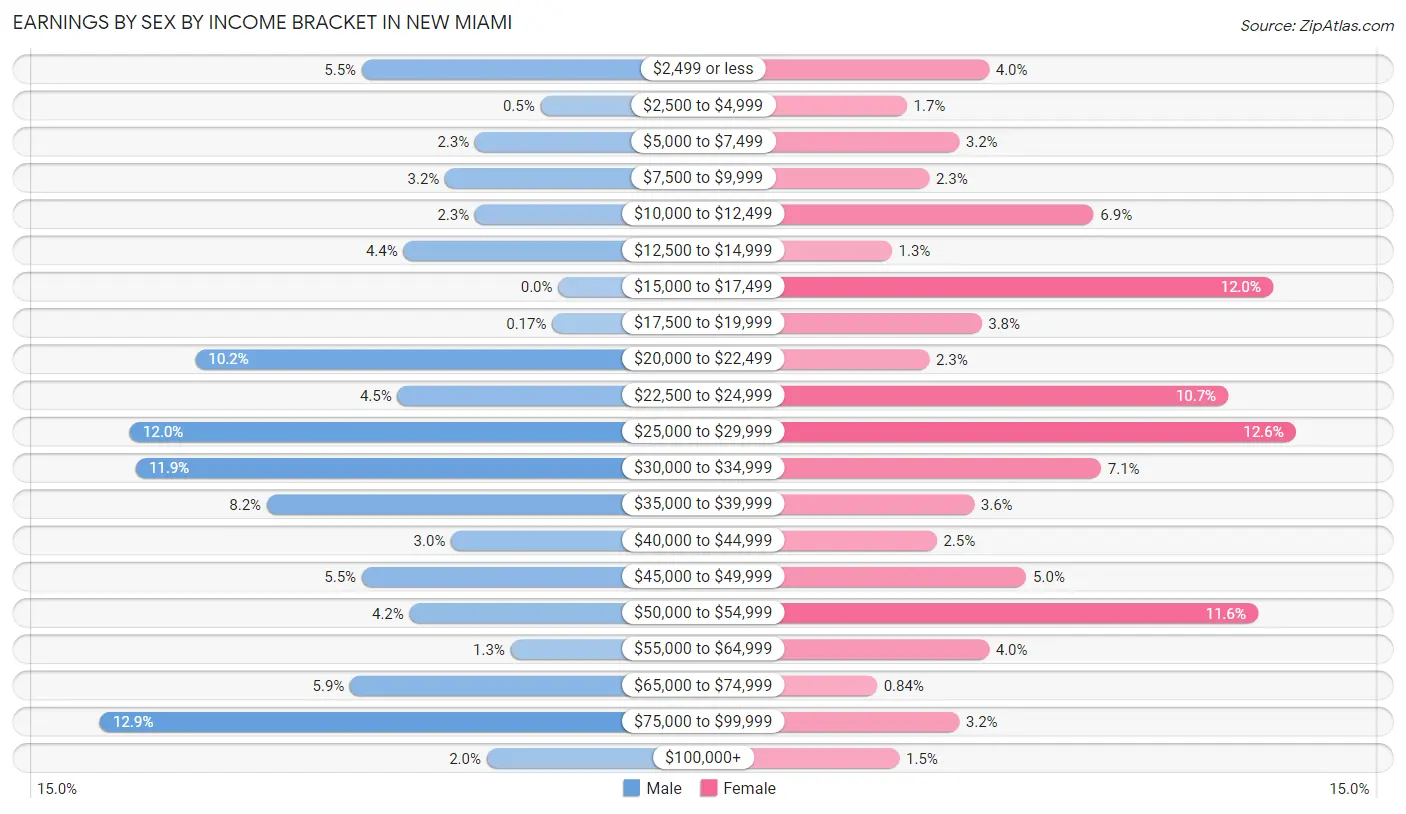
Earnings by Sex by Income Bracket in New Miami
The most common earnings brackets in New Miami are $75,000 to $99,999 for men (77 | 12.9%) and $25,000 to $29,999 for women (60 | 12.6%).
| Income | Male | Female |
| $2,499 or less | 33 (5.5%) | 19 (4.0%) |
| $2,500 to $4,999 | 3 (0.5%) | 8 (1.7%) |
| $5,000 to $7,499 | 14 (2.3%) | 15 (3.2%) |
| $7,500 to $9,999 | 19 (3.2%) | 11 (2.3%) |
| $10,000 to $12,499 | 14 (2.3%) | 33 (6.9%) |
| $12,500 to $14,999 | 26 (4.3%) | 6 (1.3%) |
| $15,000 to $17,499 | 0 (0.0%) | 57 (12.0%) |
| $17,500 to $19,999 | 1 (0.2%) | 18 (3.8%) |
| $20,000 to $22,499 | 61 (10.2%) | 11 (2.3%) |
| $22,500 to $24,999 | 27 (4.5%) | 51 (10.7%) |
| $25,000 to $29,999 | 72 (12.0%) | 60 (12.6%) |
| $30,000 to $34,999 | 71 (11.9%) | 34 (7.1%) |
| $35,000 to $39,999 | 49 (8.2%) | 17 (3.6%) |
| $40,000 to $44,999 | 18 (3.0%) | 12 (2.5%) |
| $45,000 to $49,999 | 33 (5.5%) | 24 (5.0%) |
| $50,000 to $54,999 | 25 (4.2%) | 55 (11.6%) |
| $55,000 to $64,999 | 8 (1.3%) | 19 (4.0%) |
| $65,000 to $74,999 | 35 (5.9%) | 4 (0.8%) |
| $75,000 to $99,999 | 77 (12.9%) | 15 (3.2%) |
| $100,000+ | 12 (2.0%) | 7 (1.5%) |
| Total | 598 (100.0%) | 476 (100.0%) |
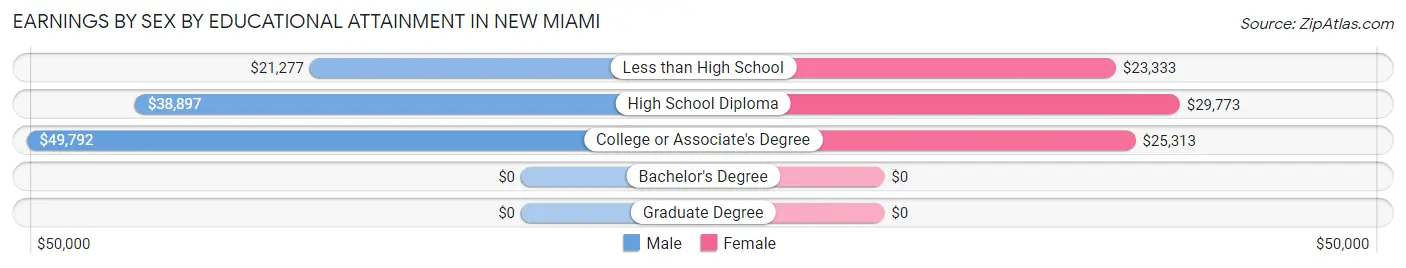
Earnings by Sex by Educational Attainment in New Miami
Average earnings in New Miami are $36,971 for men and $27,798 for women, a difference of 24.8%. Men with an educational attainment of college or associate's degree enjoy the highest average annual earnings of $49,792, while those with less than high school education earn the least with $21,277. Women with an educational attainment of high school diploma earn the most with the average annual earnings of $29,773, while those with less than high school education have the smallest earnings of $23,333.
| Educational Attainment | Male Income | Female Income |
| Less than High School | $21,277 | $23,333 |
| High School Diploma | $38,897 | $29,773 |
| College or Associate's Degree | $49,792 | $25,313 |
| Bachelor's Degree | - | - |
| Graduate Degree | - | - |
| Total | $36,971 | $27,798 |
Family Income in New Miami
Family Income Brackets in New Miami
According to the New Miami family income data, there are 134 families falling into the $50,000 to $74,999 income range, which is the most common income bracket and makes up 22.7% of all families.
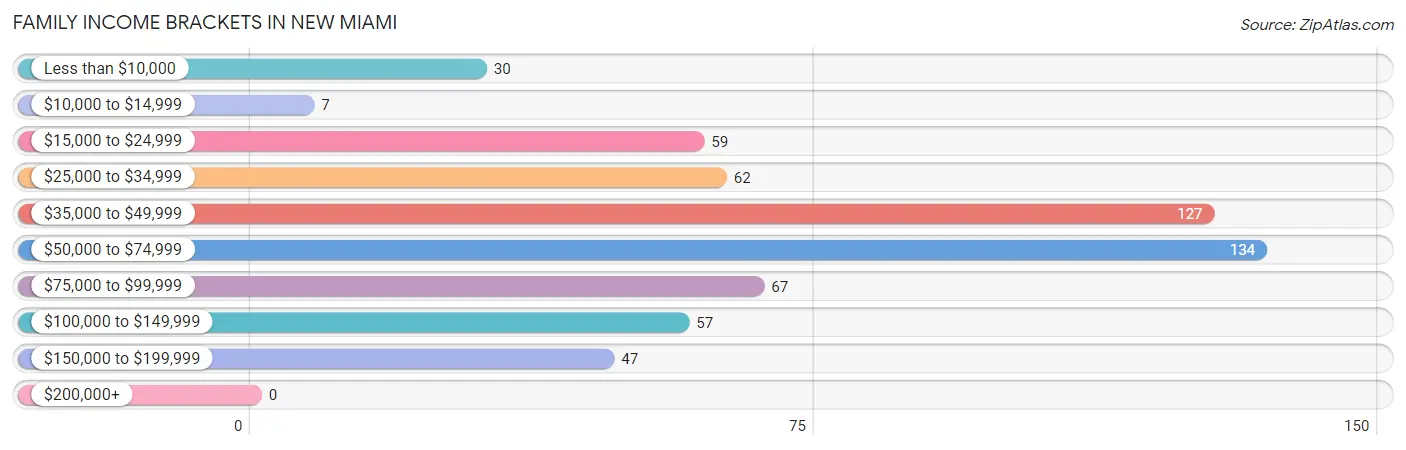
| Income Bracket | # Families | % Families |
| Less than $10,000 | 30 | 5.1% |
| $10,000 to $14,999 | 7 | 1.2% |
| $15,000 to $24,999 | 59 | 10.0% |
| $25,000 to $34,999 | 62 | 10.5% |
| $35,000 to $49,999 | 127 | 21.5% |
| $50,000 to $74,999 | 134 | 22.7% |
| $75,000 to $99,999 | 67 | 11.4% |
| $100,000 to $149,999 | 57 | 9.7% |
| $150,000 to $199,999 | 47 | 8.0% |
| $200,000+ | 0 | 0.0% |
Family Income by Famaliy Size in New Miami
4-person families (68 | 11.5%) account for the highest median family income in New Miami with $82,667 per family, while 2-person families (287 | 48.6%) have the highest median income of $22,708 per family member.
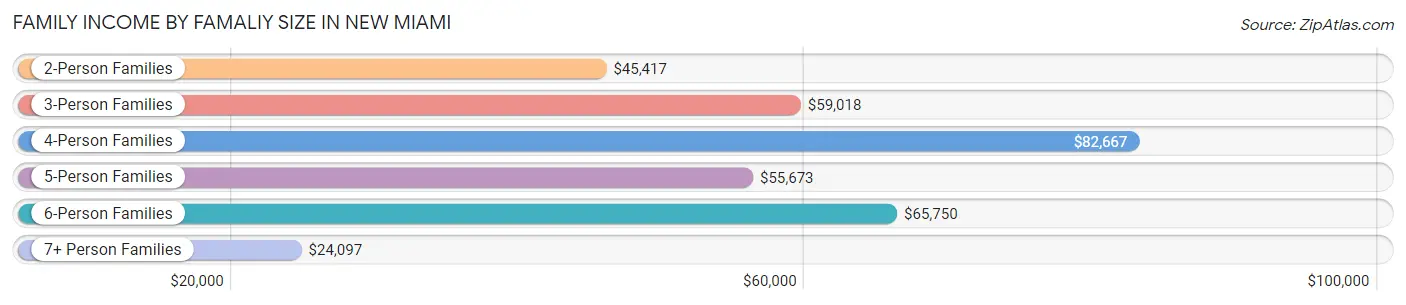
| Income Bracket | # Families | Median Income |
| 2-Person Families | 287 (48.6%) | $45,417 |
| 3-Person Families | 107 (18.1%) | $59,018 |
| 4-Person Families | 68 (11.5%) | $82,667 |
| 5-Person Families | 77 (13.1%) | $55,673 |
| 6-Person Families | 28 (4.8%) | $65,750 |
| 7+ Person Families | 23 (3.9%) | $24,097 |
| Total | 590 (100.0%) | $54,583 |
Family Income by Number of Earners in New Miami
The median family income in New Miami is $54,583, with families comprising 3+ earners (70) having the highest median family income of $145,000, while families with no earners (153) have the lowest median family income of $34,625, accounting for 11.9% and 25.9% of families, respectively.
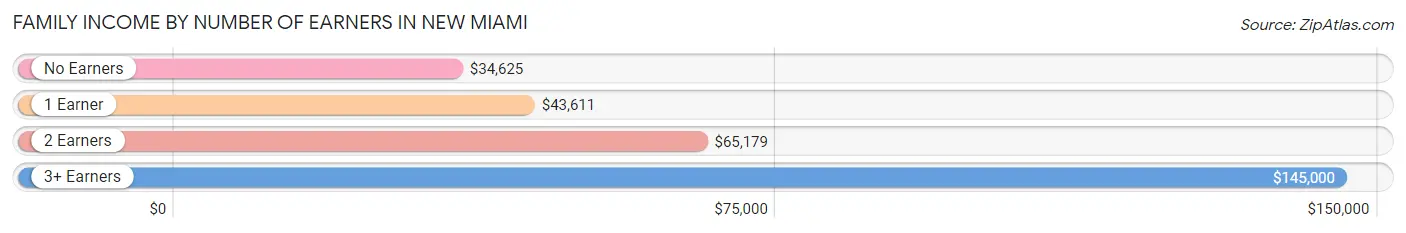
| Number of Earners | # Families | Median Income |
| No Earners | 153 (25.9%) | $34,625 |
| 1 Earner | 204 (34.6%) | $43,611 |
| 2 Earners | 163 (27.6%) | $65,179 |
| 3+ Earners | 70 (11.9%) | $145,000 |
| Total | 590 (100.0%) | $54,583 |
Household Income in New Miami
Household Income Brackets in New Miami
With 164 households falling in the category, the $15,000 to $24,999 income range is the most frequent in New Miami, accounting for 20.1% of all households. In contrast, only 12 households (1.5%) fall into the $10,000 to $14,999 income bracket, making it the least populous group.
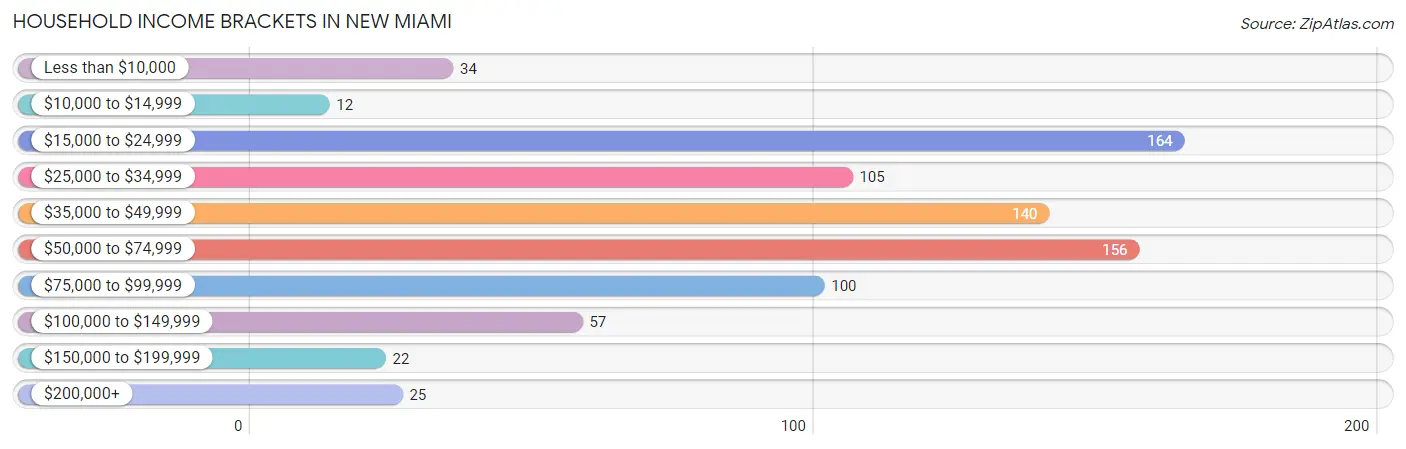
| Income Bracket | # Households | % Households |
| Less than $10,000 | 34 | 4.2% |
| $10,000 to $14,999 | 12 | 1.5% |
| $15,000 to $24,999 | 164 | 20.1% |
| $25,000 to $34,999 | 105 | 12.9% |
| $35,000 to $49,999 | 140 | 17.2% |
| $50,000 to $74,999 | 156 | 19.1% |
| $75,000 to $99,999 | 100 | 12.3% |
| $100,000 to $149,999 | 57 | 7.0% |
| $150,000 to $199,999 | 22 | 2.7% |
| $200,000+ | 25 | 3.1% |
Household Income by Householder Age in New Miami
The median household income in New Miami is $45,046, with the highest median household income of $58,854 found in the 15 to 24 years age bracket for the primary householder. A total of 51 households (6.3%) fall into this category. Meanwhile, the 25 to 44 years age bracket for the primary householder has the lowest median household income of $41,607, with 194 households (23.8%) in this group.
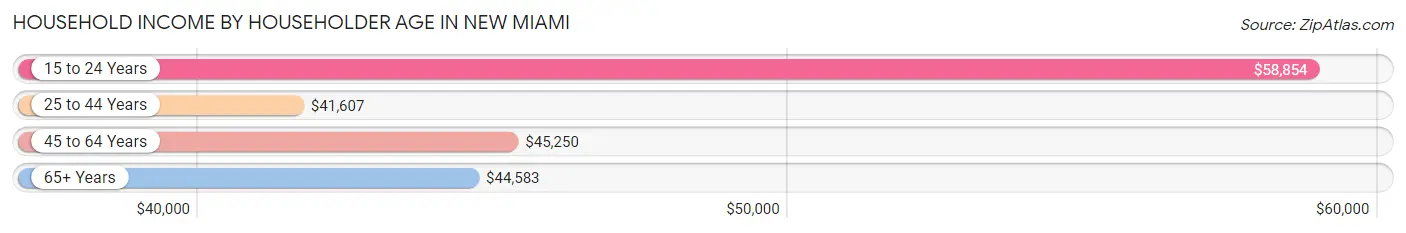
| Income Bracket | # Households | Median Income |
| 15 to 24 Years | 51 (6.3%) | $58,854 |
| 25 to 44 Years | 194 (23.8%) | $41,607 |
| 45 to 64 Years | 366 (44.9%) | $45,250 |
| 65+ Years | 204 (25.0%) | $44,583 |
| Total | 815 (100.0%) | $45,046 |
Poverty in New Miami
Income Below Poverty by Sex and Age in New Miami
With 17.7% poverty level for males and 24.3% for females among the residents of New Miami, under 5 year old males and under 5 year old females are the most vulnerable to poverty, with 42 males (50.6%) and 40 females (61.5%) in their respective age groups living below the poverty level.
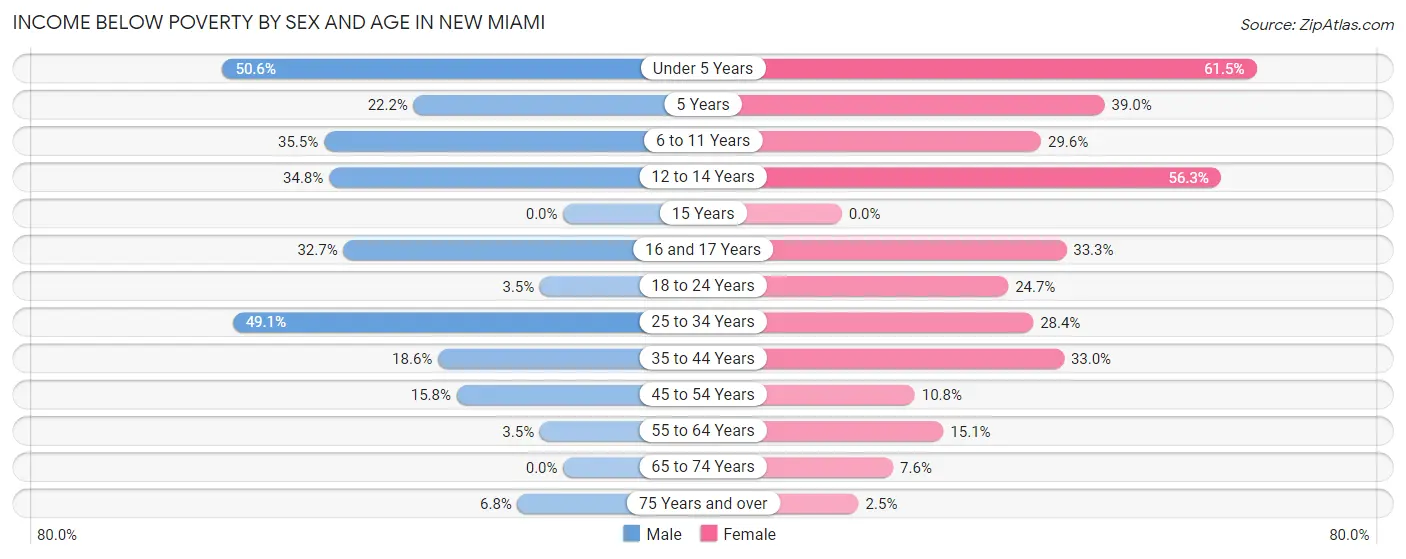
| Age Bracket | Male | Female |
| Under 5 Years | 42 (50.6%) | 40 (61.5%) |
| 5 Years | 2 (22.2%) | 16 (39.0%) |
| 6 to 11 Years | 54 (35.5%) | 29 (29.6%) |
| 12 to 14 Years | 16 (34.8%) | 27 (56.2%) |
| 15 Years | 0 (0.0%) | 0 (0.0%) |
| 16 and 17 Years | 16 (32.7%) | 2 (33.3%) |
| 18 to 24 Years | 6 (3.5%) | 21 (24.7%) |
| 25 to 34 Years | 27 (49.1%) | 54 (28.4%) |
| 35 to 44 Years | 29 (18.6%) | 32 (33.0%) |
| 45 to 54 Years | 25 (15.8%) | 22 (10.8%) |
| 55 to 64 Years | 9 (3.5%) | 16 (15.1%) |
| 65 to 74 Years | 0 (0.0%) | 9 (7.6%) |
| 75 Years and over | 4 (6.8%) | 1 (2.5%) |
| Total | 230 (17.7%) | 269 (24.3%) |
Income Above Poverty by Sex and Age in New Miami
According to the poverty statistics in New Miami, males aged 15 years and females aged 15 years are the age groups that are most secure financially, with 100.0% of males and 100.0% of females in these age groups living above the poverty line.
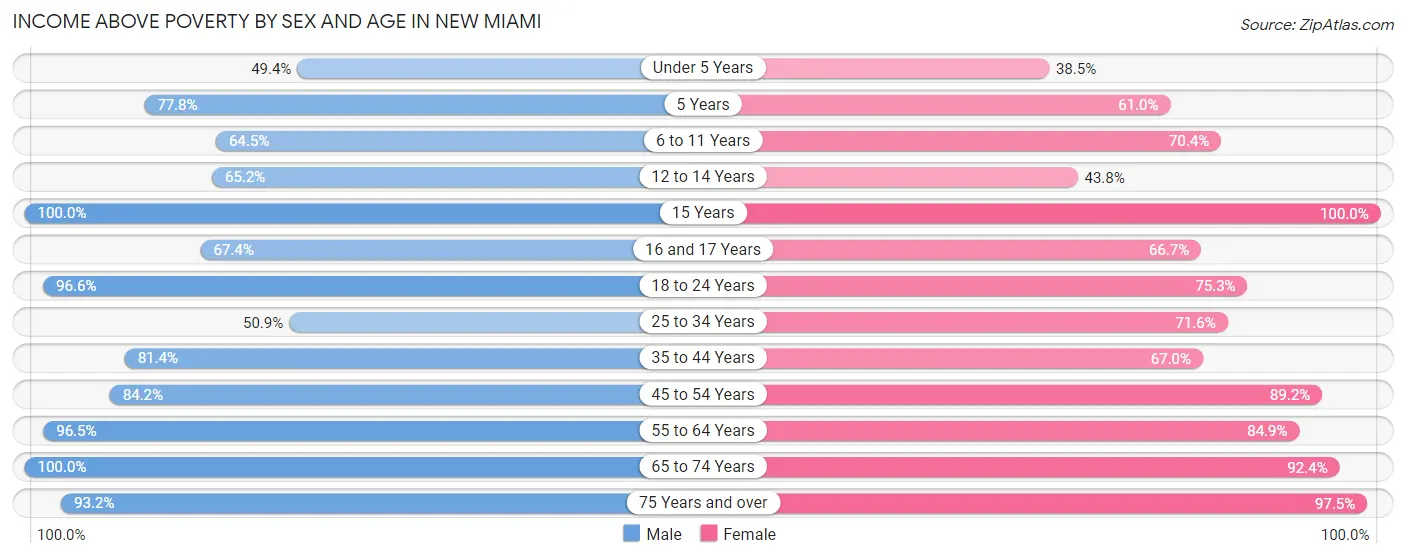
| Age Bracket | Male | Female |
| Under 5 Years | 41 (49.4%) | 25 (38.5%) |
| 5 Years | 7 (77.8%) | 25 (61.0%) |
| 6 to 11 Years | 98 (64.5%) | 69 (70.4%) |
| 12 to 14 Years | 30 (65.2%) | 21 (43.8%) |
| 15 Years | 12 (100.0%) | 12 (100.0%) |
| 16 and 17 Years | 33 (67.3%) | 4 (66.7%) |
| 18 to 24 Years | 168 (96.6%) | 64 (75.3%) |
| 25 to 34 Years | 28 (50.9%) | 136 (71.6%) |
| 35 to 44 Years | 127 (81.4%) | 65 (67.0%) |
| 45 to 54 Years | 133 (84.2%) | 181 (89.2%) |
| 55 to 64 Years | 250 (96.5%) | 90 (84.9%) |
| 65 to 74 Years | 86 (100.0%) | 109 (92.4%) |
| 75 Years and over | 55 (93.2%) | 39 (97.5%) |
| Total | 1,068 (82.3%) | 840 (75.7%) |
Income Below Poverty Among Married-Couple Families in New Miami
The poverty statistics for married-couple families in New Miami show that 10.2% or 37 of the total 364 families live below the poverty line. Families with 5 or more children have the highest poverty rate of 100.0%, comprising of 3 families. On the other hand, families with no children have the lowest poverty rate of 3.8%, which includes 8 families.
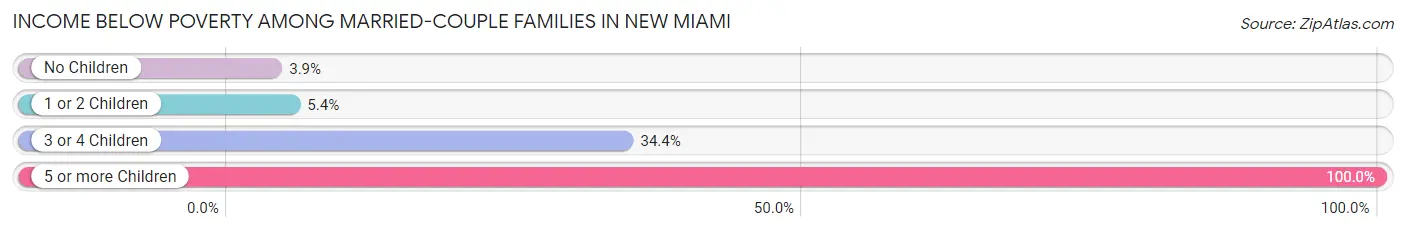
| Children | Above Poverty | Below Poverty |
| No Children | 200 (96.2%) | 8 (3.8%) |
| 1 or 2 Children | 87 (94.6%) | 5 (5.4%) |
| 3 or 4 Children | 40 (65.6%) | 21 (34.4%) |
| 5 or more Children | 0 (0.0%) | 3 (100.0%) |
| Total | 327 (89.8%) | 37 (10.2%) |
Income Below Poverty Among Single-Parent Households in New Miami
According to the poverty data in New Miami, 7.7% or 4 single-father households and 32.8% or 57 single-mother households are living below the poverty line. Among single-father households, those with no children have the highest poverty rate, with 4 households (12.5%) experiencing poverty. Likewise, among single-mother households, those with 3 or 4 children have the highest poverty rate, with 18 households (100.0%) falling below the poverty line.
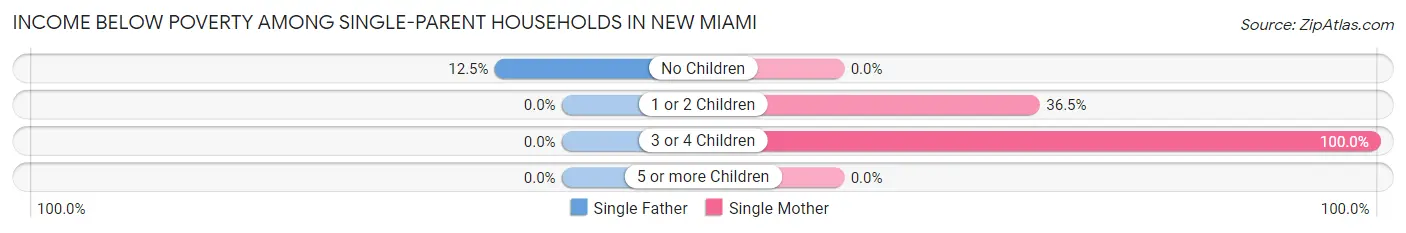
| Children | Single Father | Single Mother |
| No Children | 4 (12.5%) | 0 (0.0%) |
| 1 or 2 Children | 0 (0.0%) | 39 (36.4%) |
| 3 or 4 Children | 0 (0.0%) | 18 (100.0%) |
| 5 or more Children | 0 (0.0%) | 0 (0.0%) |
| Total | 4 (7.7%) | 57 (32.8%) |
Income Below Poverty Among Married-Couple vs Single-Parent Households in New Miami
The poverty data for New Miami shows that 37 of the married-couple family households (10.2%) and 61 of the single-parent households (27.0%) are living below the poverty level. Within the married-couple family households, those with 5 or more children have the highest poverty rate, with 3 households (100.0%) falling below the poverty line. Among the single-parent households, those with 3 or 4 children have the highest poverty rate, with 18 household (47.4%) living below poverty.
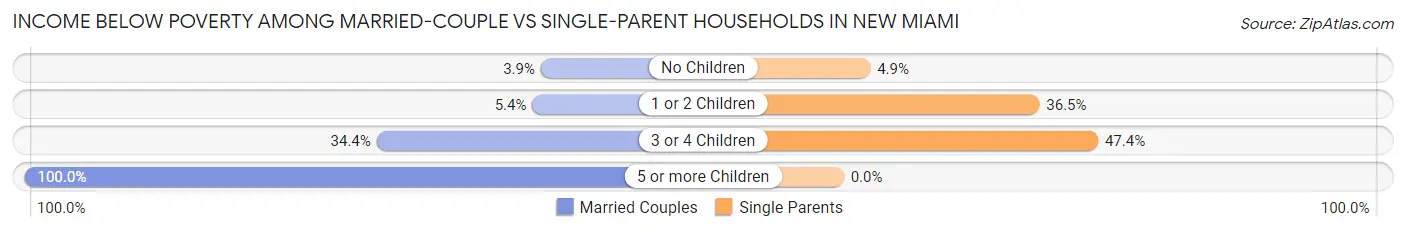
| Children | Married-Couple Families | Single-Parent Households |
| No Children | 8 (3.8%) | 4 (4.9%) |
| 1 or 2 Children | 5 (5.4%) | 39 (36.4%) |
| 3 or 4 Children | 21 (34.4%) | 18 (47.4%) |
| 5 or more Children | 3 (100.0%) | 0 (0.0%) |
| Total | 37 (10.2%) | 61 (27.0%) |
Race in New Miami
The most populous races in New Miami are White / Caucasian (2,111 | 87.6%), Two or more Races (160 | 6.6%), and Black / African American (135 | 5.6%).
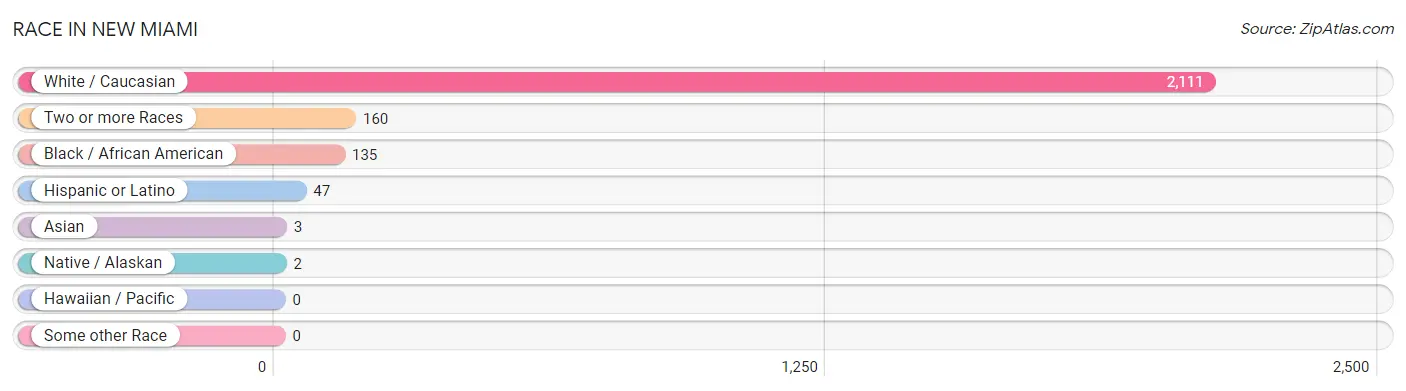
| Race | # Population | % Population |
| Asian | 3 | 0.1% |
| Black / African American | 135 | 5.6% |
| Hawaiian / Pacific | 0 | 0.0% |
| Hispanic or Latino | 47 | 1.9% |
| Native / Alaskan | 2 | 0.1% |
| White / Caucasian | 2,111 | 87.6% |
| Two or more Races | 160 | 6.6% |
| Some other Race | 0 | 0.0% |
| Total | 2,411 | 100.0% |
Ancestry in New Miami
The most populous ancestries reported in New Miami are Irish (585 | 24.3%), German (478 | 19.8%), English (242 | 10.0%), American (173 | 7.2%), and Italian (37 | 1.5%), together accounting for 62.8% of all New Miami residents.
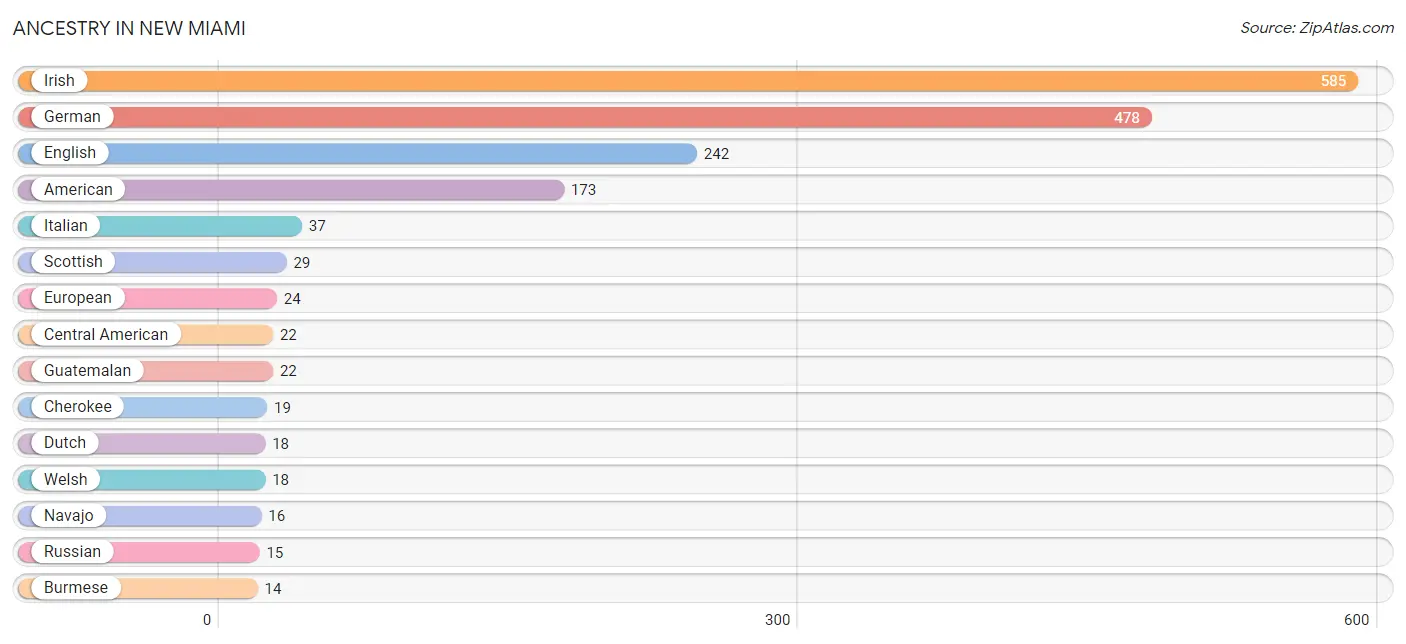
| Ancestry | # Population | % Population |
| African | 5 | 0.2% |
| American | 173 | 7.2% |
| British | 2 | 0.1% |
| Burmese | 14 | 0.6% |
| Central American | 22 | 0.9% |
| Cherokee | 19 | 0.8% |
| Cuban | 3 | 0.1% |
| Dutch | 18 | 0.7% |
| English | 242 | 10.0% |
| European | 24 | 1.0% |
| French | 12 | 0.5% |
| German | 478 | 19.8% |
| Guatemalan | 22 | 0.9% |
| Irish | 585 | 24.3% |
| Italian | 37 | 1.5% |
| Mexican | 7 | 0.3% |
| Native Hawaiian | 8 | 0.3% |
| Navajo | 16 | 0.7% |
| Russian | 15 | 0.6% |
| Scottish | 29 | 1.2% |
| Subsaharan African | 5 | 0.2% |
| Welsh | 18 | 0.7% | View All 22 Rows |
Immigrants in New Miami
The most numerous immigrant groups reported in New Miami came from Europe (16 | 0.7%), Germany (16 | 0.7%), Western Europe (16 | 0.7%), Central America (4 | 0.2%), and Latin America (4 | 0.2%), together accounting for 2.3% of all New Miami residents.
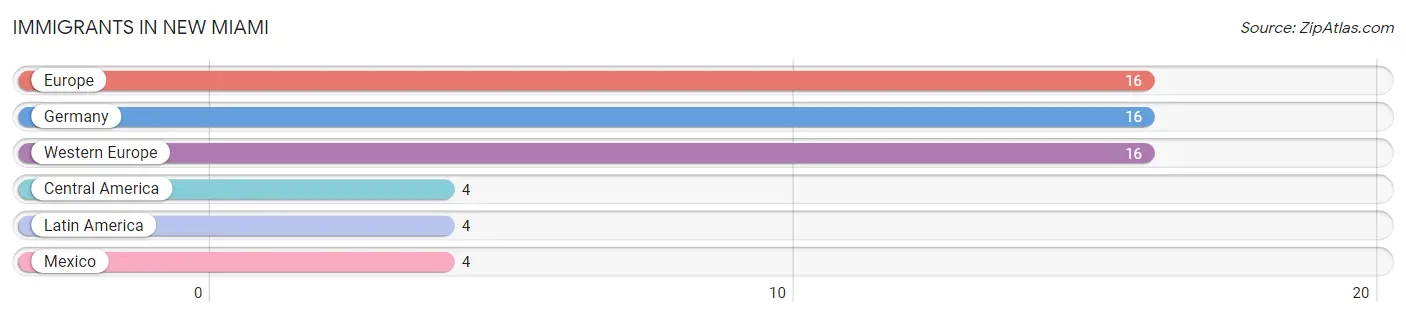
| Immigration Origin | # Population | % Population |
| Central America | 4 | 0.2% |
| Europe | 16 | 0.7% |
| Germany | 16 | 0.7% |
| Latin America | 4 | 0.2% |
| Mexico | 4 | 0.2% |
| Western Europe | 16 | 0.7% | View All 6 Rows |
Sex and Age in New Miami
Sex and Age in New Miami
The most populous age groups in New Miami are 20 to 24 Years (141 | 10.9%) for men and 50 to 54 Years (138 | 12.4%) for women.
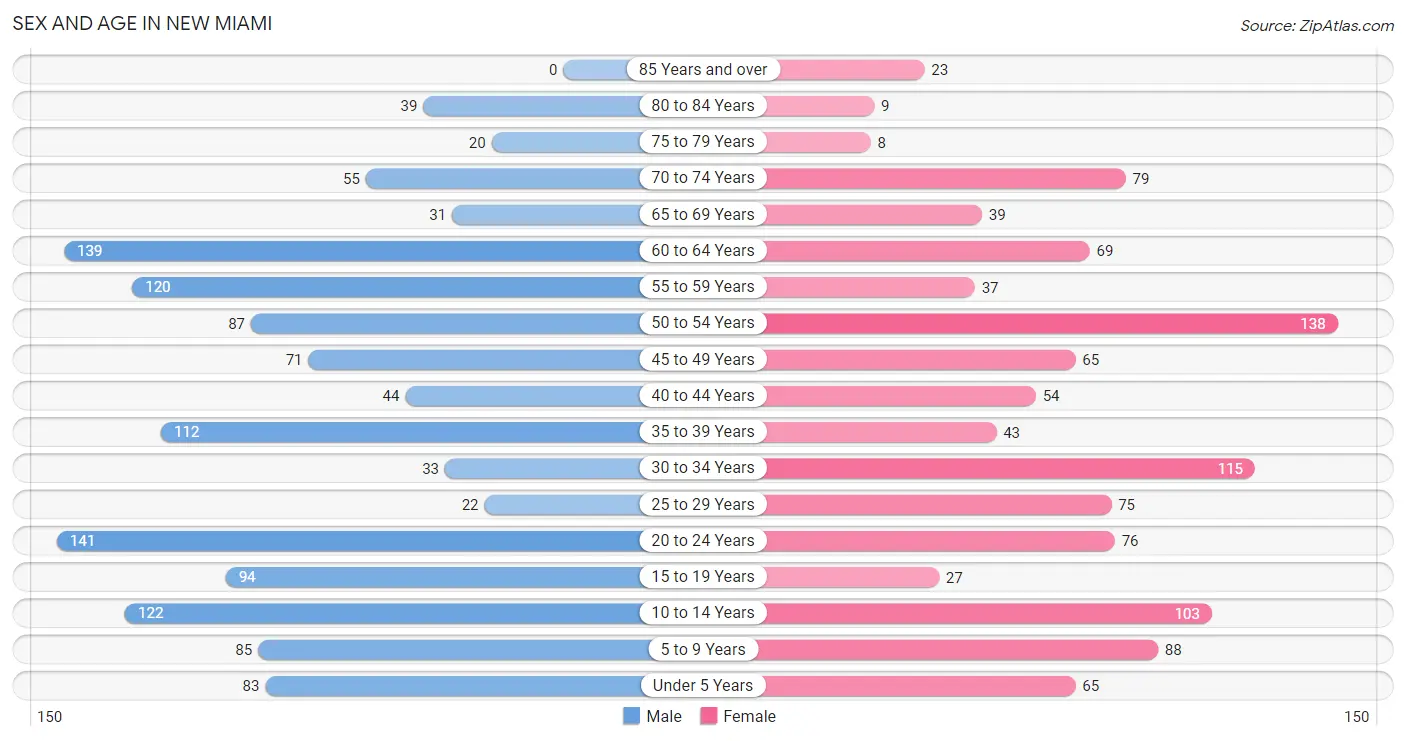
| Age Bracket | Male | Female |
| Under 5 Years | 83 (6.4%) | 65 (5.8%) |
| 5 to 9 Years | 85 (6.6%) | 88 (7.9%) |
| 10 to 14 Years | 122 (9.4%) | 103 (9.2%) |
| 15 to 19 Years | 94 (7.2%) | 27 (2.4%) |
| 20 to 24 Years | 141 (10.9%) | 76 (6.8%) |
| 25 to 29 Years | 22 (1.7%) | 75 (6.7%) |
| 30 to 34 Years | 33 (2.5%) | 115 (10.3%) |
| 35 to 39 Years | 112 (8.6%) | 43 (3.9%) |
| 40 to 44 Years | 44 (3.4%) | 54 (4.9%) |
| 45 to 49 Years | 71 (5.5%) | 65 (5.8%) |
| 50 to 54 Years | 87 (6.7%) | 138 (12.4%) |
| 55 to 59 Years | 120 (9.2%) | 37 (3.3%) |
| 60 to 64 Years | 139 (10.7%) | 69 (6.2%) |
| 65 to 69 Years | 31 (2.4%) | 39 (3.5%) |
| 70 to 74 Years | 55 (4.2%) | 79 (7.1%) |
| 75 to 79 Years | 20 (1.5%) | 8 (0.7%) |
| 80 to 84 Years | 39 (3.0%) | 9 (0.8%) |
| 85 Years and over | 0 (0.0%) | 23 (2.1%) |
| Total | 1,298 (100.0%) | 1,113 (100.0%) |
Families and Households in New Miami
Median Family Size in New Miami
The median family size in New Miami is 3.51 persons per family, with married-couple families (364 | 61.7%) accounting for the largest median family size of 3.67 persons per family. On the other hand, single female/mother families (174 | 29.5%) represent the smallest median family size with 3.24 persons per family.
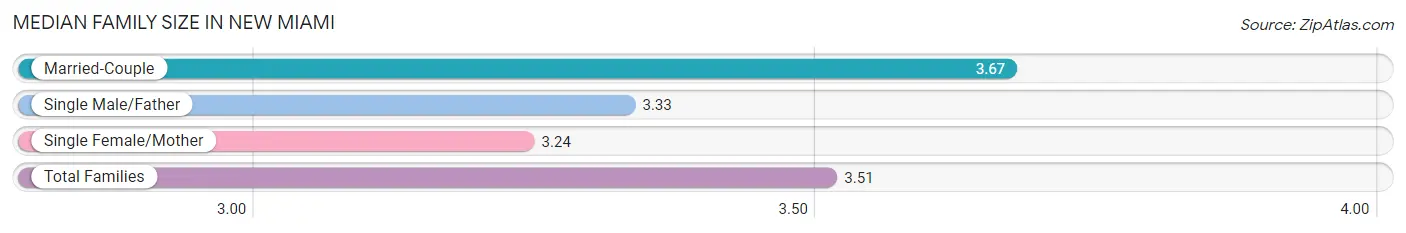
| Family Type | # Families | Family Size |
| Married-Couple | 364 (61.7%) | 3.67 |
| Single Male/Father | 52 (8.8%) | 3.33 |
| Single Female/Mother | 174 (29.5%) | 3.24 |
| Total Families | 590 (100.0%) | 3.51 |
Median Household Size in New Miami
The median household size in New Miami is 2.96 persons per household, with married-couple households (364 | 44.7%) accounting for the largest median household size of 3.69 persons per household. non-family households (225 | 27.6%) represent the smallest median household size with 1.16 persons per household.
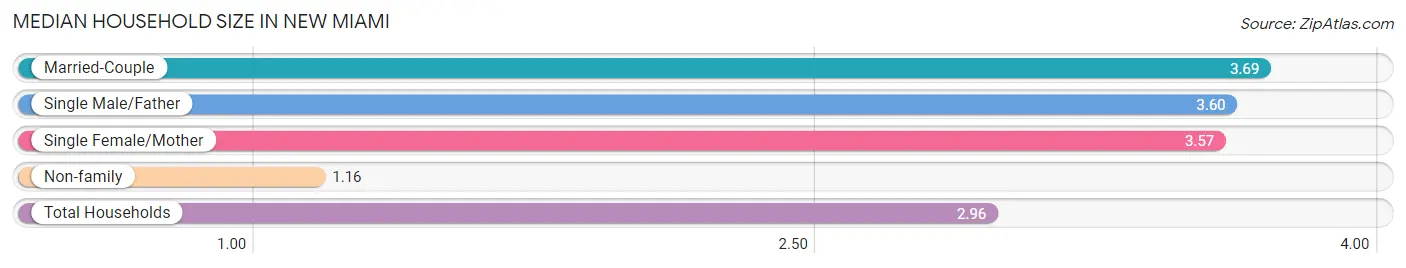
| Household Type | # Households | Household Size |
| Married-Couple | 364 (44.7%) | 3.69 |
| Single Male/Father | 52 (6.4%) | 3.60 |
| Single Female/Mother | 174 (21.3%) | 3.57 |
| Non-family | 225 (27.6%) | 1.16 |
| Total Households | 815 (100.0%) | 2.96 |
Household Size by Marriage Status in New Miami
Out of a total of 815 households in New Miami, 590 (72.4%) are family households, while 225 (27.6%) are nonfamily households. The most numerous type of family households are 2-person households, comprising 270, and the most common type of nonfamily households are 1-person households, comprising 190.
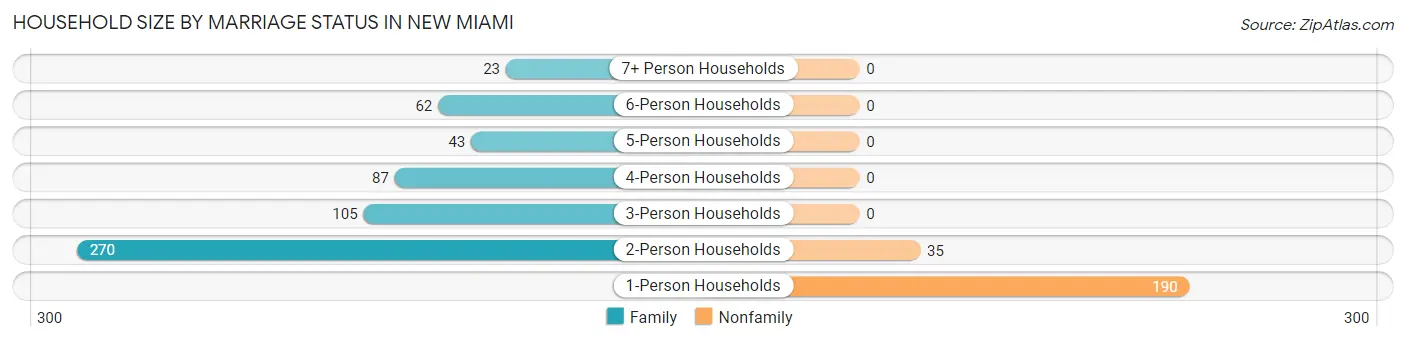
| Household Size | Family Households | Nonfamily Households |
| 1-Person Households | - | 190 (23.3%) |
| 2-Person Households | 270 (33.1%) | 35 (4.3%) |
| 3-Person Households | 105 (12.9%) | 0 (0.0%) |
| 4-Person Households | 87 (10.7%) | 0 (0.0%) |
| 5-Person Households | 43 (5.3%) | 0 (0.0%) |
| 6-Person Households | 62 (7.6%) | 0 (0.0%) |
| 7+ Person Households | 23 (2.8%) | 0 (0.0%) |
| Total | 590 (72.4%) | 225 (27.6%) |
Female Fertility in New Miami
Fertility by Age in New Miami
Average fertility rate in New Miami is 79.0 births per 1,000 women. Women in the age bracket of 35 to 50 years have the highest fertility rate with 99.0 births per 1,000 women. Women in the age bracket of 20 to 34 years acount for 55.6% of all women with births.
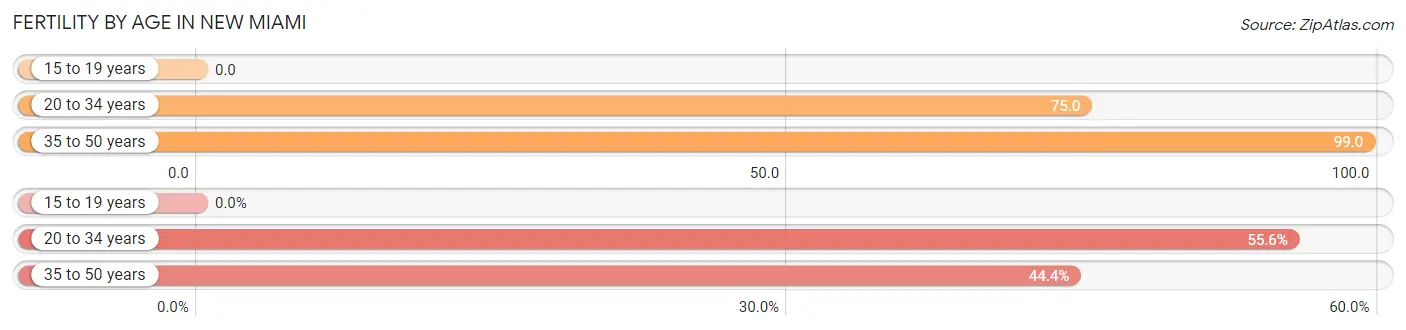
| Age Bracket | Women with Births | Births / 1,000 Women |
| 15 to 19 years | 0 (0.0%) | 0.0 |
| 20 to 34 years | 20 (55.6%) | 75.0 |
| 35 to 50 years | 16 (44.4%) | 99.0 |
| Total | 36 (100.0%) | 79.0 |
Fertility by Age by Marriage Status in New Miami
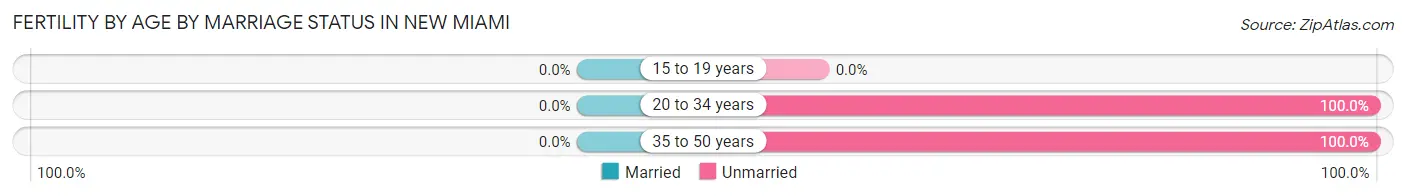
| Age Bracket | Married | Unmarried |
| 15 to 19 years | 0 (0.0%) | 0 (0.0%) |
| 20 to 34 years | 0 (0.0%) | 20 (100.0%) |
| 35 to 50 years | 0 (0.0%) | 16 (100.0%) |
| Total | 0 (0.0%) | 36 (100.0%) |
Fertility by Education in New Miami
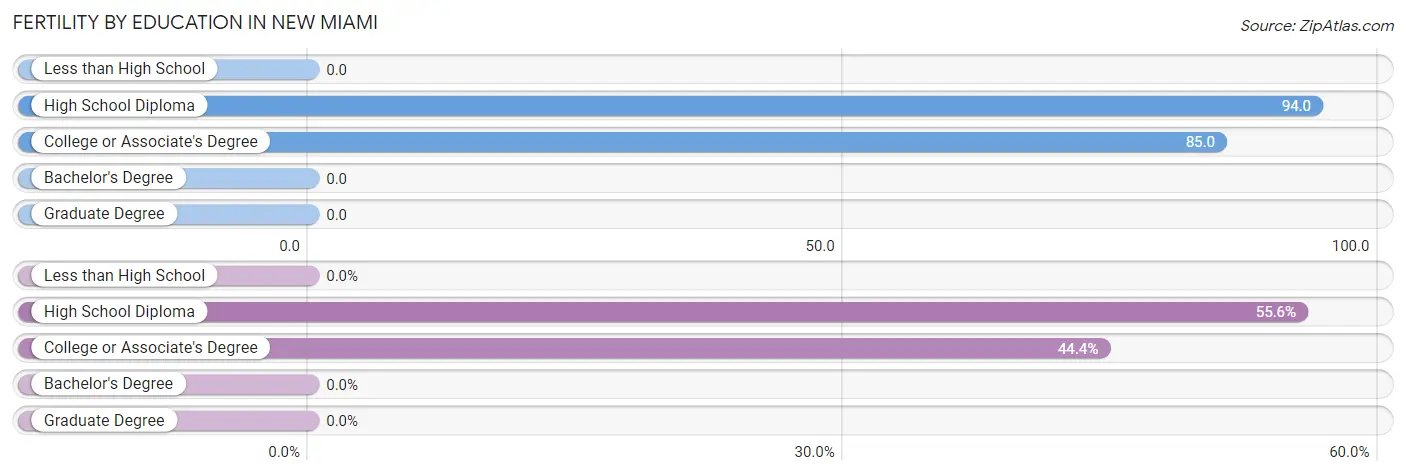
| Educational Attainment | Women with Births | Births / 1,000 Women |
| Less than High School | 0 (0.0%) | 0.0 |
| High School Diploma | 20 (55.6%) | 94.0 |
| College or Associate's Degree | 16 (44.4%) | 85.0 |
| Bachelor's Degree | 0 (0.0%) | 0.0 |
| Graduate Degree | 0 (0.0%) | 0.0 |
| Total | 36 (100.0%) | 79.0 |
Fertility by Education by Marriage Status in New Miami
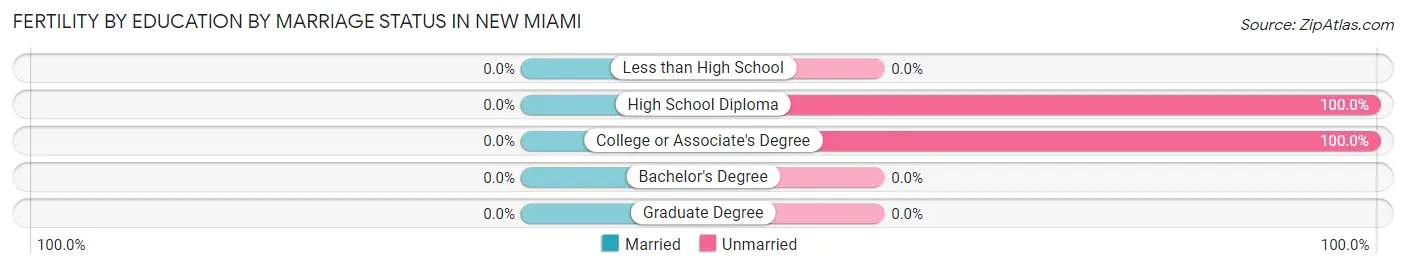
| Educational Attainment | Married | Unmarried |
| Less than High School | 0 (0.0%) | 0 (0.0%) |
| High School Diploma | 0 (0.0%) | 20 (100.0%) |
| College or Associate's Degree | 0 (0.0%) | 16 (100.0%) |
| Bachelor's Degree | 0 (0.0%) | 0 (0.0%) |
| Graduate Degree | 0 (0.0%) | 0 (0.0%) |
| Total | 0 (0.0%) | 36 (100.0%) |
Employment Characteristics in New Miami
Employment by Class of Employer in New Miami
Among the 939 employed individuals in New Miami, private company employees (737 | 78.5%), self-employed (not incorporated) (81 | 8.6%), and local government employees (56 | 6.0%) make up the most common classes of employment.
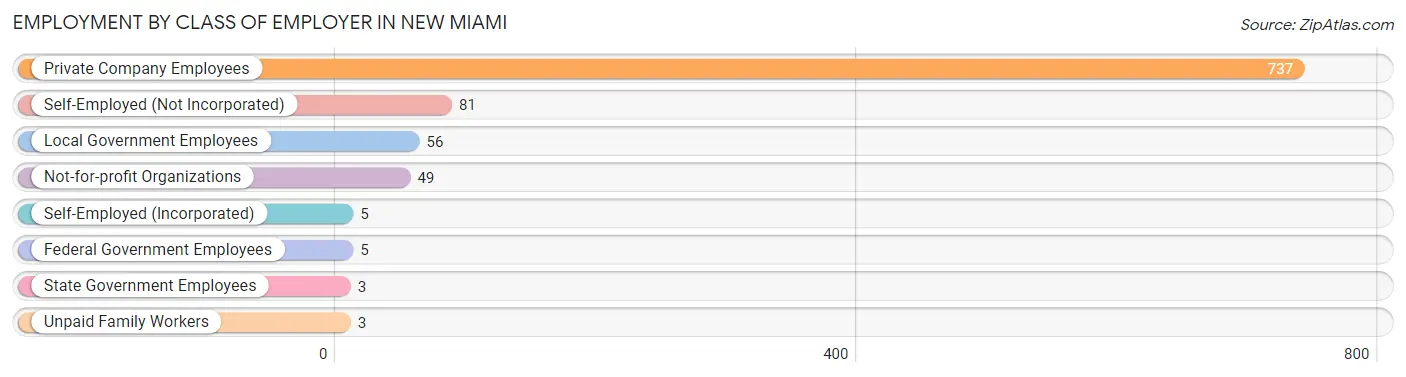
| Employer Class | # Employees | % Employees |
| Private Company Employees | 737 | 78.5% |
| Self-Employed (Incorporated) | 5 | 0.5% |
| Self-Employed (Not Incorporated) | 81 | 8.6% |
| Not-for-profit Organizations | 49 | 5.2% |
| Local Government Employees | 56 | 6.0% |
| State Government Employees | 3 | 0.3% |
| Federal Government Employees | 5 | 0.5% |
| Unpaid Family Workers | 3 | 0.3% |
| Total | 939 | 100.0% |
Employment Status by Age in New Miami
According to the labor force statistics for New Miami, out of the total population over 16 years of age (1,841), 61.9% or 1,140 individuals are in the labor force, with 16.8% or 192 of them unemployed. The age group with the highest labor force participation rate is 16 to 19 years, with 91.8% or 89 individuals in the labor force. Within the labor force, the 16 to 19 years age range has the highest percentage of unemployed individuals, with 38.2% or 34 of them being unemployed.
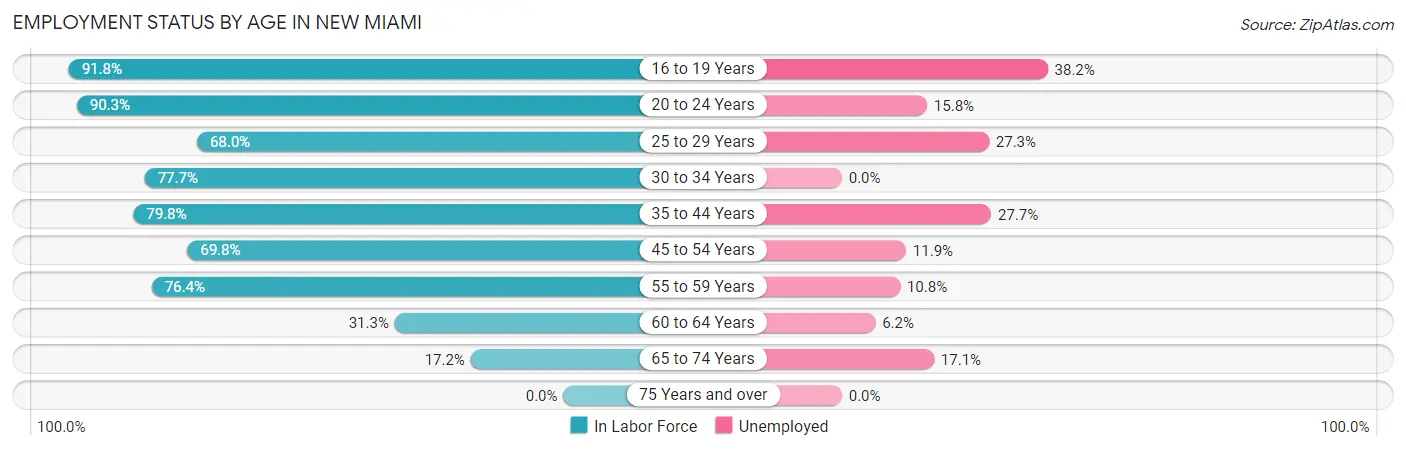
| Age Bracket | In Labor Force | Unemployed |
| 16 to 19 Years | 89 (91.8%) | 34 (38.2%) |
| 20 to 24 Years | 196 (90.3%) | 31 (15.8%) |
| 25 to 29 Years | 66 (68.0%) | 18 (27.3%) |
| 30 to 34 Years | 115 (77.7%) | 0 (0.0%) |
| 35 to 44 Years | 202 (79.8%) | 56 (27.7%) |
| 45 to 54 Years | 252 (69.8%) | 30 (11.9%) |
| 55 to 59 Years | 120 (76.4%) | 13 (10.8%) |
| 60 to 64 Years | 65 (31.3%) | 4 (6.2%) |
| 65 to 74 Years | 35 (17.2%) | 6 (17.1%) |
| 75 Years and over | 0 (0.0%) | 0 (0.0%) |
| Total | 1,140 (61.9%) | 192 (16.8%) |
Employment Status by Educational Attainment in New Miami
According to labor force statistics for New Miami, 67.0% of individuals (820) out of the total population between 25 and 64 years of age (1,224) are in the labor force, with 14.8% or 121 of them being unemployed. The group with the highest labor force participation rate are those with the educational attainment of college / associate degree, with 82.7% or 224 individuals in the labor force. Within the labor force, individuals with high school diploma education have the highest percentage of unemployment, with 17.6% or 75 of them being unemployed.
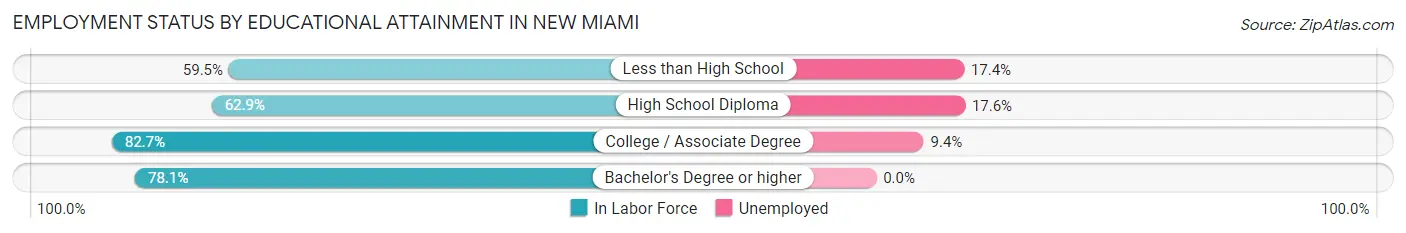
| Educational Attainment | In Labor Force | Unemployed |
| Less than High School | 144 (59.5%) | 42 (17.4%) |
| High School Diploma | 427 (62.9%) | 120 (17.6%) |
| College / Associate Degree | 224 (82.7%) | 25 (9.4%) |
| Bachelor's Degree or higher | 25 (78.1%) | 0 (0.0%) |
| Total | 820 (67.0%) | 181 (14.8%) |
Employment Occupations by Sex in New Miami
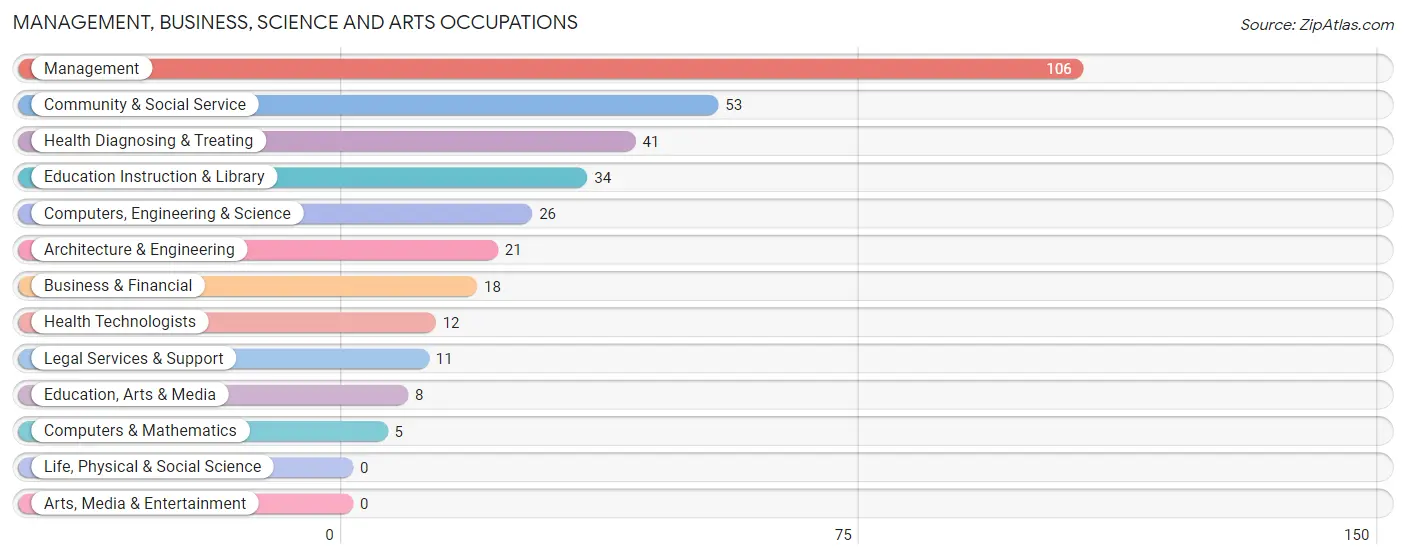
Management, Business, Science and Arts Occupations
The most common Management, Business, Science and Arts occupations in New Miami are Management (106 | 11.2%), Community & Social Service (53 | 5.6%), Health Diagnosing & Treating (41 | 4.3%), Education Instruction & Library (34 | 3.6%), and Computers, Engineering & Science (26 | 2.7%).
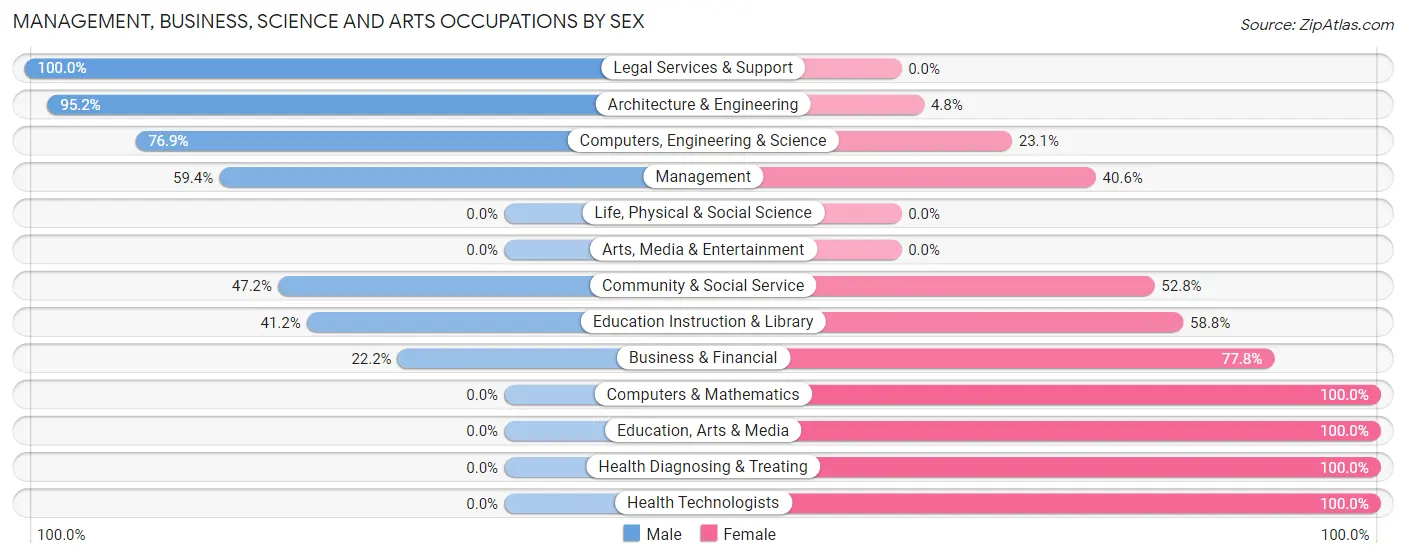
Management, Business, Science and Arts Occupations by Sex
Within the Management, Business, Science and Arts occupations in New Miami, the most male-oriented occupations are Legal Services & Support (100.0%), Architecture & Engineering (95.2%), and Computers, Engineering & Science (76.9%), while the most female-oriented occupations are Computers & Mathematics (100.0%), Education, Arts & Media (100.0%), and Health Diagnosing & Treating (100.0%).
| Occupation | Male | Female |
| Management | 63 (59.4%) | 43 (40.6%) |
| Business & Financial | 4 (22.2%) | 14 (77.8%) |
| Computers, Engineering & Science | 20 (76.9%) | 6 (23.1%) |
| Computers & Mathematics | 0 (0.0%) | 5 (100.0%) |
| Architecture & Engineering | 20 (95.2%) | 1 (4.8%) |
| Life, Physical & Social Science | 0 (0.0%) | 0 (0.0%) |
| Community & Social Service | 25 (47.2%) | 28 (52.8%) |
| Education, Arts & Media | 0 (0.0%) | 8 (100.0%) |
| Legal Services & Support | 11 (100.0%) | 0 (0.0%) |
| Education Instruction & Library | 14 (41.2%) | 20 (58.8%) |
| Arts, Media & Entertainment | 0 (0.0%) | 0 (0.0%) |
| Health Diagnosing & Treating | 0 (0.0%) | 41 (100.0%) |
| Health Technologists | 0 (0.0%) | 12 (100.0%) |
| Total (Category) | 112 (45.9%) | 132 (54.1%) |
| Total (Overall) | 536 (56.5%) | 412 (43.5%) |
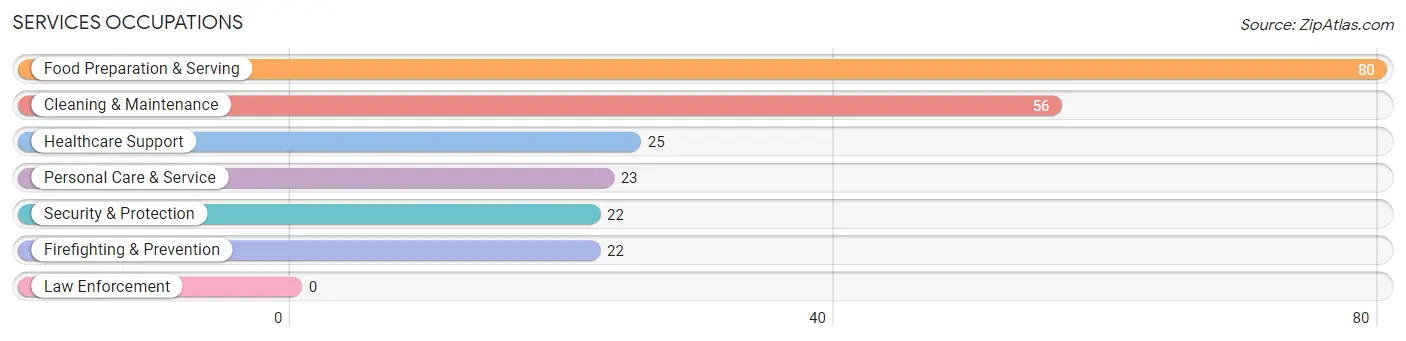
Services Occupations
The most common Services occupations in New Miami are Food Preparation & Serving (80 | 8.4%), Cleaning & Maintenance (56 | 5.9%), Healthcare Support (25 | 2.6%), Personal Care & Service (23 | 2.4%), and Security & Protection (22 | 2.3%).
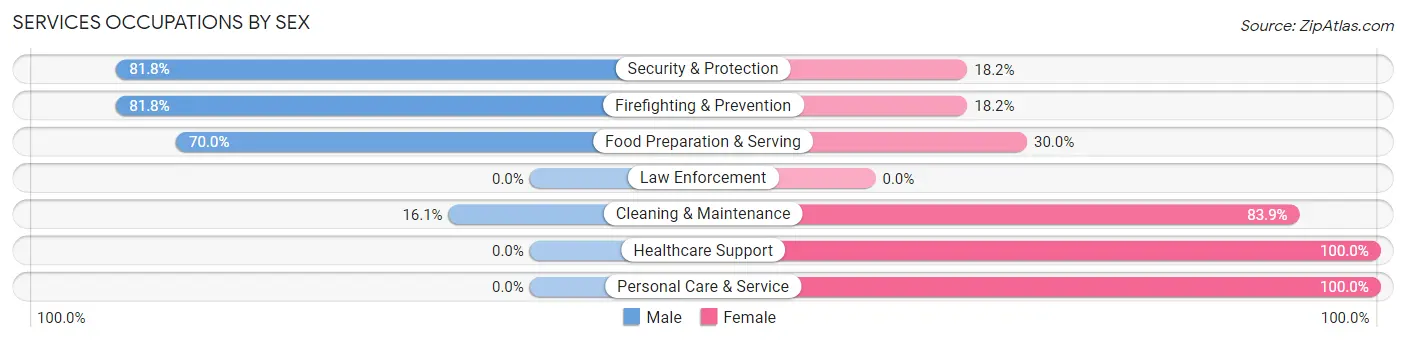
Services Occupations by Sex
Within the Services occupations in New Miami, the most male-oriented occupations are Security & Protection (81.8%), Firefighting & Prevention (81.8%), and Food Preparation & Serving (70.0%), while the most female-oriented occupations are Healthcare Support (100.0%), Personal Care & Service (100.0%), and Cleaning & Maintenance (83.9%).
| Occupation | Male | Female |
| Healthcare Support | 0 (0.0%) | 25 (100.0%) |
| Security & Protection | 18 (81.8%) | 4 (18.2%) |
| Firefighting & Prevention | 18 (81.8%) | 4 (18.2%) |
| Law Enforcement | 0 (0.0%) | 0 (0.0%) |
| Food Preparation & Serving | 56 (70.0%) | 24 (30.0%) |
| Cleaning & Maintenance | 9 (16.1%) | 47 (83.9%) |
| Personal Care & Service | 0 (0.0%) | 23 (100.0%) |
| Total (Category) | 83 (40.3%) | 123 (59.7%) |
| Total (Overall) | 536 (56.5%) | 412 (43.5%) |
Sales and Office Occupations
The most common Sales and Office occupations in New Miami are Sales & Related (71 | 7.5%), and Office & Administration (71 | 7.5%).
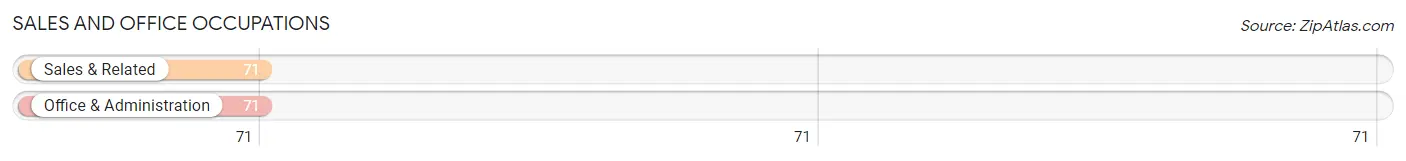
Sales and Office Occupations by Sex

| Occupation | Male | Female |
| Sales & Related | 28 (39.4%) | 43 (60.6%) |
| Office & Administration | 8 (11.3%) | 63 (88.7%) |
| Total (Category) | 36 (25.4%) | 106 (74.7%) |
| Total (Overall) | 536 (56.5%) | 412 (43.5%) |
Natural Resources, Construction and Maintenance Occupations
The most common Natural Resources, Construction and Maintenance occupations in New Miami are Construction & Extraction (69 | 7.3%), Installation, Maintenance & Repair (60 | 6.3%), and Farming, Fishing & Forestry (3 | 0.3%).
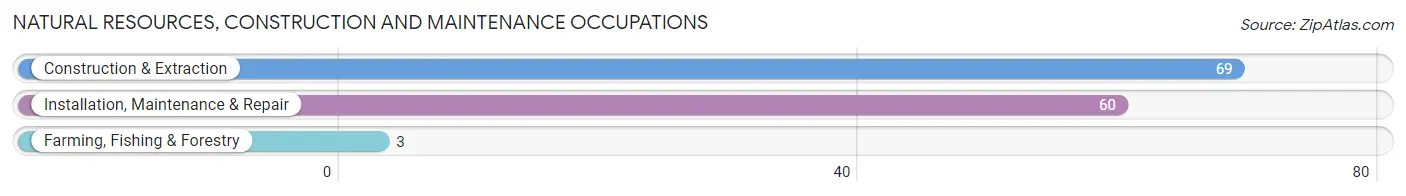
Natural Resources, Construction and Maintenance Occupations by Sex
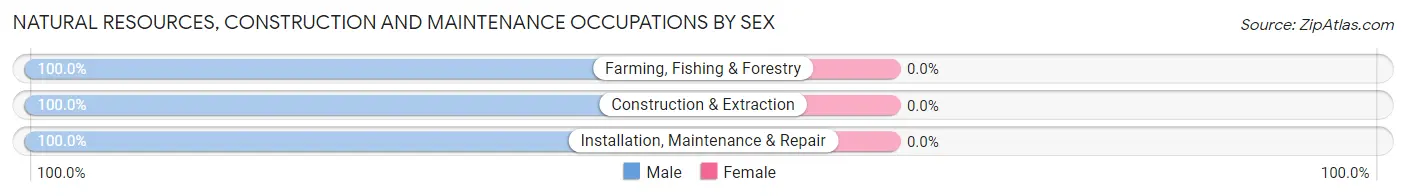
| Occupation | Male | Female |
| Farming, Fishing & Forestry | 3 (100.0%) | 0 (0.0%) |
| Construction & Extraction | 69 (100.0%) | 0 (0.0%) |
| Installation, Maintenance & Repair | 60 (100.0%) | 0 (0.0%) |
| Total (Category) | 132 (100.0%) | 0 (0.0%) |
| Total (Overall) | 536 (56.5%) | 412 (43.5%) |
Production, Transportation and Moving Occupations
The most common Production, Transportation and Moving occupations in New Miami are Material Moving (94 | 9.9%), Production (92 | 9.7%), and Transportation (38 | 4.0%).
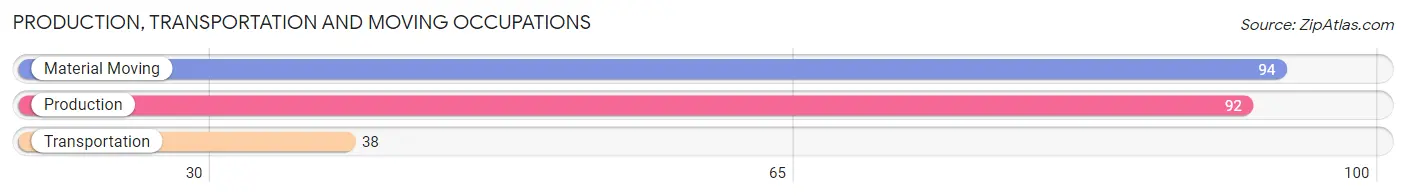
Production, Transportation and Moving Occupations by Sex
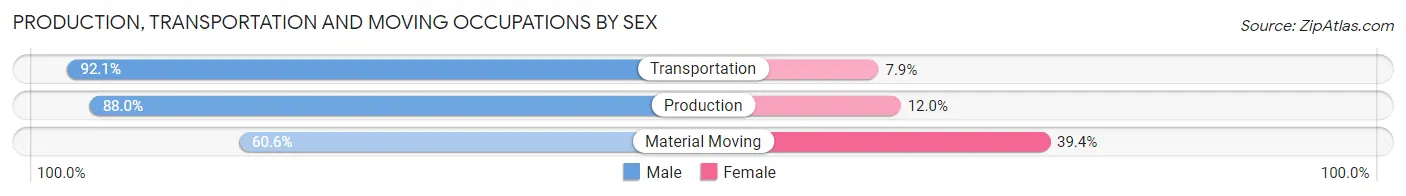
| Occupation | Male | Female |
| Production | 81 (88.0%) | 11 (12.0%) |
| Transportation | 35 (92.1%) | 3 (7.9%) |
| Material Moving | 57 (60.6%) | 37 (39.4%) |
| Total (Category) | 173 (77.2%) | 51 (22.8%) |
| Total (Overall) | 536 (56.5%) | 412 (43.5%) |
Employment Industries by Sex in New Miami
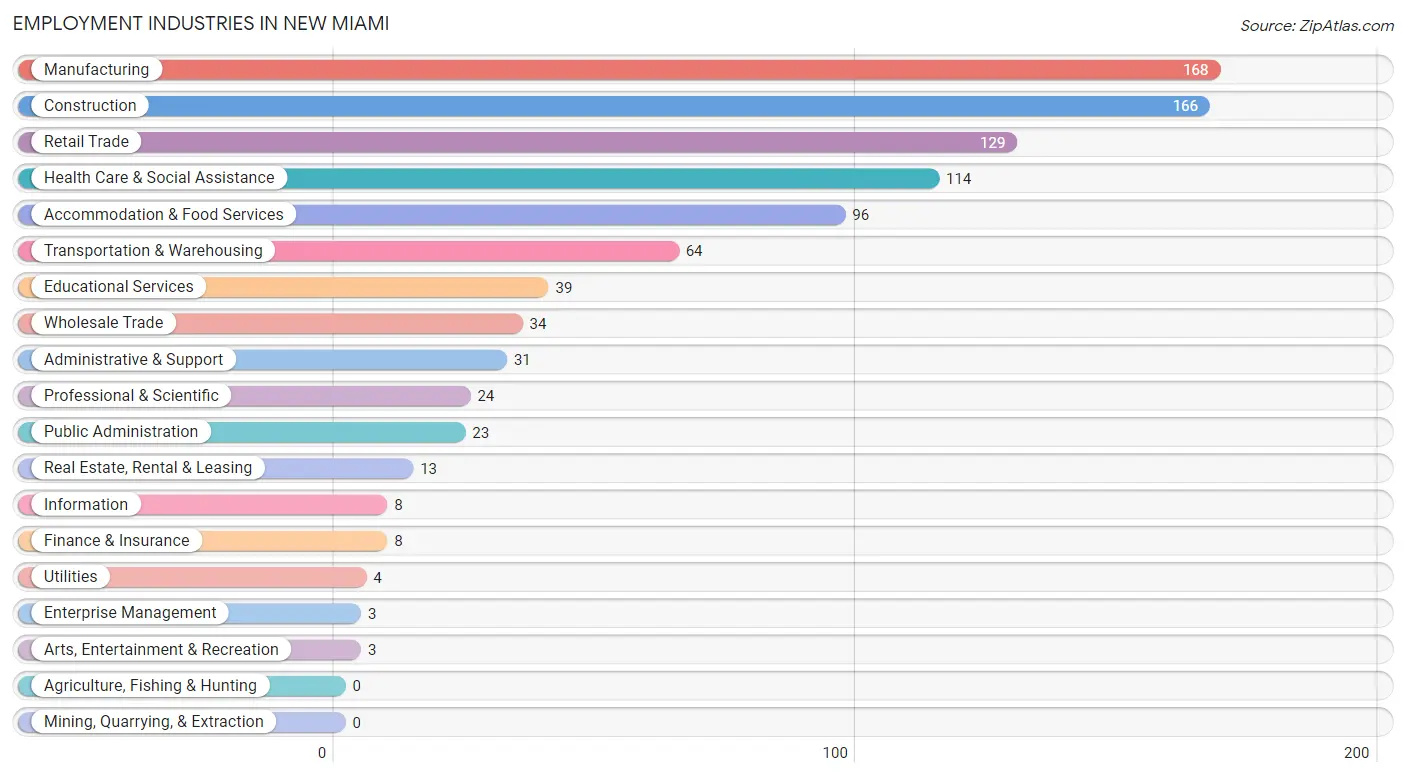
Employment Industries in New Miami
The major employment industries in New Miami include Manufacturing (168 | 17.7%), Construction (166 | 17.5%), Retail Trade (129 | 13.6%), Health Care & Social Assistance (114 | 12.0%), and Accommodation & Food Services (96 | 10.1%).
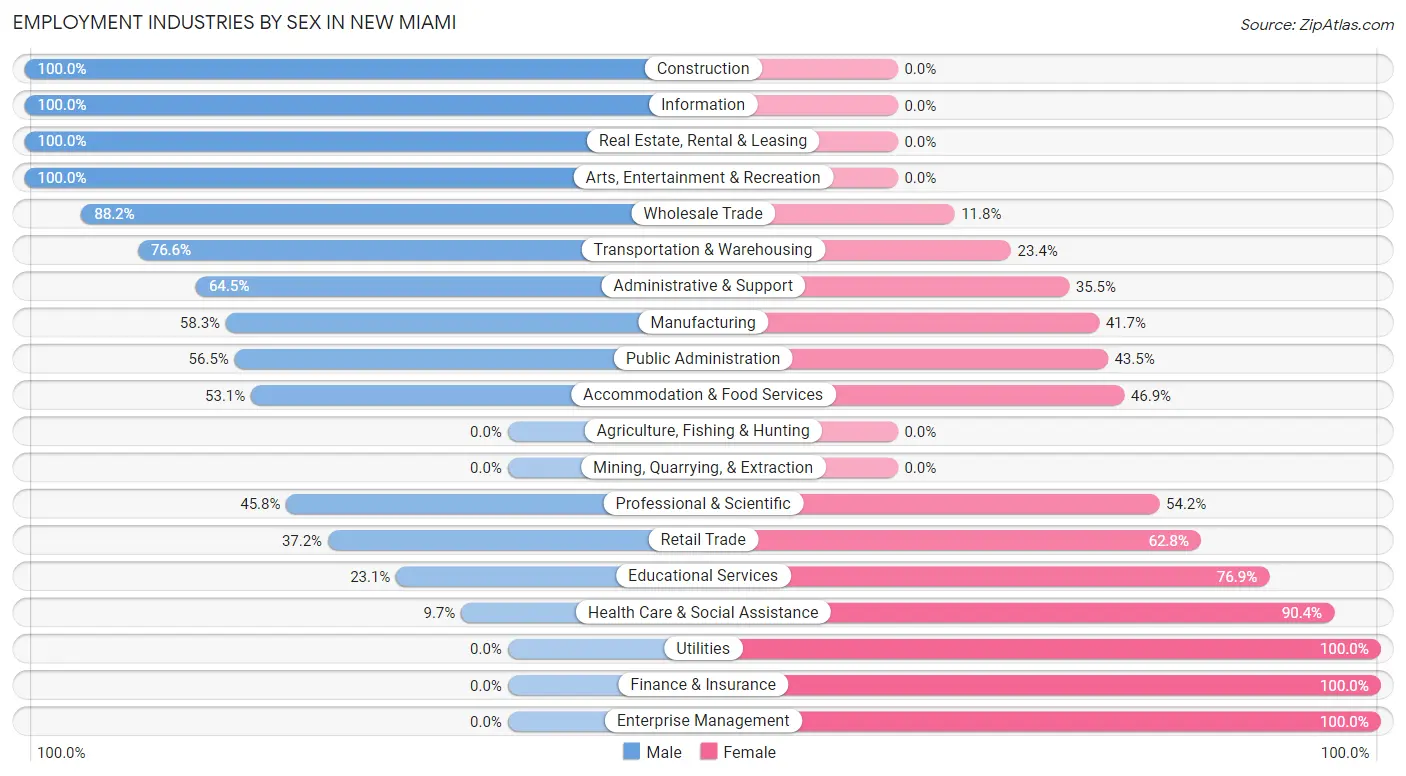
Employment Industries by Sex in New Miami
The New Miami industries that see more men than women are Construction (100.0%), Information (100.0%), and Real Estate, Rental & Leasing (100.0%), whereas the industries that tend to have a higher number of women are Utilities (100.0%), Finance & Insurance (100.0%), and Enterprise Management (100.0%).
| Industry | Male | Female |
| Agriculture, Fishing & Hunting | 0 (0.0%) | 0 (0.0%) |
| Mining, Quarrying, & Extraction | 0 (0.0%) | 0 (0.0%) |
| Construction | 166 (100.0%) | 0 (0.0%) |
| Manufacturing | 98 (58.3%) | 70 (41.7%) |
| Wholesale Trade | 30 (88.2%) | 4 (11.8%) |
| Retail Trade | 48 (37.2%) | 81 (62.8%) |
| Transportation & Warehousing | 49 (76.6%) | 15 (23.4%) |
| Utilities | 0 (0.0%) | 4 (100.0%) |
| Information | 8 (100.0%) | 0 (0.0%) |
| Finance & Insurance | 0 (0.0%) | 8 (100.0%) |
| Real Estate, Rental & Leasing | 13 (100.0%) | 0 (0.0%) |
| Professional & Scientific | 11 (45.8%) | 13 (54.2%) |
| Enterprise Management | 0 (0.0%) | 3 (100.0%) |
| Administrative & Support | 20 (64.5%) | 11 (35.5%) |
| Educational Services | 9 (23.1%) | 30 (76.9%) |
| Health Care & Social Assistance | 11 (9.7%) | 103 (90.3%) |
| Arts, Entertainment & Recreation | 3 (100.0%) | 0 (0.0%) |
| Accommodation & Food Services | 51 (53.1%) | 45 (46.9%) |
| Public Administration | 13 (56.5%) | 10 (43.5%) |
| Total | 536 (56.5%) | 412 (43.5%) |
Education in New Miami
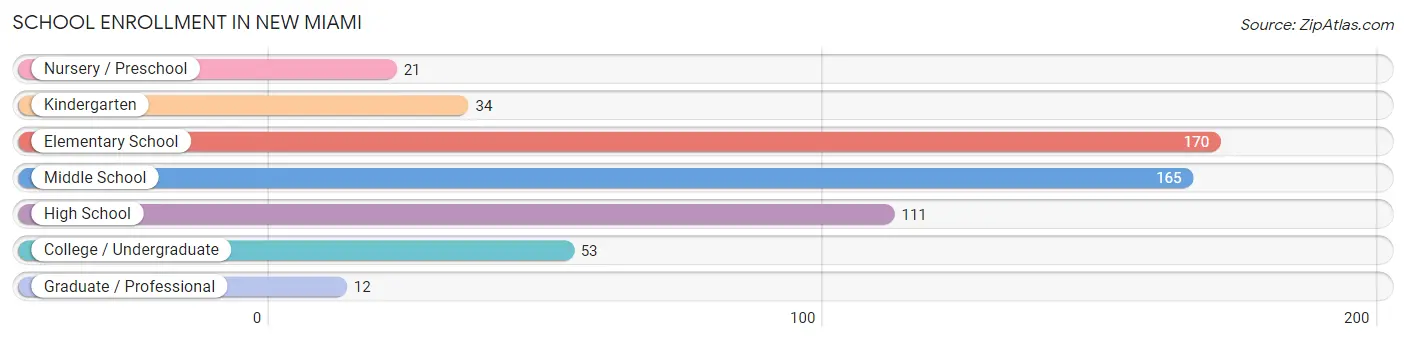
School Enrollment in New Miami
The most common levels of schooling among the 566 students in New Miami are elementary school (170 | 30.0%), middle school (165 | 29.1%), and high school (111 | 19.6%).
| School Level | # Students | % Students |
| Nursery / Preschool | 21 | 3.7% |
| Kindergarten | 34 | 6.0% |
| Elementary School | 170 | 30.0% |
| Middle School | 165 | 29.1% |
| High School | 111 | 19.6% |
| College / Undergraduate | 53 | 9.4% |
| Graduate / Professional | 12 | 2.1% |
| Total | 566 | 100.0% |
School Enrollment by Age by Funding Source in New Miami
Out of a total of 566 students who are enrolled in schools in New Miami, 25 (4.4%) attend a private institution, while the remaining 541 (95.6%) are enrolled in public schools. The age group of 25 to 34 year olds has the highest likelihood of being enrolled in private schools, with 14 (100.0% in the age bracket) enrolled. Conversely, the age group of 3 to 4 year olds has the lowest likelihood of being enrolled in a private school, with 10 (100.0% in the age bracket) attending a public institution.
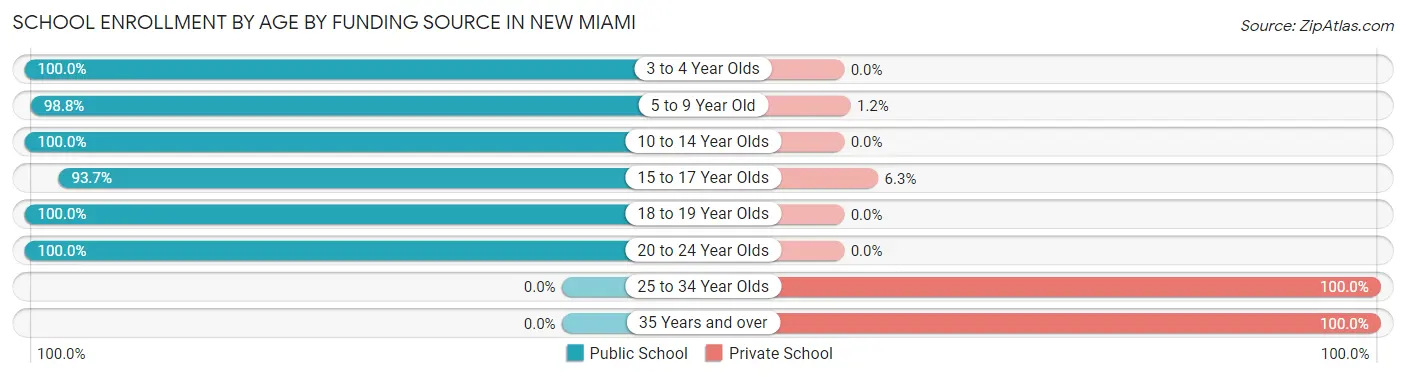
| Age Bracket | Public School | Private School |
| 3 to 4 Year Olds | 10 (100.0%) | 0 (0.0%) |
| 5 to 9 Year Old | 167 (98.8%) | 2 (1.2%) |
| 10 to 14 Year Olds | 225 (100.0%) | 0 (0.0%) |
| 15 to 17 Year Olds | 74 (93.7%) | 5 (6.3%) |
| 18 to 19 Year Olds | 18 (100.0%) | 0 (0.0%) |
| 20 to 24 Year Olds | 47 (100.0%) | 0 (0.0%) |
| 25 to 34 Year Olds | 0 (0.0%) | 14 (100.0%) |
| 35 Years and over | 0 (0.0%) | 4 (100.0%) |
| Total | 541 (95.6%) | 25 (4.4%) |
Educational Attainment by Field of Study in New Miami
Science & technology (12 | 37.5%), business (7 | 21.9%), computers & mathematics (5 | 15.6%), bio, nature & agricultural (4 | 12.5%), and liberal arts & history (4 | 12.5%) are the most common fields of study among 32 individuals in New Miami who have obtained a bachelor's degree or higher.
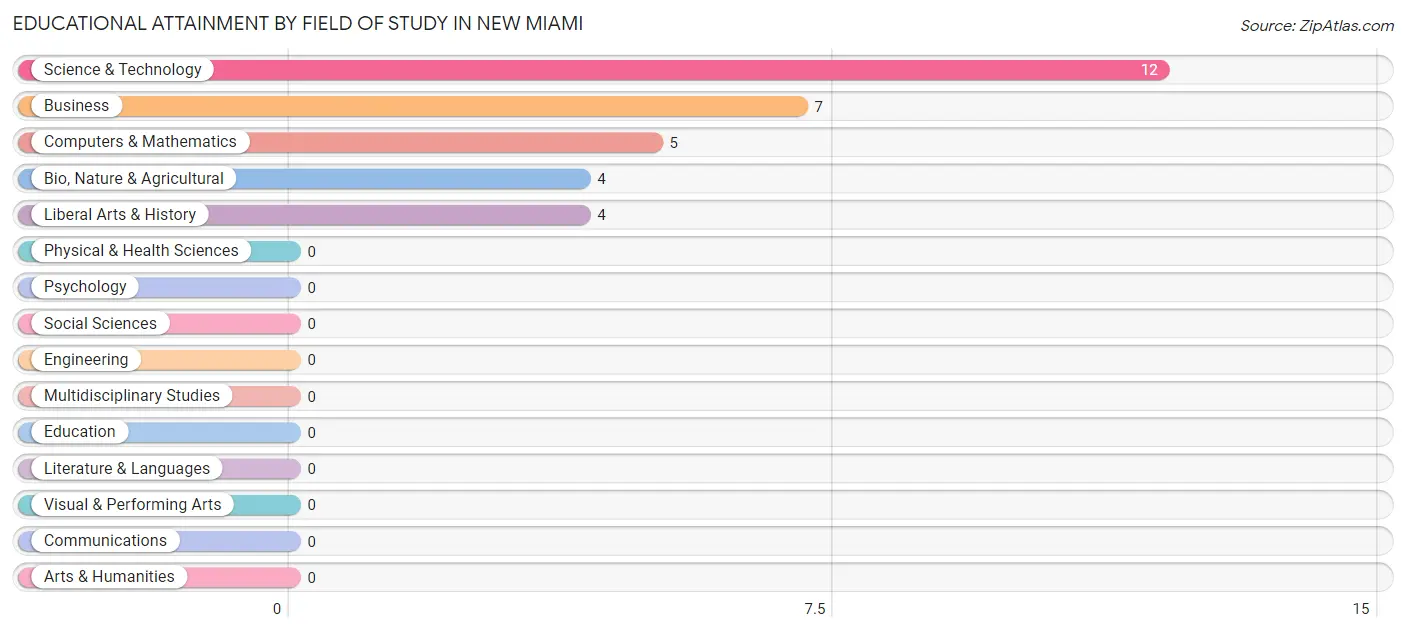
| Field of Study | # Graduates | % Graduates |
| Computers & Mathematics | 5 | 15.6% |
| Bio, Nature & Agricultural | 4 | 12.5% |
| Physical & Health Sciences | 0 | 0.0% |
| Psychology | 0 | 0.0% |
| Social Sciences | 0 | 0.0% |
| Engineering | 0 | 0.0% |
| Multidisciplinary Studies | 0 | 0.0% |
| Science & Technology | 12 | 37.5% |
| Business | 7 | 21.9% |
| Education | 0 | 0.0% |
| Literature & Languages | 0 | 0.0% |
| Liberal Arts & History | 4 | 12.5% |
| Visual & Performing Arts | 0 | 0.0% |
| Communications | 0 | 0.0% |
| Arts & Humanities | 0 | 0.0% |
| Total | 32 | 100.0% |
Transportation & Commute in New Miami
Vehicle Availability by Sex in New Miami
The most prevalent vehicle ownership categories in New Miami are males with 2 vehicles (177, accounting for 33.6%) and females with 2 vehicles (199, making up 43.0%).
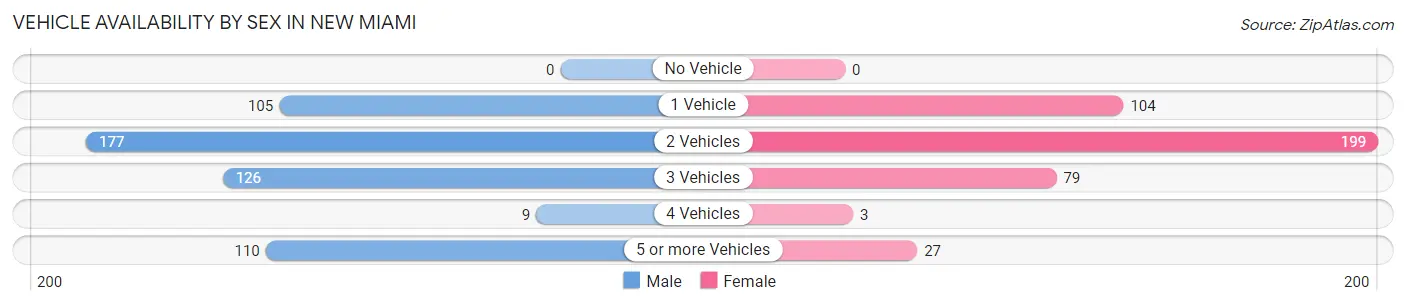
| Vehicles Available | Male | Female |
| No Vehicle | 0 (0.0%) | 0 (0.0%) |
| 1 Vehicle | 105 (19.9%) | 104 (25.2%) |
| 2 Vehicles | 177 (33.6%) | 199 (48.3%) |
| 3 Vehicles | 126 (23.9%) | 79 (19.2%) |
| 4 Vehicles | 9 (1.7%) | 3 (0.7%) |
| 5 or more Vehicles | 110 (20.9%) | 27 (6.6%) |
| Total | 527 (100.0%) | 412 (100.0%) |
Commute Time in New Miami
The most frequently occuring commute durations in New Miami are 20 to 24 minutes (192 commuters, 21.0%), 30 to 34 minutes (171 commuters, 18.7%), and 15 to 19 minutes (153 commuters, 16.7%).
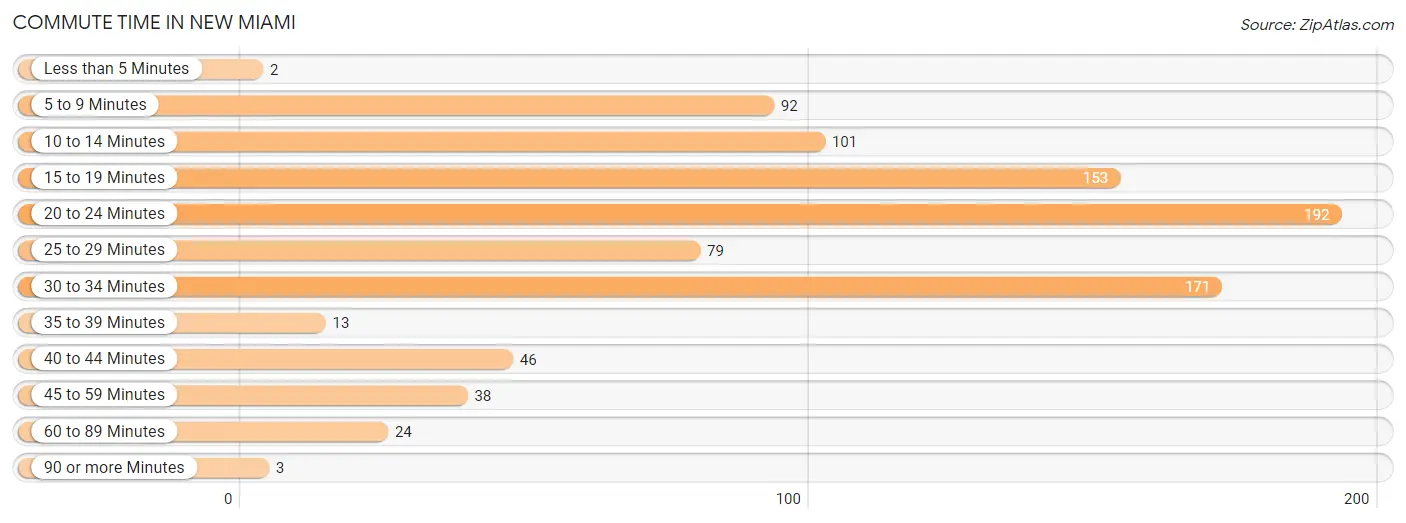
| Commute Time | # Commuters | % Commuters |
| Less than 5 Minutes | 2 | 0.2% |
| 5 to 9 Minutes | 92 | 10.1% |
| 10 to 14 Minutes | 101 | 11.1% |
| 15 to 19 Minutes | 153 | 16.7% |
| 20 to 24 Minutes | 192 | 21.0% |
| 25 to 29 Minutes | 79 | 8.6% |
| 30 to 34 Minutes | 171 | 18.7% |
| 35 to 39 Minutes | 13 | 1.4% |
| 40 to 44 Minutes | 46 | 5.0% |
| 45 to 59 Minutes | 38 | 4.2% |
| 60 to 89 Minutes | 24 | 2.6% |
| 90 or more Minutes | 3 | 0.3% |
Commute Time by Sex in New Miami
The most common commute times in New Miami are 20 to 24 minutes (118 commuters, 23.0%) for males and 20 to 24 minutes (74 commuters, 18.4%) for females.
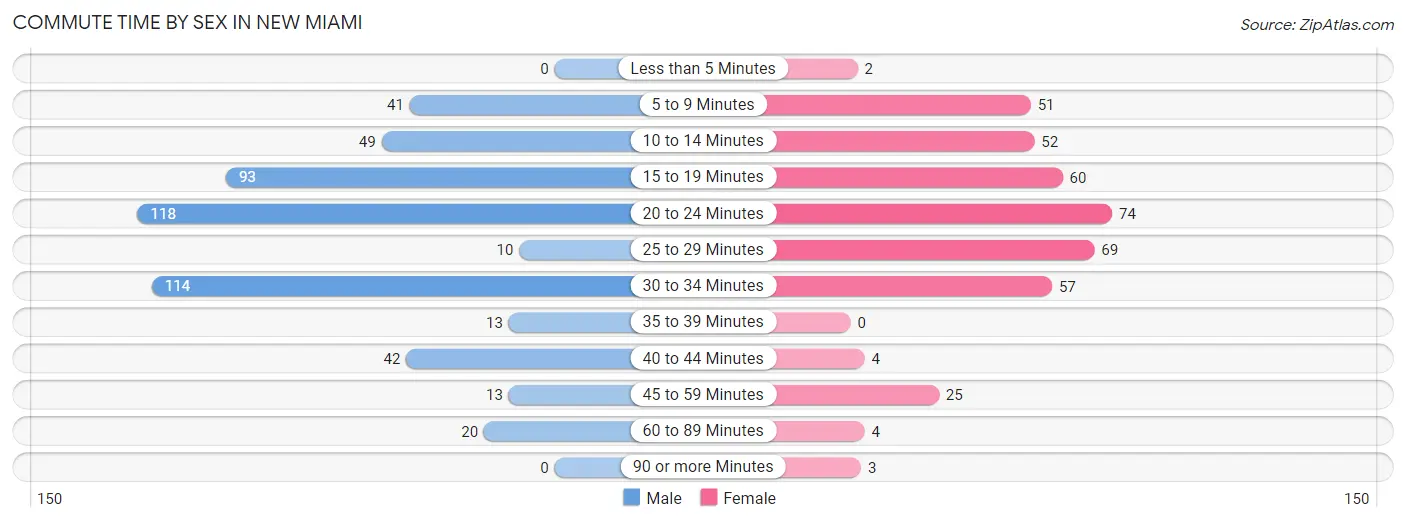
| Commute Time | Male | Female |
| Less than 5 Minutes | 0 (0.0%) | 2 (0.5%) |
| 5 to 9 Minutes | 41 (8.0%) | 51 (12.7%) |
| 10 to 14 Minutes | 49 (9.6%) | 52 (13.0%) |
| 15 to 19 Minutes | 93 (18.1%) | 60 (15.0%) |
| 20 to 24 Minutes | 118 (23.0%) | 74 (18.4%) |
| 25 to 29 Minutes | 10 (1.9%) | 69 (17.2%) |
| 30 to 34 Minutes | 114 (22.2%) | 57 (14.2%) |
| 35 to 39 Minutes | 13 (2.5%) | 0 (0.0%) |
| 40 to 44 Minutes | 42 (8.2%) | 4 (1.0%) |
| 45 to 59 Minutes | 13 (2.5%) | 25 (6.2%) |
| 60 to 89 Minutes | 20 (3.9%) | 4 (1.0%) |
| 90 or more Minutes | 0 (0.0%) | 3 (0.7%) |
Time of Departure to Work by Sex in New Miami
The most frequent times of departure to work in New Miami are 7:00 AM to 7:29 AM (101, 19.7%) for males and 8:00 AM to 8:29 AM (63, 15.7%) for females.
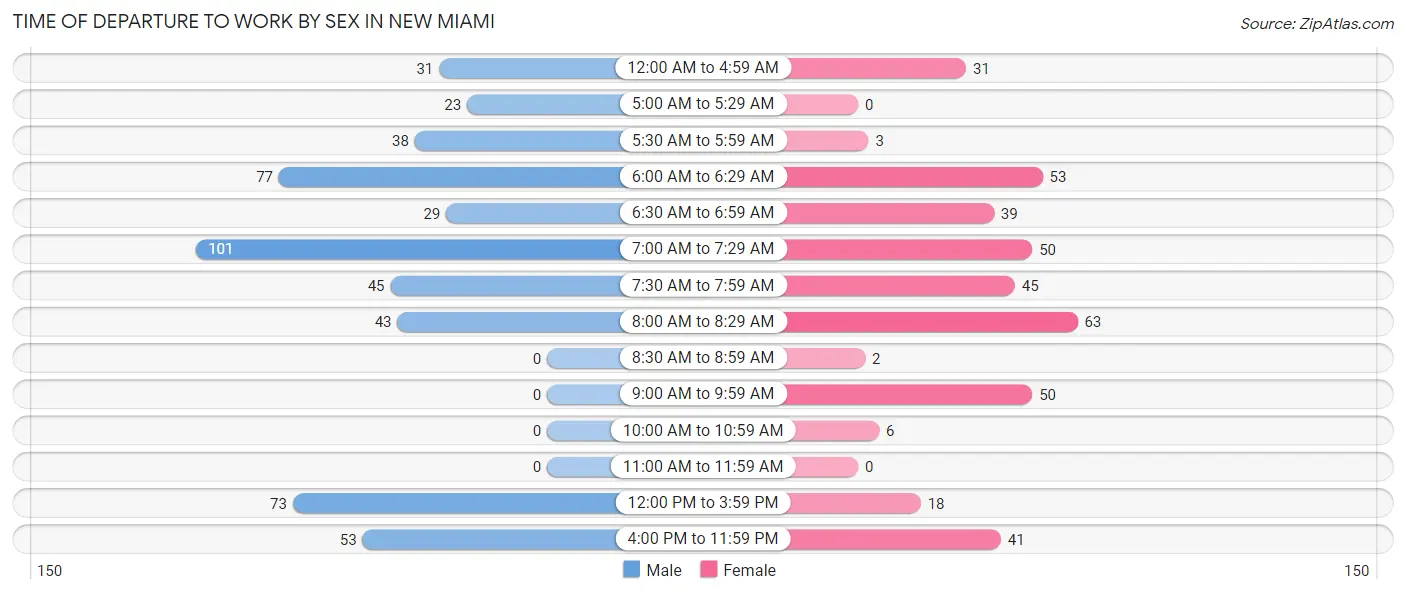
| Time of Departure | Male | Female |
| 12:00 AM to 4:59 AM | 31 (6.0%) | 31 (7.7%) |
| 5:00 AM to 5:29 AM | 23 (4.5%) | 0 (0.0%) |
| 5:30 AM to 5:59 AM | 38 (7.4%) | 3 (0.7%) |
| 6:00 AM to 6:29 AM | 77 (15.0%) | 53 (13.2%) |
| 6:30 AM to 6:59 AM | 29 (5.7%) | 39 (9.7%) |
| 7:00 AM to 7:29 AM | 101 (19.7%) | 50 (12.5%) |
| 7:30 AM to 7:59 AM | 45 (8.8%) | 45 (11.2%) |
| 8:00 AM to 8:29 AM | 43 (8.4%) | 63 (15.7%) |
| 8:30 AM to 8:59 AM | 0 (0.0%) | 2 (0.5%) |
| 9:00 AM to 9:59 AM | 0 (0.0%) | 50 (12.5%) |
| 10:00 AM to 10:59 AM | 0 (0.0%) | 6 (1.5%) |
| 11:00 AM to 11:59 AM | 0 (0.0%) | 0 (0.0%) |
| 12:00 PM to 3:59 PM | 73 (14.2%) | 18 (4.5%) |
| 4:00 PM to 11:59 PM | 53 (10.3%) | 41 (10.2%) |
| Total | 513 (100.0%) | 401 (100.0%) |
Housing Occupancy in New Miami
Occupancy by Ownership in New Miami
Of the total 815 dwellings in New Miami, owner-occupied units account for 405 (49.7%), while renter-occupied units make up 410 (50.3%).
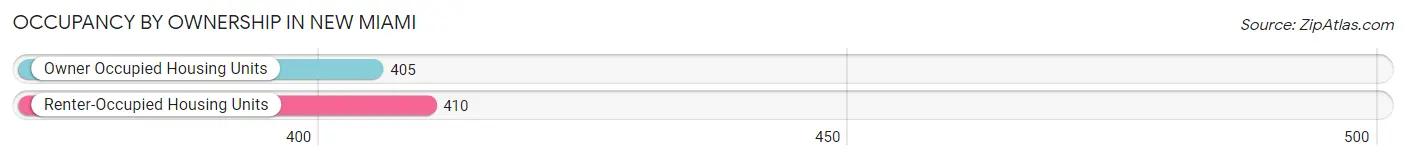
| Occupancy | # Housing Units | % Housing Units |
| Owner Occupied Housing Units | 405 | 49.7% |
| Renter-Occupied Housing Units | 410 | 50.3% |
| Total Occupied Housing Units | 815 | 100.0% |
Occupancy by Household Size in New Miami
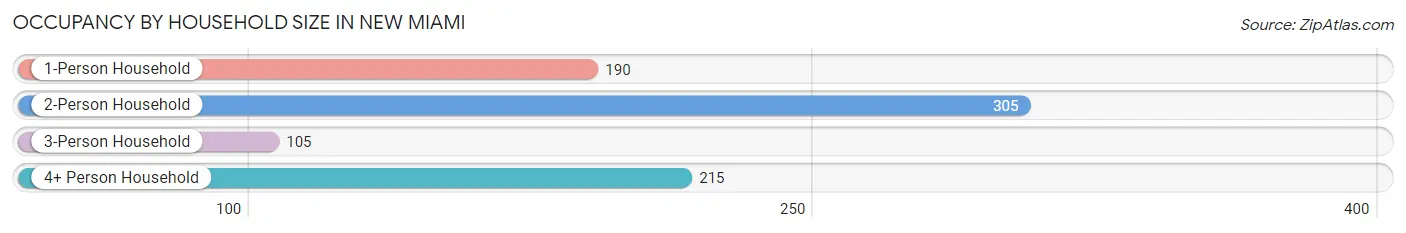
| Household Size | # Housing Units | % Housing Units |
| 1-Person Household | 190 | 23.3% |
| 2-Person Household | 305 | 37.4% |
| 3-Person Household | 105 | 12.9% |
| 4+ Person Household | 215 | 26.4% |
| Total Housing Units | 815 | 100.0% |
Occupancy by Ownership by Household Size in New Miami
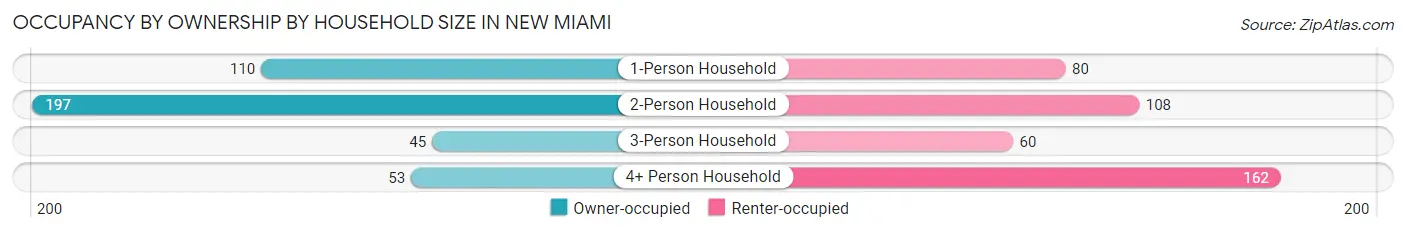
| Household Size | Owner-occupied | Renter-occupied |
| 1-Person Household | 110 (57.9%) | 80 (42.1%) |
| 2-Person Household | 197 (64.6%) | 108 (35.4%) |
| 3-Person Household | 45 (42.9%) | 60 (57.1%) |
| 4+ Person Household | 53 (24.6%) | 162 (75.3%) |
| Total Housing Units | 405 (49.7%) | 410 (50.3%) |
Occupancy by Educational Attainment in New Miami
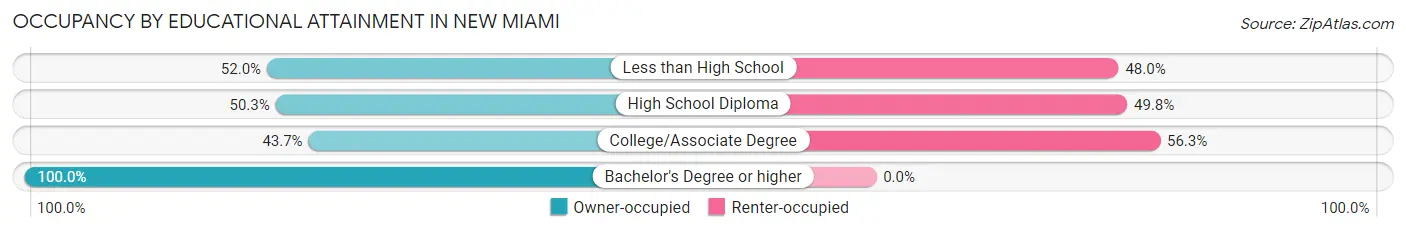
| Household Size | Owner-occupied | Renter-occupied |
| Less than High School | 106 (52.0%) | 98 (48.0%) |
| High School Diploma | 202 (50.2%) | 200 (49.7%) |
| College/Associate Degree | 87 (43.7%) | 112 (56.3%) |
| Bachelor's Degree or higher | 10 (100.0%) | 0 (0.0%) |
Occupancy by Age of Householder in New Miami
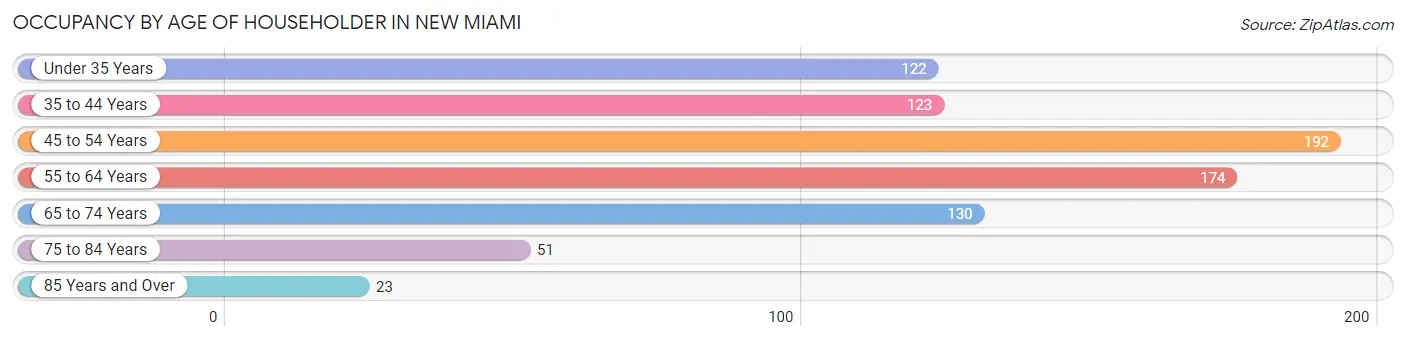
| Age Bracket | # Households | % Households |
| Under 35 Years | 122 | 15.0% |
| 35 to 44 Years | 123 | 15.1% |
| 45 to 54 Years | 192 | 23.6% |
| 55 to 64 Years | 174 | 21.3% |
| 65 to 74 Years | 130 | 16.0% |
| 75 to 84 Years | 51 | 6.3% |
| 85 Years and Over | 23 | 2.8% |
| Total | 815 | 100.0% |
Housing Finances in New Miami
Median Income by Occupancy in New Miami
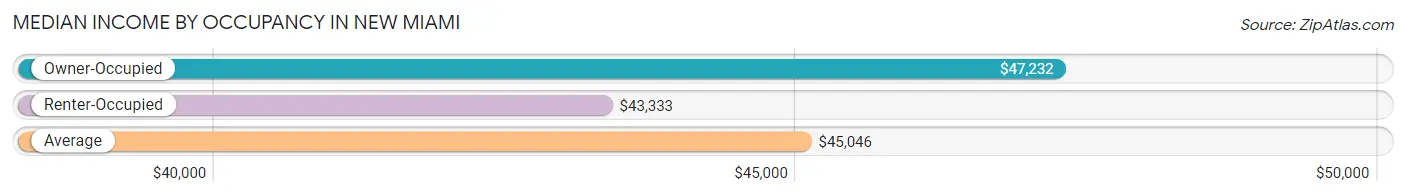
| Occupancy Type | # Households | Median Income |
| Owner-Occupied | 405 (49.7%) | $47,232 |
| Renter-Occupied | 410 (50.3%) | $43,333 |
| Average | 815 (100.0%) | $45,046 |
Occupancy by Householder Income Bracket in New Miami
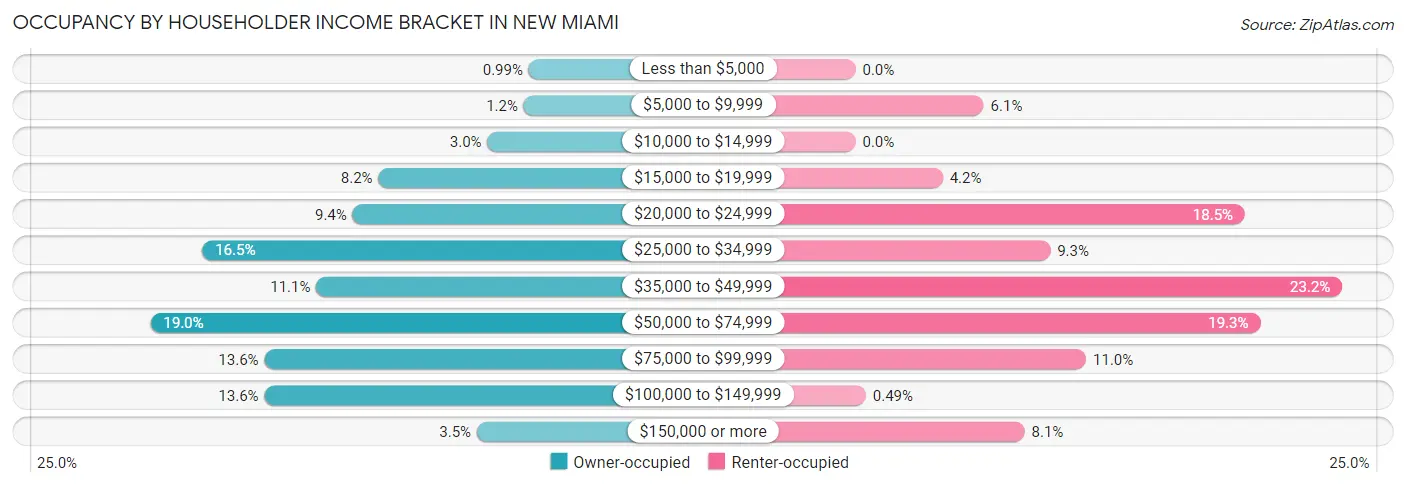
| Income Bracket | Owner-occupied | Renter-occupied |
| Less than $5,000 | 4 (1.0%) | 0 (0.0%) |
| $5,000 to $9,999 | 5 (1.2%) | 25 (6.1%) |
| $10,000 to $14,999 | 12 (3.0%) | 0 (0.0%) |
| $15,000 to $19,999 | 33 (8.2%) | 17 (4.2%) |
| $20,000 to $24,999 | 38 (9.4%) | 76 (18.5%) |
| $25,000 to $34,999 | 67 (16.5%) | 38 (9.3%) |
| $35,000 to $49,999 | 45 (11.1%) | 95 (23.2%) |
| $50,000 to $74,999 | 77 (19.0%) | 79 (19.3%) |
| $75,000 to $99,999 | 55 (13.6%) | 45 (11.0%) |
| $100,000 to $149,999 | 55 (13.6%) | 2 (0.5%) |
| $150,000 or more | 14 (3.5%) | 33 (8.1%) |
| Total | 405 (100.0%) | 410 (100.0%) |
Monthly Housing Cost Tiers in New Miami
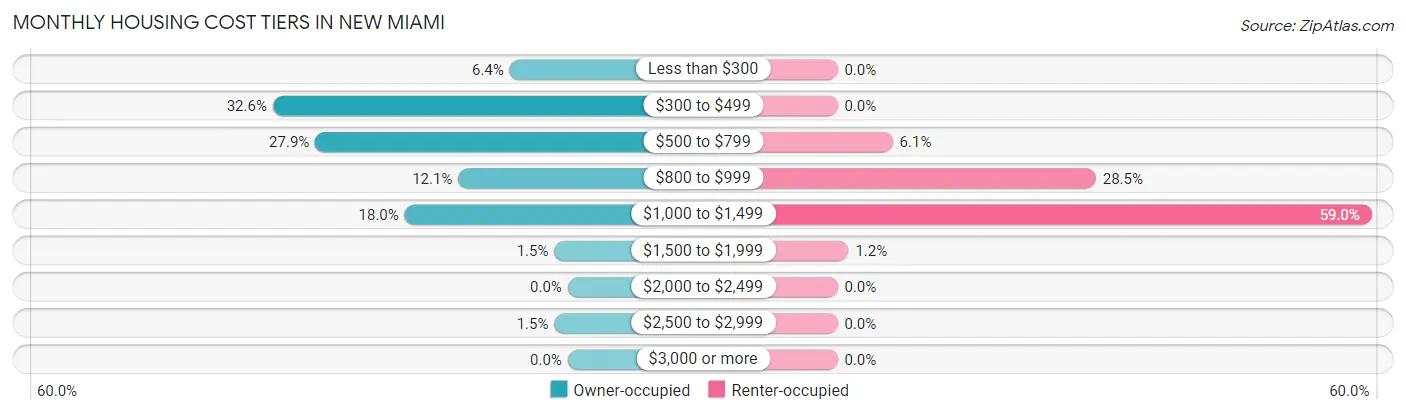
| Monthly Cost | Owner-occupied | Renter-occupied |
| Less than $300 | 26 (6.4%) | 0 (0.0%) |
| $300 to $499 | 132 (32.6%) | 0 (0.0%) |
| $500 to $799 | 113 (27.9%) | 25 (6.1%) |
| $800 to $999 | 49 (12.1%) | 117 (28.5%) |
| $1,000 to $1,499 | 73 (18.0%) | 242 (59.0%) |
| $1,500 to $1,999 | 6 (1.5%) | 5 (1.2%) |
| $2,000 to $2,499 | 0 (0.0%) | 0 (0.0%) |
| $2,500 to $2,999 | 6 (1.5%) | 0 (0.0%) |
| $3,000 or more | 0 (0.0%) | 0 (0.0%) |
| Total | 405 (100.0%) | 410 (100.0%) |
Physical Housing Characteristics in New Miami
Housing Structures in New Miami
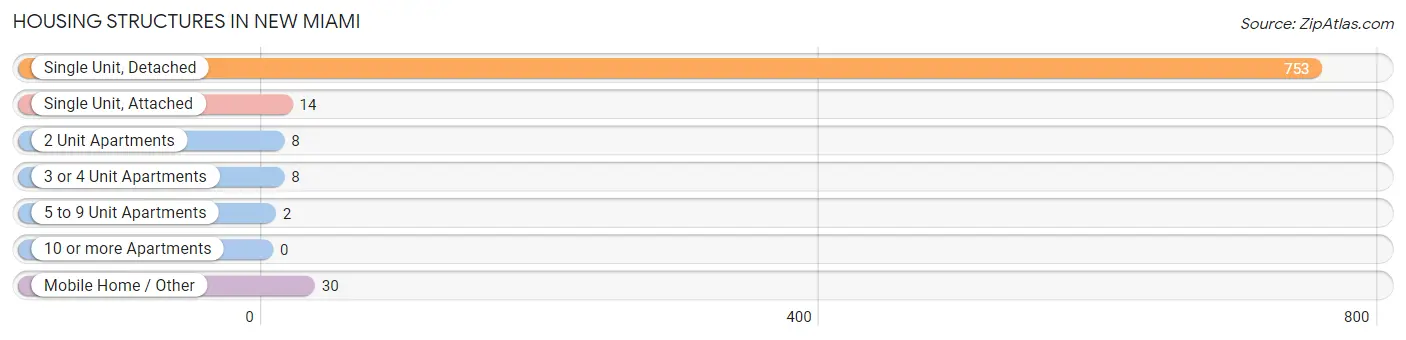
| Structure Type | # Housing Units | % Housing Units |
| Single Unit, Detached | 753 | 92.4% |
| Single Unit, Attached | 14 | 1.7% |
| 2 Unit Apartments | 8 | 1.0% |
| 3 or 4 Unit Apartments | 8 | 1.0% |
| 5 to 9 Unit Apartments | 2 | 0.3% |
| 10 or more Apartments | 0 | 0.0% |
| Mobile Home / Other | 30 | 3.7% |
| Total | 815 | 100.0% |
Housing Structures by Occupancy in New Miami
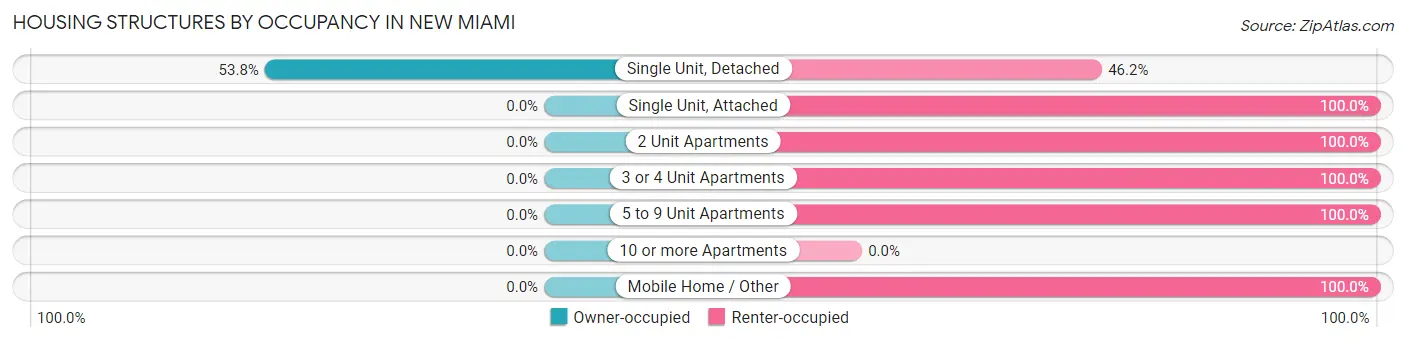
| Structure Type | Owner-occupied | Renter-occupied |
| Single Unit, Detached | 405 (53.8%) | 348 (46.2%) |
| Single Unit, Attached | 0 (0.0%) | 14 (100.0%) |
| 2 Unit Apartments | 0 (0.0%) | 8 (100.0%) |
| 3 or 4 Unit Apartments | 0 (0.0%) | 8 (100.0%) |
| 5 to 9 Unit Apartments | 0 (0.0%) | 2 (100.0%) |
| 10 or more Apartments | 0 (0.0%) | 0 (0.0%) |
| Mobile Home / Other | 0 (0.0%) | 30 (100.0%) |
| Total | 405 (49.7%) | 410 (50.3%) |
Housing Structures by Number of Rooms in New Miami
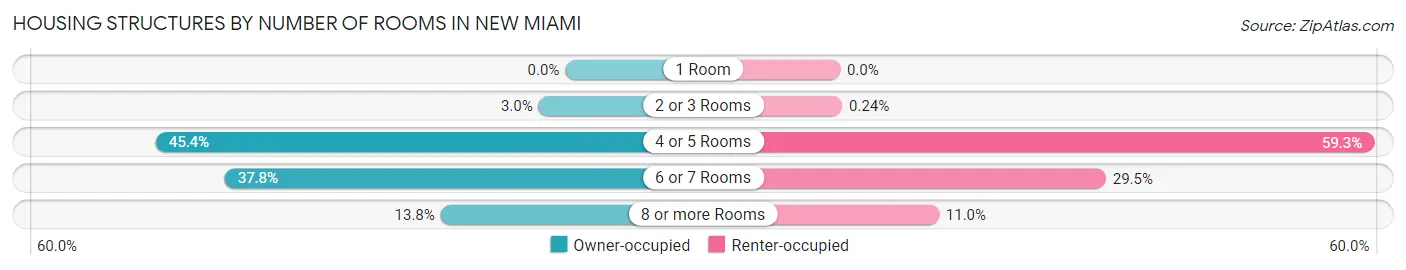
| Number of Rooms | Owner-occupied | Renter-occupied |
| 1 Room | 0 (0.0%) | 0 (0.0%) |
| 2 or 3 Rooms | 12 (3.0%) | 1 (0.2%) |
| 4 or 5 Rooms | 184 (45.4%) | 243 (59.3%) |
| 6 or 7 Rooms | 153 (37.8%) | 121 (29.5%) |
| 8 or more Rooms | 56 (13.8%) | 45 (11.0%) |
| Total | 405 (100.0%) | 410 (100.0%) |
Housing Structure by Heating Type in New Miami
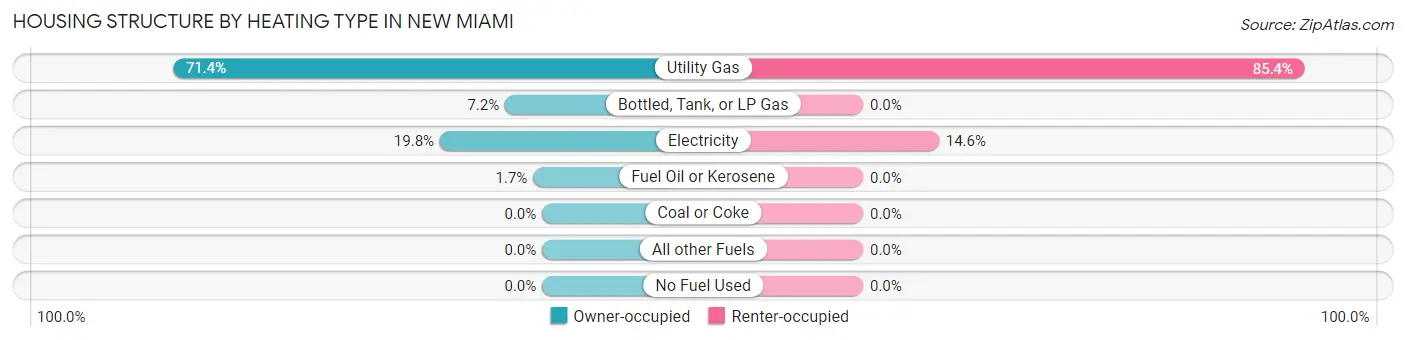
| Heating Type | Owner-occupied | Renter-occupied |
| Utility Gas | 289 (71.4%) | 350 (85.4%) |
| Bottled, Tank, or LP Gas | 29 (7.2%) | 0 (0.0%) |
| Electricity | 80 (19.8%) | 60 (14.6%) |
| Fuel Oil or Kerosene | 7 (1.7%) | 0 (0.0%) |
| Coal or Coke | 0 (0.0%) | 0 (0.0%) |
| All other Fuels | 0 (0.0%) | 0 (0.0%) |
| No Fuel Used | 0 (0.0%) | 0 (0.0%) |
| Total | 405 (100.0%) | 410 (100.0%) |
Household Vehicle Usage in New Miami
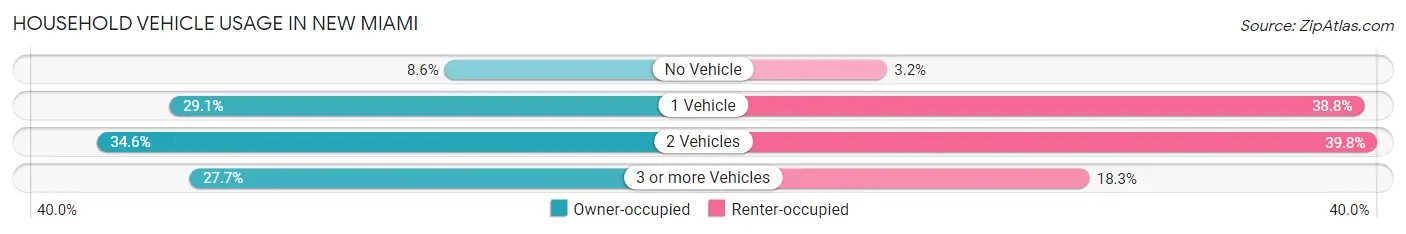
| Vehicles per Household | Owner-occupied | Renter-occupied |
| No Vehicle | 35 (8.6%) | 13 (3.2%) |
| 1 Vehicle | 118 (29.1%) | 159 (38.8%) |
| 2 Vehicles | 140 (34.6%) | 163 (39.8%) |
| 3 or more Vehicles | 112 (27.7%) | 75 (18.3%) |
| Total | 405 (100.0%) | 410 (100.0%) |
Real Estate & Mortgages in New Miami
Real Estate and Mortgage Overview in New Miami
| Characteristic | Without Mortgage | With Mortgage |
| Housing Units | 236 | 169 |
| Median Property Value | $76,000 | $92,800 |
| Median Household Income | $35,455 | $0 |
| Monthly Housing Costs | $425 | $0 |
| Real Estate Taxes | $1,238 | $4 |
Property Value by Mortgage Status in New Miami
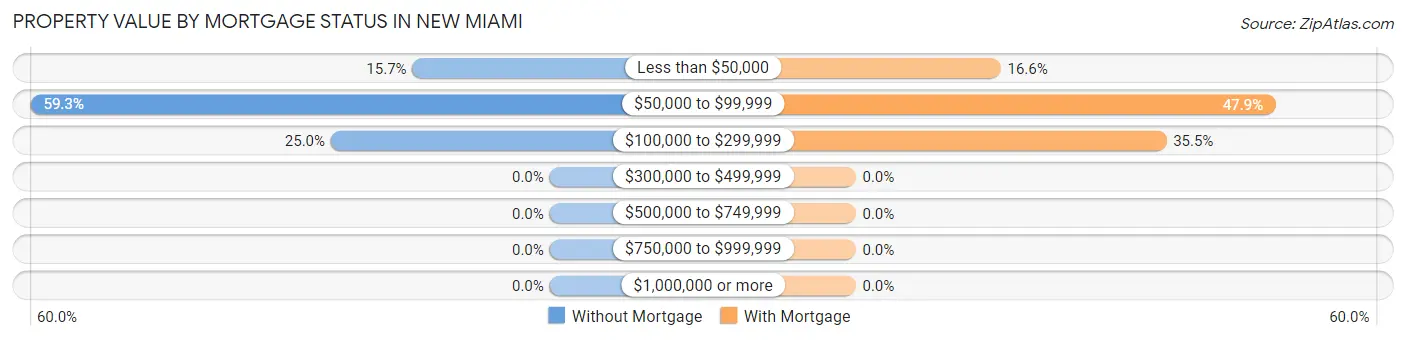
| Property Value | Without Mortgage | With Mortgage |
| Less than $50,000 | 37 (15.7%) | 28 (16.6%) |
| $50,000 to $99,999 | 140 (59.3%) | 81 (47.9%) |
| $100,000 to $299,999 | 59 (25.0%) | 60 (35.5%) |
| $300,000 to $499,999 | 0 (0.0%) | 0 (0.0%) |
| $500,000 to $749,999 | 0 (0.0%) | 0 (0.0%) |
| $750,000 to $999,999 | 0 (0.0%) | 0 (0.0%) |
| $1,000,000 or more | 0 (0.0%) | 0 (0.0%) |
| Total | 236 (100.0%) | 169 (100.0%) |
Household Income by Mortgage Status in New Miami
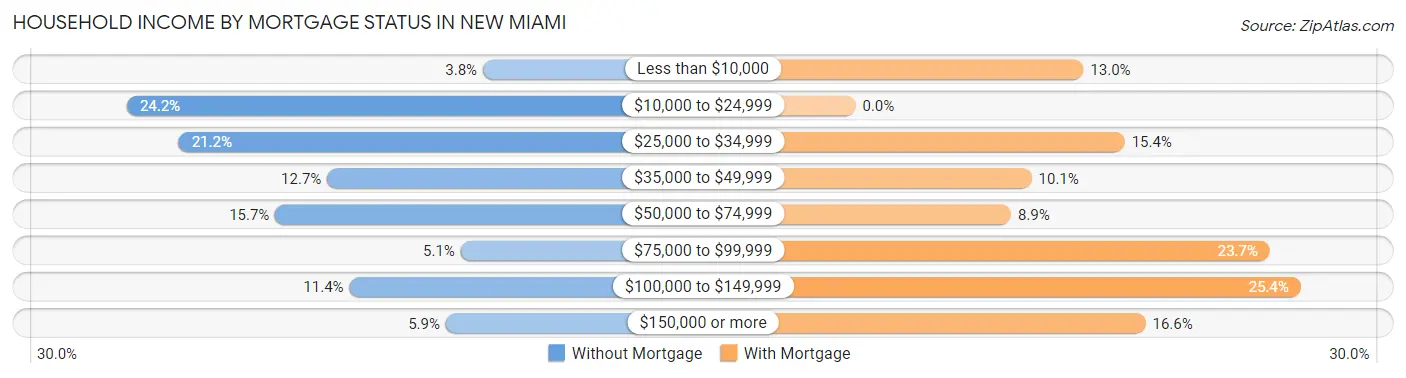
| Household Income | Without Mortgage | With Mortgage |
| Less than $10,000 | 9 (3.8%) | 22 (13.0%) |
| $10,000 to $24,999 | 57 (24.1%) | 0 (0.0%) |
| $25,000 to $34,999 | 50 (21.2%) | 26 (15.4%) |
| $35,000 to $49,999 | 30 (12.7%) | 17 (10.1%) |
| $50,000 to $74,999 | 37 (15.7%) | 15 (8.9%) |
| $75,000 to $99,999 | 12 (5.1%) | 40 (23.7%) |
| $100,000 to $149,999 | 27 (11.4%) | 43 (25.4%) |
| $150,000 or more | 14 (5.9%) | 28 (16.6%) |
| Total | 236 (100.0%) | 169 (100.0%) |
Property Value to Household Income Ratio in New Miami
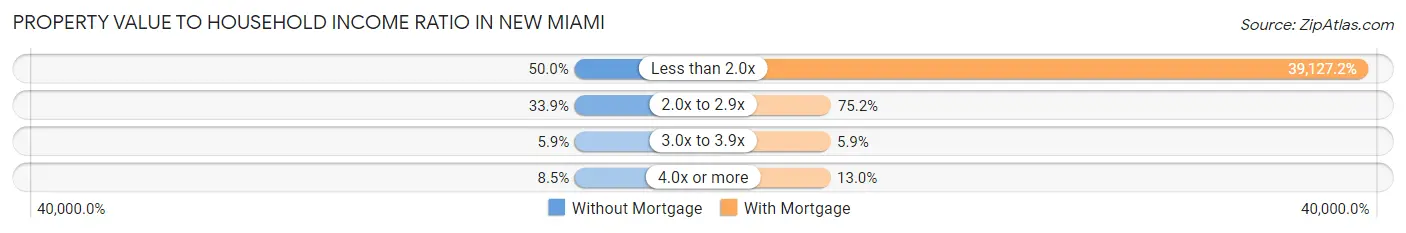
| Value-to-Income Ratio | Without Mortgage | With Mortgage |
| Less than 2.0x | 118 (50.0%) | 66,125 (39,127.2%) |
| 2.0x to 2.9x | 80 (33.9%) | 127 (75.1%) |
| 3.0x to 3.9x | 14 (5.9%) | 10 (5.9%) |
| 4.0x or more | 20 (8.5%) | 22 (13.0%) |
| Total | 236 (100.0%) | 169 (100.0%) |
Real Estate Taxes by Mortgage Status in New Miami
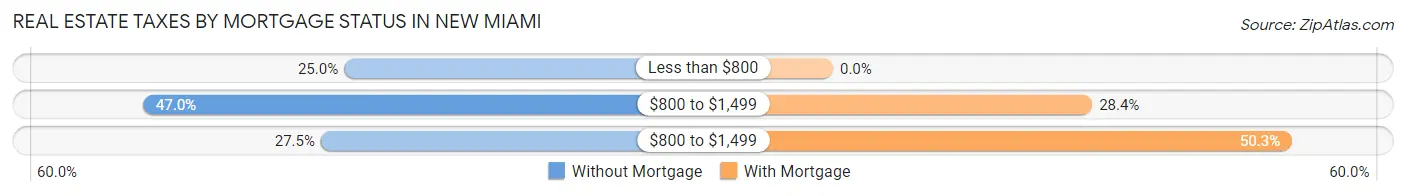
| Property Taxes | Without Mortgage | With Mortgage |
| Less than $800 | 59 (25.0%) | 0 (0.0%) |
| $800 to $1,499 | 111 (47.0%) | 48 (28.4%) |
| $800 to $1,499 | 65 (27.5%) | 85 (50.3%) |
| Total | 236 (100.0%) | 169 (100.0%) |
Health & Disability in New Miami
Health Insurance Coverage by Age in New Miami
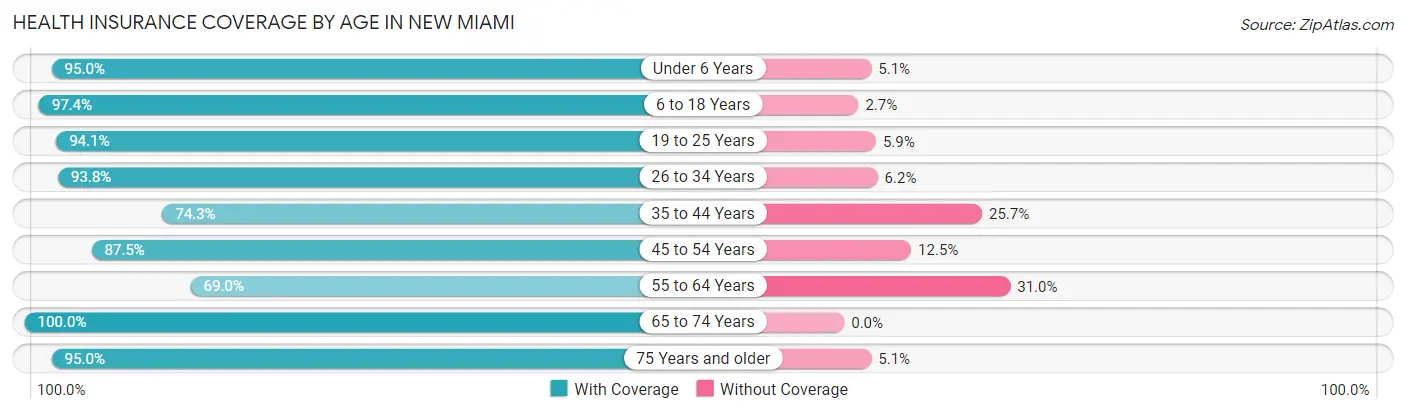
| Age Bracket | With Coverage | Without Coverage |
| Under 6 Years | 188 (95.0%) | 10 (5.1%) |
| 6 to 18 Years | 440 (97.4%) | 12 (2.6%) |
| 19 to 25 Years | 239 (94.1%) | 15 (5.9%) |
| 26 to 34 Years | 211 (93.8%) | 14 (6.2%) |
| 35 to 44 Years | 188 (74.3%) | 65 (25.7%) |
| 45 to 54 Years | 316 (87.5%) | 45 (12.5%) |
| 55 to 64 Years | 252 (69.0%) | 113 (31.0%) |
| 65 to 74 Years | 204 (100.0%) | 0 (0.0%) |
| 75 Years and older | 94 (95.0%) | 5 (5.1%) |
| Total | 2,132 (88.4%) | 279 (11.6%) |
Health Insurance Coverage by Citizenship Status in New Miami
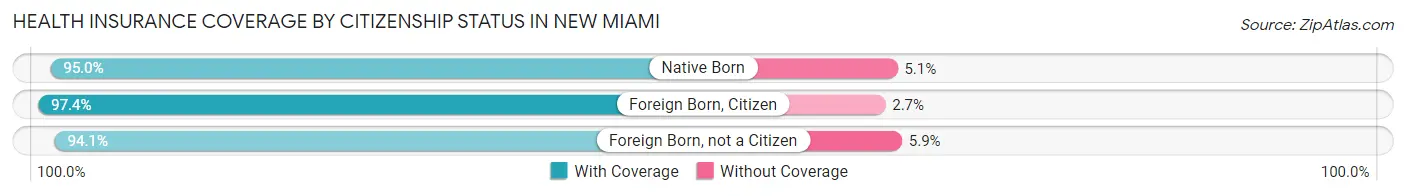
| Citizenship Status | With Coverage | Without Coverage |
| Native Born | 188 (95.0%) | 10 (5.1%) |
| Foreign Born, Citizen | 440 (97.4%) | 12 (2.6%) |
| Foreign Born, not a Citizen | 239 (94.1%) | 15 (5.9%) |
Health Insurance Coverage by Household Income in New Miami
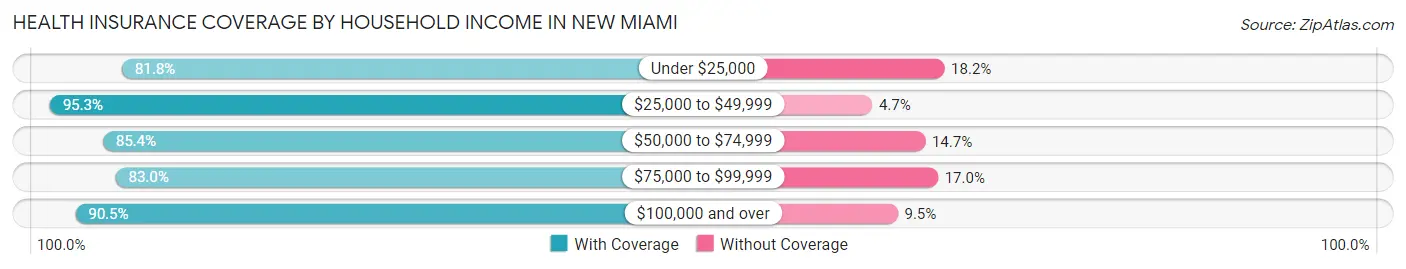
| Household Income | With Coverage | Without Coverage |
| Under $25,000 | 372 (81.8%) | 83 (18.2%) |
| $25,000 to $49,999 | 748 (95.3%) | 37 (4.7%) |
| $50,000 to $74,999 | 402 (85.4%) | 69 (14.6%) |
| $75,000 to $99,999 | 258 (83.0%) | 53 (17.0%) |
| $100,000 and over | 352 (90.5%) | 37 (9.5%) |
Public vs Private Health Insurance Coverage by Age in New Miami
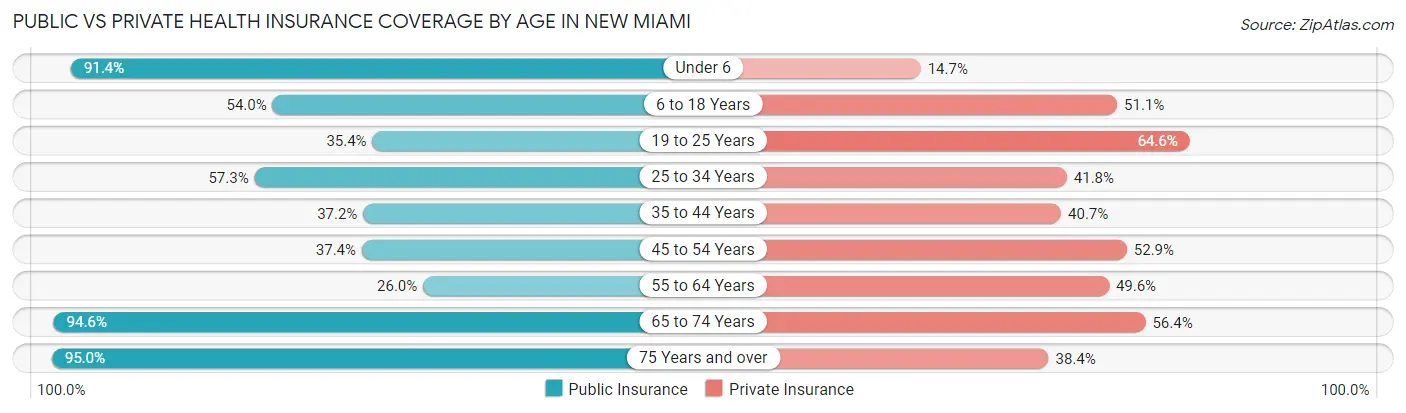
| Age Bracket | Public Insurance | Private Insurance |
| Under 6 | 181 (91.4%) | 29 (14.6%) |
| 6 to 18 Years | 244 (54.0%) | 231 (51.1%) |
| 19 to 25 Years | 90 (35.4%) | 164 (64.6%) |
| 25 to 34 Years | 129 (57.3%) | 94 (41.8%) |
| 35 to 44 Years | 94 (37.1%) | 103 (40.7%) |
| 45 to 54 Years | 135 (37.4%) | 191 (52.9%) |
| 55 to 64 Years | 95 (26.0%) | 181 (49.6%) |
| 65 to 74 Years | 193 (94.6%) | 115 (56.4%) |
| 75 Years and over | 94 (95.0%) | 38 (38.4%) |
| Total | 1,255 (52.0%) | 1,146 (47.5%) |
Disability Status by Sex by Age in New Miami
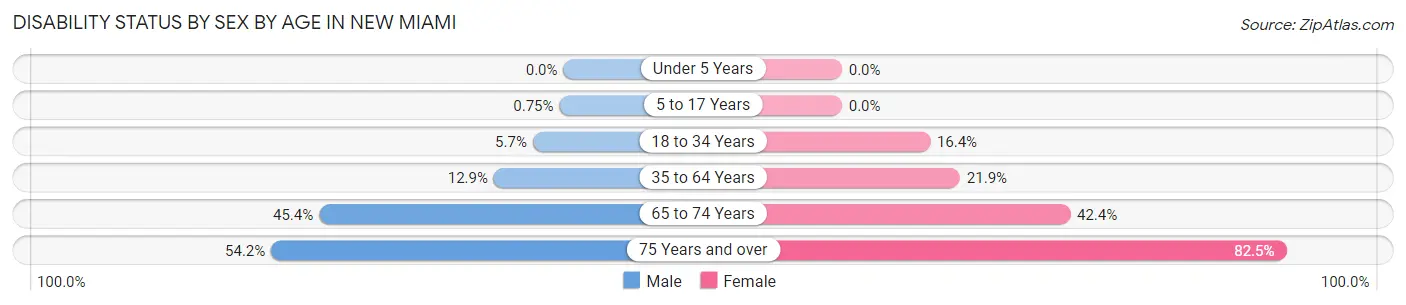
| Age Bracket | Male | Female |
| Under 5 Years | 0 (0.0%) | 0 (0.0%) |
| 5 to 17 Years | 2 (0.7%) | 0 (0.0%) |
| 18 to 34 Years | 13 (5.7%) | 45 (16.4%) |
| 35 to 64 Years | 74 (12.9%) | 89 (21.9%) |
| 65 to 74 Years | 39 (45.4%) | 50 (42.4%) |
| 75 Years and over | 32 (54.2%) | 33 (82.5%) |
Disability Class by Sex by Age in New Miami
Disability Class: Hearing Difficulty
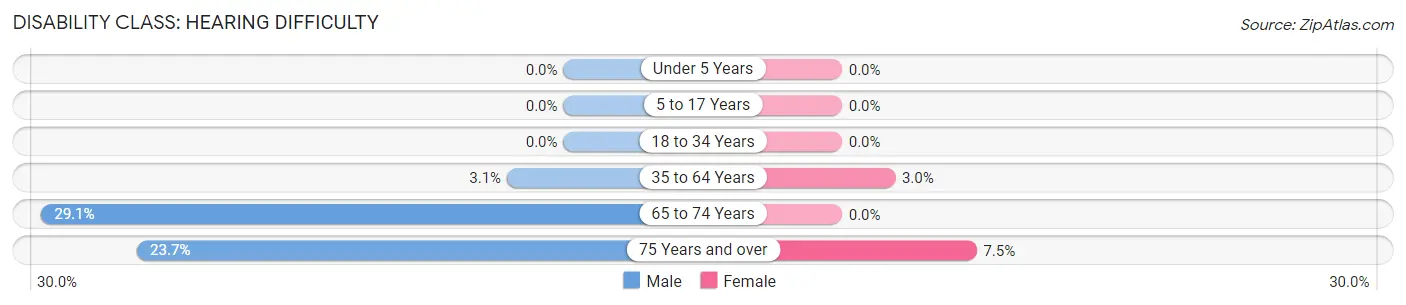
| Age Bracket | Male | Female |
| Under 5 Years | 0 (0.0%) | 0 (0.0%) |
| 5 to 17 Years | 0 (0.0%) | 0 (0.0%) |
| 18 to 34 Years | 0 (0.0%) | 0 (0.0%) |
| 35 to 64 Years | 18 (3.1%) | 12 (3.0%) |
| 65 to 74 Years | 25 (29.1%) | 0 (0.0%) |
| 75 Years and over | 14 (23.7%) | 3 (7.5%) |
Disability Class: Vision Difficulty
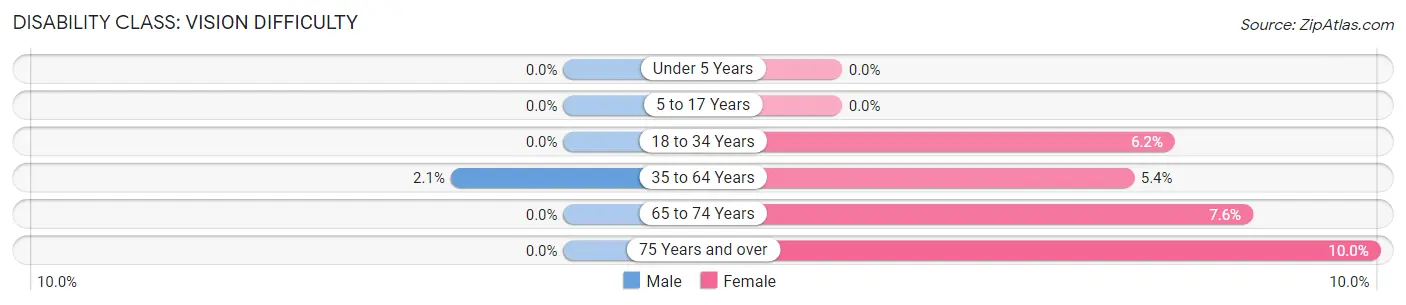
| Age Bracket | Male | Female |
| Under 5 Years | 0 (0.0%) | 0 (0.0%) |
| 5 to 17 Years | 0 (0.0%) | 0 (0.0%) |
| 18 to 34 Years | 0 (0.0%) | 17 (6.2%) |
| 35 to 64 Years | 12 (2.1%) | 22 (5.4%) |
| 65 to 74 Years | 0 (0.0%) | 9 (7.6%) |
| 75 Years and over | 0 (0.0%) | 4 (10.0%) |
Disability Class: Cognitive Difficulty
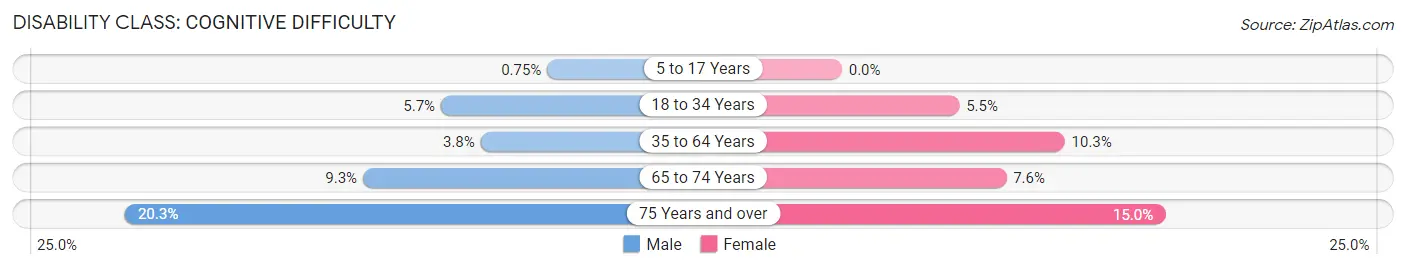
| Age Bracket | Male | Female |
| 5 to 17 Years | 2 (0.7%) | 0 (0.0%) |
| 18 to 34 Years | 13 (5.7%) | 15 (5.4%) |
| 35 to 64 Years | 22 (3.8%) | 42 (10.3%) |
| 65 to 74 Years | 8 (9.3%) | 9 (7.6%) |
| 75 Years and over | 12 (20.3%) | 6 (15.0%) |
Disability Class: Ambulatory Difficulty
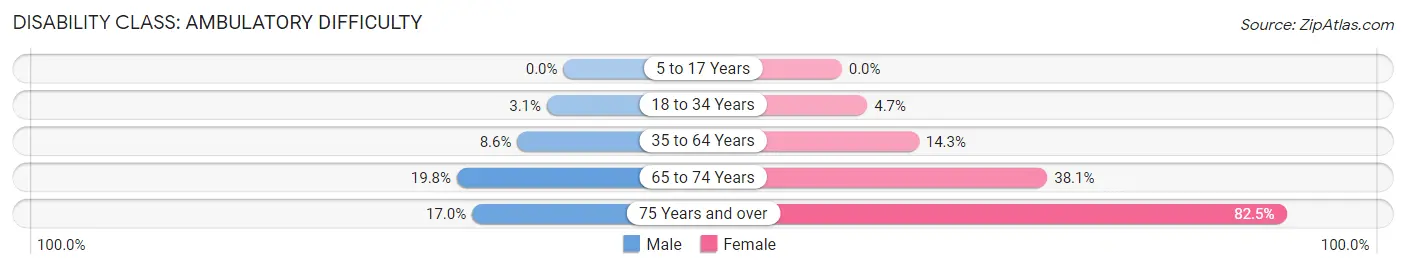
| Age Bracket | Male | Female |
| 5 to 17 Years | 0 (0.0%) | 0 (0.0%) |
| 18 to 34 Years | 7 (3.1%) | 13 (4.7%) |
| 35 to 64 Years | 49 (8.6%) | 58 (14.3%) |
| 65 to 74 Years | 17 (19.8%) | 45 (38.1%) |
| 75 Years and over | 10 (17.0%) | 33 (82.5%) |
Disability Class: Self-Care Difficulty
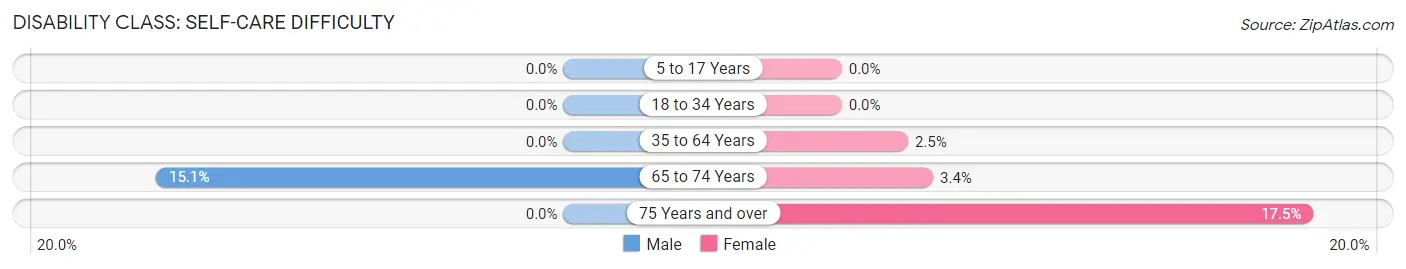
| Age Bracket | Male | Female |
| 5 to 17 Years | 0 (0.0%) | 0 (0.0%) |
| 18 to 34 Years | 0 (0.0%) | 0 (0.0%) |
| 35 to 64 Years | 0 (0.0%) | 10 (2.5%) |
| 65 to 74 Years | 13 (15.1%) | 4 (3.4%) |
| 75 Years and over | 0 (0.0%) | 7 (17.5%) |
Technology Access in New Miami
Computing Device Access in New Miami
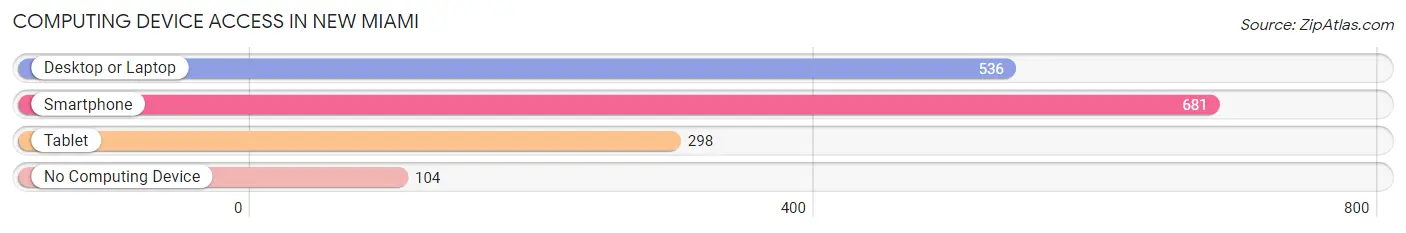
| Device Type | # Households | % Households |
| Desktop or Laptop | 536 | 65.8% |
| Smartphone | 681 | 83.6% |
| Tablet | 298 | 36.6% |
| No Computing Device | 104 | 12.8% |
| Total | 815 | 100.0% |
Internet Access in New Miami
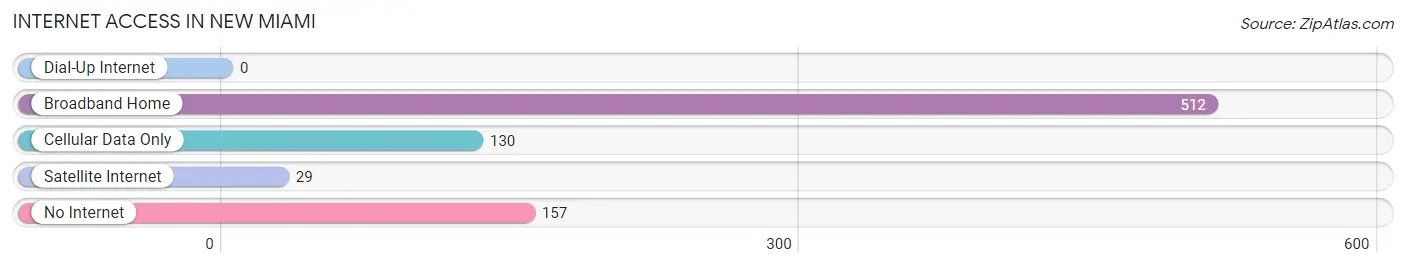
| Internet Type | # Households | % Households |
| Dial-Up Internet | 0 | 0.0% |
| Broadband Home | 512 | 62.8% |
| Cellular Data Only | 130 | 16.0% |
| Satellite Internet | 29 | 3.6% |
| No Internet | 157 | 19.3% |
| Total | 815 | 100.0% |
New Miami Summary
Miami, Ohio is a small city located in the southwestern corner of the state, in Butler and Warren counties. It is part of the Cincinnati metropolitan area and is situated along the Great Miami River. The city has a population of around 20,000 people and is known for its historic downtown area, which is home to a variety of shops, restaurants, and other attractions.
History
Miami, Ohio was founded in 1794 by Benjamin Stites, a Revolutionary War veteran. The city was named after the Miami tribe of Native Americans who had previously inhabited the area. The city was originally a trading post and was later incorporated in 1809.
In the early 19th century, Miami was a major stop on the Underground Railroad, with many slaves escaping to freedom in Canada. The city was also a major center of the abolitionist movement, with many prominent abolitionists living in the area.
In the late 19th century, Miami became an important industrial center, with many factories and mills located in the city. The city was also home to a number of important businesses, including the Miami Valley Railroad and the Miami Valley Brewing Company.
Geography
Miami is located in the southwestern corner of Ohio, in Butler and Warren counties. It is situated along the Great Miami River and is part of the Cincinnati metropolitan area. The city has a total area of 8.3 square miles, with a population density of 2,400 people per square mile.
The city is located in a humid continental climate zone, with hot summers and cold winters. The average annual temperature is around 50 degrees Fahrenheit, with an average high of around 75 degrees in the summer and an average low of around 25 degrees in the winter.
Economy
Miami’s economy is largely based on manufacturing and services. The city is home to a number of factories and mills, including the Miami Valley Brewing Company, the Miami Valley Railroad, and the Miami Valley Paper Company. The city is also home to a number of retail stores, restaurants, and other businesses.
The city is also home to a number of educational institutions, including Miami University, the University of Cincinnati, and the University of Dayton. The city is also home to a number of healthcare facilities, including the Miami Valley Hospital and the Miami Valley Medical Center.
Demographics
As of the 2010 census, the population of Miami was 20,085. The racial makeup of the city was 87.3% White, 8.2% African American, 0.3% Native American, 1.2% Asian, 0.1% Pacific Islander, and 2.9% from other races. The median household income was $41,945, and the median family income was $50,945.
Conclusion
Miami, Ohio is a small city located in the southwestern corner of the state, in Butler and Warren counties. It is part of the Cincinnati metropolitan area and is situated along the Great Miami River. The city has a population of around 20,000 people and is known for its historic downtown area, which is home to a variety of shops, restaurants, and other attractions. The city’s economy is largely based on manufacturing and services, and it is home to a number of educational institutions, healthcare facilities, and other businesses. The city’s population is largely white, with a small percentage of African Americans, Native Americans, Asians, and Pacific Islanders.
Common Questions
What is Per Capita Income in New Miami?
Per Capita income in New Miami is $21,350.
What is the Median Family Income in New Miami?
Median Family Income in New Miami is $54,583.
What is the Median Household income in New Miami?
Median Household Income in New Miami is $45,046.
What is Income or Wage Gap in New Miami?
Income or Wage Gap in New Miami is 20.3%.
Women in New Miami earn 79.7 cents for every dollar earned by a man.
What is Inequality or Gini Index in New Miami?
Inequality or Gini Index in New Miami is 0.41.
What is the Total Population of New Miami?
Total Population of New Miami is 2,411.
What is the Total Male Population of New Miami?
Total Male Population of New Miami is 1,298.
What is the Total Female Population of New Miami?
Total Female Population of New Miami is 1,113.
What is the Ratio of Males per 100 Females in New Miami?
There are 116.62 Males per 100 Females in New Miami.
What is the Ratio of Females per 100 Males in New Miami?
There are 85.75 Females per 100 Males in New Miami.
What is the Median Population Age in New Miami?
Median Population Age in New Miami is 37.0 Years.
What is the Average Family Size in New Miami
Average Family Size in New Miami is 3.5 People.
What is the Average Household Size in New Miami
Average Household Size in New Miami is 3.0 People.
How Large is the Labor Force in New Miami?
There are 1,140 People in the Labor Forcein in New Miami.
What is the Percentage of People in the Labor Force in New Miami?
61.9% of People are in the Labor Force in New Miami.
What is the Unemployment Rate in New Miami?
Unemployment Rate in New Miami is 16.8%.