Calcutta, OH Map & Demographics
Calcutta Map
Calcutta Overview
$29,405
PER CAPITA INCOME
$75,071
AVG FAMILY INCOME
$59,519
AVG HOUSEHOLD INCOME
29.3%
WAGE / INCOME GAP [ % ]
70.7¢/ $1
WAGE / INCOME GAP [ $ ]
0.35
INEQUALITY / GINI INDEX
4,049
TOTAL POPULATION
2,075
MALE POPULATION
1,974
FEMALE POPULATION
105.12
MALES / 100 FEMALES
95.13
FEMALES / 100 MALES
47.0
MEDIAN AGE
2.9
AVG FAMILY SIZE
2.4
AVG HOUSEHOLD SIZE
2,019
LABOR FORCE [ PEOPLE ]
57.8%
PERCENT IN LABOR FORCE
2.3%
UNEMPLOYMENT RATE
Income in Calcutta
Income Overview in Calcutta
Per Capita Income in Calcutta is $29,405, while median incomes of families and households are $75,071 and $59,519 respectively.
| Characteristic | Number | Measure |
| Per Capita Income | 4,049 | $29,405 |
| Median Family Income | 1,164 | $75,071 |
| Mean Family Income | 1,164 | $79,412 |
| Median Household Income | 1,639 | $59,519 |
| Mean Household Income | 1,639 | $70,384 |
| Income Deficit | 1,164 | $0 |
| Wage / Income Gap (%) | 4,049 | 29.27% |
| Wage / Income Gap ($) | 4,049 | 70.73¢ per $1 |
| Gini / Inequality Index | 4,049 | 0.35 |
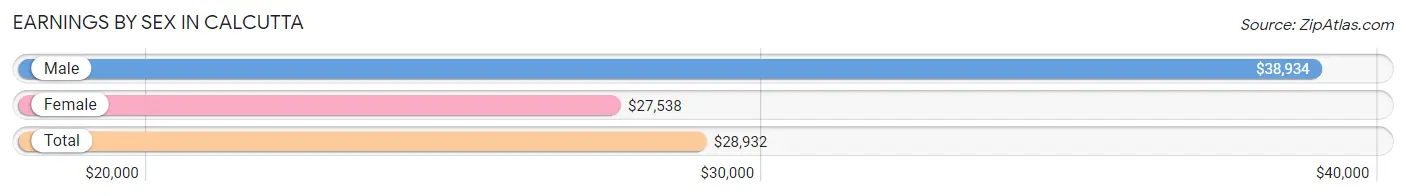
Earnings by Sex in Calcutta
Average Earnings in Calcutta are $28,932, $38,934 for men and $27,538 for women, a difference of 29.3%.
| Sex | Number | Average Earnings |
| Male | 1,230 (57.1%) | $38,934 |
| Female | 924 (42.9%) | $27,538 |
| Total | 2,154 (100.0%) | $28,932 |
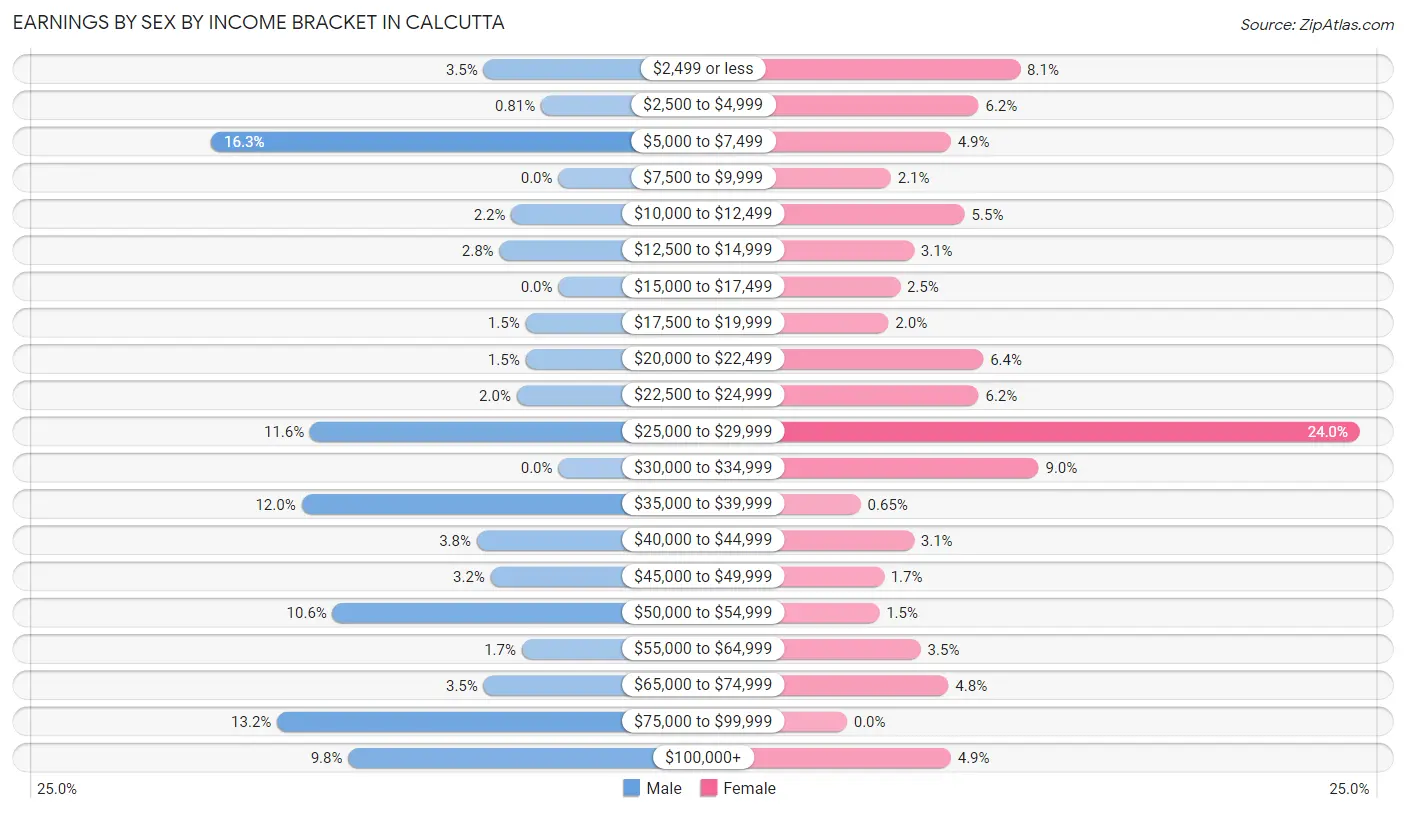
Earnings by Sex by Income Bracket in Calcutta
The most common earnings brackets in Calcutta are $5,000 to $7,499 for men (200 | 16.3%) and $25,000 to $29,999 for women (222 | 24.0%).
| Income | Male | Female |
| $2,499 or less | 43 (3.5%) | 75 (8.1%) |
| $2,500 to $4,999 | 10 (0.8%) | 57 (6.2%) |
| $5,000 to $7,499 | 200 (16.3%) | 45 (4.9%) |
| $7,500 to $9,999 | 0 (0.0%) | 19 (2.1%) |
| $10,000 to $12,499 | 27 (2.2%) | 51 (5.5%) |
| $12,500 to $14,999 | 34 (2.8%) | 29 (3.1%) |
| $15,000 to $17,499 | 0 (0.0%) | 23 (2.5%) |
| $17,500 to $19,999 | 19 (1.5%) | 18 (1.9%) |
| $20,000 to $22,499 | 19 (1.5%) | 59 (6.4%) |
| $22,500 to $24,999 | 24 (1.9%) | 57 (6.2%) |
| $25,000 to $29,999 | 143 (11.6%) | 222 (24.0%) |
| $30,000 to $34,999 | 0 (0.0%) | 83 (9.0%) |
| $35,000 to $39,999 | 148 (12.0%) | 6 (0.6%) |
| $40,000 to $44,999 | 47 (3.8%) | 29 (3.1%) |
| $45,000 to $49,999 | 39 (3.2%) | 16 (1.7%) |
| $50,000 to $54,999 | 130 (10.6%) | 14 (1.5%) |
| $55,000 to $64,999 | 21 (1.7%) | 32 (3.5%) |
| $65,000 to $74,999 | 43 (3.5%) | 44 (4.8%) |
| $75,000 to $99,999 | 162 (13.2%) | 0 (0.0%) |
| $100,000+ | 121 (9.8%) | 45 (4.9%) |
| Total | 1,230 (100.0%) | 924 (100.0%) |
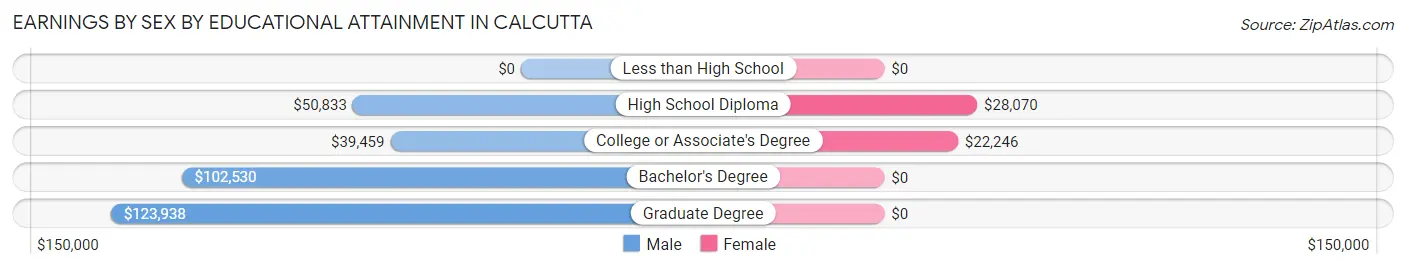
Earnings by Sex by Educational Attainment in Calcutta
Average earnings in Calcutta are $50,537 for men and $28,189 for women, a difference of 44.2%. Men with an educational attainment of graduate degree enjoy the highest average annual earnings of $123,938, while those with college or associate's degree education earn the least with $39,459. Women with an educational attainment of high school diploma earn the most with the average annual earnings of $28,070, while those with college or associate's degree education have the smallest earnings of $22,246.
| Educational Attainment | Male Income | Female Income |
| Less than High School | - | - |
| High School Diploma | $50,833 | $28,070 |
| College or Associate's Degree | $39,459 | $22,246 |
| Bachelor's Degree | $102,530 | $0 |
| Graduate Degree | $123,938 | $0 |
| Total | $50,537 | $28,189 |
Family Income in Calcutta
Family Income Brackets in Calcutta
According to the Calcutta family income data, there are 331 families falling into the $75,000 to $99,999 income range, which is the most common income bracket and makes up 28.4% of all families. Conversely, the $15,000 to $24,999 income bracket is the least frequent group with only 5 families (0.4%) belonging to this category.
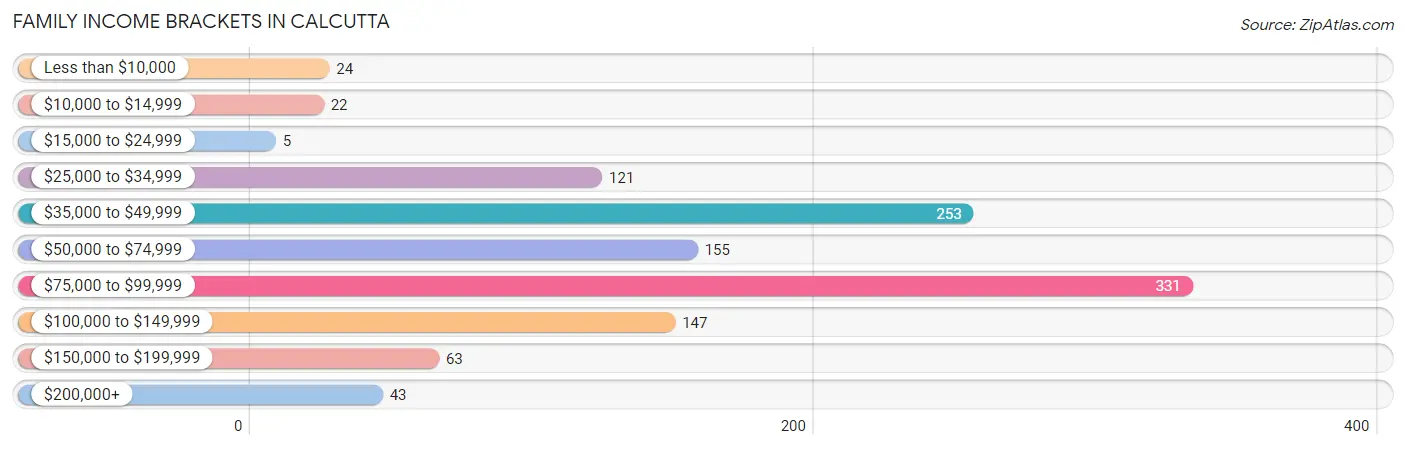
| Income Bracket | # Families | % Families |
| Less than $10,000 | 24 | 2.1% |
| $10,000 to $14,999 | 22 | 1.9% |
| $15,000 to $24,999 | 5 | 0.4% |
| $25,000 to $34,999 | 121 | 10.4% |
| $35,000 to $49,999 | 253 | 21.7% |
| $50,000 to $74,999 | 155 | 13.3% |
| $75,000 to $99,999 | 331 | 28.4% |
| $100,000 to $149,999 | 147 | 12.6% |
| $150,000 to $199,999 | 63 | 5.4% |
| $200,000+ | 43 | 3.7% |
Family Income by Famaliy Size in Calcutta
6-person families (17 | 1.5%) account for the highest median family income in Calcutta with $139,625 per family, while 3-person families (257 | 22.1%) have the highest median income of $26,345 per family member.
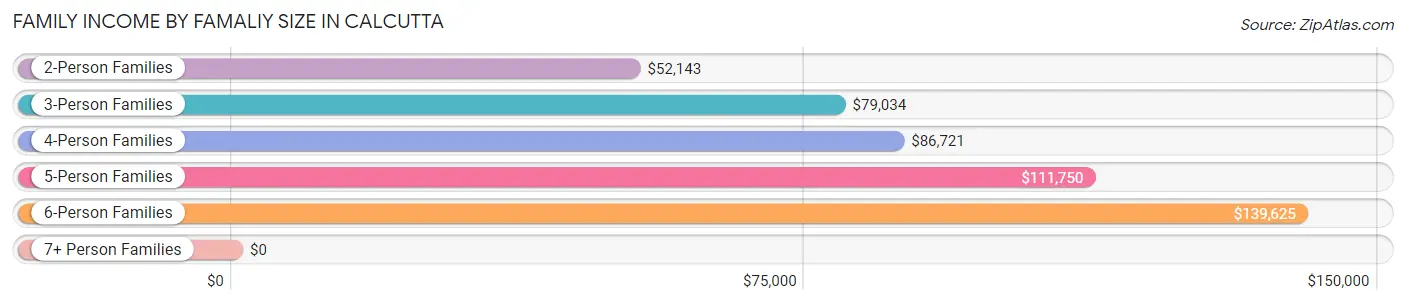
| Income Bracket | # Families | Median Income |
| 2-Person Families | 608 (52.2%) | $52,143 |
| 3-Person Families | 257 (22.1%) | $79,034 |
| 4-Person Families | 239 (20.5%) | $86,721 |
| 5-Person Families | 43 (3.7%) | $111,750 |
| 6-Person Families | 17 (1.5%) | $139,625 |
| 7+ Person Families | 0 (0.0%) | $0 |
| Total | 1,164 (100.0%) | $75,071 |
Family Income by Number of Earners in Calcutta
The median family income in Calcutta is $75,071, with families comprising 3+ earners (186) having the highest median family income of $87,039, while families with 1 earner (357) have the lowest median family income of $49,543, accounting for 16.0% and 30.7% of families, respectively.
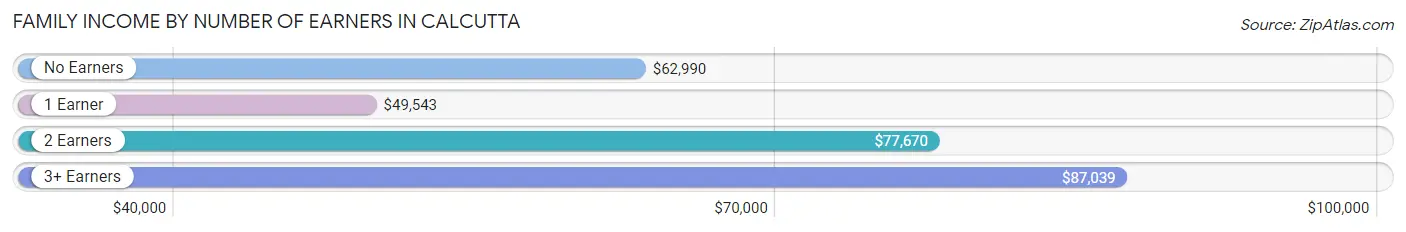
| Number of Earners | # Families | Median Income |
| No Earners | 250 (21.5%) | $62,990 |
| 1 Earner | 357 (30.7%) | $49,543 |
| 2 Earners | 371 (31.9%) | $77,670 |
| 3+ Earners | 186 (16.0%) | $87,039 |
| Total | 1,164 (100.0%) | $75,071 |
Household Income in Calcutta
Household Income Brackets in Calcutta
With 369 households falling in the category, the $75,000 to $99,999 income range is the most frequent in Calcutta, accounting for 22.5% of all households. In contrast, only 15 households (0.9%) fall into the $10,000 to $14,999 income bracket, making it the least populous group.
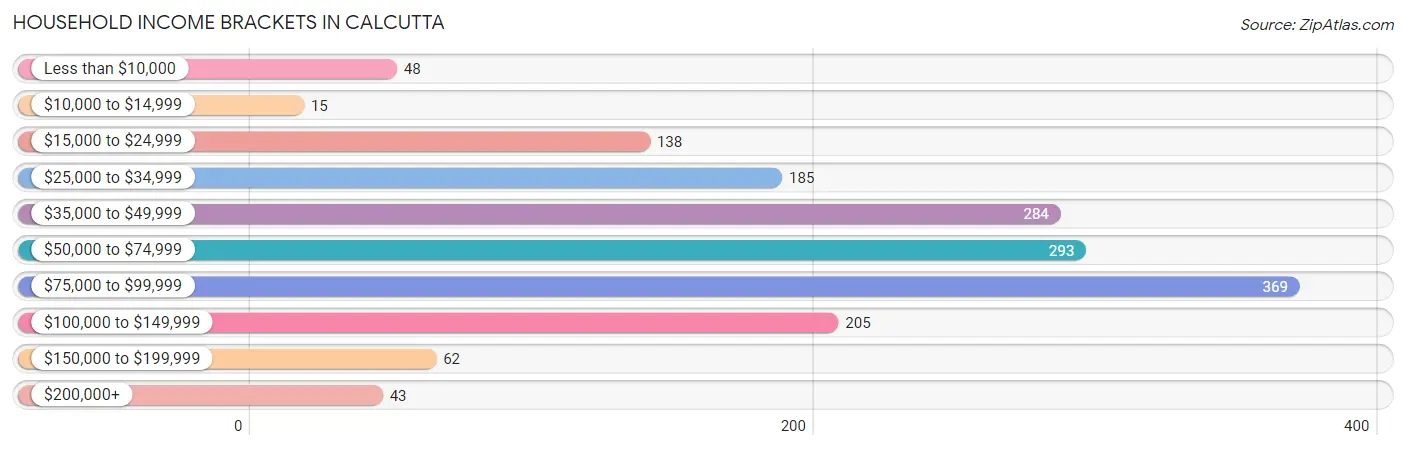
| Income Bracket | # Households | % Households |
| Less than $10,000 | 48 | 2.9% |
| $10,000 to $14,999 | 15 | 0.9% |
| $15,000 to $24,999 | 138 | 8.4% |
| $25,000 to $34,999 | 185 | 11.3% |
| $35,000 to $49,999 | 284 | 17.3% |
| $50,000 to $74,999 | 293 | 17.9% |
| $75,000 to $99,999 | 369 | 22.5% |
| $100,000 to $149,999 | 205 | 12.5% |
| $150,000 to $199,999 | 62 | 3.8% |
| $200,000+ | 43 | 2.6% |
Household Income by Householder Age in Calcutta
The median household income in Calcutta is $59,519, with the highest median household income of $85,636 found in the 25 to 44 years age bracket for the primary householder. A total of 392 households (23.9%) fall into this category. Meanwhile, the 15 to 24 years age bracket for the primary householder has the lowest median household income of $0, with 76 households (4.6%) in this group.
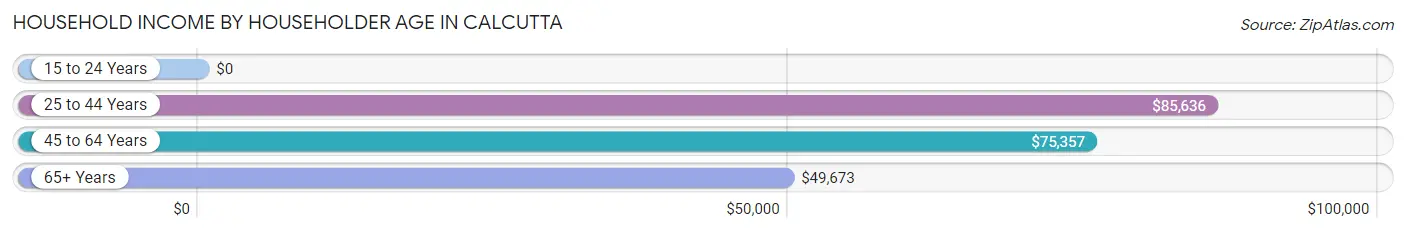
| Income Bracket | # Households | Median Income |
| 15 to 24 Years | 76 (4.6%) | $0 |
| 25 to 44 Years | 392 (23.9%) | $85,636 |
| 45 to 64 Years | 532 (32.5%) | $75,357 |
| 65+ Years | 639 (39.0%) | $49,673 |
| Total | 1,639 (100.0%) | $59,519 |
Poverty in Calcutta
Income Below Poverty by Sex and Age in Calcutta
With 5.8% poverty level for males and 5.4% for females among the residents of Calcutta, under 5 year old males and 25 to 34 year old females are the most vulnerable to poverty, with 11 males (100.0%) and 39 females (18.1%) in their respective age groups living below the poverty level.
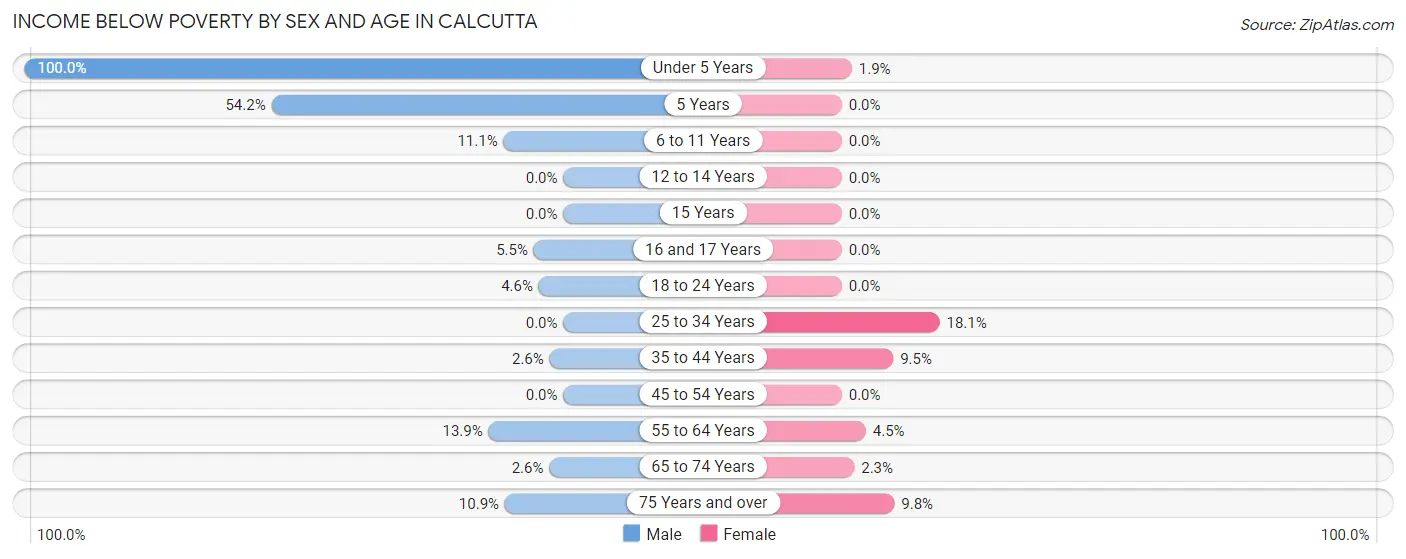
| Age Bracket | Male | Female |
| Under 5 Years | 11 (100.0%) | 3 (1.9%) |
| 5 Years | 13 (54.2%) | 0 (0.0%) |
| 6 to 11 Years | 4 (11.1%) | 0 (0.0%) |
| 12 to 14 Years | 0 (0.0%) | 0 (0.0%) |
| 15 Years | 0 (0.0%) | 0 (0.0%) |
| 16 and 17 Years | 8 (5.5%) | 0 (0.0%) |
| 18 to 24 Years | 14 (4.6%) | 0 (0.0%) |
| 25 to 34 Years | 0 (0.0%) | 39 (18.1%) |
| 35 to 44 Years | 5 (2.5%) | 25 (9.5%) |
| 45 to 54 Years | 0 (0.0%) | 0 (0.0%) |
| 55 to 64 Years | 40 (13.9%) | 12 (4.5%) |
| 65 to 74 Years | 9 (2.6%) | 8 (2.3%) |
| 75 Years and over | 14 (10.8%) | 16 (9.8%) |
| Total | 118 (5.8%) | 103 (5.4%) |
Income Above Poverty by Sex and Age in Calcutta
According to the poverty statistics in Calcutta, males aged 12 to 14 years and females aged 6 to 11 years are the age groups that are most secure financially, with 100.0% of males and 100.0% of females in these age groups living above the poverty line.
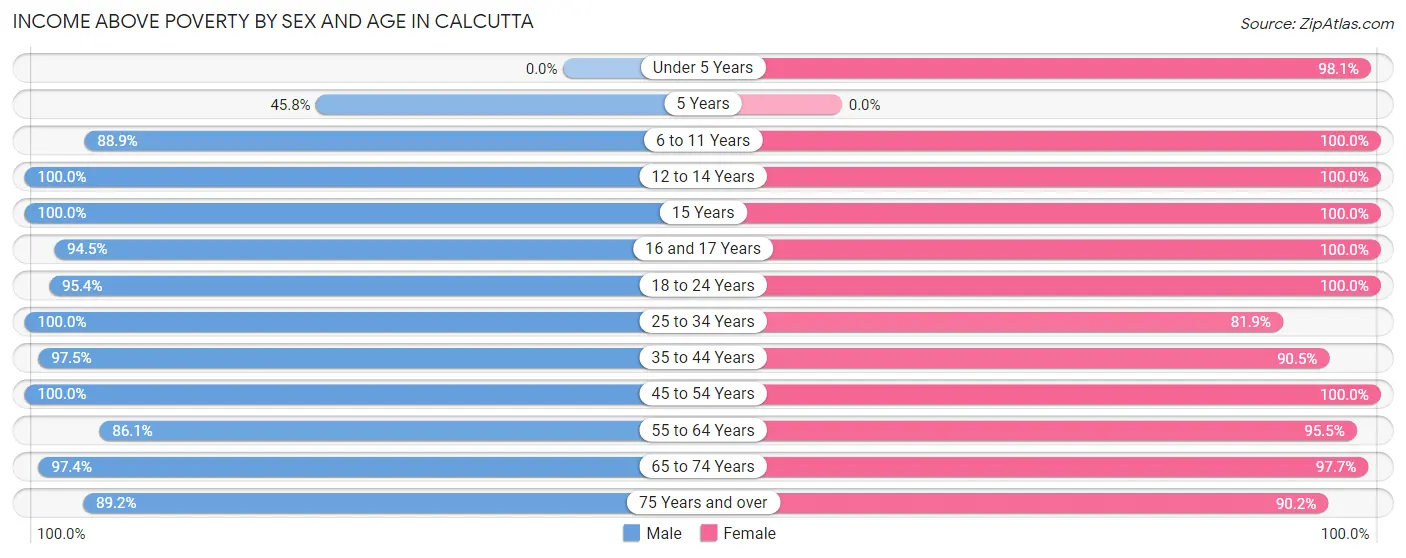
| Age Bracket | Male | Female |
| Under 5 Years | 0 (0.0%) | 158 (98.1%) |
| 5 Years | 11 (45.8%) | 0 (0.0%) |
| 6 to 11 Years | 32 (88.9%) | 108 (100.0%) |
| 12 to 14 Years | 38 (100.0%) | 126 (100.0%) |
| 15 Years | 13 (100.0%) | 11 (100.0%) |
| 16 and 17 Years | 138 (94.5%) | 16 (100.0%) |
| 18 to 24 Years | 293 (95.4%) | 97 (100.0%) |
| 25 to 34 Years | 189 (100.0%) | 176 (81.9%) |
| 35 to 44 Years | 191 (97.5%) | 237 (90.5%) |
| 45 to 54 Years | 307 (100.0%) | 129 (100.0%) |
| 55 to 64 Years | 248 (86.1%) | 257 (95.5%) |
| 65 to 74 Years | 337 (97.4%) | 337 (97.7%) |
| 75 Years and over | 115 (89.1%) | 148 (90.2%) |
| Total | 1,912 (94.2%) | 1,800 (94.6%) |
Income Below Poverty Among Married-Couple Families in Calcutta
The poverty statistics for married-couple families in Calcutta show that 4.5% or 40 of the total 886 families live below the poverty line. Families with no children have the highest poverty rate of 6.3%, comprising of 35 families. On the other hand, families with 3 or 4 children have the lowest poverty rate of 0.0%, which includes 0 families.
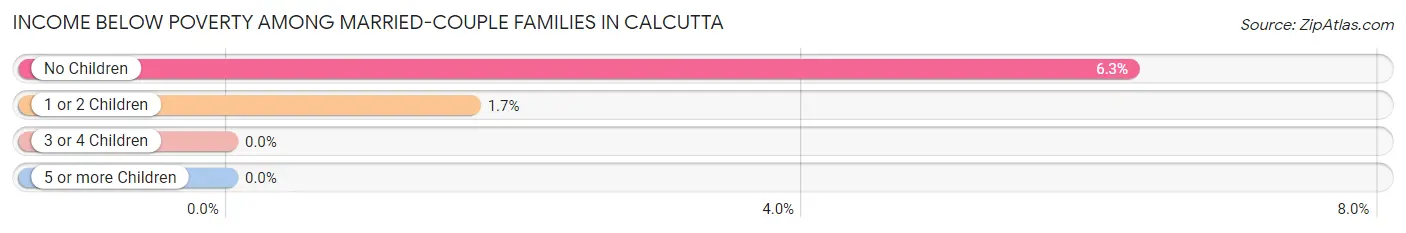
| Children | Above Poverty | Below Poverty |
| No Children | 522 (93.7%) | 35 (6.3%) |
| 1 or 2 Children | 290 (98.3%) | 5 (1.7%) |
| 3 or 4 Children | 34 (100.0%) | 0 (0.0%) |
| 5 or more Children | 0 (0.0%) | 0 (0.0%) |
| Total | 846 (95.5%) | 40 (4.5%) |
Income Below Poverty Among Single-Parent Households in Calcutta
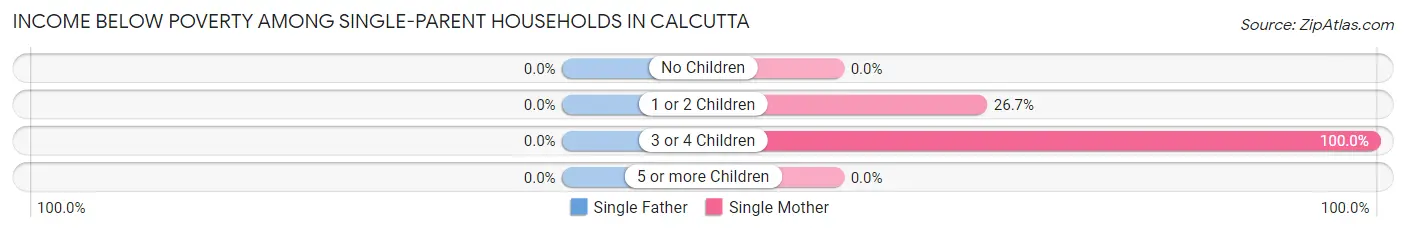
| Children | Single Father | Single Mother |
| No Children | 0 (0.0%) | 0 (0.0%) |
| 1 or 2 Children | 0 (0.0%) | 8 (26.7%) |
| 3 or 4 Children | 0 (0.0%) | 4 (100.0%) |
| 5 or more Children | 0 (0.0%) | 0 (0.0%) |
| Total | 0 (0.0%) | 12 (15.8%) |
Income Below Poverty Among Married-Couple vs Single-Parent Households in Calcutta
The poverty data for Calcutta shows that 40 of the married-couple family households (4.5%) and 12 of the single-parent households (4.3%) are living below the poverty level. Within the married-couple family households, those with no children have the highest poverty rate, with 35 households (6.3%) falling below the poverty line. Among the single-parent households, those with 3 or 4 children have the highest poverty rate, with 4 household (100.0%) living below poverty.
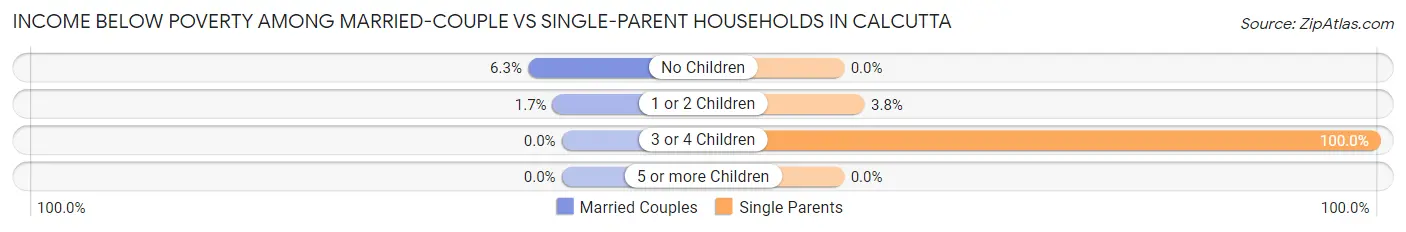
| Children | Married-Couple Families | Single-Parent Households |
| No Children | 35 (6.3%) | 0 (0.0%) |
| 1 or 2 Children | 5 (1.7%) | 8 (3.8%) |
| 3 or 4 Children | 0 (0.0%) | 4 (100.0%) |
| 5 or more Children | 0 (0.0%) | 0 (0.0%) |
| Total | 40 (4.5%) | 12 (4.3%) |
Race in Calcutta
The most populous races in Calcutta are White / Caucasian (3,680 | 90.9%), Two or more Races (199 | 4.9%), and Black / African American (170 | 4.2%).
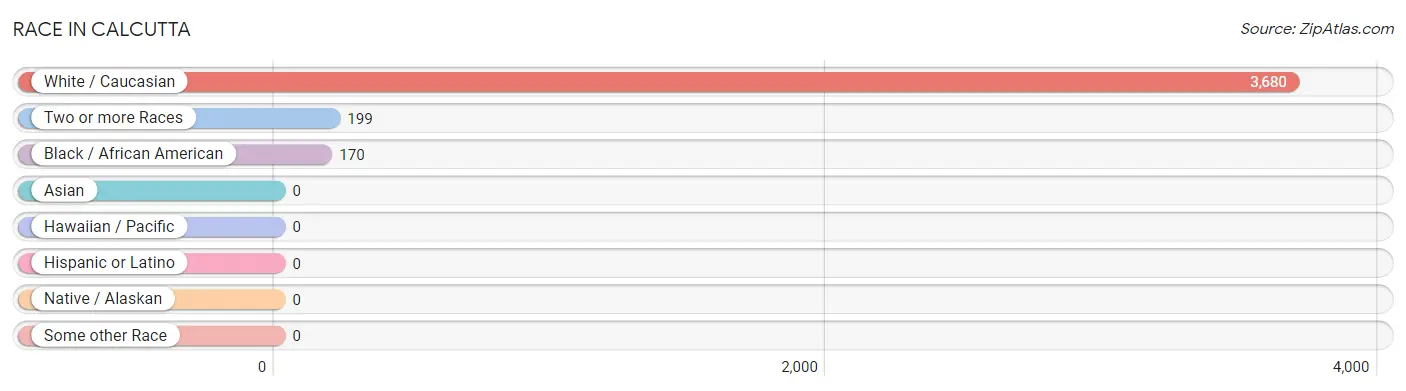
| Race | # Population | % Population |
| Asian | 0 | 0.0% |
| Black / African American | 170 | 4.2% |
| Hawaiian / Pacific | 0 | 0.0% |
| Hispanic or Latino | 0 | 0.0% |
| Native / Alaskan | 0 | 0.0% |
| White / Caucasian | 3,680 | 90.9% |
| Two or more Races | 199 | 4.9% |
| Some other Race | 0 | 0.0% |
| Total | 4,049 | 100.0% |
Ancestry in Calcutta
The most populous ancestries reported in Calcutta are German (771 | 19.0%), Irish (487 | 12.0%), American (325 | 8.0%), English (324 | 8.0%), and Italian (286 | 7.1%), together accounting for 54.2% of all Calcutta residents.
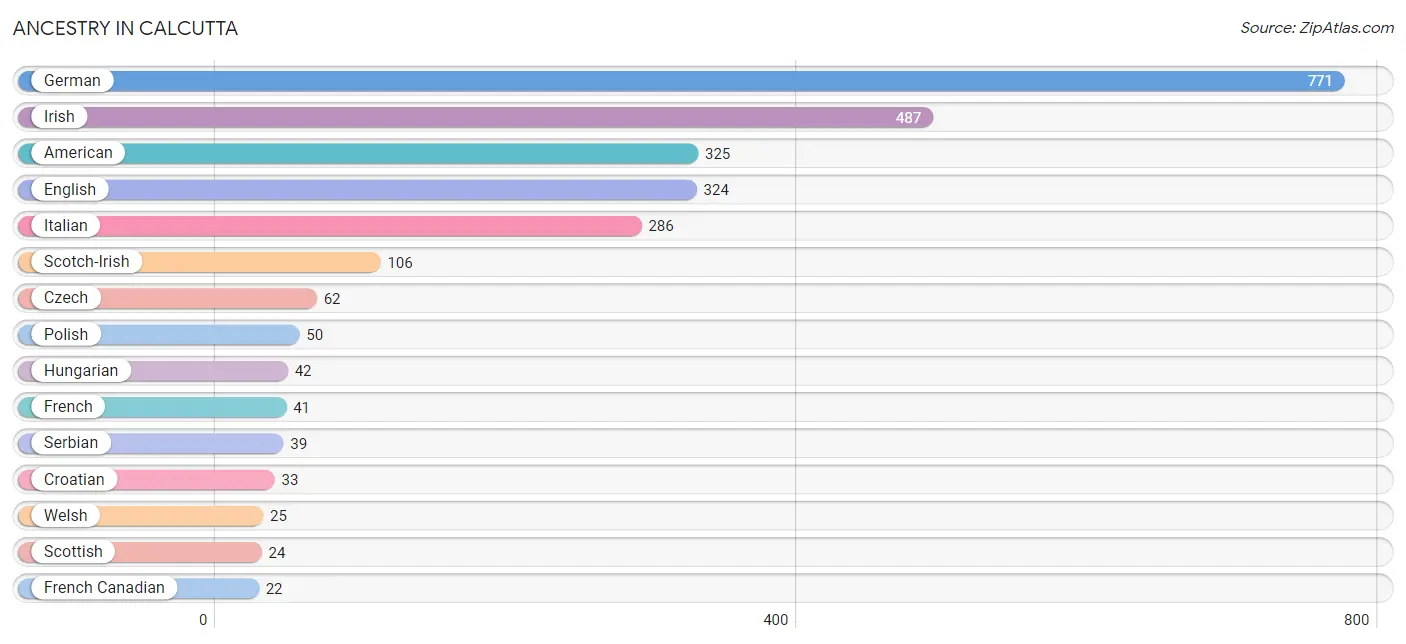
| Ancestry | # Population | % Population |
| African | 4 | 0.1% |
| American | 325 | 8.0% |
| Croatian | 33 | 0.8% |
| Czech | 62 | 1.5% |
| Czechoslovakian | 4 | 0.1% |
| English | 324 | 8.0% |
| European | 13 | 0.3% |
| French | 41 | 1.0% |
| French Canadian | 22 | 0.5% |
| German | 771 | 19.0% |
| Guamanian / Chamorro | 14 | 0.4% |
| Hungarian | 42 | 1.0% |
| Irish | 487 | 12.0% |
| Italian | 286 | 7.1% |
| Polish | 50 | 1.2% |
| Scotch-Irish | 106 | 2.6% |
| Scottish | 24 | 0.6% |
| Serbian | 39 | 1.0% |
| Slovene | 13 | 0.3% |
| Subsaharan African | 4 | 0.1% |
| Swedish | 6 | 0.2% |
| Swiss | 16 | 0.4% |
| Welsh | 25 | 0.6% | View All 23 Rows |
Immigrants in Calcutta

| Immigration Origin | # Population | % Population | View All 0 Rows |
Sex and Age in Calcutta
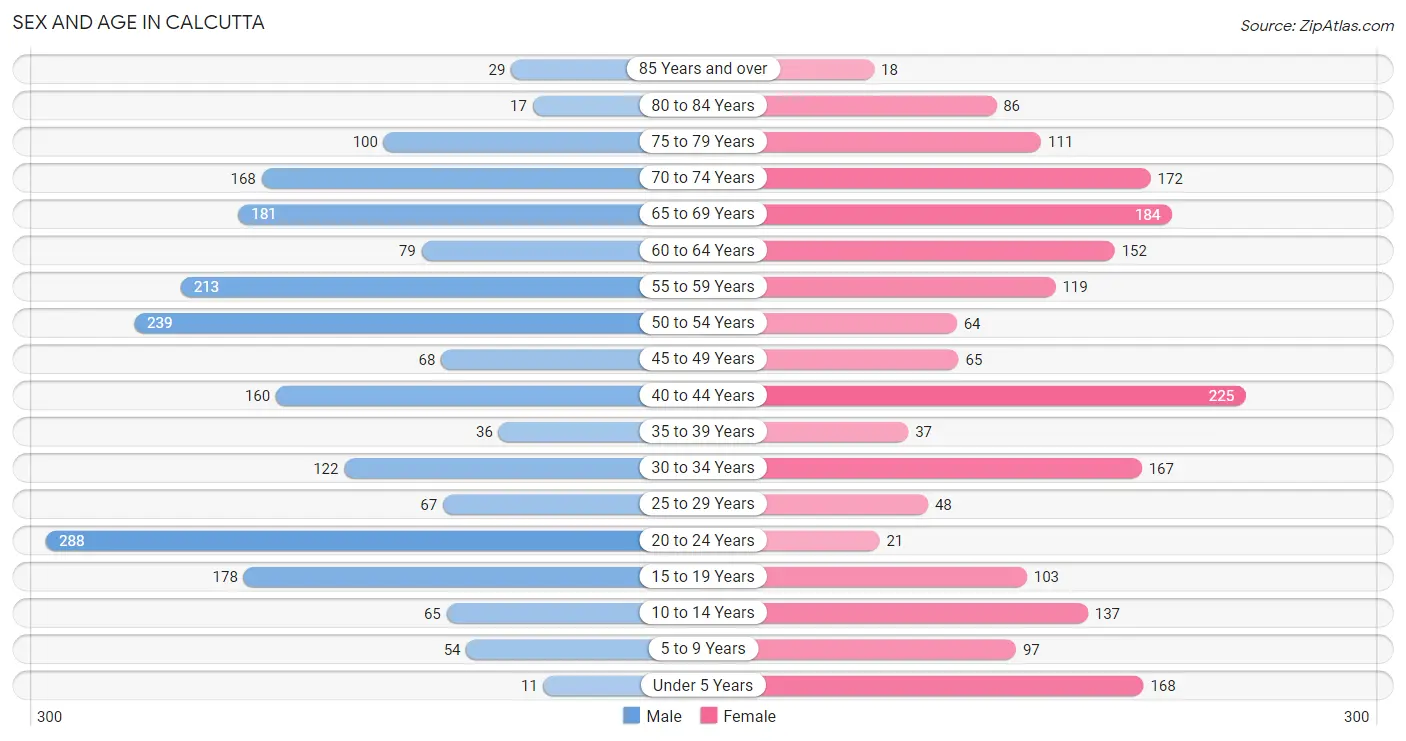
Sex and Age in Calcutta
The most populous age groups in Calcutta are 20 to 24 Years (288 | 13.9%) for men and 40 to 44 Years (225 | 11.4%) for women.
| Age Bracket | Male | Female |
| Under 5 Years | 11 (0.5%) | 168 (8.5%) |
| 5 to 9 Years | 54 (2.6%) | 97 (4.9%) |
| 10 to 14 Years | 65 (3.1%) | 137 (6.9%) |
| 15 to 19 Years | 178 (8.6%) | 103 (5.2%) |
| 20 to 24 Years | 288 (13.9%) | 21 (1.1%) |
| 25 to 29 Years | 67 (3.2%) | 48 (2.4%) |
| 30 to 34 Years | 122 (5.9%) | 167 (8.5%) |
| 35 to 39 Years | 36 (1.7%) | 37 (1.9%) |
| 40 to 44 Years | 160 (7.7%) | 225 (11.4%) |
| 45 to 49 Years | 68 (3.3%) | 65 (3.3%) |
| 50 to 54 Years | 239 (11.5%) | 64 (3.2%) |
| 55 to 59 Years | 213 (10.3%) | 119 (6.0%) |
| 60 to 64 Years | 79 (3.8%) | 152 (7.7%) |
| 65 to 69 Years | 181 (8.7%) | 184 (9.3%) |
| 70 to 74 Years | 168 (8.1%) | 172 (8.7%) |
| 75 to 79 Years | 100 (4.8%) | 111 (5.6%) |
| 80 to 84 Years | 17 (0.8%) | 86 (4.4%) |
| 85 Years and over | 29 (1.4%) | 18 (0.9%) |
| Total | 2,075 (100.0%) | 1,974 (100.0%) |
Families and Households in Calcutta
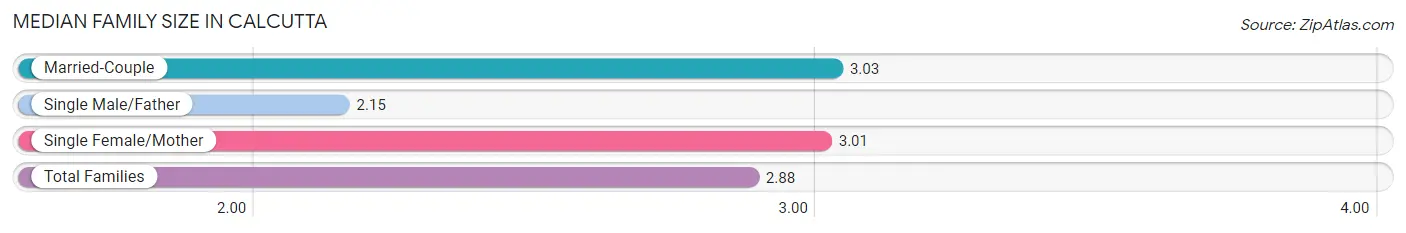
Median Family Size in Calcutta
The median family size in Calcutta is 2.88 persons per family, with married-couple families (886 | 76.1%) accounting for the largest median family size of 3.03 persons per family. On the other hand, single male/father families (202 | 17.3%) represent the smallest median family size with 2.15 persons per family.
| Family Type | # Families | Family Size |
| Married-Couple | 886 (76.1%) | 3.03 |
| Single Male/Father | 202 (17.3%) | 2.15 |
| Single Female/Mother | 76 (6.5%) | 3.01 |
| Total Families | 1,164 (100.0%) | 2.88 |
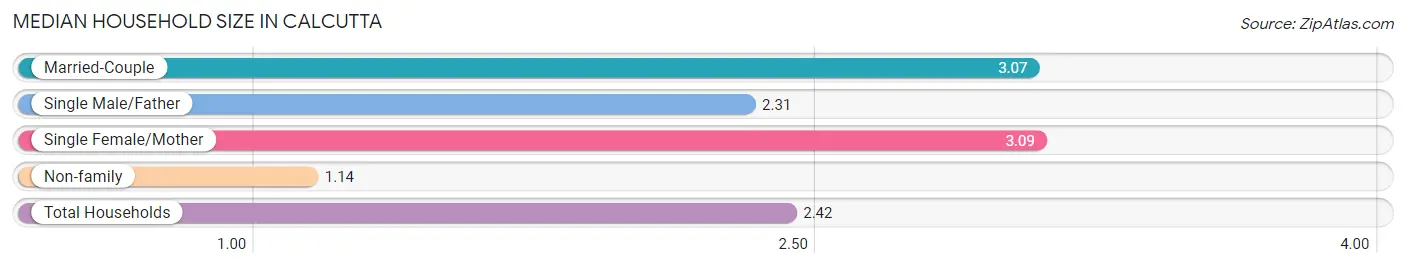
Median Household Size in Calcutta
The median household size in Calcutta is 2.42 persons per household, with single female/mother households (76 | 4.6%) accounting for the largest median household size of 3.09 persons per household. non-family households (475 | 29.0%) represent the smallest median household size with 1.14 persons per household.
| Household Type | # Households | Household Size |
| Married-Couple | 886 (54.1%) | 3.07 |
| Single Male/Father | 202 (12.3%) | 2.31 |
| Single Female/Mother | 76 (4.6%) | 3.09 |
| Non-family | 475 (29.0%) | 1.14 |
| Total Households | 1,639 (100.0%) | 2.42 |
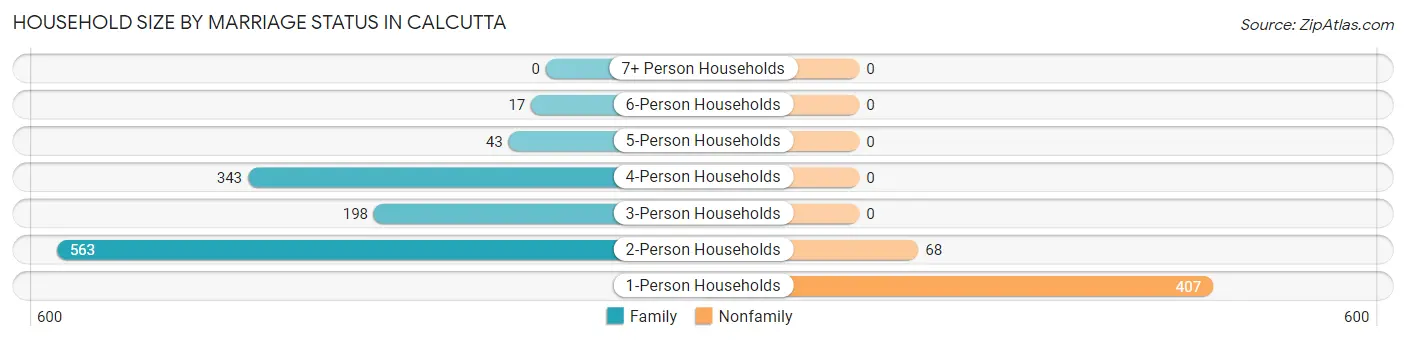
Household Size by Marriage Status in Calcutta
Out of a total of 1,639 households in Calcutta, 1,164 (71.0%) are family households, while 475 (29.0%) are nonfamily households. The most numerous type of family households are 2-person households, comprising 563, and the most common type of nonfamily households are 1-person households, comprising 407.
| Household Size | Family Households | Nonfamily Households |
| 1-Person Households | - | 407 (24.8%) |
| 2-Person Households | 563 (34.4%) | 68 (4.2%) |
| 3-Person Households | 198 (12.1%) | 0 (0.0%) |
| 4-Person Households | 343 (20.9%) | 0 (0.0%) |
| 5-Person Households | 43 (2.6%) | 0 (0.0%) |
| 6-Person Households | 17 (1.0%) | 0 (0.0%) |
| 7+ Person Households | 0 (0.0%) | 0 (0.0%) |
| Total | 1,164 (71.0%) | 475 (29.0%) |
Female Fertility in Calcutta
Fertility by Age in Calcutta
Average fertility rate in Calcutta is 24.0 births per 1,000 women. Women in the age bracket of 20 to 34 years have the highest fertility rate with 68.0 births per 1,000 women. Women in the age bracket of 20 to 34 years acount for 100.0% of all women with births.
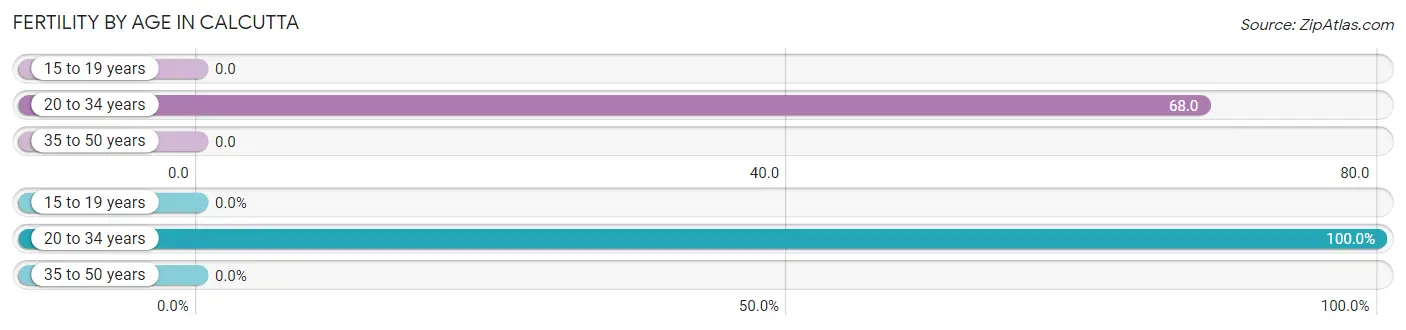
| Age Bracket | Women with Births | Births / 1,000 Women |
| 15 to 19 years | 0 (0.0%) | 0.0 |
| 20 to 34 years | 16 (100.0%) | 68.0 |
| 35 to 50 years | 0 (0.0%) | 0.0 |
| Total | 16 (100.0%) | 24.0 |
Fertility by Age by Marriage Status in Calcutta
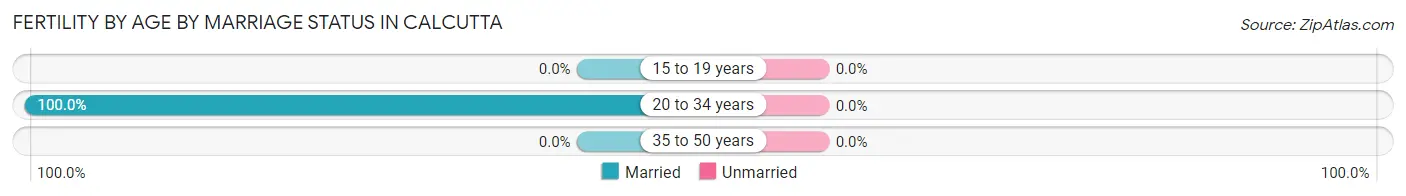
| Age Bracket | Married | Unmarried |
| 15 to 19 years | 0 (0.0%) | 0 (0.0%) |
| 20 to 34 years | 16 (100.0%) | 0 (0.0%) |
| 35 to 50 years | 0 (0.0%) | 0 (0.0%) |
| Total | 16 (100.0%) | 0 (0.0%) |
Fertility by Education in Calcutta
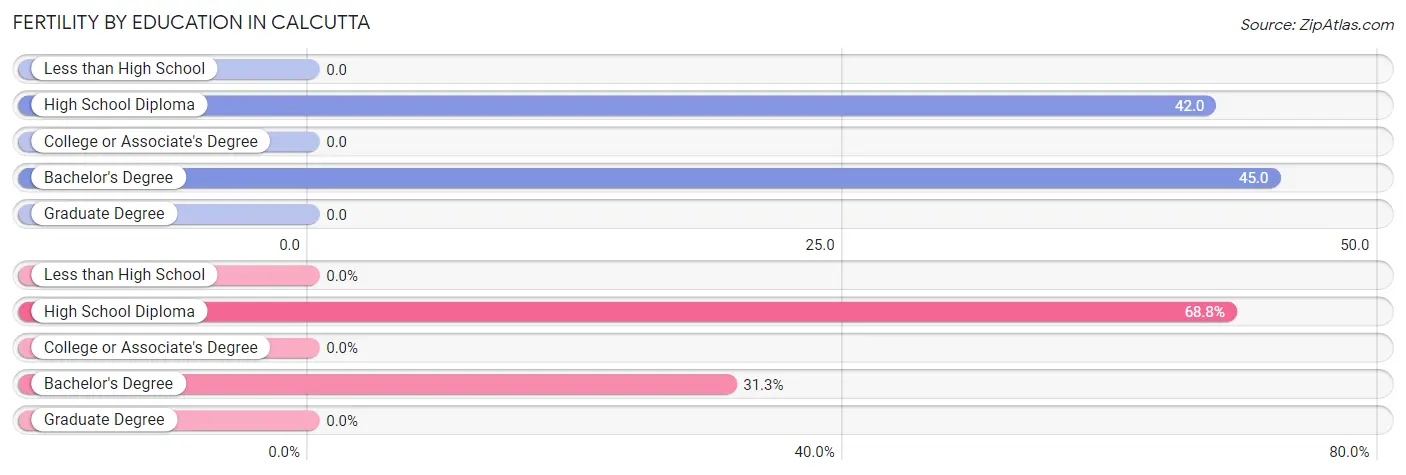
| Educational Attainment | Women with Births | Births / 1,000 Women |
| Less than High School | 0 (0.0%) | 0.0 |
| High School Diploma | 11 (68.8%) | 42.0 |
| College or Associate's Degree | 0 (0.0%) | 0.0 |
| Bachelor's Degree | 5 (31.2%) | 45.0 |
| Graduate Degree | 0 (0.0%) | 0.0 |
| Total | 16 (100.0%) | 24.0 |
Fertility by Education by Marriage Status in Calcutta
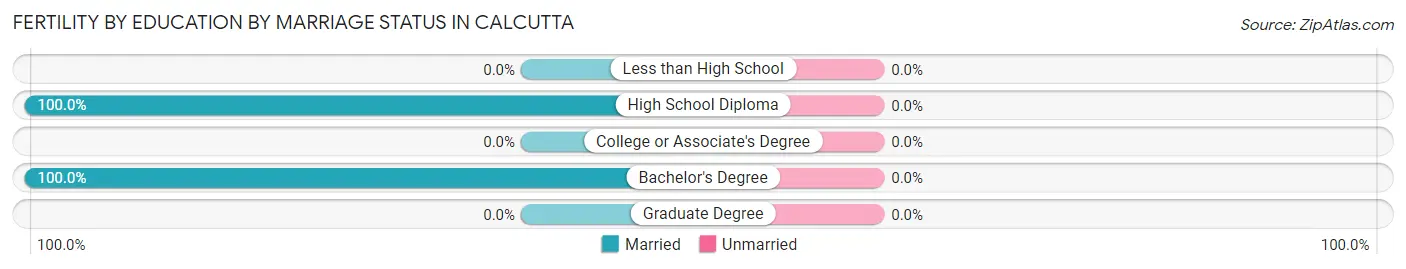
| Educational Attainment | Married | Unmarried |
| Less than High School | 0 (0.0%) | 0 (0.0%) |
| High School Diploma | 11 (100.0%) | 0 (0.0%) |
| College or Associate's Degree | 0 (0.0%) | 0 (0.0%) |
| Bachelor's Degree | 5 (100.0%) | 0 (0.0%) |
| Graduate Degree | 0 (0.0%) | 0 (0.0%) |
| Total | 16 (100.0%) | 0 (0.0%) |
Employment Characteristics in Calcutta
Employment by Class of Employer in Calcutta
Among the 1,972 employed individuals in Calcutta, private company employees (1,445 | 73.3%), not-for-profit organizations (188 | 9.5%), and state government employees (157 | 8.0%) make up the most common classes of employment.
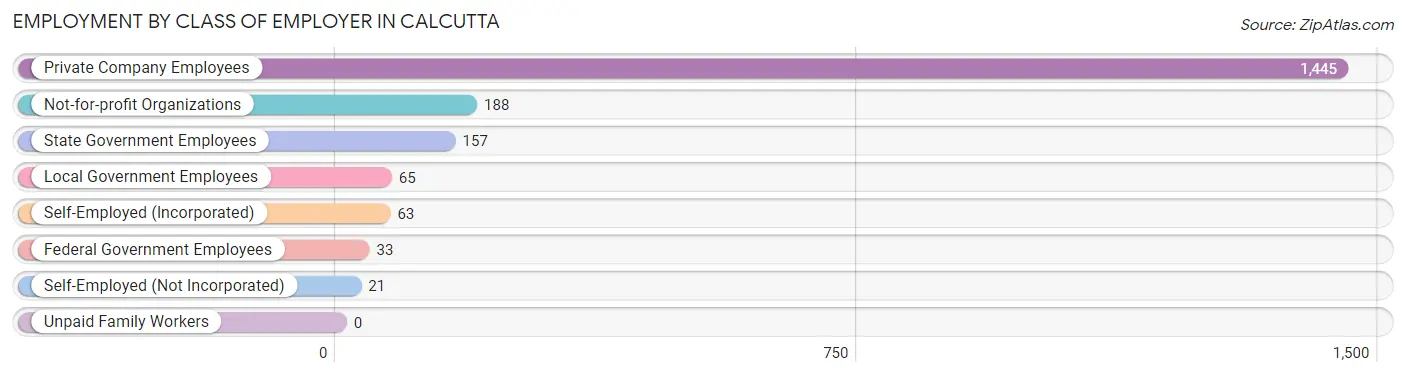
| Employer Class | # Employees | % Employees |
| Private Company Employees | 1,445 | 73.3% |
| Self-Employed (Incorporated) | 63 | 3.2% |
| Self-Employed (Not Incorporated) | 21 | 1.1% |
| Not-for-profit Organizations | 188 | 9.5% |
| Local Government Employees | 65 | 3.3% |
| State Government Employees | 157 | 8.0% |
| Federal Government Employees | 33 | 1.7% |
| Unpaid Family Workers | 0 | 0.0% |
| Total | 1,972 | 100.0% |
Employment Status by Age in Calcutta
According to the labor force statistics for Calcutta, out of the total population over 16 years of age (3,493), 57.8% or 2,019 individuals are in the labor force, with 2.3% or 46 of them unemployed. The age group with the highest labor force participation rate is 20 to 24 years, with 100.0% or 309 individuals in the labor force. Within the labor force, the 65 to 74 years age range has the highest percentage of unemployed individuals, with 21.2% or 32 of them being unemployed.
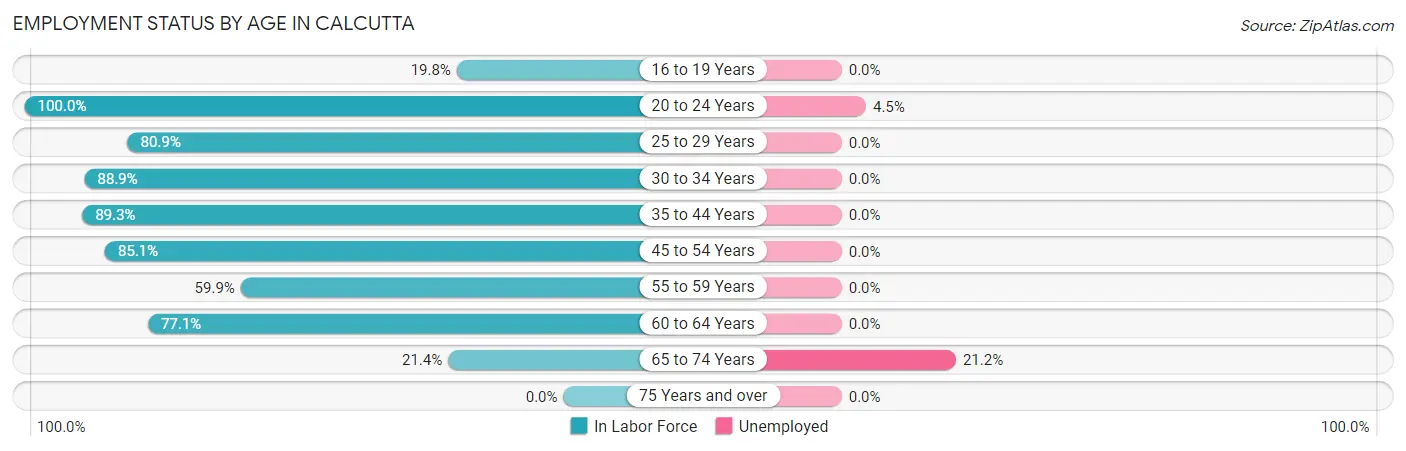
| Age Bracket | In Labor Force | Unemployed |
| 16 to 19 Years | 51 (19.8%) | 0 (0.0%) |
| 20 to 24 Years | 309 (100.0%) | 14 (4.5%) |
| 25 to 29 Years | 93 (80.9%) | 0 (0.0%) |
| 30 to 34 Years | 257 (88.9%) | 0 (0.0%) |
| 35 to 44 Years | 409 (89.3%) | 0 (0.0%) |
| 45 to 54 Years | 371 (85.1%) | 0 (0.0%) |
| 55 to 59 Years | 199 (59.9%) | 0 (0.0%) |
| 60 to 64 Years | 178 (77.1%) | 0 (0.0%) |
| 65 to 74 Years | 151 (21.4%) | 32 (21.2%) |
| 75 Years and over | 0 (0.0%) | 0 (0.0%) |
| Total | 2,019 (57.8%) | 46 (2.3%) |
Employment Status by Educational Attainment in Calcutta
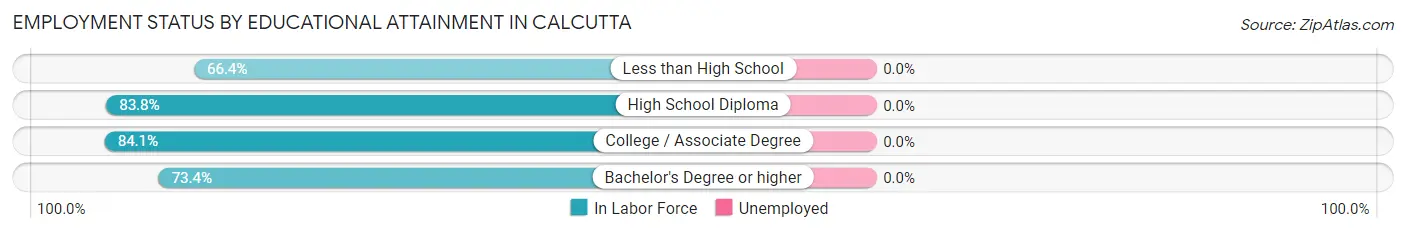
| Educational Attainment | In Labor Force | Unemployed |
| Less than High School | 81 (66.4%) | 0 (0.0%) |
| High School Diploma | 697 (83.8%) | 0 (0.0%) |
| College / Associate Degree | 497 (84.1%) | 0 (0.0%) |
| Bachelor's Degree or higher | 232 (73.4%) | 0 (0.0%) |
| Total | 1,507 (81.0%) | 0 (0.0%) |
Employment Occupations by Sex in Calcutta
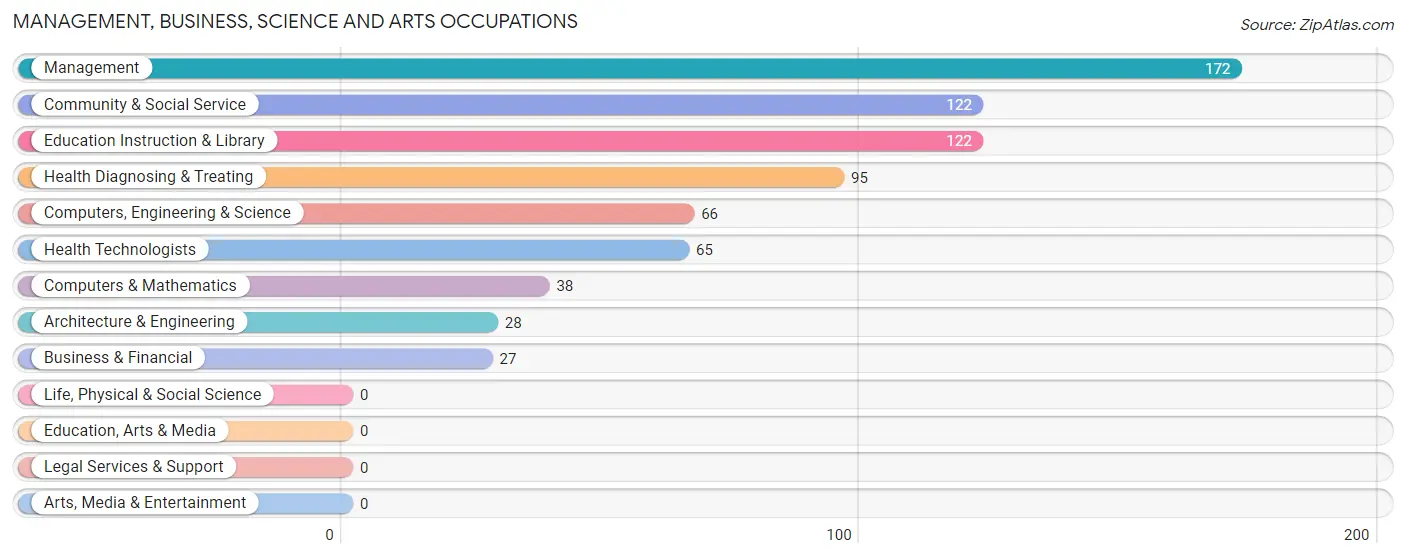
Management, Business, Science and Arts Occupations
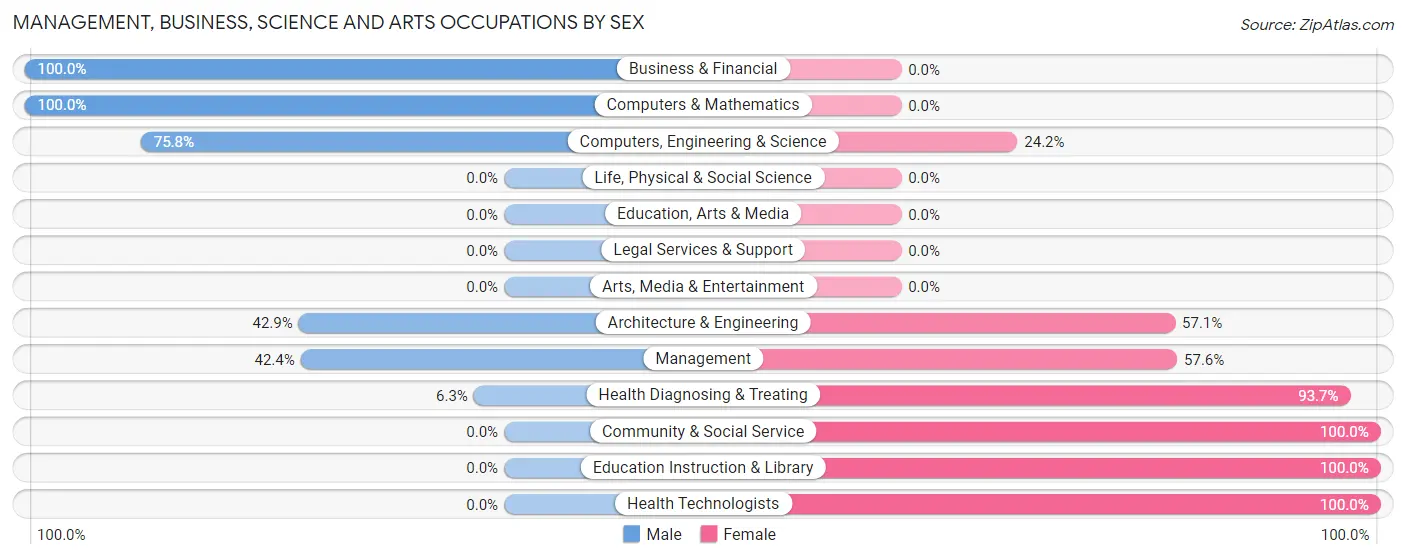
The most common Management, Business, Science and Arts occupations in Calcutta are Management (172 | 8.7%), Community & Social Service (122 | 6.2%), Education Instruction & Library (122 | 6.2%), Health Diagnosing & Treating (95 | 4.8%), and Computers, Engineering & Science (66 | 3.4%).
Management, Business, Science and Arts Occupations by Sex
Within the Management, Business, Science and Arts occupations in Calcutta, the most male-oriented occupations are Business & Financial (100.0%), Computers & Mathematics (100.0%), and Computers, Engineering & Science (75.8%), while the most female-oriented occupations are Community & Social Service (100.0%), Education Instruction & Library (100.0%), and Health Technologists (100.0%).
| Occupation | Male | Female |
| Management | 73 (42.4%) | 99 (57.6%) |
| Business & Financial | 27 (100.0%) | 0 (0.0%) |
| Computers, Engineering & Science | 50 (75.8%) | 16 (24.2%) |
| Computers & Mathematics | 38 (100.0%) | 0 (0.0%) |
| Architecture & Engineering | 12 (42.9%) | 16 (57.1%) |
| Life, Physical & Social Science | 0 (0.0%) | 0 (0.0%) |
| Community & Social Service | 0 (0.0%) | 122 (100.0%) |
| Education, Arts & Media | 0 (0.0%) | 0 (0.0%) |
| Legal Services & Support | 0 (0.0%) | 0 (0.0%) |
| Education Instruction & Library | 0 (0.0%) | 122 (100.0%) |
| Arts, Media & Entertainment | 0 (0.0%) | 0 (0.0%) |
| Health Diagnosing & Treating | 6 (6.3%) | 89 (93.7%) |
| Health Technologists | 0 (0.0%) | 65 (100.0%) |
| Total (Category) | 156 (32.4%) | 326 (67.6%) |
| Total (Overall) | 1,118 (56.7%) | 854 (43.3%) |
Services Occupations
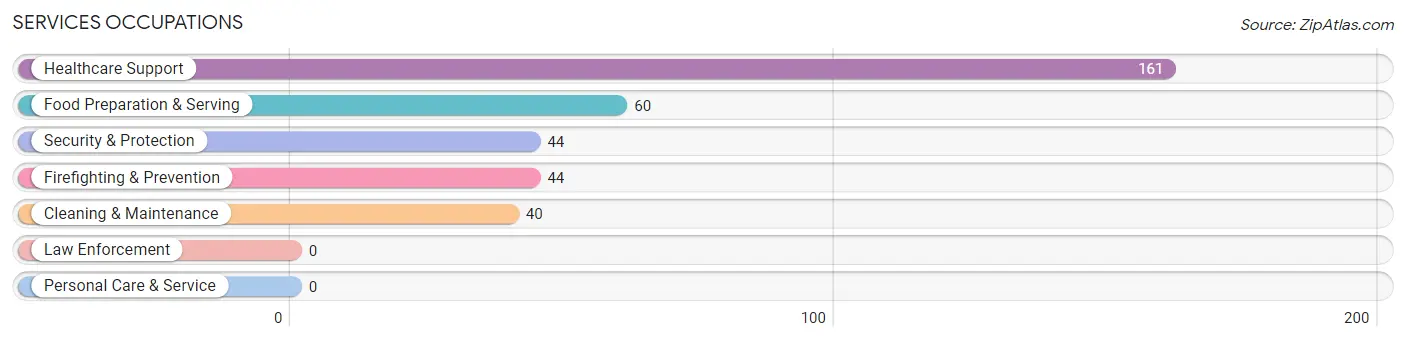
The most common Services occupations in Calcutta are Healthcare Support (161 | 8.2%), Food Preparation & Serving (60 | 3.0%), Security & Protection (44 | 2.2%), Firefighting & Prevention (44 | 2.2%), and Cleaning & Maintenance (40 | 2.0%).
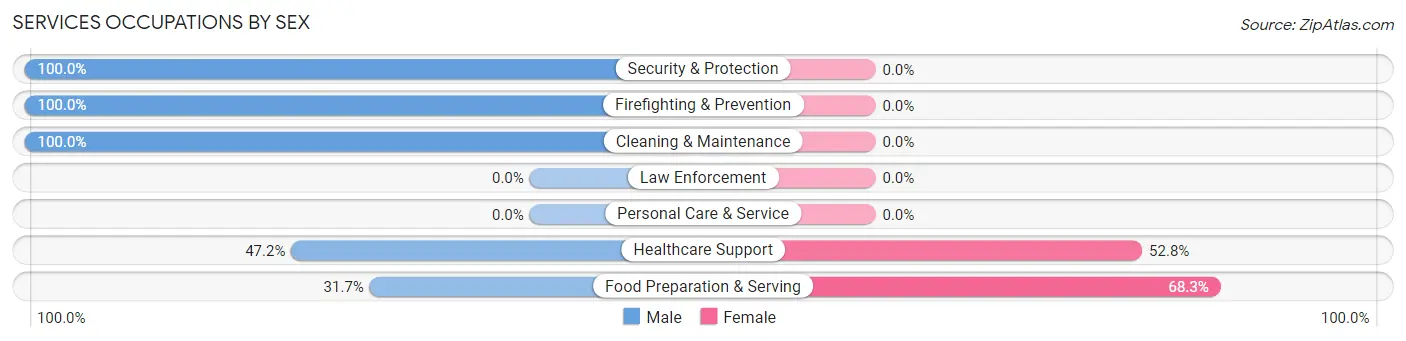
Services Occupations by Sex
Within the Services occupations in Calcutta, the most male-oriented occupations are Security & Protection (100.0%), Firefighting & Prevention (100.0%), and Cleaning & Maintenance (100.0%), while the most female-oriented occupations are Food Preparation & Serving (68.3%), and Healthcare Support (52.8%).
| Occupation | Male | Female |
| Healthcare Support | 76 (47.2%) | 85 (52.8%) |
| Security & Protection | 44 (100.0%) | 0 (0.0%) |
| Firefighting & Prevention | 44 (100.0%) | 0 (0.0%) |
| Law Enforcement | 0 (0.0%) | 0 (0.0%) |
| Food Preparation & Serving | 19 (31.7%) | 41 (68.3%) |
| Cleaning & Maintenance | 40 (100.0%) | 0 (0.0%) |
| Personal Care & Service | 0 (0.0%) | 0 (0.0%) |
| Total (Category) | 179 (58.7%) | 126 (41.3%) |
| Total (Overall) | 1,118 (56.7%) | 854 (43.3%) |
Sales and Office Occupations
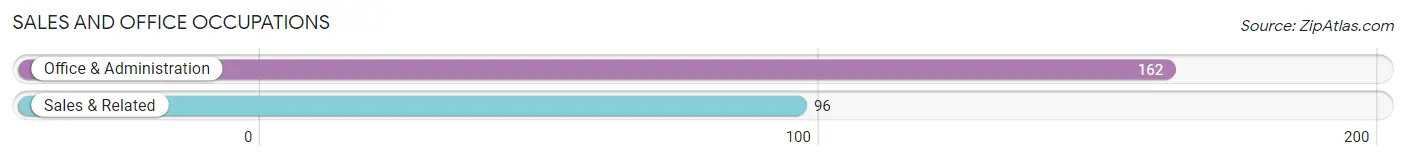
The most common Sales and Office occupations in Calcutta are Office & Administration (162 | 8.2%), and Sales & Related (96 | 4.9%).
Sales and Office Occupations by Sex
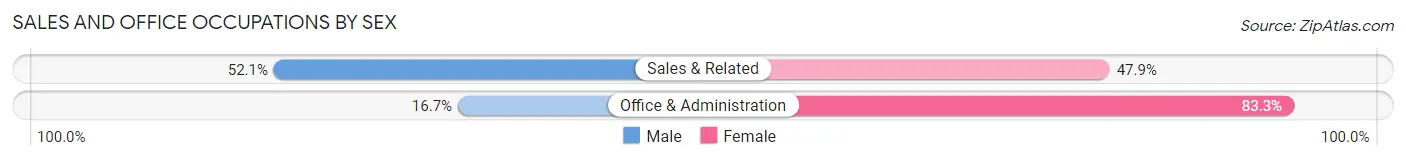
| Occupation | Male | Female |
| Sales & Related | 50 (52.1%) | 46 (47.9%) |
| Office & Administration | 27 (16.7%) | 135 (83.3%) |
| Total (Category) | 77 (29.8%) | 181 (70.2%) |
| Total (Overall) | 1,118 (56.7%) | 854 (43.3%) |
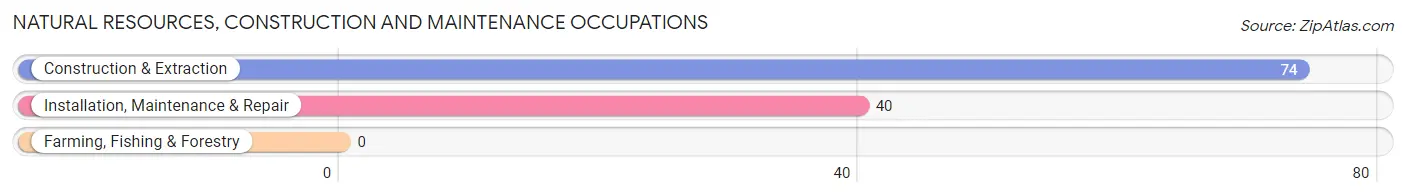
Natural Resources, Construction and Maintenance Occupations
The most common Natural Resources, Construction and Maintenance occupations in Calcutta are Construction & Extraction (74 | 3.7%), and Installation, Maintenance & Repair (40 | 2.0%).
Natural Resources, Construction and Maintenance Occupations by Sex
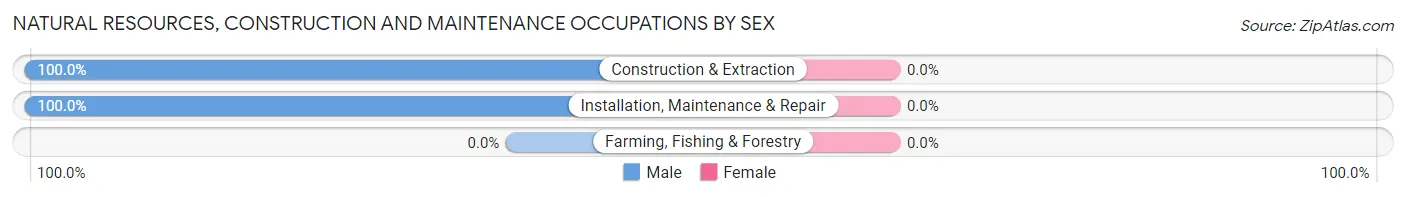
| Occupation | Male | Female |
| Farming, Fishing & Forestry | 0 (0.0%) | 0 (0.0%) |
| Construction & Extraction | 74 (100.0%) | 0 (0.0%) |
| Installation, Maintenance & Repair | 40 (100.0%) | 0 (0.0%) |
| Total (Category) | 114 (100.0%) | 0 (0.0%) |
| Total (Overall) | 1,118 (56.7%) | 854 (43.3%) |
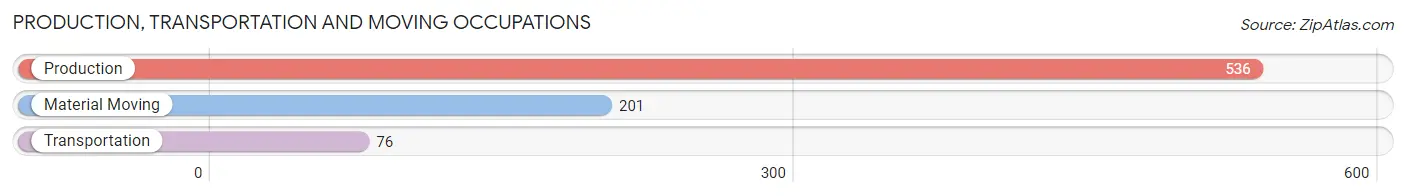
Production, Transportation and Moving Occupations
The most common Production, Transportation and Moving occupations in Calcutta are Production (536 | 27.2%), Material Moving (201 | 10.2%), and Transportation (76 | 3.8%).
Production, Transportation and Moving Occupations by Sex
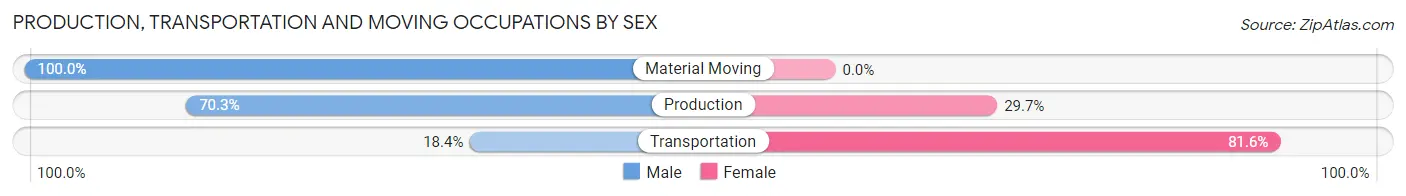
| Occupation | Male | Female |
| Production | 377 (70.3%) | 159 (29.7%) |
| Transportation | 14 (18.4%) | 62 (81.6%) |
| Material Moving | 201 (100.0%) | 0 (0.0%) |
| Total (Category) | 592 (72.8%) | 221 (27.2%) |
| Total (Overall) | 1,118 (56.7%) | 854 (43.3%) |
Employment Industries by Sex in Calcutta
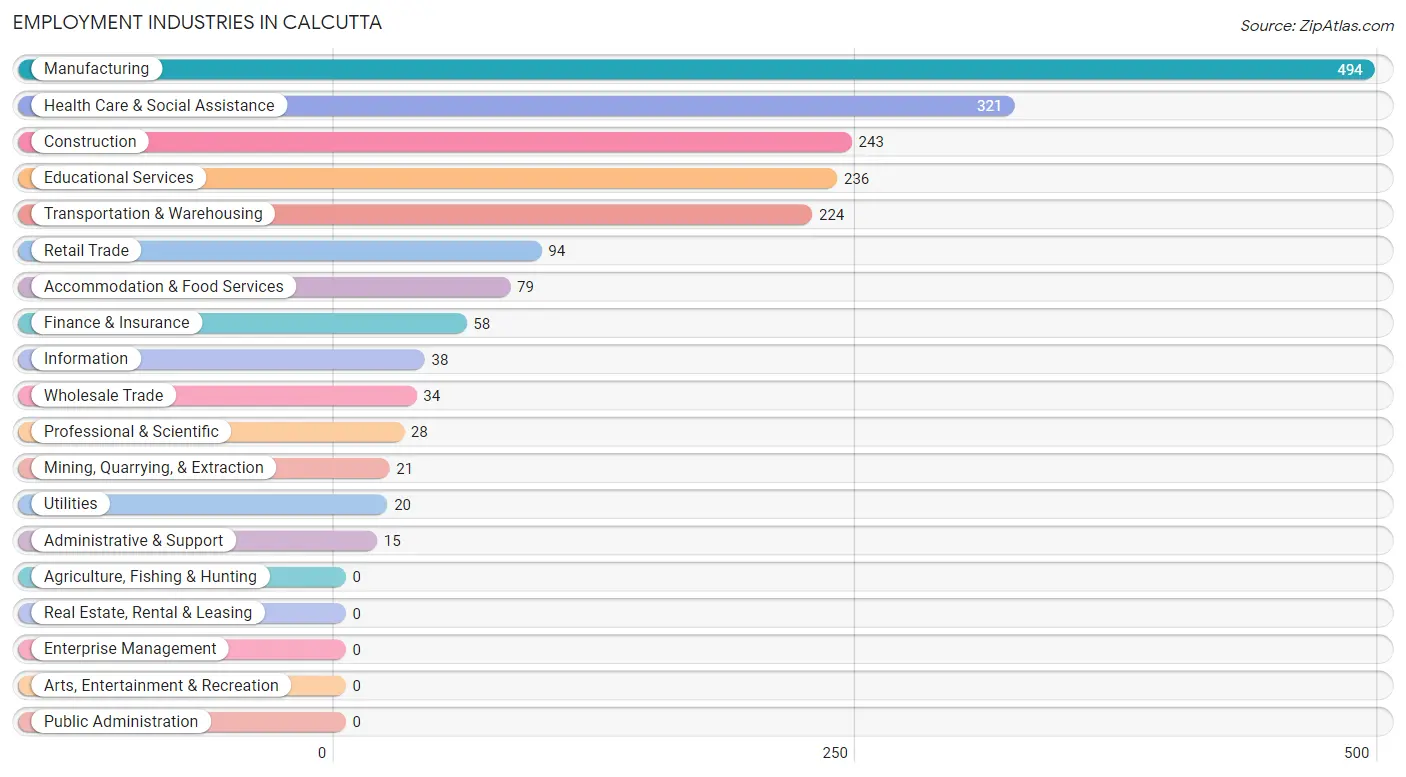
Employment Industries in Calcutta
The major employment industries in Calcutta include Manufacturing (494 | 25.1%), Health Care & Social Assistance (321 | 16.3%), Construction (243 | 12.3%), Educational Services (236 | 12.0%), and Transportation & Warehousing (224 | 11.4%).
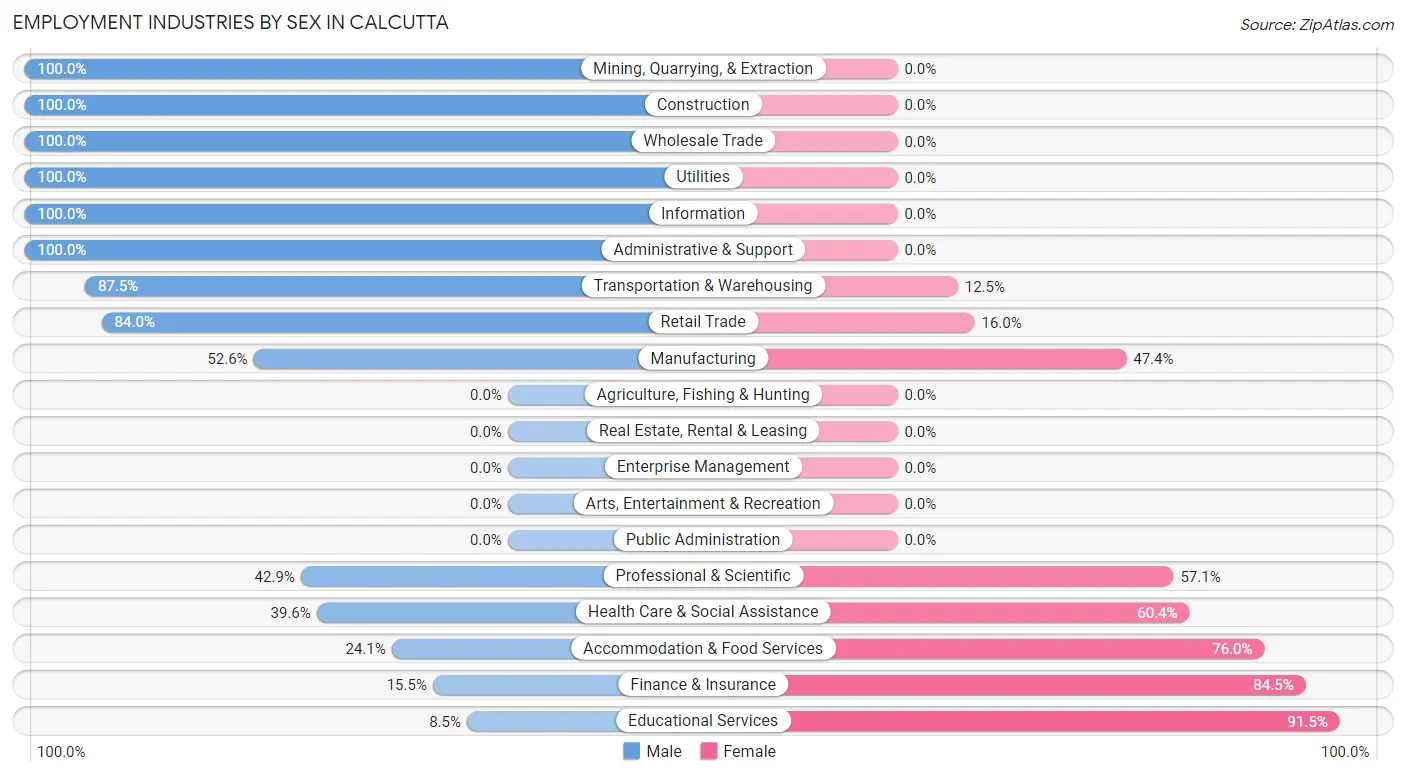
Employment Industries by Sex in Calcutta
The Calcutta industries that see more men than women are Mining, Quarrying, & Extraction (100.0%), Construction (100.0%), and Wholesale Trade (100.0%), whereas the industries that tend to have a higher number of women are Educational Services (91.5%), Finance & Insurance (84.5%), and Accommodation & Food Services (75.9%).
| Industry | Male | Female |
| Agriculture, Fishing & Hunting | 0 (0.0%) | 0 (0.0%) |
| Mining, Quarrying, & Extraction | 21 (100.0%) | 0 (0.0%) |
| Construction | 243 (100.0%) | 0 (0.0%) |
| Manufacturing | 260 (52.6%) | 234 (47.4%) |
| Wholesale Trade | 34 (100.0%) | 0 (0.0%) |
| Retail Trade | 79 (84.0%) | 15 (16.0%) |
| Transportation & Warehousing | 196 (87.5%) | 28 (12.5%) |
| Utilities | 20 (100.0%) | 0 (0.0%) |
| Information | 38 (100.0%) | 0 (0.0%) |
| Finance & Insurance | 9 (15.5%) | 49 (84.5%) |
| Real Estate, Rental & Leasing | 0 (0.0%) | 0 (0.0%) |
| Professional & Scientific | 12 (42.9%) | 16 (57.1%) |
| Enterprise Management | 0 (0.0%) | 0 (0.0%) |
| Administrative & Support | 15 (100.0%) | 0 (0.0%) |
| Educational Services | 20 (8.5%) | 216 (91.5%) |
| Health Care & Social Assistance | 127 (39.6%) | 194 (60.4%) |
| Arts, Entertainment & Recreation | 0 (0.0%) | 0 (0.0%) |
| Accommodation & Food Services | 19 (24.0%) | 60 (75.9%) |
| Public Administration | 0 (0.0%) | 0 (0.0%) |
| Total | 1,118 (56.7%) | 854 (43.3%) |
Education in Calcutta
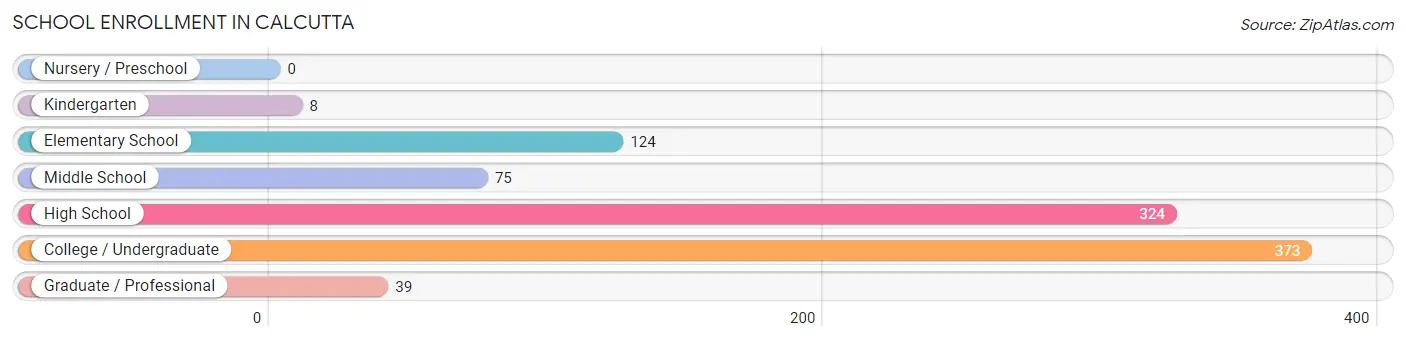
School Enrollment in Calcutta
The most common levels of schooling among the 943 students in Calcutta are college / undergraduate (373 | 39.6%), high school (324 | 34.4%), and elementary school (124 | 13.2%).
| School Level | # Students | % Students |
| Nursery / Preschool | 0 | 0.0% |
| Kindergarten | 8 | 0.9% |
| Elementary School | 124 | 13.2% |
| Middle School | 75 | 8.0% |
| High School | 324 | 34.4% |
| College / Undergraduate | 373 | 39.6% |
| Graduate / Professional | 39 | 4.1% |
| Total | 943 | 100.0% |
School Enrollment by Age by Funding Source in Calcutta
Out of a total of 943 students who are enrolled in schools in Calcutta, 105 (11.1%) attend a private institution, while the remaining 838 (88.9%) are enrolled in public schools. The age group of 5 to 9 year old has the highest likelihood of being enrolled in private schools, with 44 (33.3% in the age bracket) enrolled. Conversely, the age group of 15 to 17 year olds has the lowest likelihood of being enrolled in a private school, with 186 (100.0% in the age bracket) attending a public institution.
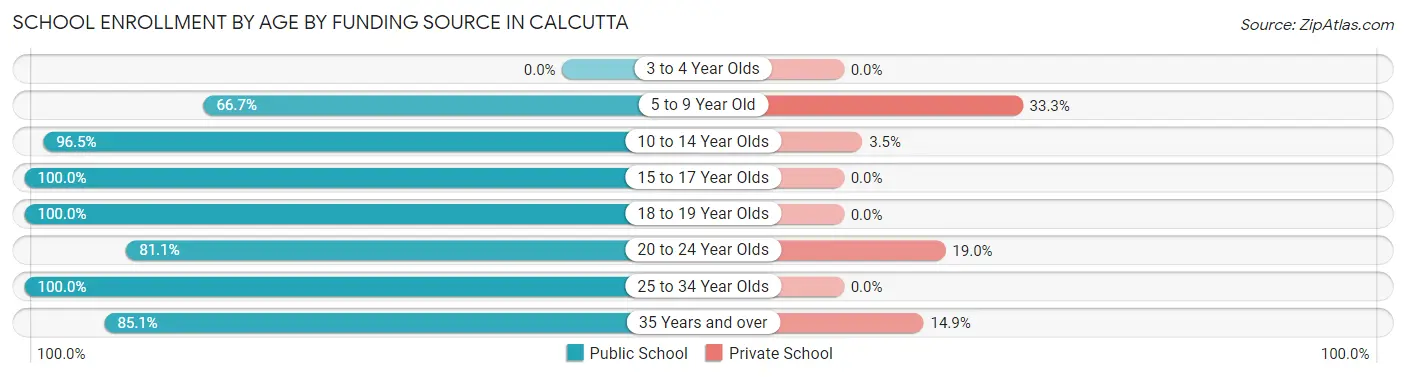
| Age Bracket | Public School | Private School |
| 3 to 4 Year Olds | 0 (0.0%) | 0 (0.0%) |
| 5 to 9 Year Old | 88 (66.7%) | 44 (33.3%) |
| 10 to 14 Year Olds | 195 (96.5%) | 7 (3.5%) |
| 15 to 17 Year Olds | 186 (100.0%) | 0 (0.0%) |
| 18 to 19 Year Olds | 91 (100.0%) | 0 (0.0%) |
| 20 to 24 Year Olds | 154 (81.0%) | 36 (19.0%) |
| 25 to 34 Year Olds | 21 (100.0%) | 0 (0.0%) |
| 35 Years and over | 103 (85.1%) | 18 (14.9%) |
| Total | 838 (88.9%) | 105 (11.1%) |
Educational Attainment by Field of Study in Calcutta
Education (105 | 20.7%), arts & humanities (74 | 14.6%), business (73 | 14.4%), science & technology (64 | 12.6%), and computers & mathematics (62 | 12.2%) are the most common fields of study among 507 individuals in Calcutta who have obtained a bachelor's degree or higher.
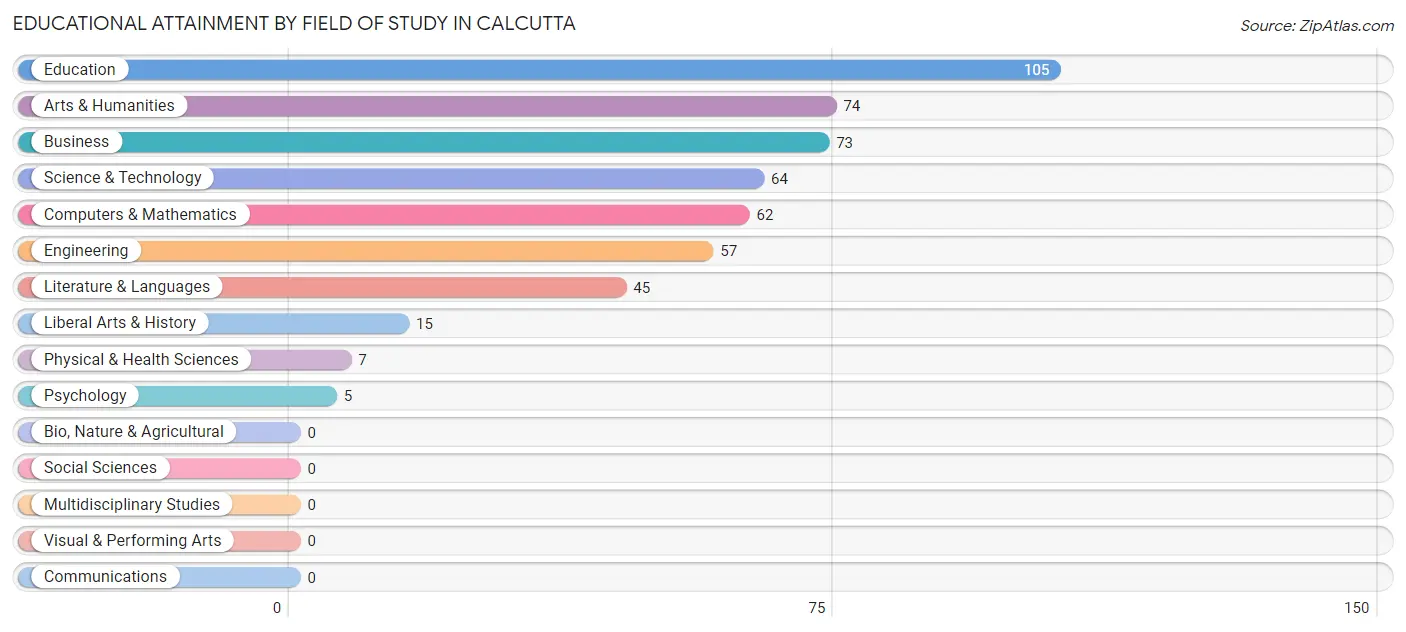
| Field of Study | # Graduates | % Graduates |
| Computers & Mathematics | 62 | 12.2% |
| Bio, Nature & Agricultural | 0 | 0.0% |
| Physical & Health Sciences | 7 | 1.4% |
| Psychology | 5 | 1.0% |
| Social Sciences | 0 | 0.0% |
| Engineering | 57 | 11.2% |
| Multidisciplinary Studies | 0 | 0.0% |
| Science & Technology | 64 | 12.6% |
| Business | 73 | 14.4% |
| Education | 105 | 20.7% |
| Literature & Languages | 45 | 8.9% |
| Liberal Arts & History | 15 | 3.0% |
| Visual & Performing Arts | 0 | 0.0% |
| Communications | 0 | 0.0% |
| Arts & Humanities | 74 | 14.6% |
| Total | 507 | 100.0% |
Transportation & Commute in Calcutta
Vehicle Availability by Sex in Calcutta
The most prevalent vehicle ownership categories in Calcutta are males with 4 vehicles (348, accounting for 31.1%) and females with 4 vehicles (180, making up 40.7%).
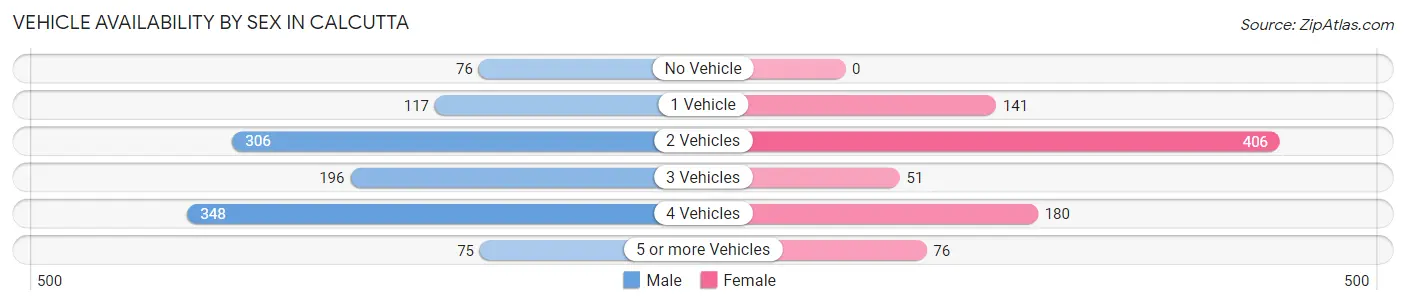
| Vehicles Available | Male | Female |
| No Vehicle | 76 (6.8%) | 0 (0.0%) |
| 1 Vehicle | 117 (10.5%) | 141 (16.5%) |
| 2 Vehicles | 306 (27.4%) | 406 (47.5%) |
| 3 Vehicles | 196 (17.5%) | 51 (6.0%) |
| 4 Vehicles | 348 (31.1%) | 180 (21.1%) |
| 5 or more Vehicles | 75 (6.7%) | 76 (8.9%) |
| Total | 1,118 (100.0%) | 854 (100.0%) |
Commute Time in Calcutta
The most frequently occuring commute durations in Calcutta are 5 to 9 minutes (541 commuters, 28.5%), 10 to 14 minutes (443 commuters, 23.3%), and 20 to 24 minutes (308 commuters, 16.2%).
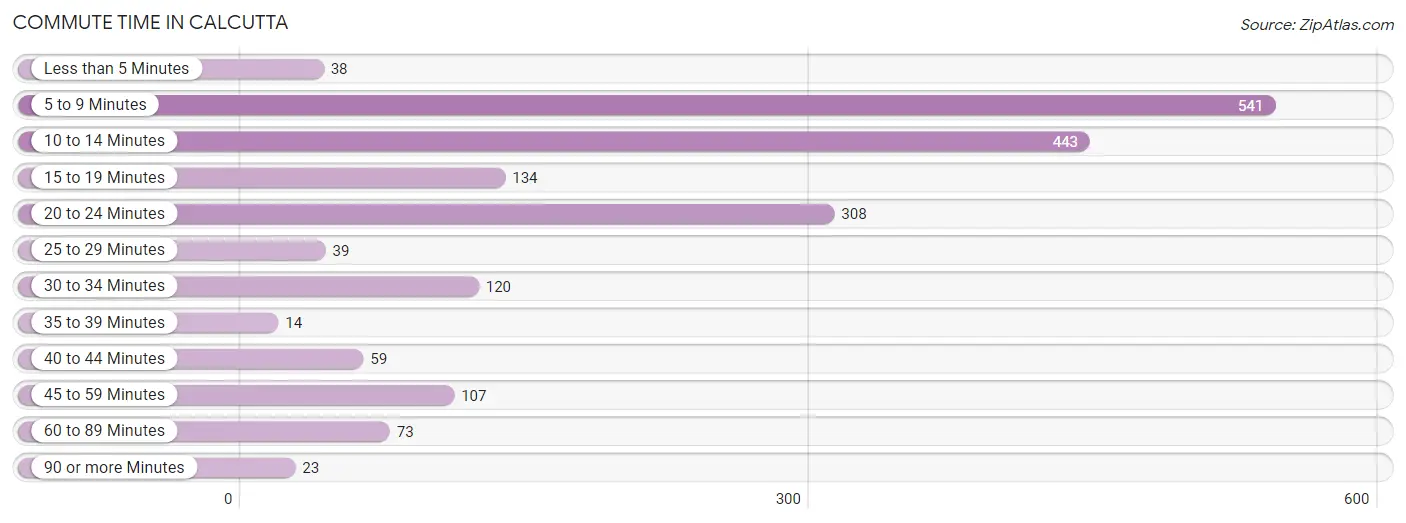
| Commute Time | # Commuters | % Commuters |
| Less than 5 Minutes | 38 | 2.0% |
| 5 to 9 Minutes | 541 | 28.5% |
| 10 to 14 Minutes | 443 | 23.3% |
| 15 to 19 Minutes | 134 | 7.1% |
| 20 to 24 Minutes | 308 | 16.2% |
| 25 to 29 Minutes | 39 | 2.1% |
| 30 to 34 Minutes | 120 | 6.3% |
| 35 to 39 Minutes | 14 | 0.7% |
| 40 to 44 Minutes | 59 | 3.1% |
| 45 to 59 Minutes | 107 | 5.6% |
| 60 to 89 Minutes | 73 | 3.8% |
| 90 or more Minutes | 23 | 1.2% |
Commute Time by Sex in Calcutta
The most common commute times in Calcutta are 5 to 9 minutes (330 commuters, 30.2%) for males and 5 to 9 minutes (211 commuters, 26.2%) for females.
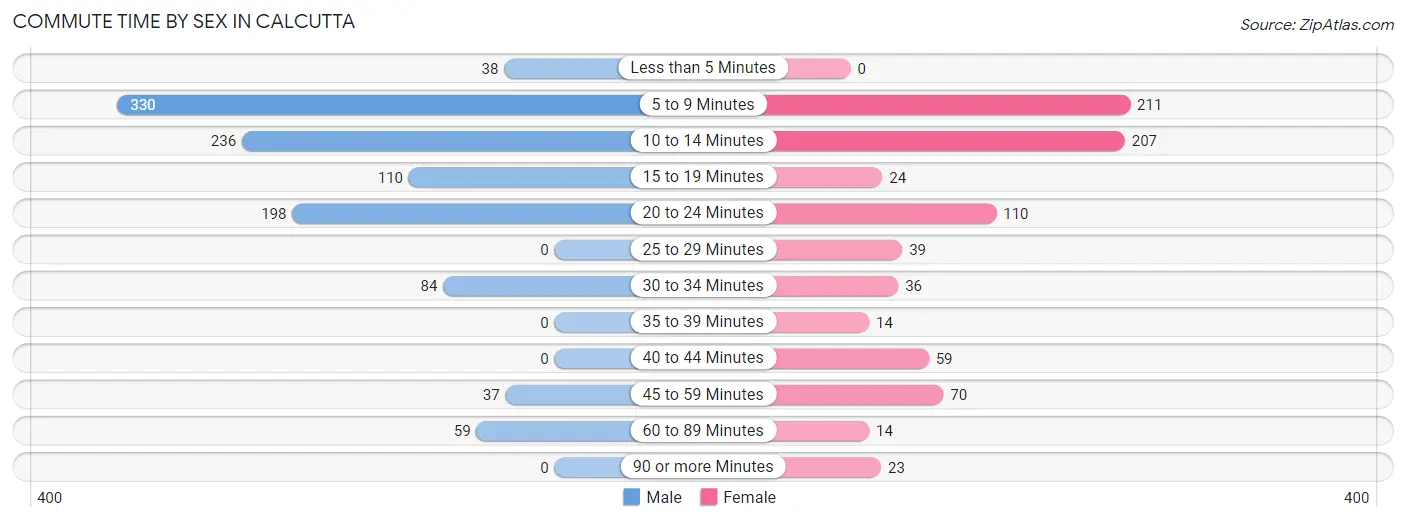
| Commute Time | Male | Female |
| Less than 5 Minutes | 38 (3.5%) | 0 (0.0%) |
| 5 to 9 Minutes | 330 (30.2%) | 211 (26.2%) |
| 10 to 14 Minutes | 236 (21.6%) | 207 (25.7%) |
| 15 to 19 Minutes | 110 (10.1%) | 24 (3.0%) |
| 20 to 24 Minutes | 198 (18.1%) | 110 (13.6%) |
| 25 to 29 Minutes | 0 (0.0%) | 39 (4.8%) |
| 30 to 34 Minutes | 84 (7.7%) | 36 (4.5%) |
| 35 to 39 Minutes | 0 (0.0%) | 14 (1.7%) |
| 40 to 44 Minutes | 0 (0.0%) | 59 (7.3%) |
| 45 to 59 Minutes | 37 (3.4%) | 70 (8.7%) |
| 60 to 89 Minutes | 59 (5.4%) | 14 (1.7%) |
| 90 or more Minutes | 0 (0.0%) | 23 (2.9%) |
Time of Departure to Work by Sex in Calcutta
The most frequent times of departure to work in Calcutta are 6:00 AM to 6:29 AM (342, 31.3%) for males and 7:30 AM to 7:59 AM (207, 25.7%) for females.
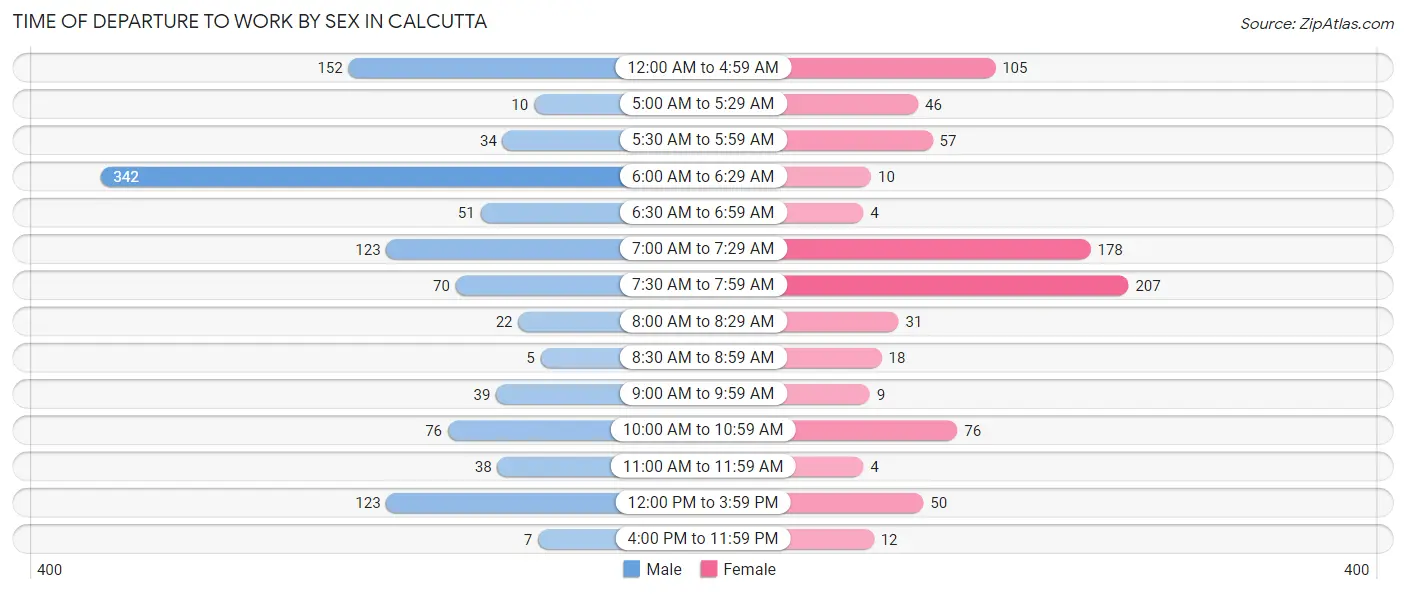
| Time of Departure | Male | Female |
| 12:00 AM to 4:59 AM | 152 (13.9%) | 105 (13.0%) |
| 5:00 AM to 5:29 AM | 10 (0.9%) | 46 (5.7%) |
| 5:30 AM to 5:59 AM | 34 (3.1%) | 57 (7.1%) |
| 6:00 AM to 6:29 AM | 342 (31.3%) | 10 (1.2%) |
| 6:30 AM to 6:59 AM | 51 (4.7%) | 4 (0.5%) |
| 7:00 AM to 7:29 AM | 123 (11.3%) | 178 (22.1%) |
| 7:30 AM to 7:59 AM | 70 (6.4%) | 207 (25.7%) |
| 8:00 AM to 8:29 AM | 22 (2.0%) | 31 (3.8%) |
| 8:30 AM to 8:59 AM | 5 (0.5%) | 18 (2.2%) |
| 9:00 AM to 9:59 AM | 39 (3.6%) | 9 (1.1%) |
| 10:00 AM to 10:59 AM | 76 (7.0%) | 76 (9.4%) |
| 11:00 AM to 11:59 AM | 38 (3.5%) | 4 (0.5%) |
| 12:00 PM to 3:59 PM | 123 (11.3%) | 50 (6.2%) |
| 4:00 PM to 11:59 PM | 7 (0.6%) | 12 (1.5%) |
| Total | 1,092 (100.0%) | 807 (100.0%) |
Housing Occupancy in Calcutta
Occupancy by Ownership in Calcutta
Of the total 1,639 dwellings in Calcutta, owner-occupied units account for 1,365 (83.3%), while renter-occupied units make up 274 (16.7%).
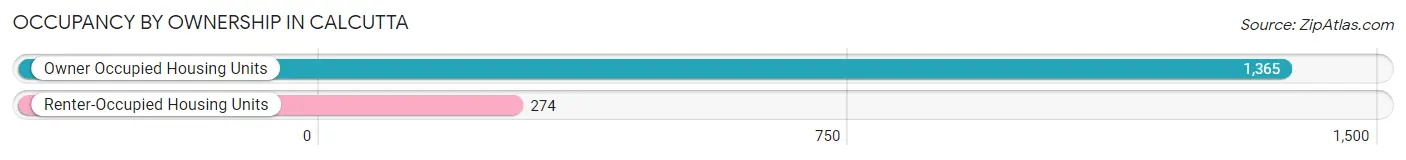
| Occupancy | # Housing Units | % Housing Units |
| Owner Occupied Housing Units | 1,365 | 83.3% |
| Renter-Occupied Housing Units | 274 | 16.7% |
| Total Occupied Housing Units | 1,639 | 100.0% |
Occupancy by Household Size in Calcutta
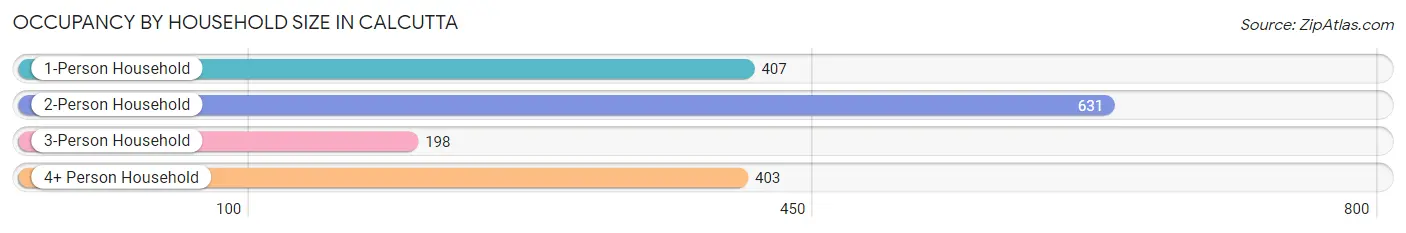
| Household Size | # Housing Units | % Housing Units |
| 1-Person Household | 407 | 24.8% |
| 2-Person Household | 631 | 38.5% |
| 3-Person Household | 198 | 12.1% |
| 4+ Person Household | 403 | 24.6% |
| Total Housing Units | 1,639 | 100.0% |
Occupancy by Ownership by Household Size in Calcutta
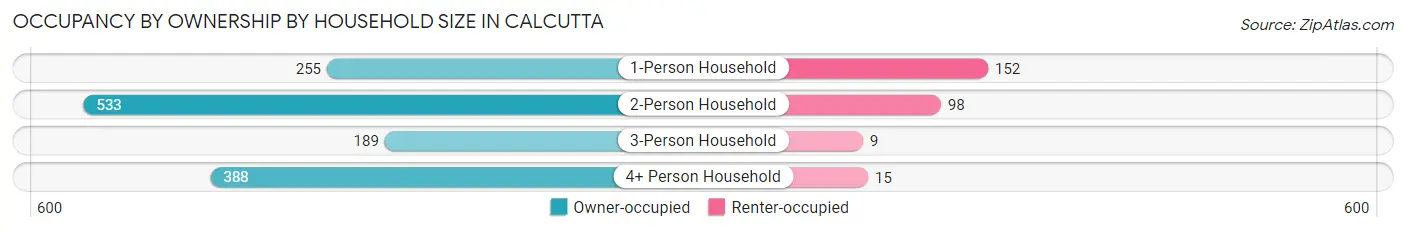
| Household Size | Owner-occupied | Renter-occupied |
| 1-Person Household | 255 (62.6%) | 152 (37.3%) |
| 2-Person Household | 533 (84.5%) | 98 (15.5%) |
| 3-Person Household | 189 (95.5%) | 9 (4.5%) |
| 4+ Person Household | 388 (96.3%) | 15 (3.7%) |
| Total Housing Units | 1,365 (83.3%) | 274 (16.7%) |
Occupancy by Educational Attainment in Calcutta
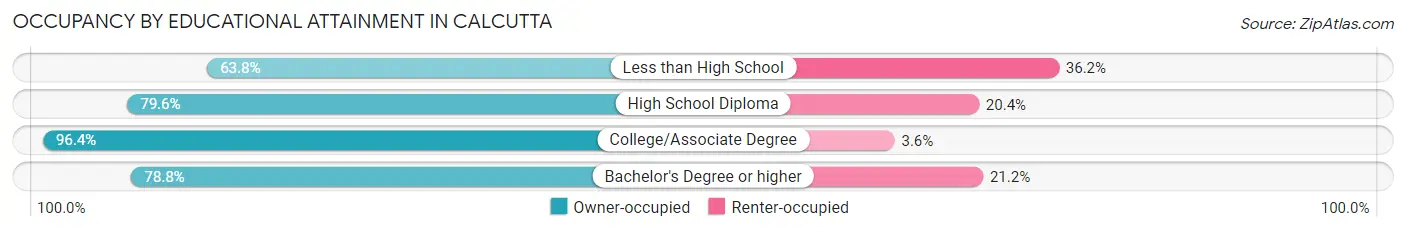
| Household Size | Owner-occupied | Renter-occupied |
| Less than High School | 81 (63.8%) | 46 (36.2%) |
| High School Diploma | 555 (79.6%) | 142 (20.4%) |
| College/Associate Degree | 476 (96.4%) | 18 (3.6%) |
| Bachelor's Degree or higher | 253 (78.8%) | 68 (21.2%) |
Occupancy by Age of Householder in Calcutta
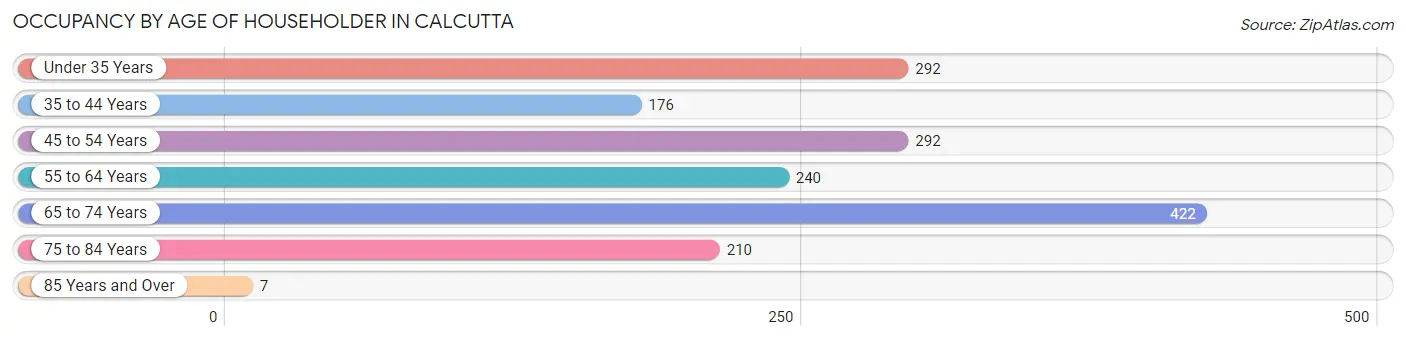
| Age Bracket | # Households | % Households |
| Under 35 Years | 292 | 17.8% |
| 35 to 44 Years | 176 | 10.7% |
| 45 to 54 Years | 292 | 17.8% |
| 55 to 64 Years | 240 | 14.6% |
| 65 to 74 Years | 422 | 25.8% |
| 75 to 84 Years | 210 | 12.8% |
| 85 Years and Over | 7 | 0.4% |
| Total | 1,639 | 100.0% |
Housing Finances in Calcutta
Median Income by Occupancy in Calcutta
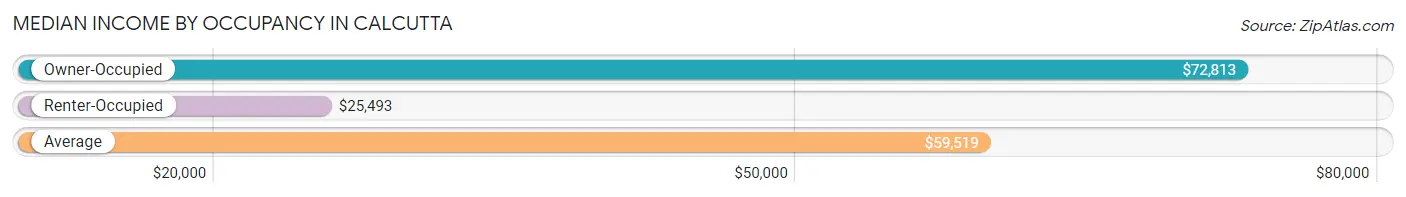
| Occupancy Type | # Households | Median Income |
| Owner-Occupied | 1,365 (83.3%) | $72,813 |
| Renter-Occupied | 274 (16.7%) | $25,493 |
| Average | 1,639 (100.0%) | $59,519 |
Occupancy by Householder Income Bracket in Calcutta
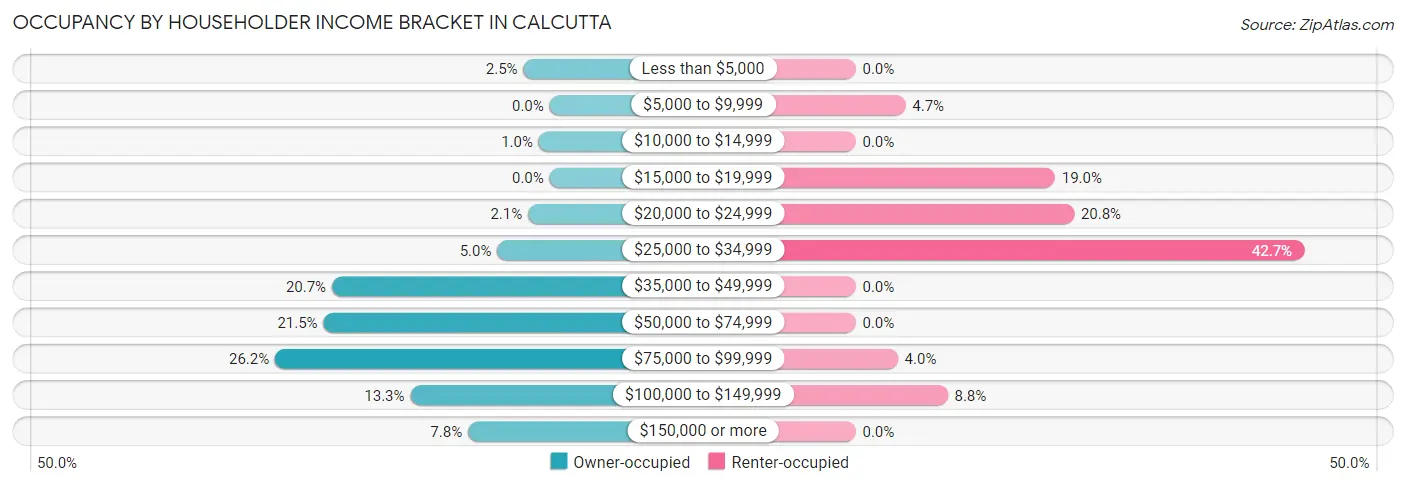
| Income Bracket | Owner-occupied | Renter-occupied |
| Less than $5,000 | 34 (2.5%) | 0 (0.0%) |
| $5,000 to $9,999 | 0 (0.0%) | 13 (4.7%) |
| $10,000 to $14,999 | 14 (1.0%) | 0 (0.0%) |
| $15,000 to $19,999 | 0 (0.0%) | 52 (19.0%) |
| $20,000 to $24,999 | 28 (2.1%) | 57 (20.8%) |
| $25,000 to $34,999 | 68 (5.0%) | 117 (42.7%) |
| $35,000 to $49,999 | 283 (20.7%) | 0 (0.0%) |
| $50,000 to $74,999 | 294 (21.5%) | 0 (0.0%) |
| $75,000 to $99,999 | 357 (26.2%) | 11 (4.0%) |
| $100,000 to $149,999 | 181 (13.3%) | 24 (8.8%) |
| $150,000 or more | 106 (7.8%) | 0 (0.0%) |
| Total | 1,365 (100.0%) | 274 (100.0%) |
Monthly Housing Cost Tiers in Calcutta
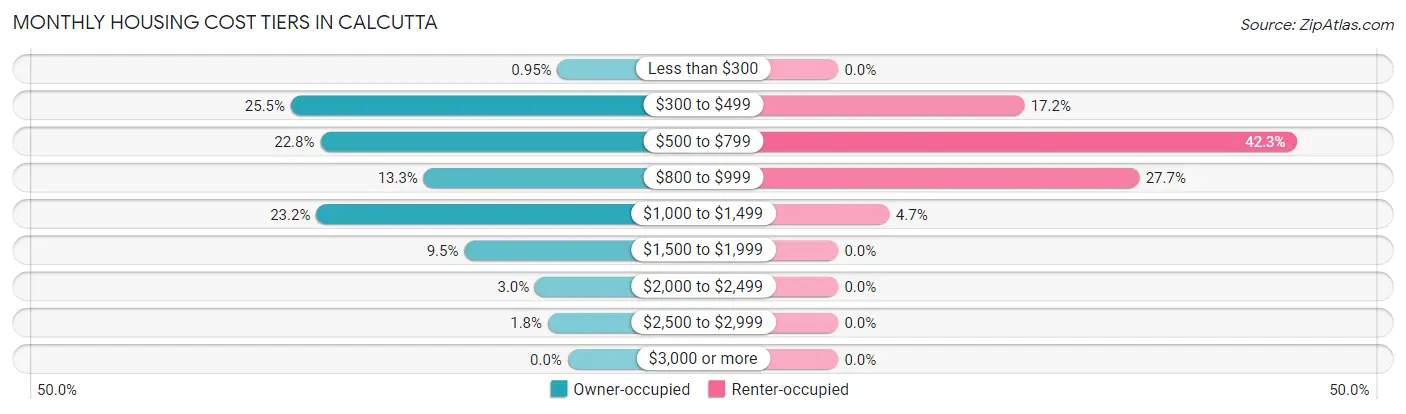
| Monthly Cost | Owner-occupied | Renter-occupied |
| Less than $300 | 13 (0.9%) | 0 (0.0%) |
| $300 to $499 | 348 (25.5%) | 47 (17.2%) |
| $500 to $799 | 311 (22.8%) | 116 (42.3%) |
| $800 to $999 | 181 (13.3%) | 76 (27.7%) |
| $1,000 to $1,499 | 316 (23.2%) | 13 (4.7%) |
| $1,500 to $1,999 | 130 (9.5%) | 0 (0.0%) |
| $2,000 to $2,499 | 41 (3.0%) | 0 (0.0%) |
| $2,500 to $2,999 | 25 (1.8%) | 0 (0.0%) |
| $3,000 or more | 0 (0.0%) | 0 (0.0%) |
| Total | 1,365 (100.0%) | 274 (100.0%) |
Physical Housing Characteristics in Calcutta
Housing Structures in Calcutta
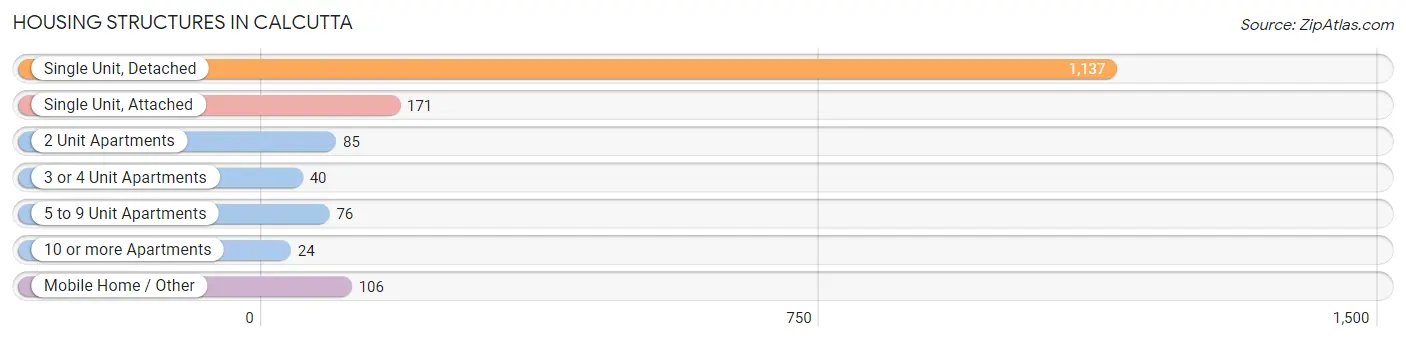
| Structure Type | # Housing Units | % Housing Units |
| Single Unit, Detached | 1,137 | 69.4% |
| Single Unit, Attached | 171 | 10.4% |
| 2 Unit Apartments | 85 | 5.2% |
| 3 or 4 Unit Apartments | 40 | 2.4% |
| 5 to 9 Unit Apartments | 76 | 4.6% |
| 10 or more Apartments | 24 | 1.5% |
| Mobile Home / Other | 106 | 6.5% |
| Total | 1,639 | 100.0% |
Housing Structures by Occupancy in Calcutta
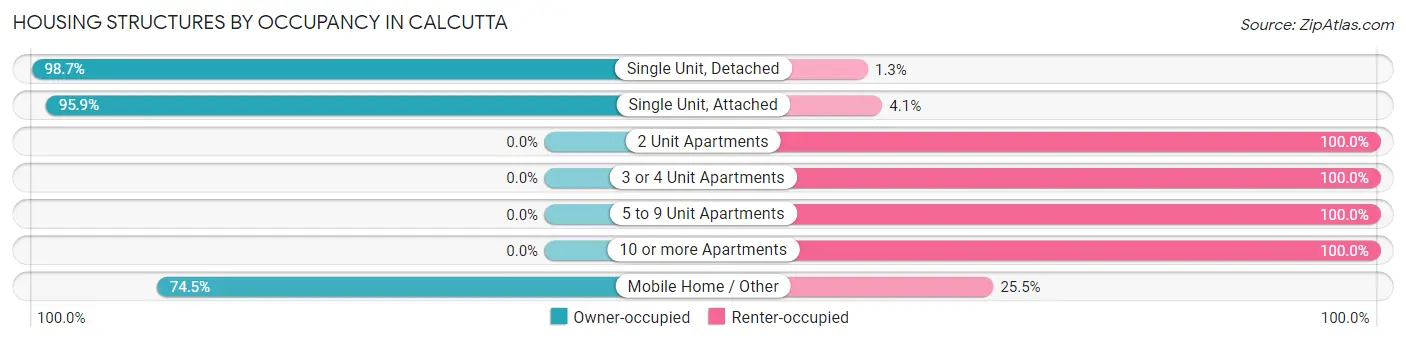
| Structure Type | Owner-occupied | Renter-occupied |
| Single Unit, Detached | 1,122 (98.7%) | 15 (1.3%) |
| Single Unit, Attached | 164 (95.9%) | 7 (4.1%) |
| 2 Unit Apartments | 0 (0.0%) | 85 (100.0%) |
| 3 or 4 Unit Apartments | 0 (0.0%) | 40 (100.0%) |
| 5 to 9 Unit Apartments | 0 (0.0%) | 76 (100.0%) |
| 10 or more Apartments | 0 (0.0%) | 24 (100.0%) |
| Mobile Home / Other | 79 (74.5%) | 27 (25.5%) |
| Total | 1,365 (83.3%) | 274 (16.7%) |
Housing Structures by Number of Rooms in Calcutta
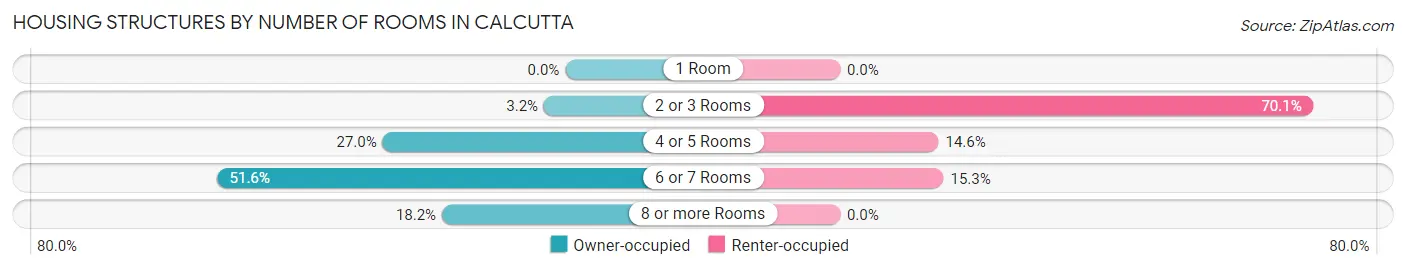
| Number of Rooms | Owner-occupied | Renter-occupied |
| 1 Room | 0 (0.0%) | 0 (0.0%) |
| 2 or 3 Rooms | 43 (3.2%) | 192 (70.1%) |
| 4 or 5 Rooms | 369 (27.0%) | 40 (14.6%) |
| 6 or 7 Rooms | 704 (51.6%) | 42 (15.3%) |
| 8 or more Rooms | 249 (18.2%) | 0 (0.0%) |
| Total | 1,365 (100.0%) | 274 (100.0%) |
Housing Structure by Heating Type in Calcutta
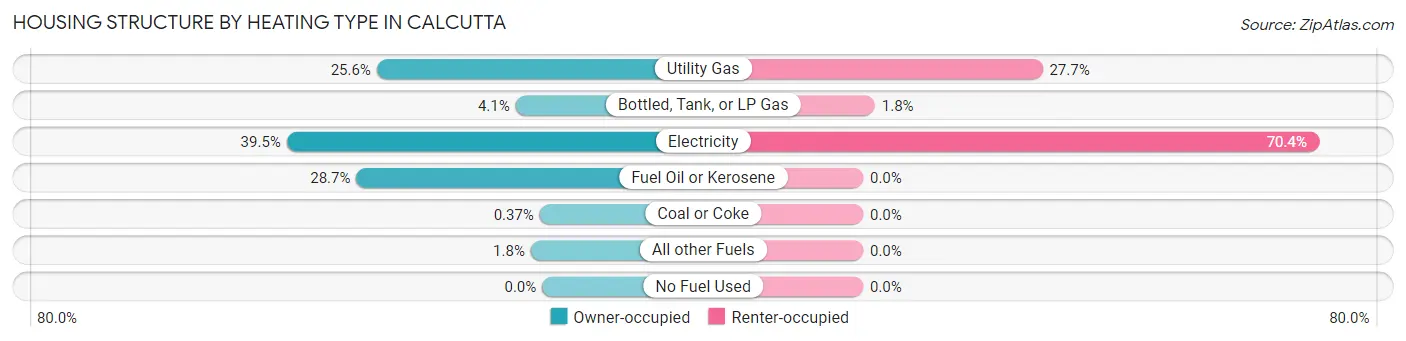
| Heating Type | Owner-occupied | Renter-occupied |
| Utility Gas | 349 (25.6%) | 76 (27.7%) |
| Bottled, Tank, or LP Gas | 56 (4.1%) | 5 (1.8%) |
| Electricity | 539 (39.5%) | 193 (70.4%) |
| Fuel Oil or Kerosene | 392 (28.7%) | 0 (0.0%) |
| Coal or Coke | 5 (0.4%) | 0 (0.0%) |
| All other Fuels | 24 (1.8%) | 0 (0.0%) |
| No Fuel Used | 0 (0.0%) | 0 (0.0%) |
| Total | 1,365 (100.0%) | 274 (100.0%) |
Household Vehicle Usage in Calcutta
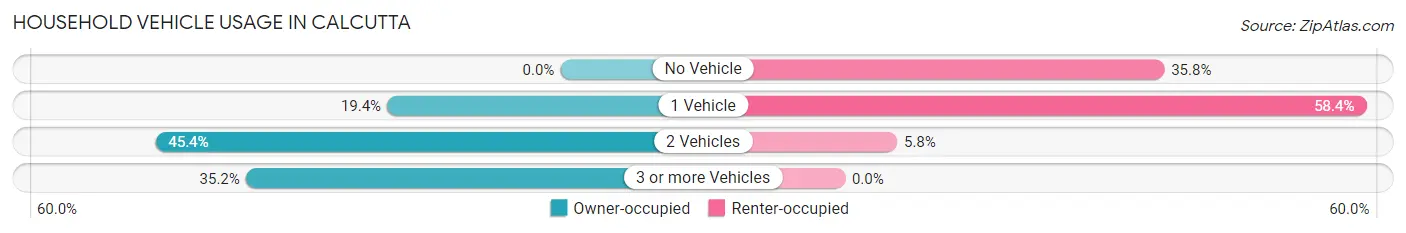
| Vehicles per Household | Owner-occupied | Renter-occupied |
| No Vehicle | 0 (0.0%) | 98 (35.8%) |
| 1 Vehicle | 265 (19.4%) | 160 (58.4%) |
| 2 Vehicles | 619 (45.4%) | 16 (5.8%) |
| 3 or more Vehicles | 481 (35.2%) | 0 (0.0%) |
| Total | 1,365 (100.0%) | 274 (100.0%) |
Real Estate & Mortgages in Calcutta
Real Estate and Mortgage Overview in Calcutta
| Characteristic | Without Mortgage | With Mortgage |
| Housing Units | 819 | 546 |
| Median Property Value | $119,100 | $163,600 |
| Median Household Income | $54,858 | $57 |
| Monthly Housing Costs | $556 | $0 |
| Real Estate Taxes | $2,255 | $28 |
Property Value by Mortgage Status in Calcutta
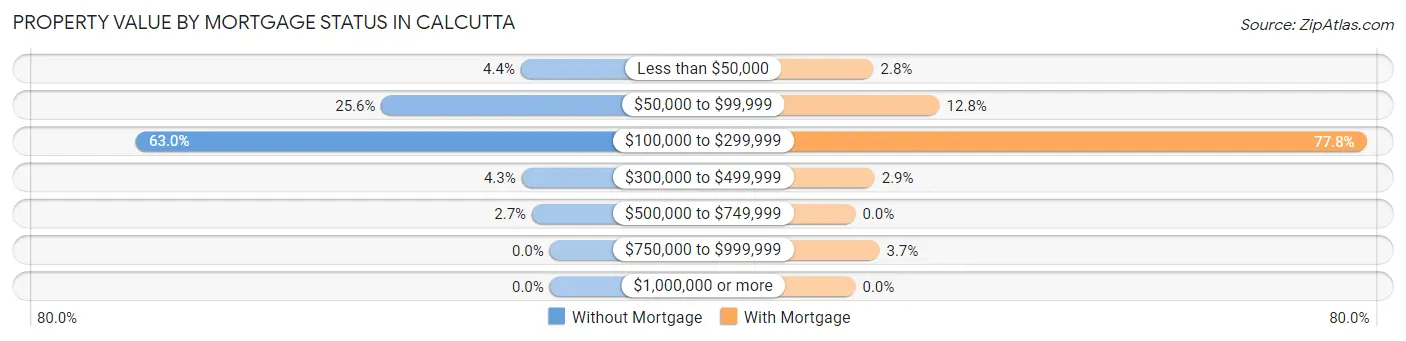
| Property Value | Without Mortgage | With Mortgage |
| Less than $50,000 | 36 (4.4%) | 15 (2.8%) |
| $50,000 to $99,999 | 210 (25.6%) | 70 (12.8%) |
| $100,000 to $299,999 | 516 (63.0%) | 425 (77.8%) |
| $300,000 to $499,999 | 35 (4.3%) | 16 (2.9%) |
| $500,000 to $749,999 | 22 (2.7%) | 0 (0.0%) |
| $750,000 to $999,999 | 0 (0.0%) | 20 (3.7%) |
| $1,000,000 or more | 0 (0.0%) | 0 (0.0%) |
| Total | 819 (100.0%) | 546 (100.0%) |
Household Income by Mortgage Status in Calcutta
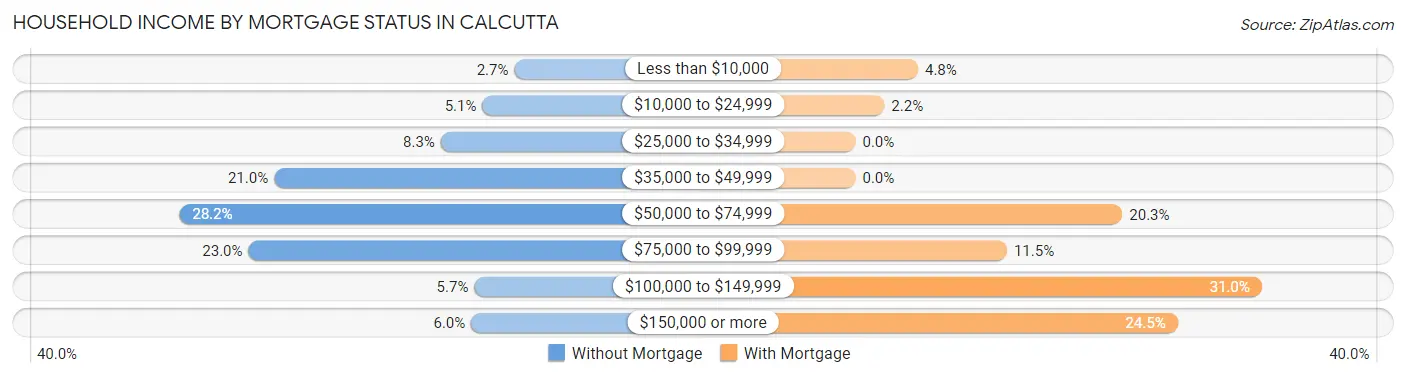
| Household Income | Without Mortgage | With Mortgage |
| Less than $10,000 | 22 (2.7%) | 26 (4.8%) |
| $10,000 to $24,999 | 42 (5.1%) | 12 (2.2%) |
| $25,000 to $34,999 | 68 (8.3%) | 0 (0.0%) |
| $35,000 to $49,999 | 172 (21.0%) | 0 (0.0%) |
| $50,000 to $74,999 | 231 (28.2%) | 111 (20.3%) |
| $75,000 to $99,999 | 188 (23.0%) | 63 (11.5%) |
| $100,000 to $149,999 | 47 (5.7%) | 169 (30.9%) |
| $150,000 or more | 49 (6.0%) | 134 (24.5%) |
| Total | 819 (100.0%) | 546 (100.0%) |
Property Value to Household Income Ratio in Calcutta
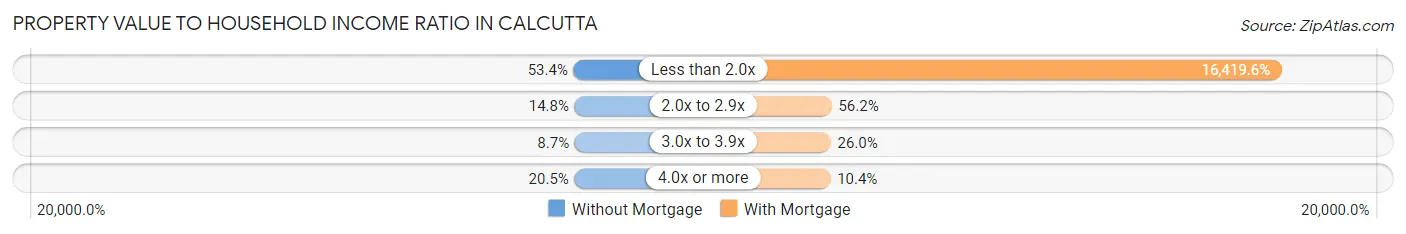
| Value-to-Income Ratio | Without Mortgage | With Mortgage |
| Less than 2.0x | 437 (53.4%) | 89,651 (16,419.6%) |
| 2.0x to 2.9x | 121 (14.8%) | 307 (56.2%) |
| 3.0x to 3.9x | 71 (8.7%) | 142 (26.0%) |
| 4.0x or more | 168 (20.5%) | 57 (10.4%) |
| Total | 819 (100.0%) | 546 (100.0%) |
Real Estate Taxes by Mortgage Status in Calcutta
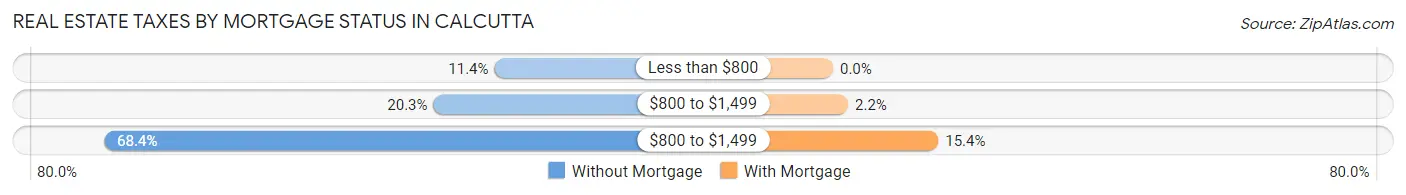
| Property Taxes | Without Mortgage | With Mortgage |
| Less than $800 | 93 (11.4%) | 0 (0.0%) |
| $800 to $1,499 | 166 (20.3%) | 12 (2.2%) |
| $800 to $1,499 | 560 (68.4%) | 84 (15.4%) |
| Total | 819 (100.0%) | 546 (100.0%) |
Health & Disability in Calcutta
Health Insurance Coverage by Age in Calcutta
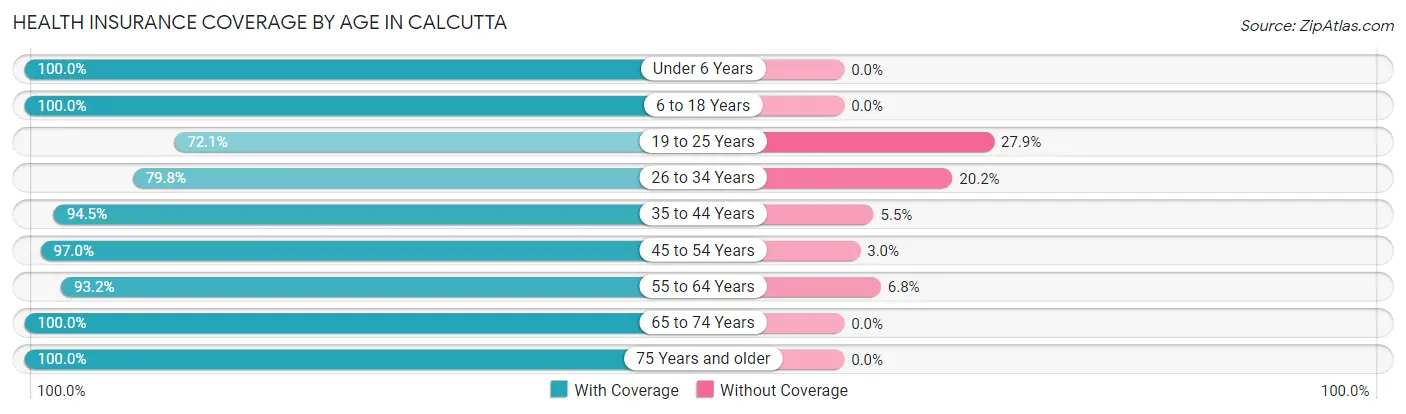
| Age Bracket | With Coverage | Without Coverage |
| Under 6 Years | 203 (100.0%) | 0 (0.0%) |
| 6 to 18 Years | 590 (100.0%) | 0 (0.0%) |
| 19 to 25 Years | 253 (72.1%) | 98 (27.9%) |
| 26 to 34 Years | 305 (79.8%) | 77 (20.2%) |
| 35 to 44 Years | 433 (94.5%) | 25 (5.5%) |
| 45 to 54 Years | 423 (97.0%) | 13 (3.0%) |
| 55 to 64 Years | 519 (93.2%) | 38 (6.8%) |
| 65 to 74 Years | 691 (100.0%) | 0 (0.0%) |
| 75 Years and older | 293 (100.0%) | 0 (0.0%) |
| Total | 3,710 (93.7%) | 251 (6.3%) |
Health Insurance Coverage by Citizenship Status in Calcutta
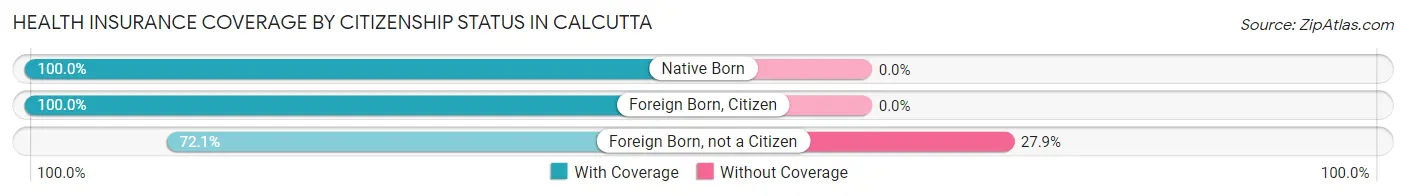
| Citizenship Status | With Coverage | Without Coverage |
| Native Born | 203 (100.0%) | 0 (0.0%) |
| Foreign Born, Citizen | 590 (100.0%) | 0 (0.0%) |
| Foreign Born, not a Citizen | 253 (72.1%) | 98 (27.9%) |
Health Insurance Coverage by Household Income in Calcutta
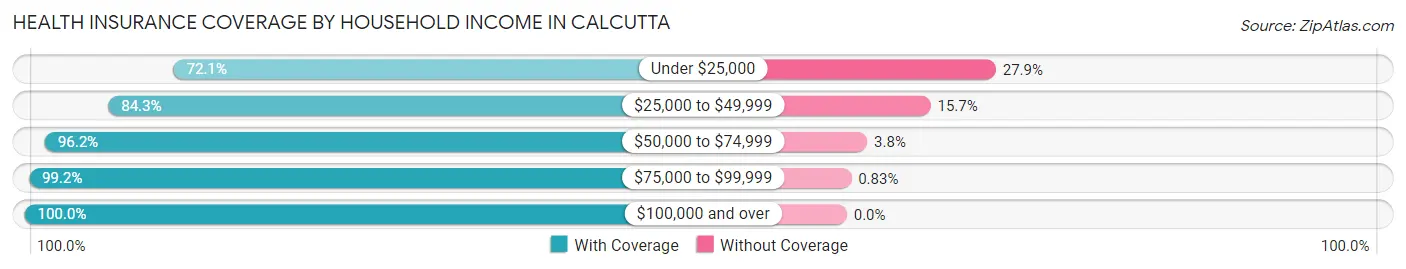
| Household Income | With Coverage | Without Coverage |
| Under $25,000 | 204 (72.1%) | 79 (27.9%) |
| $25,000 to $49,999 | 736 (84.3%) | 137 (15.7%) |
| $50,000 to $74,999 | 631 (96.2%) | 25 (3.8%) |
| $75,000 to $99,999 | 1,192 (99.2%) | 10 (0.8%) |
| $100,000 and over | 947 (100.0%) | 0 (0.0%) |
Public vs Private Health Insurance Coverage by Age in Calcutta
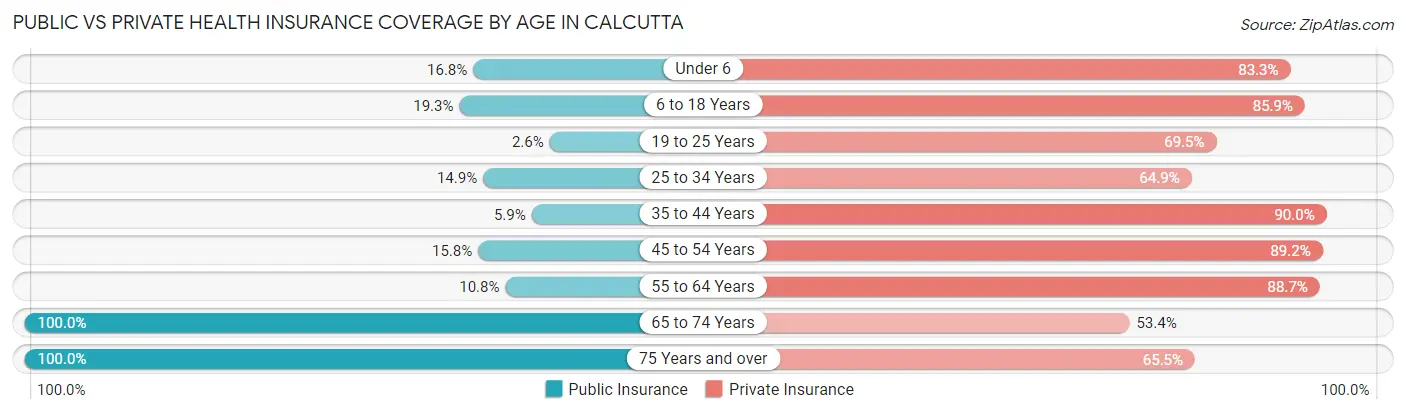
| Age Bracket | Public Insurance | Private Insurance |
| Under 6 | 34 (16.8%) | 169 (83.3%) |
| 6 to 18 Years | 114 (19.3%) | 507 (85.9%) |
| 19 to 25 Years | 9 (2.6%) | 244 (69.5%) |
| 25 to 34 Years | 57 (14.9%) | 248 (64.9%) |
| 35 to 44 Years | 27 (5.9%) | 412 (90.0%) |
| 45 to 54 Years | 69 (15.8%) | 389 (89.2%) |
| 55 to 64 Years | 60 (10.8%) | 494 (88.7%) |
| 65 to 74 Years | 691 (100.0%) | 369 (53.4%) |
| 75 Years and over | 293 (100.0%) | 192 (65.5%) |
| Total | 1,354 (34.2%) | 3,024 (76.3%) |
Disability Status by Sex by Age in Calcutta
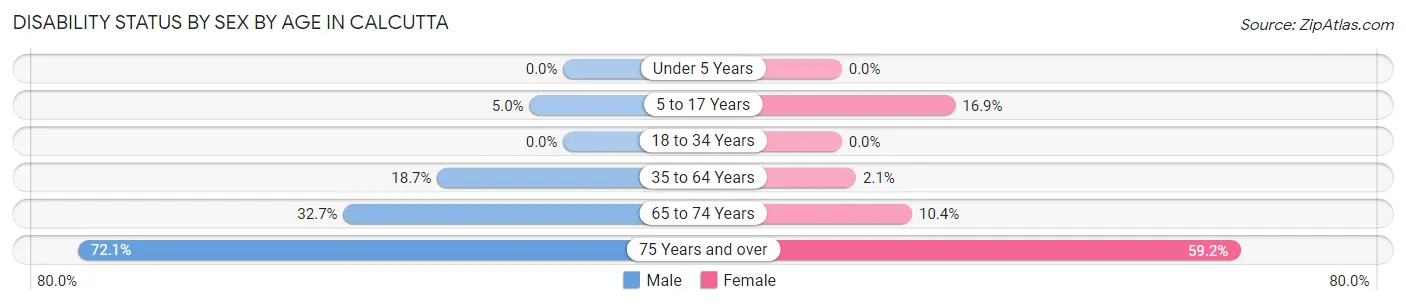
| Age Bracket | Male | Female |
| Under 5 Years | 0 (0.0%) | 0 (0.0%) |
| 5 to 17 Years | 14 (5.0%) | 44 (16.9%) |
| 18 to 34 Years | 0 (0.0%) | 0 (0.0%) |
| 35 to 64 Years | 148 (18.7%) | 14 (2.1%) |
| 65 to 74 Years | 113 (32.7%) | 36 (10.4%) |
| 75 Years and over | 93 (72.1%) | 97 (59.2%) |
Disability Class by Sex by Age in Calcutta
Disability Class: Hearing Difficulty
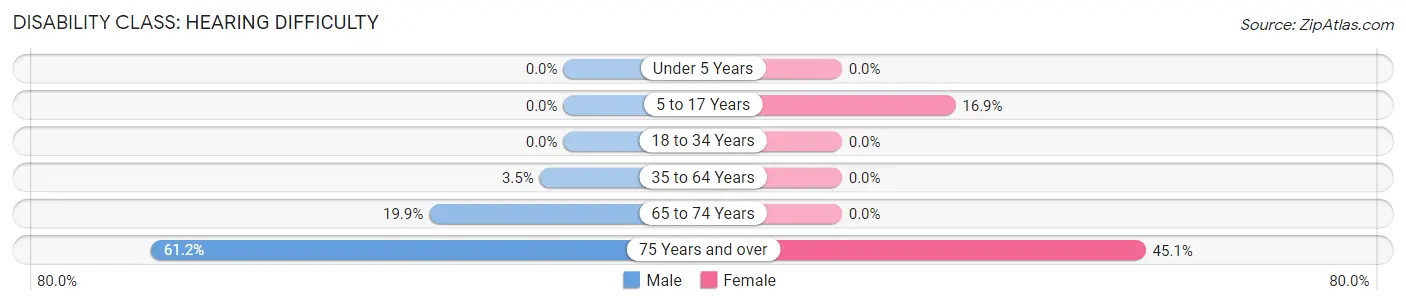
| Age Bracket | Male | Female |
| Under 5 Years | 0 (0.0%) | 0 (0.0%) |
| 5 to 17 Years | 0 (0.0%) | 44 (16.9%) |
| 18 to 34 Years | 0 (0.0%) | 0 (0.0%) |
| 35 to 64 Years | 28 (3.5%) | 0 (0.0%) |
| 65 to 74 Years | 69 (19.9%) | 0 (0.0%) |
| 75 Years and over | 79 (61.2%) | 74 (45.1%) |
Disability Class: Vision Difficulty
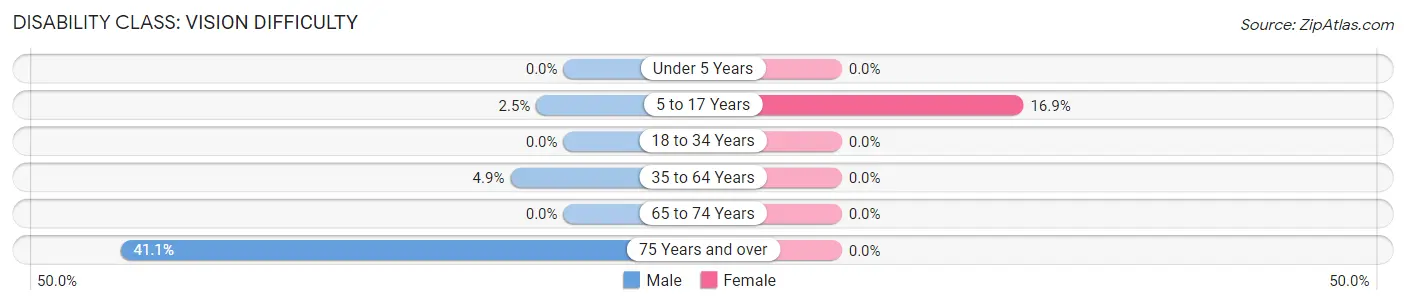
| Age Bracket | Male | Female |
| Under 5 Years | 0 (0.0%) | 0 (0.0%) |
| 5 to 17 Years | 7 (2.5%) | 44 (16.9%) |
| 18 to 34 Years | 0 (0.0%) | 0 (0.0%) |
| 35 to 64 Years | 39 (4.9%) | 0 (0.0%) |
| 65 to 74 Years | 0 (0.0%) | 0 (0.0%) |
| 75 Years and over | 53 (41.1%) | 0 (0.0%) |
Disability Class: Cognitive Difficulty
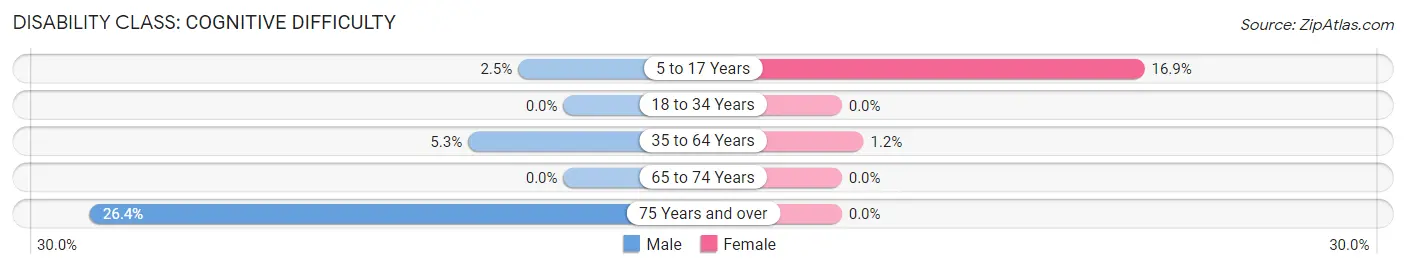
| Age Bracket | Male | Female |
| 5 to 17 Years | 7 (2.5%) | 44 (16.9%) |
| 18 to 34 Years | 0 (0.0%) | 0 (0.0%) |
| 35 to 64 Years | 42 (5.3%) | 8 (1.2%) |
| 65 to 74 Years | 0 (0.0%) | 0 (0.0%) |
| 75 Years and over | 34 (26.4%) | 0 (0.0%) |
Disability Class: Ambulatory Difficulty
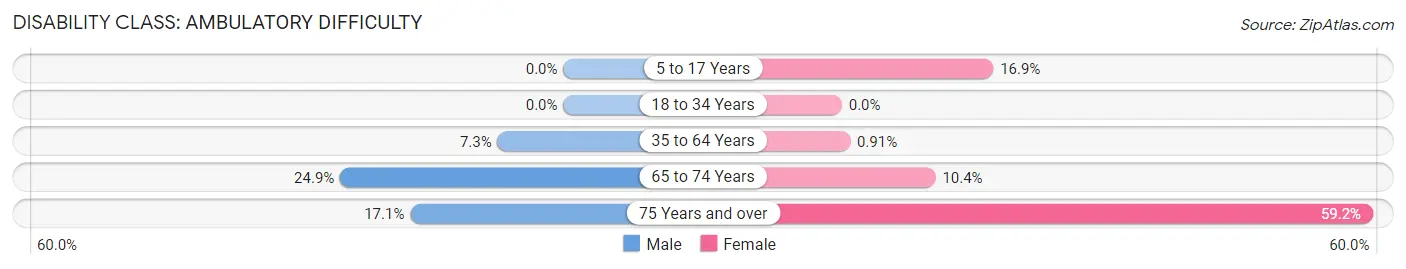
| Age Bracket | Male | Female |
| 5 to 17 Years | 0 (0.0%) | 44 (16.9%) |
| 18 to 34 Years | 0 (0.0%) | 0 (0.0%) |
| 35 to 64 Years | 58 (7.3%) | 6 (0.9%) |
| 65 to 74 Years | 86 (24.9%) | 36 (10.4%) |
| 75 Years and over | 22 (17.1%) | 97 (59.2%) |
Disability Class: Self-Care Difficulty
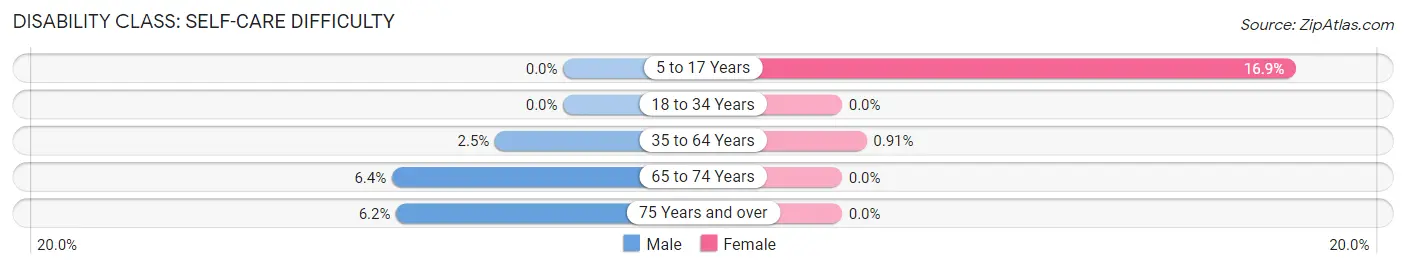
| Age Bracket | Male | Female |
| 5 to 17 Years | 0 (0.0%) | 44 (16.9%) |
| 18 to 34 Years | 0 (0.0%) | 0 (0.0%) |
| 35 to 64 Years | 20 (2.5%) | 6 (0.9%) |
| 65 to 74 Years | 22 (6.4%) | 0 (0.0%) |
| 75 Years and over | 8 (6.2%) | 0 (0.0%) |
Technology Access in Calcutta
Computing Device Access in Calcutta
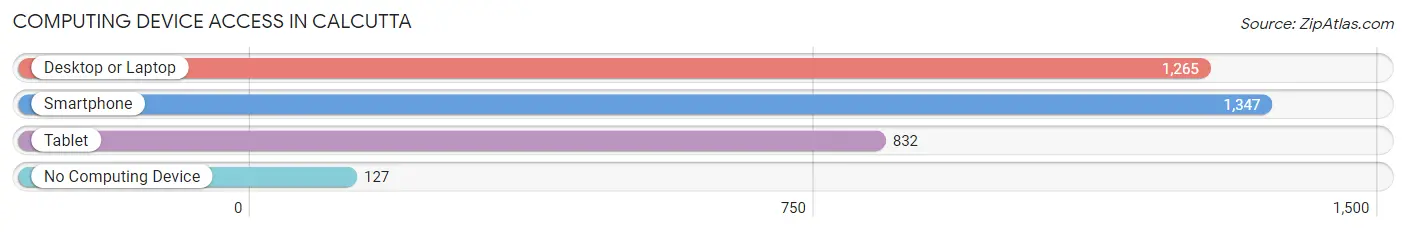
| Device Type | # Households | % Households |
| Desktop or Laptop | 1,265 | 77.2% |
| Smartphone | 1,347 | 82.2% |
| Tablet | 832 | 50.8% |
| No Computing Device | 127 | 7.7% |
| Total | 1,639 | 100.0% |
Internet Access in Calcutta
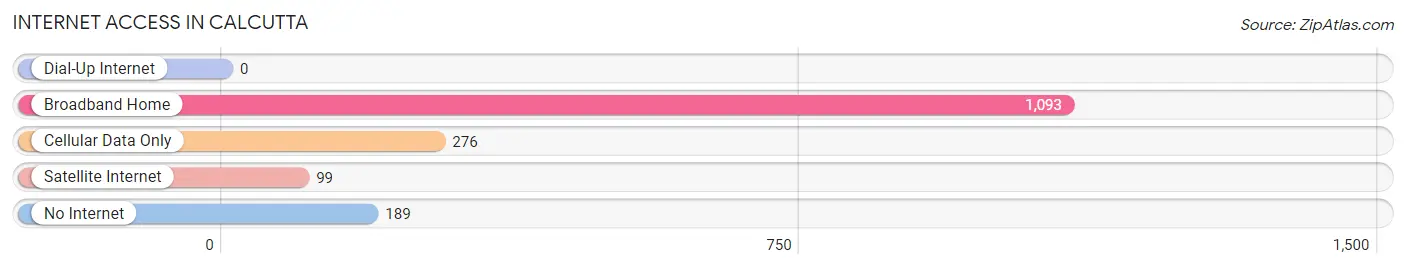
| Internet Type | # Households | % Households |
| Dial-Up Internet | 0 | 0.0% |
| Broadband Home | 1,093 | 66.7% |
| Cellular Data Only | 276 | 16.8% |
| Satellite Internet | 99 | 6.0% |
| No Internet | 189 | 11.5% |
| Total | 1,639 | 100.0% |
Calcutta Summary
Calcutta, Ohio is a small village located in the eastern part of the state of Ohio. It is situated in the county of Columbiana and is part of the greater metropolitan area of Youngstown-Warren-Boardman. The village has a population of approximately 1,500 people and is located in the heart of the Appalachian region.
History
Calcutta was founded in 1802 by a group of settlers from Pennsylvania. The village was named after the city of Calcutta, India, which was the birthplace of one of the settlers. The village was originally a farming community and the main crops grown were corn, wheat, and oats. The village was also home to a number of small businesses, including a sawmill, a gristmill, and a blacksmith shop.
In the late 19th century, the village began to experience a period of growth and development. The railroad was extended to the village in 1881, and this allowed for the transportation of goods and people to and from the village. This period of growth also saw the establishment of a number of new businesses, including a hotel, a bank, and a newspaper.
Geography
Calcutta is located in the eastern part of the state of Ohio. It is situated in the county of Columbiana and is part of the greater metropolitan area of Youngstown-Warren-Boardman. The village is located in the Appalachian region and is surrounded by rolling hills and forests. The village is situated on the banks of the Little Beaver Creek, which is a tributary of the Mahoning River.
Economy
Calcutta’s economy is largely based on agriculture and manufacturing. The village is home to a number of small businesses, including a sawmill, a gristmill, and a blacksmith shop. The village is also home to a number of small manufacturing companies, including a plastics factory and a metal fabrication plant.
The village is also home to a number of retail stores, including a grocery store, a hardware store, and a pharmacy. The village is also home to a number of restaurants, including a pizza shop, a diner, and a Mexican restaurant.
Demographics
As of the 2010 census, the population of Calcutta was 1,500 people. The racial makeup of the village was 97.3% White, 0.7% African American, 0.3% Native American, 0.3% Asian, and 1.3% from two or more races. The median household income in the village was $37,500 and the median family income was $45,000. The per capita income in the village was $18,000.
Conclusion
Calcutta, Ohio is a small village located in the eastern part of the state of Ohio. It is situated in the county of Columbiana and is part of the greater metropolitan area of Youngstown-Warren-Boardman. The village has a population of approximately 1,500 people and is located in the heart of the Appalachian region. The village’s economy is largely based on agriculture and manufacturing, and the village is home to a number of small businesses and retail stores. The racial makeup of the village is predominantly White, with a small percentage of African American, Native American, and Asian residents. The median household income in the village is $37,500 and the median family income is $45,000.
Common Questions
What is Per Capita Income in Calcutta?
Per Capita income in Calcutta is $29,405.
What is the Median Family Income in Calcutta?
Median Family Income in Calcutta is $75,071.
What is the Median Household income in Calcutta?
Median Household Income in Calcutta is $59,519.
What is Income or Wage Gap in Calcutta?
Income or Wage Gap in Calcutta is 29.3%.
Women in Calcutta earn 70.7 cents for every dollar earned by a man.
What is Inequality or Gini Index in Calcutta?
Inequality or Gini Index in Calcutta is 0.35.
What is the Total Population of Calcutta?
Total Population of Calcutta is 4,049.
What is the Total Male Population of Calcutta?
Total Male Population of Calcutta is 2,075.
What is the Total Female Population of Calcutta?
Total Female Population of Calcutta is 1,974.
What is the Ratio of Males per 100 Females in Calcutta?
There are 105.12 Males per 100 Females in Calcutta.
What is the Ratio of Females per 100 Males in Calcutta?
There are 95.13 Females per 100 Males in Calcutta.
What is the Median Population Age in Calcutta?
Median Population Age in Calcutta is 47.0 Years.
What is the Average Family Size in Calcutta
Average Family Size in Calcutta is 2.9 People.
What is the Average Household Size in Calcutta
Average Household Size in Calcutta is 2.4 People.
How Large is the Labor Force in Calcutta?
There are 2,019 People in the Labor Forcein in Calcutta.
What is the Percentage of People in the Labor Force in Calcutta?
57.8% of People are in the Labor Force in Calcutta.
What is the Unemployment Rate in Calcutta?
Unemployment Rate in Calcutta is 2.3%.