Hartville, OH Map & Demographics
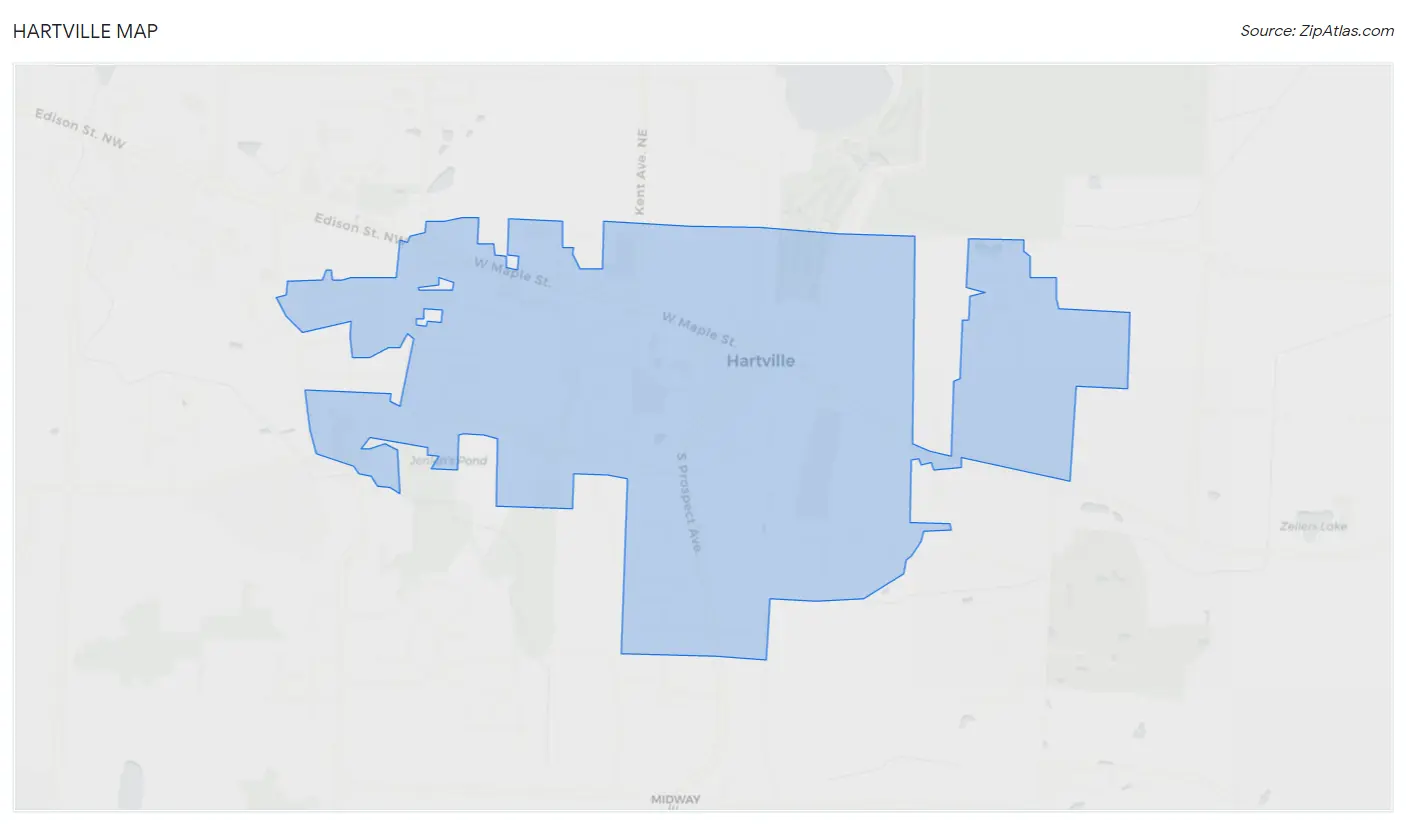
Hartville Map
Hartville Overview
$41,082
PER CAPITA INCOME
$80,641
AVG FAMILY INCOME
$63,873
AVG HOUSEHOLD INCOME
9.7%
WAGE / INCOME GAP [ % ]
90.3¢/ $1
WAGE / INCOME GAP [ $ ]
0.46
INEQUALITY / GINI INDEX
3,318
TOTAL POPULATION
1,646
MALE POPULATION
1,672
FEMALE POPULATION
98.44
MALES / 100 FEMALES
101.58
FEMALES / 100 MALES
49.4
MEDIAN AGE
2.9
AVG FAMILY SIZE
2.2
AVG HOUSEHOLD SIZE
1,680
LABOR FORCE [ PEOPLE ]
60.9%
PERCENT IN LABOR FORCE
1.0%
UNEMPLOYMENT RATE
Hartville Zip Codes
Income in Hartville
Income Overview in Hartville
Per Capita Income in Hartville is $41,082, while median incomes of families and households are $80,641 and $63,873 respectively.
| Characteristic | Number | Measure |
| Per Capita Income | 3,318 | $41,082 |
| Median Family Income | 771 | $80,641 |
| Mean Family Income | 771 | $97,753 |
| Median Household Income | 1,493 | $63,873 |
| Mean Household Income | 1,493 | $88,966 |
| Income Deficit | 771 | $0 |
| Wage / Income Gap (%) | 3,318 | 9.65% |
| Wage / Income Gap ($) | 3,318 | 90.35¢ per $1 |
| Gini / Inequality Index | 3,318 | 0.46 |
Earnings by Sex in Hartville
Average Earnings in Hartville are $46,000, $47,475 for men and $42,893 for women, a difference of 9.7%.
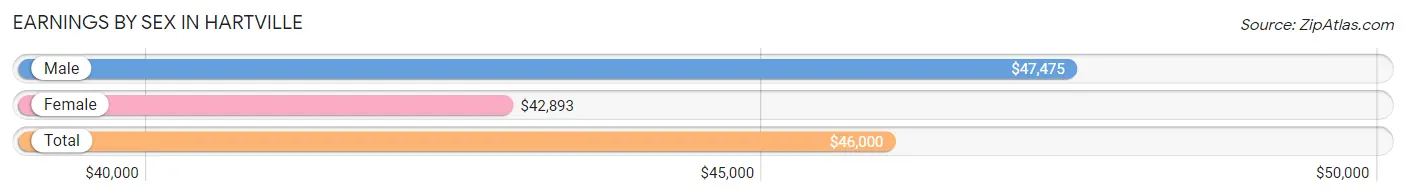
| Sex | Number | Average Earnings |
| Male | 937 (53.2%) | $47,475 |
| Female | 823 (46.8%) | $42,893 |
| Total | 1,760 (100.0%) | $46,000 |
Earnings by Sex by Income Bracket in Hartville
The most common earnings brackets in Hartville are $75,000 to $99,999 for men (172 | 18.4%) and $100,000+ for women (156 | 19.0%).
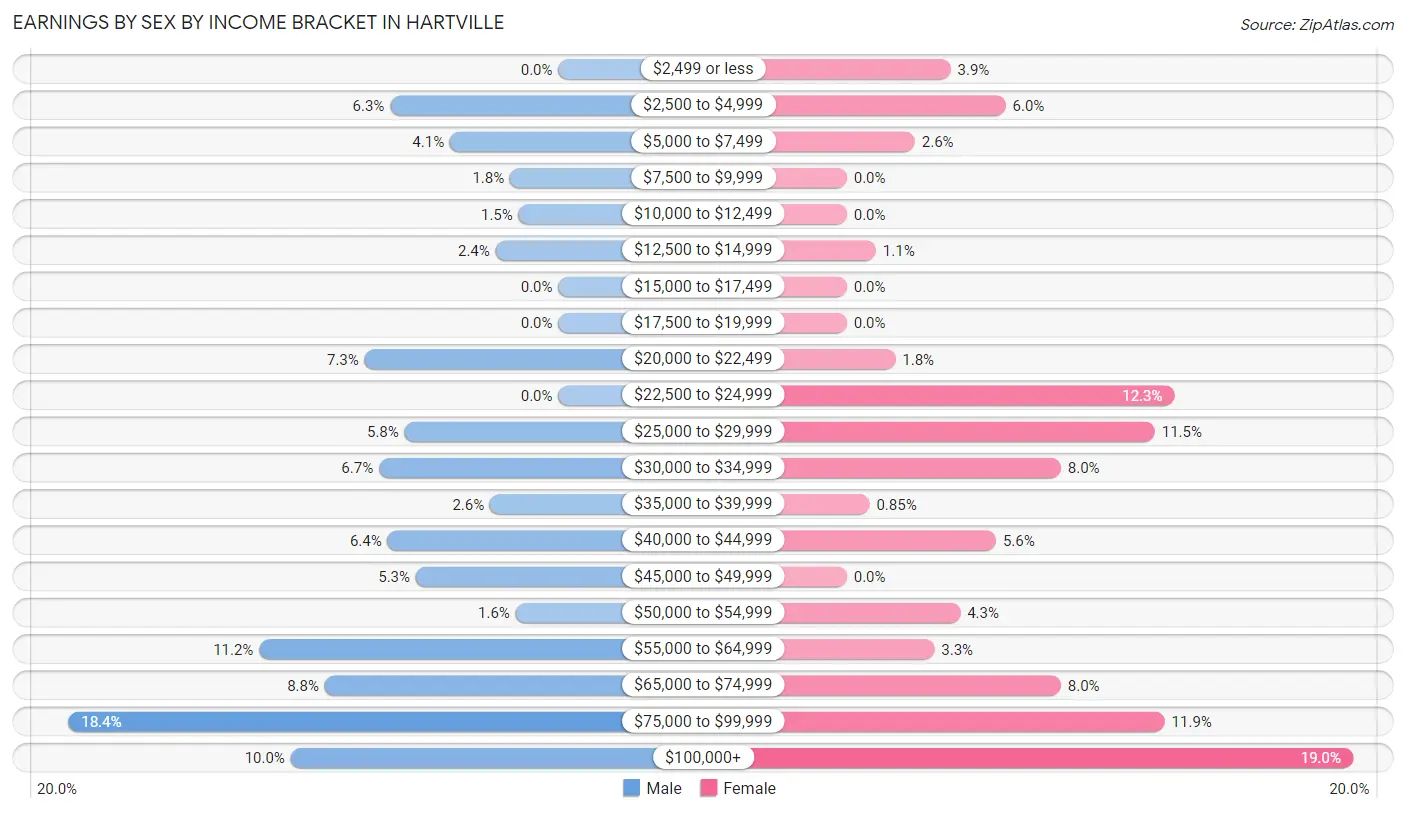
| Income | Male | Female |
| $2,499 or less | 0 (0.0%) | 32 (3.9%) |
| $2,500 to $4,999 | 59 (6.3%) | 49 (5.9%) |
| $5,000 to $7,499 | 38 (4.1%) | 21 (2.5%) |
| $7,500 to $9,999 | 17 (1.8%) | 0 (0.0%) |
| $10,000 to $12,499 | 14 (1.5%) | 0 (0.0%) |
| $12,500 to $14,999 | 22 (2.4%) | 9 (1.1%) |
| $15,000 to $17,499 | 0 (0.0%) | 0 (0.0%) |
| $17,500 to $19,999 | 0 (0.0%) | 0 (0.0%) |
| $20,000 to $22,499 | 68 (7.3%) | 15 (1.8%) |
| $22,500 to $24,999 | 0 (0.0%) | 101 (12.3%) |
| $25,000 to $29,999 | 54 (5.8%) | 95 (11.5%) |
| $30,000 to $34,999 | 63 (6.7%) | 66 (8.0%) |
| $35,000 to $39,999 | 24 (2.6%) | 7 (0.9%) |
| $40,000 to $44,999 | 60 (6.4%) | 46 (5.6%) |
| $45,000 to $49,999 | 50 (5.3%) | 0 (0.0%) |
| $50,000 to $54,999 | 15 (1.6%) | 35 (4.3%) |
| $55,000 to $64,999 | 105 (11.2%) | 27 (3.3%) |
| $65,000 to $74,999 | 82 (8.7%) | 66 (8.0%) |
| $75,000 to $99,999 | 172 (18.4%) | 98 (11.9%) |
| $100,000+ | 94 (10.0%) | 156 (19.0%) |
| Total | 937 (100.0%) | 823 (100.0%) |
Earnings by Sex by Educational Attainment in Hartville
Average earnings in Hartville are $58,538 for men and $52,650 for women, a difference of 10.1%. Men with an educational attainment of graduate degree enjoy the highest average annual earnings of $80,333, while those with college or associate's degree education earn the least with $43,750. Women with an educational attainment of graduate degree earn the most with the average annual earnings of $101,094, while those with high school diploma education have the smallest earnings of $25,114.
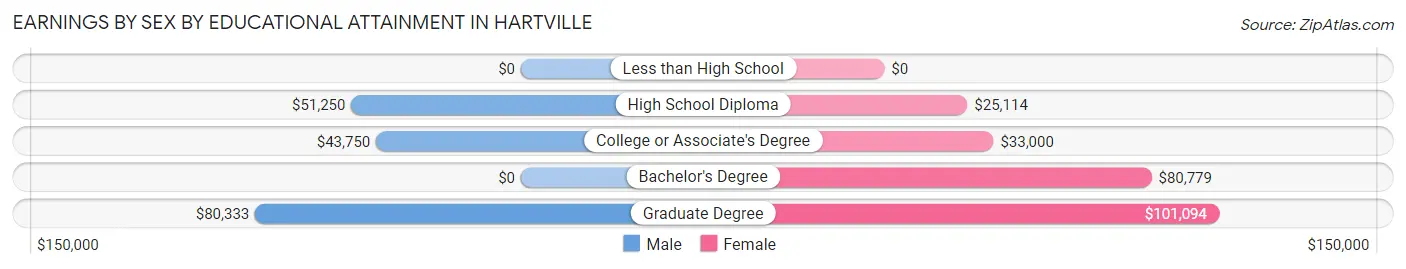
| Educational Attainment | Male Income | Female Income |
| Less than High School | - | - |
| High School Diploma | $51,250 | $25,114 |
| College or Associate's Degree | $43,750 | $33,000 |
| Bachelor's Degree | - | - |
| Graduate Degree | $80,333 | $101,094 |
| Total | $58,538 | $52,650 |
Family Income in Hartville
Family Income Brackets in Hartville
According to the Hartville family income data, there are 191 families falling into the $75,000 to $99,999 income range, which is the most common income bracket and makes up 24.8% of all families.
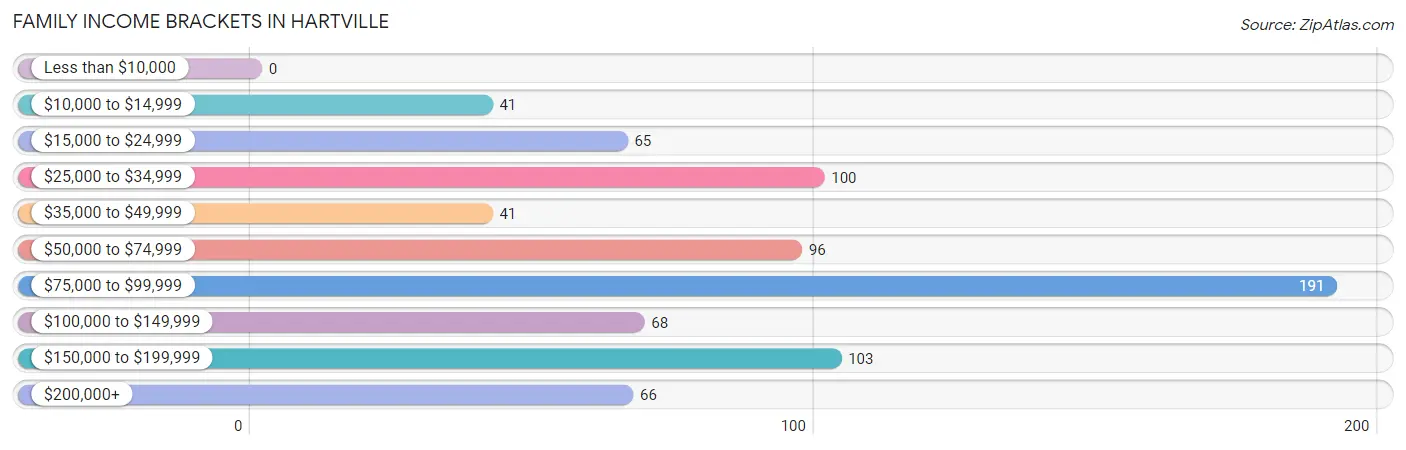
| Income Bracket | # Families | % Families |
| Less than $10,000 | 0 | 0.0% |
| $10,000 to $14,999 | 41 | 5.3% |
| $15,000 to $24,999 | 65 | 8.4% |
| $25,000 to $34,999 | 100 | 13.0% |
| $35,000 to $49,999 | 41 | 5.3% |
| $50,000 to $74,999 | 96 | 12.5% |
| $75,000 to $99,999 | 191 | 24.8% |
| $100,000 to $149,999 | 68 | 8.8% |
| $150,000 to $199,999 | 103 | 13.4% |
| $200,000+ | 66 | 8.6% |
Family Income by Famaliy Size in Hartville
5-person families (40 | 5.2%) account for the highest median family income in Hartville with $197,500 per family, while 3-person families (64 | 8.3%) have the highest median income of $54,643 per family member.
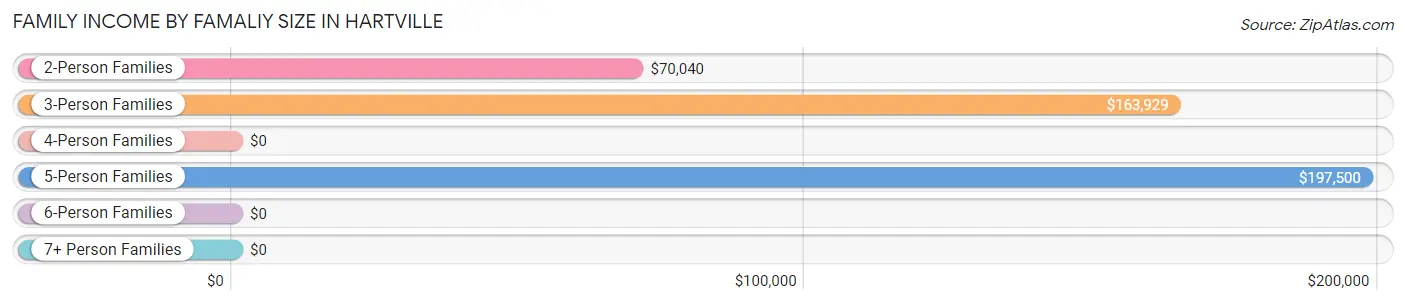
| Income Bracket | # Families | Median Income |
| 2-Person Families | 447 (58.0%) | $70,040 |
| 3-Person Families | 64 (8.3%) | $163,929 |
| 4-Person Families | 208 (27.0%) | $0 |
| 5-Person Families | 40 (5.2%) | $197,500 |
| 6-Person Families | 12 (1.6%) | $0 |
| 7+ Person Families | 0 (0.0%) | $0 |
| Total | 771 (100.0%) | $80,641 |
Family Income by Number of Earners in Hartville
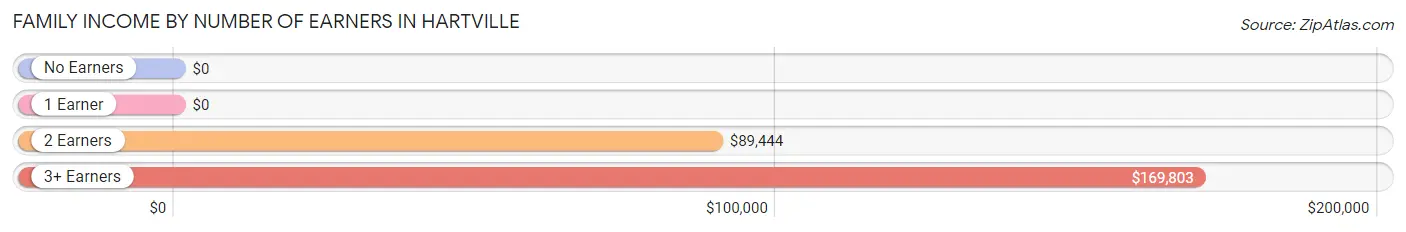
| Number of Earners | # Families | Median Income |
| No Earners | 152 (19.7%) | $0 |
| 1 Earner | 288 (37.3%) | $0 |
| 2 Earners | 206 (26.7%) | $89,444 |
| 3+ Earners | 125 (16.2%) | $169,803 |
| Total | 771 (100.0%) | $80,641 |
Household Income in Hartville
Household Income Brackets in Hartville
With 230 households falling in the category, the $25,000 to $34,999 income range is the most frequent in Hartville, accounting for 15.4% of all households. In contrast, only 16 households (1.1%) fall into the less than $10,000 income bracket, making it the least populous group.
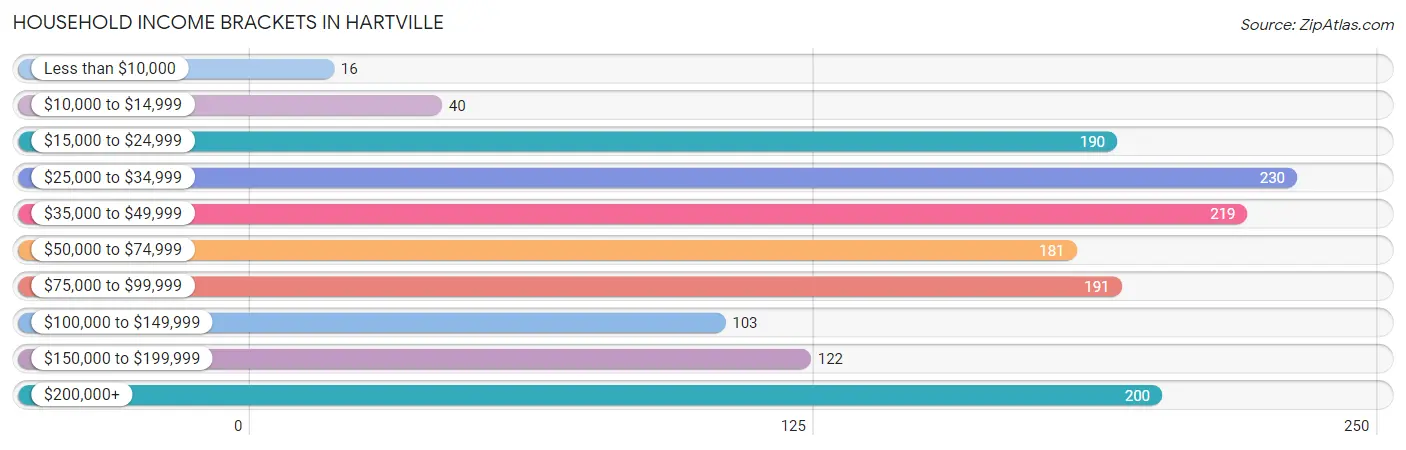
| Income Bracket | # Households | % Households |
| Less than $10,000 | 16 | 1.1% |
| $10,000 to $14,999 | 40 | 2.7% |
| $15,000 to $24,999 | 190 | 12.7% |
| $25,000 to $34,999 | 230 | 15.4% |
| $35,000 to $49,999 | 219 | 14.7% |
| $50,000 to $74,999 | 181 | 12.1% |
| $75,000 to $99,999 | 191 | 12.8% |
| $100,000 to $149,999 | 103 | 6.9% |
| $150,000 to $199,999 | 122 | 8.2% |
| $200,000+ | 200 | 13.4% |
Household Income by Householder Age in Hartville
The median household income in Hartville is $63,873, with the highest median household income of $92,742 found in the 45 to 64 years age bracket for the primary householder. A total of 602 households (40.3%) fall into this category. Meanwhile, the 15 to 24 years age bracket for the primary householder has the lowest median household income of $0, with 13 households (0.9%) in this group.
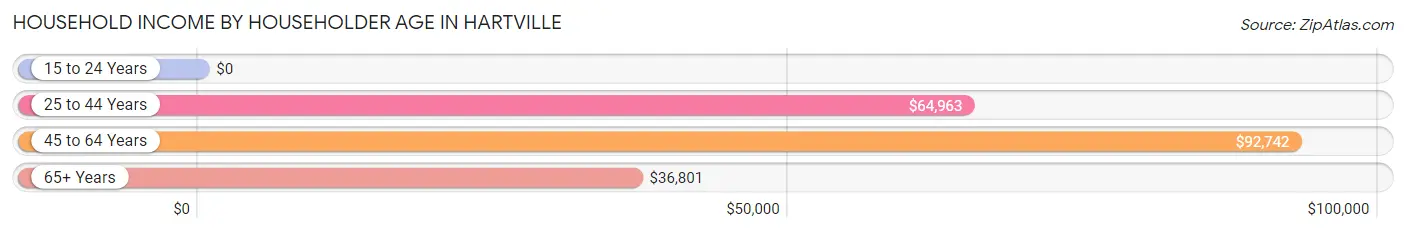
| Income Bracket | # Households | Median Income |
| 15 to 24 Years | 13 (0.9%) | $0 |
| 25 to 44 Years | 357 (23.9%) | $64,963 |
| 45 to 64 Years | 602 (40.3%) | $92,742 |
| 65+ Years | 521 (34.9%) | $36,801 |
| Total | 1,493 (100.0%) | $63,873 |
Poverty in Hartville
Income Below Poverty by Sex and Age in Hartville
With 10.8% poverty level for males and 5.1% for females among the residents of Hartville, under 5 year old males and 6 to 11 year old females are the most vulnerable to poverty, with 36 males (55.4%) and 32 females (42.7%) in their respective age groups living below the poverty level.
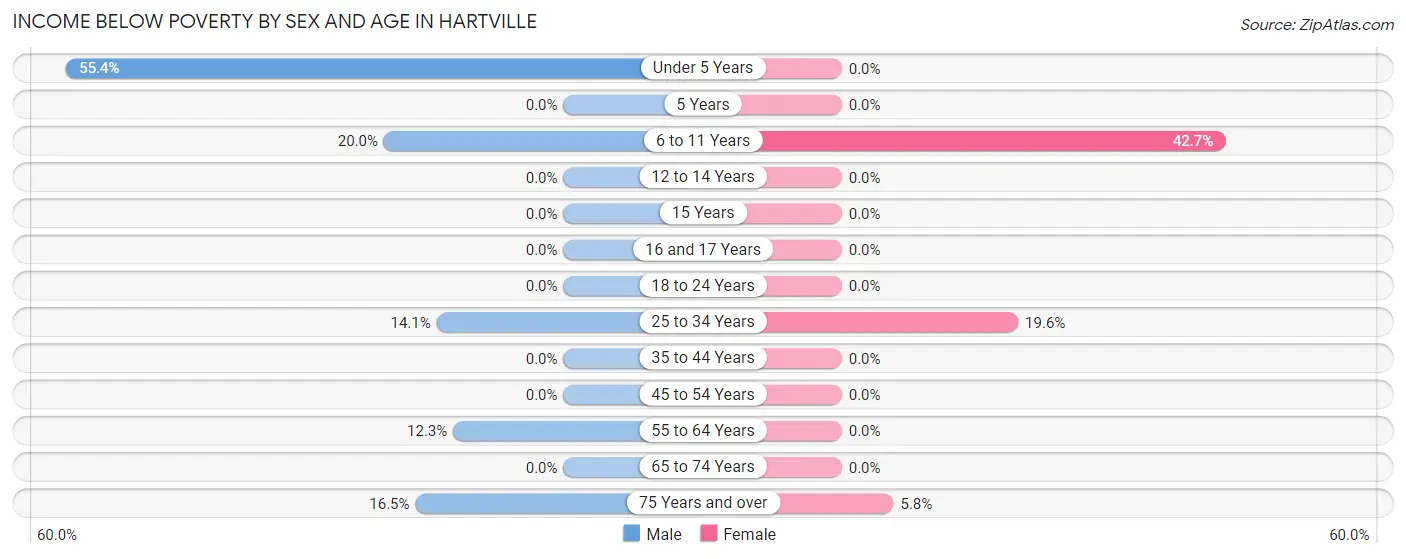
| Age Bracket | Male | Female |
| Under 5 Years | 36 (55.4%) | 0 (0.0%) |
| 5 Years | 0 (0.0%) | 0 (0.0%) |
| 6 to 11 Years | 36 (20.0%) | 32 (42.7%) |
| 12 to 14 Years | 0 (0.0%) | 0 (0.0%) |
| 15 Years | 0 (0.0%) | 0 (0.0%) |
| 16 and 17 Years | 0 (0.0%) | 0 (0.0%) |
| 18 to 24 Years | 0 (0.0%) | 0 (0.0%) |
| 25 to 34 Years | 50 (14.1%) | 33 (19.6%) |
| 35 to 44 Years | 0 (0.0%) | 0 (0.0%) |
| 45 to 54 Years | 0 (0.0%) | 0 (0.0%) |
| 55 to 64 Years | 41 (12.3%) | 0 (0.0%) |
| 65 to 74 Years | 0 (0.0%) | 0 (0.0%) |
| 75 Years and over | 15 (16.5%) | 19 (5.8%) |
| Total | 178 (10.8%) | 84 (5.1%) |
Income Above Poverty by Sex and Age in Hartville
According to the poverty statistics in Hartville, males aged 12 to 14 years and females aged under 5 years are the age groups that are most secure financially, with 100.0% of males and 100.0% of females in these age groups living above the poverty line.
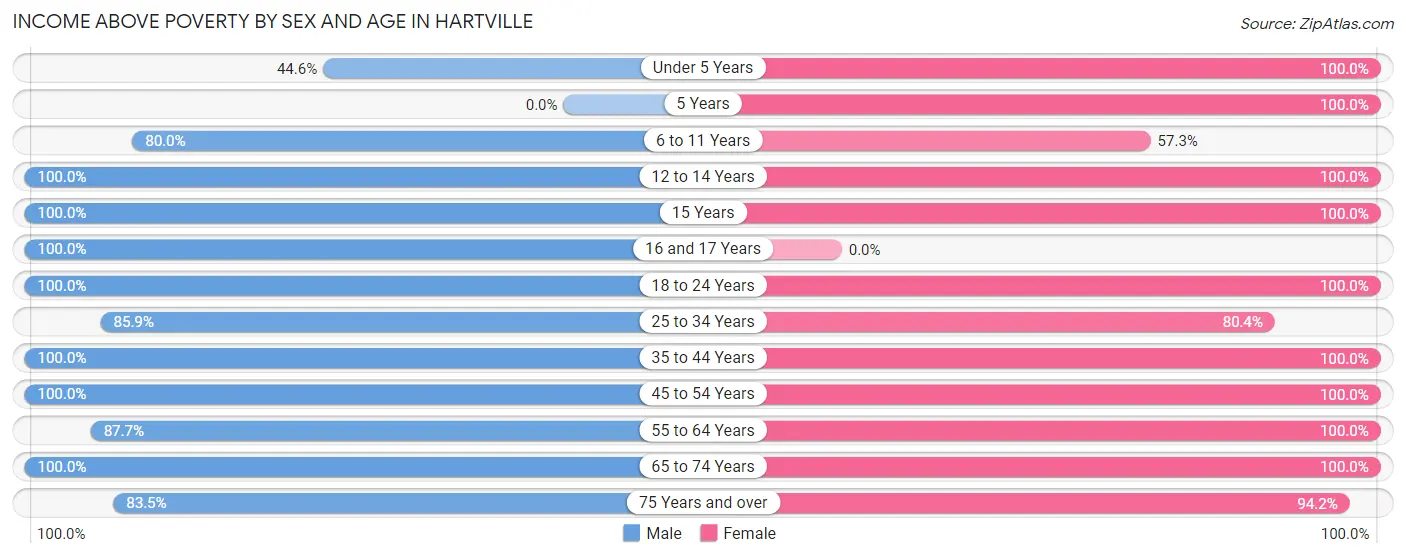
| Age Bracket | Male | Female |
| Under 5 Years | 29 (44.6%) | 14 (100.0%) |
| 5 Years | 0 (0.0%) | 6 (100.0%) |
| 6 to 11 Years | 144 (80.0%) | 43 (57.3%) |
| 12 to 14 Years | 53 (100.0%) | 66 (100.0%) |
| 15 Years | 71 (100.0%) | 19 (100.0%) |
| 16 and 17 Years | 18 (100.0%) | 0 (0.0%) |
| 18 to 24 Years | 93 (100.0%) | 101 (100.0%) |
| 25 to 34 Years | 304 (85.9%) | 135 (80.4%) |
| 35 to 44 Years | 74 (100.0%) | 108 (100.0%) |
| 45 to 54 Years | 153 (100.0%) | 272 (100.0%) |
| 55 to 64 Years | 293 (87.7%) | 306 (100.0%) |
| 65 to 74 Years | 160 (100.0%) | 196 (100.0%) |
| 75 Years and over | 76 (83.5%) | 311 (94.2%) |
| Total | 1,468 (89.2%) | 1,577 (94.9%) |
Income Below Poverty Among Married-Couple Families in Hartville
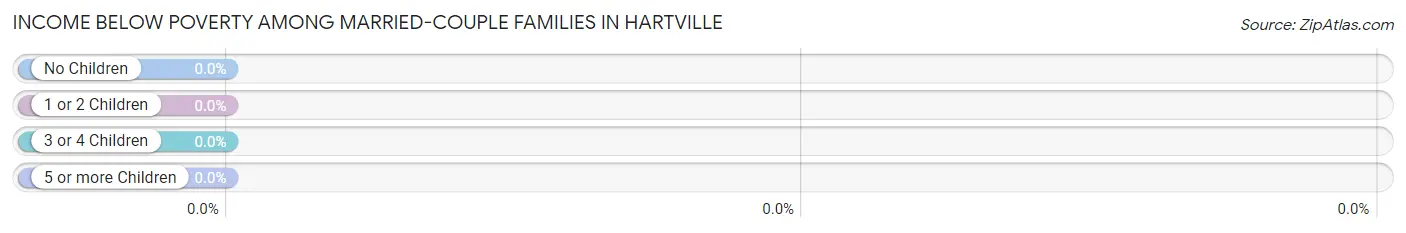
| Children | Above Poverty | Below Poverty |
| No Children | 370 (100.0%) | 0 (0.0%) |
| 1 or 2 Children | 95 (100.0%) | 0 (0.0%) |
| 3 or 4 Children | 41 (100.0%) | 0 (0.0%) |
| 5 or more Children | 0 (0.0%) | 0 (0.0%) |
| Total | 506 (100.0%) | 0 (0.0%) |
Income Below Poverty Among Single-Parent Households in Hartville
According to the poverty data in Hartville, 100.0% or 41 single-father households and 14.7% or 33 single-mother households are living below the poverty line. Among single-father households, those with no children have the highest poverty rate, with 41 households (100.0%) experiencing poverty. Likewise, among single-mother households, those with 3 or 4 children have the highest poverty rate, with 33 households (100.0%) falling below the poverty line.
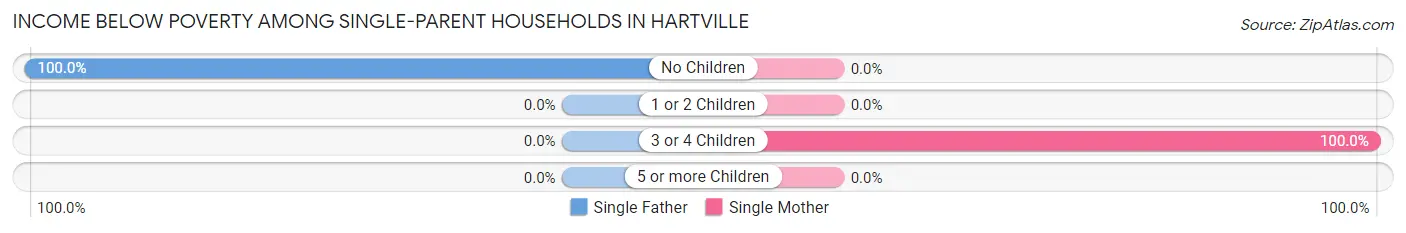
| Children | Single Father | Single Mother |
| No Children | 41 (100.0%) | 0 (0.0%) |
| 1 or 2 Children | 0 (0.0%) | 0 (0.0%) |
| 3 or 4 Children | 0 (0.0%) | 33 (100.0%) |
| 5 or more Children | 0 (0.0%) | 0 (0.0%) |
| Total | 41 (100.0%) | 33 (14.7%) |
Income Below Poverty Among Married-Couple vs Single-Parent Households in Hartville
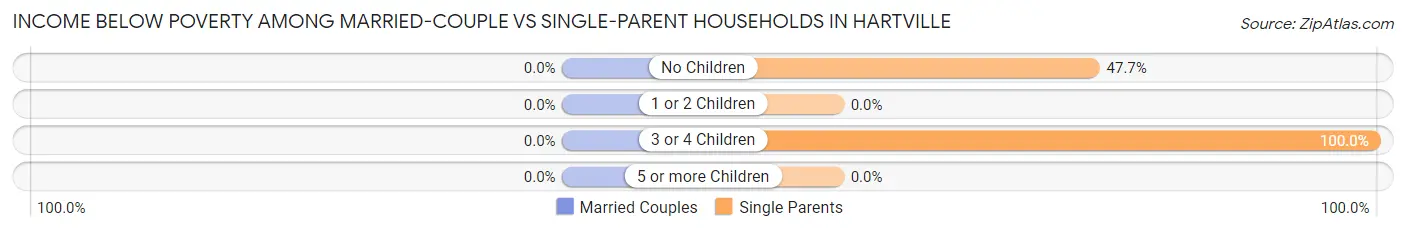
| Children | Married-Couple Families | Single-Parent Households |
| No Children | 0 (0.0%) | 41 (47.7%) |
| 1 or 2 Children | 0 (0.0%) | 0 (0.0%) |
| 3 or 4 Children | 0 (0.0%) | 33 (100.0%) |
| 5 or more Children | 0 (0.0%) | 0 (0.0%) |
| Total | 0 (0.0%) | 74 (27.9%) |
Race in Hartville
The most populous races in Hartville are White / Caucasian (3,008 | 90.7%), Black / African American (137 | 4.1%), and Hispanic or Latino (127 | 3.8%).
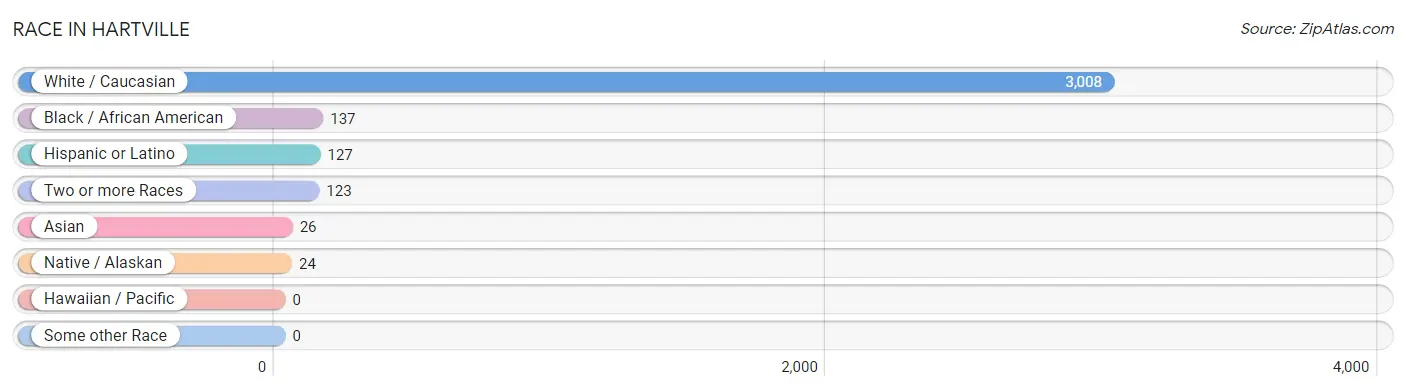
| Race | # Population | % Population |
| Asian | 26 | 0.8% |
| Black / African American | 137 | 4.1% |
| Hawaiian / Pacific | 0 | 0.0% |
| Hispanic or Latino | 127 | 3.8% |
| Native / Alaskan | 24 | 0.7% |
| White / Caucasian | 3,008 | 90.7% |
| Two or more Races | 123 | 3.7% |
| Some other Race | 0 | 0.0% |
| Total | 3,318 | 100.0% |
Ancestry in Hartville
The most populous ancestries reported in Hartville are German (960 | 28.9%), English (356 | 10.7%), Irish (290 | 8.7%), Swiss (211 | 6.4%), and Italian (169 | 5.1%), together accounting for 59.9% of all Hartville residents.
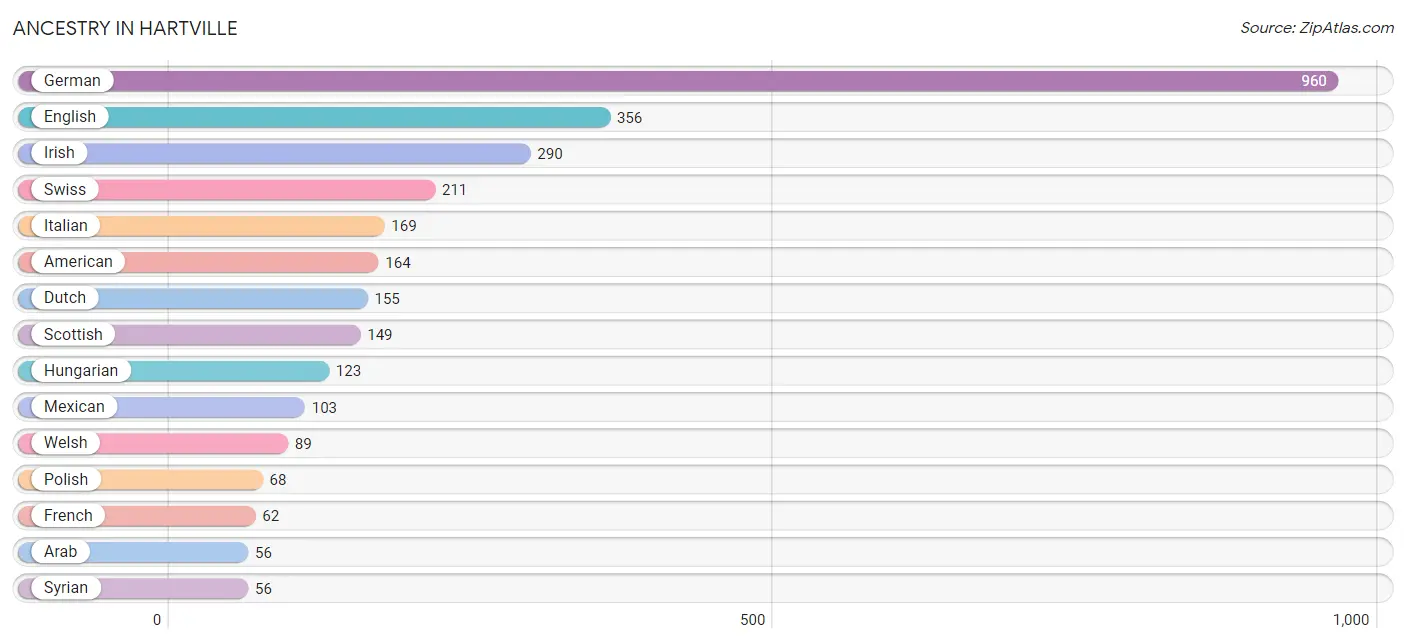
| Ancestry | # Population | % Population |
| Albanian | 14 | 0.4% |
| American | 164 | 4.9% |
| Arab | 56 | 1.7% |
| British | 40 | 1.2% |
| Central American | 24 | 0.7% |
| Central American Indian | 24 | 0.7% |
| Cherokee | 19 | 0.6% |
| Croatian | 36 | 1.1% |
| Dutch | 155 | 4.7% |
| Eastern European | 13 | 0.4% |
| English | 356 | 10.7% |
| European | 22 | 0.7% |
| Finnish | 11 | 0.3% |
| French | 62 | 1.9% |
| German | 960 | 28.9% |
| Greek | 35 | 1.1% |
| Guatemalan | 24 | 0.7% |
| Hungarian | 123 | 3.7% |
| Irish | 290 | 8.7% |
| Italian | 169 | 5.1% |
| Lithuanian | 31 | 0.9% |
| Mexican | 103 | 3.1% |
| Polish | 68 | 2.1% |
| Russian | 31 | 0.9% |
| Scotch-Irish | 26 | 0.8% |
| Scottish | 149 | 4.5% |
| Slovak | 40 | 1.2% |
| Slovene | 24 | 0.7% |
| Swiss | 211 | 6.4% |
| Syrian | 56 | 1.7% |
| Vietnamese | 26 | 0.8% |
| Welsh | 89 | 2.7% | View All 32 Rows |
Immigrants in Hartville
The most numerous immigrant groups reported in Hartville came from Central America (103 | 3.1%), Latin America (103 | 3.1%), Mexico (103 | 3.1%), Asia (26 | 0.8%), and Bangladesh (26 | 0.8%), together accounting for 10.9% of all Hartville residents.
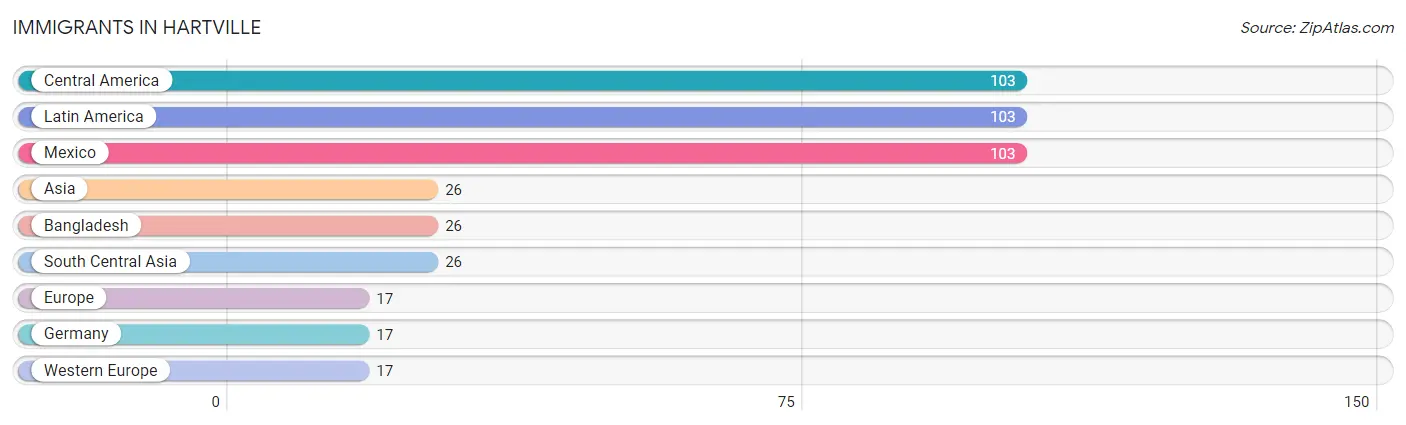
| Immigration Origin | # Population | % Population |
| Asia | 26 | 0.8% |
| Bangladesh | 26 | 0.8% |
| Central America | 103 | 3.1% |
| Europe | 17 | 0.5% |
| Germany | 17 | 0.5% |
| Latin America | 103 | 3.1% |
| Mexico | 103 | 3.1% |
| South Central Asia | 26 | 0.8% |
| Western Europe | 17 | 0.5% | View All 9 Rows |
Sex and Age in Hartville
Sex and Age in Hartville
The most populous age groups in Hartville are 25 to 29 Years (235 | 14.3%) for men and 55 to 59 Years (183 | 10.9%) for women.
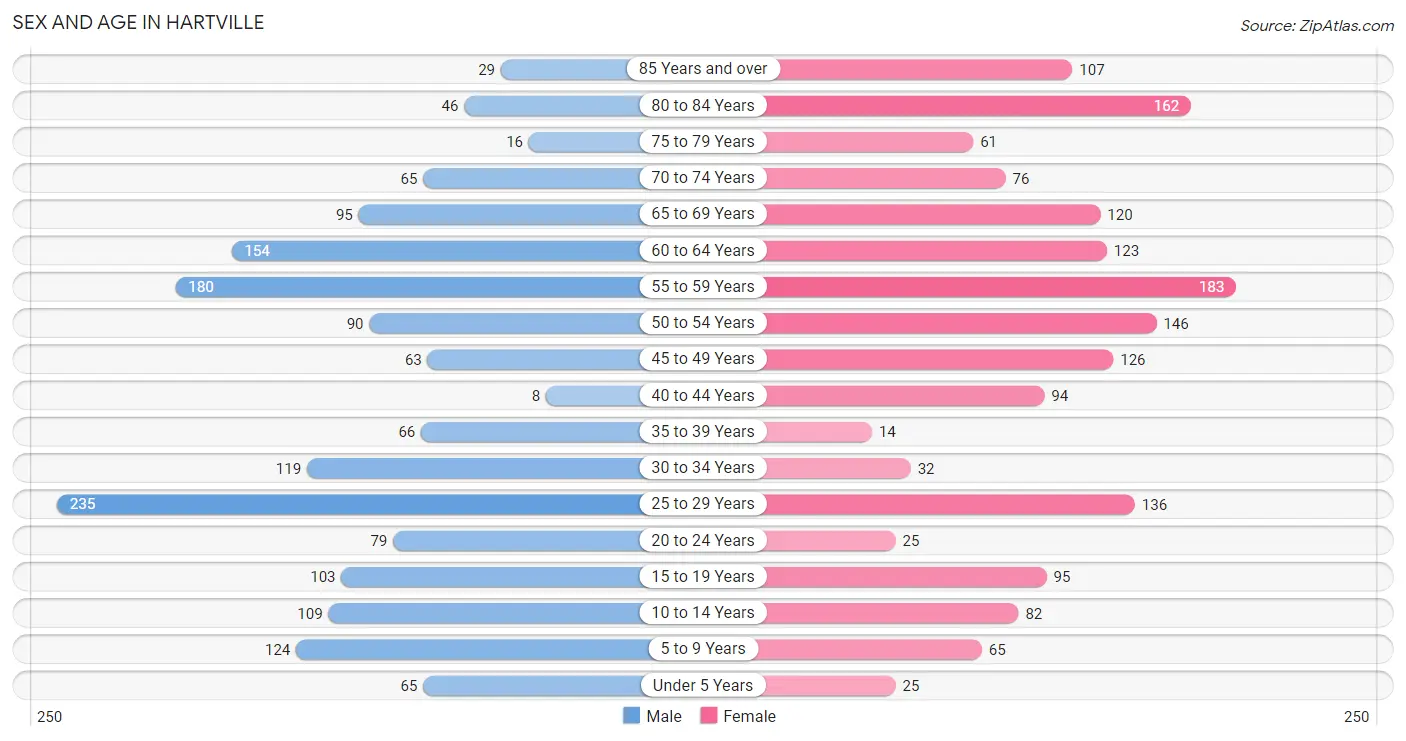
| Age Bracket | Male | Female |
| Under 5 Years | 65 (4.0%) | 25 (1.5%) |
| 5 to 9 Years | 124 (7.5%) | 65 (3.9%) |
| 10 to 14 Years | 109 (6.6%) | 82 (4.9%) |
| 15 to 19 Years | 103 (6.3%) | 95 (5.7%) |
| 20 to 24 Years | 79 (4.8%) | 25 (1.5%) |
| 25 to 29 Years | 235 (14.3%) | 136 (8.1%) |
| 30 to 34 Years | 119 (7.2%) | 32 (1.9%) |
| 35 to 39 Years | 66 (4.0%) | 14 (0.8%) |
| 40 to 44 Years | 8 (0.5%) | 94 (5.6%) |
| 45 to 49 Years | 63 (3.8%) | 126 (7.5%) |
| 50 to 54 Years | 90 (5.5%) | 146 (8.7%) |
| 55 to 59 Years | 180 (10.9%) | 183 (10.9%) |
| 60 to 64 Years | 154 (9.4%) | 123 (7.4%) |
| 65 to 69 Years | 95 (5.8%) | 120 (7.2%) |
| 70 to 74 Years | 65 (4.0%) | 76 (4.5%) |
| 75 to 79 Years | 16 (1.0%) | 61 (3.6%) |
| 80 to 84 Years | 46 (2.8%) | 162 (9.7%) |
| 85 Years and over | 29 (1.8%) | 107 (6.4%) |
| Total | 1,646 (100.0%) | 1,672 (100.0%) |
Families and Households in Hartville
Median Family Size in Hartville
The median family size in Hartville is 2.94 persons per family, with married-couple families (506 | 65.6%) accounting for the largest median family size of 3.25 persons per family. On the other hand, single male/father families (41 | 5.3%) represent the smallest median family size with 2.22 persons per family.
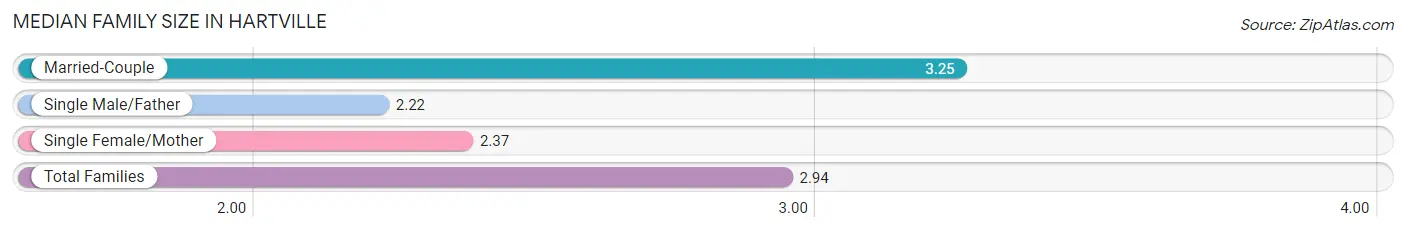
| Family Type | # Families | Family Size |
| Married-Couple | 506 (65.6%) | 3.25 |
| Single Male/Father | 41 (5.3%) | 2.22 |
| Single Female/Mother | 224 (29.0%) | 2.37 |
| Total Families | 771 (100.0%) | 2.94 |
Median Household Size in Hartville
The median household size in Hartville is 2.21 persons per household, with married-couple households (506 | 33.9%) accounting for the largest median household size of 3.35 persons per household. non-family households (722 | 48.4%) represent the smallest median household size with 1.14 persons per household.
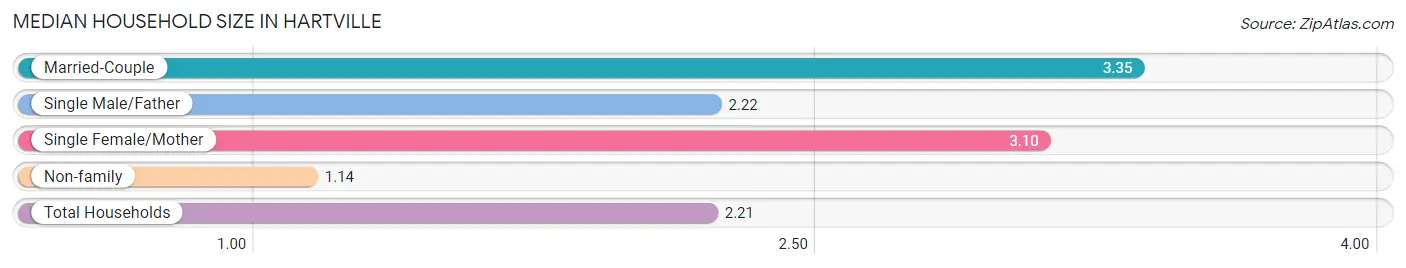
| Household Type | # Households | Household Size |
| Married-Couple | 506 (33.9%) | 3.35 |
| Single Male/Father | 41 (2.8%) | 2.22 |
| Single Female/Mother | 224 (15.0%) | 3.10 |
| Non-family | 722 (48.4%) | 1.14 |
| Total Households | 1,493 (100.0%) | 2.21 |
Household Size by Marriage Status in Hartville
Out of a total of 1,493 households in Hartville, 771 (51.6%) are family households, while 722 (48.4%) are nonfamily households. The most numerous type of family households are 2-person households, comprising 363, and the most common type of nonfamily households are 1-person households, comprising 634.
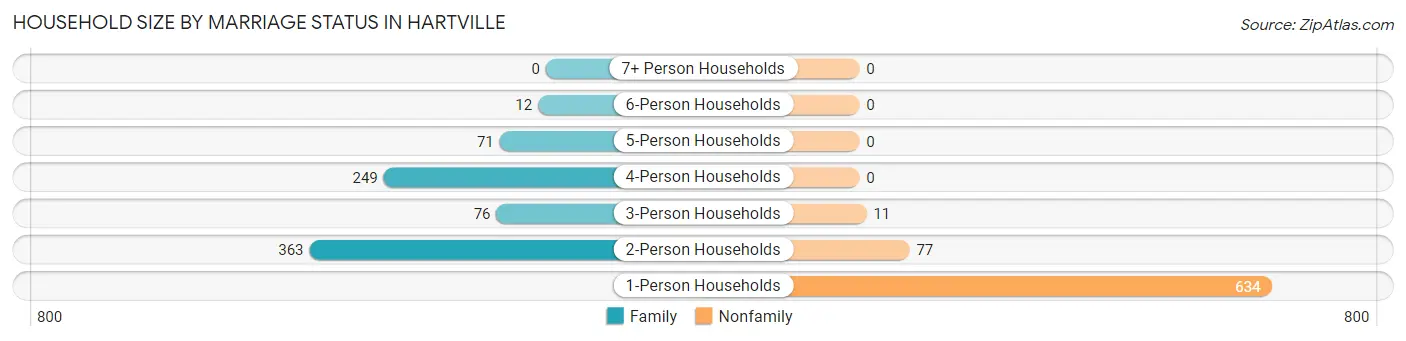
| Household Size | Family Households | Nonfamily Households |
| 1-Person Households | - | 634 (42.5%) |
| 2-Person Households | 363 (24.3%) | 77 (5.2%) |
| 3-Person Households | 76 (5.1%) | 11 (0.7%) |
| 4-Person Households | 249 (16.7%) | 0 (0.0%) |
| 5-Person Households | 71 (4.8%) | 0 (0.0%) |
| 6-Person Households | 12 (0.8%) | 0 (0.0%) |
| 7+ Person Households | 0 (0.0%) | 0 (0.0%) |
| Total | 771 (51.6%) | 722 (48.4%) |
Female Fertility in Hartville
Fertility by Age in Hartville
Average fertility rate in Hartville is 27.0 births per 1,000 women. Women in the age bracket of 35 to 50 years have the highest fertility rate with 60.0 births per 1,000 women. Women in the age bracket of 35 to 50 years acount for 100.0% of all women with births.
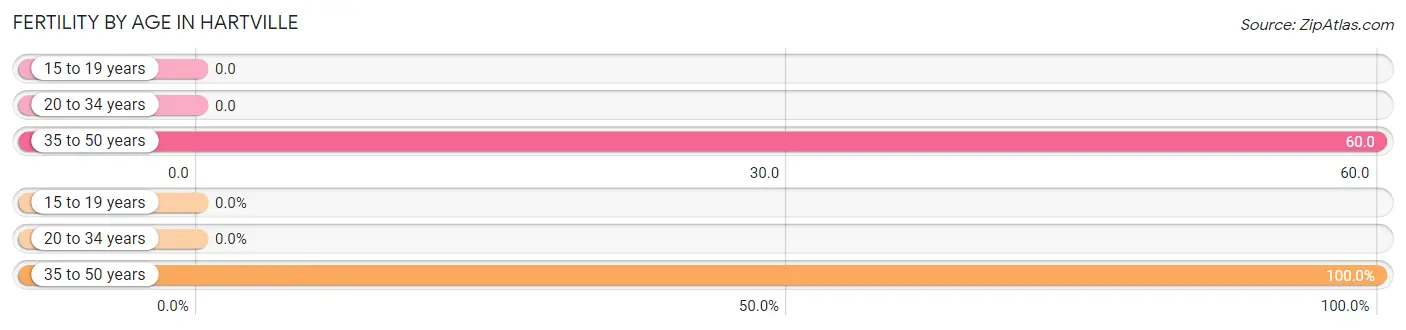
| Age Bracket | Women with Births | Births / 1,000 Women |
| 15 to 19 years | 0 (0.0%) | 0.0 |
| 20 to 34 years | 0 (0.0%) | 0.0 |
| 35 to 50 years | 14 (100.0%) | 60.0 |
| Total | 14 (100.0%) | 27.0 |
Fertility by Age by Marriage Status in Hartville
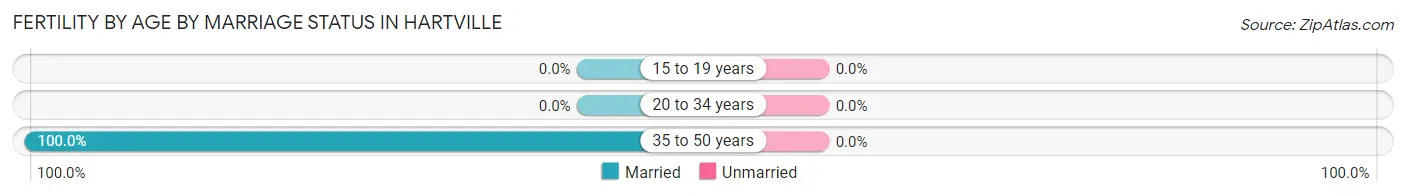
| Age Bracket | Married | Unmarried |
| 15 to 19 years | 0 (0.0%) | 0 (0.0%) |
| 20 to 34 years | 0 (0.0%) | 0 (0.0%) |
| 35 to 50 years | 14 (100.0%) | 0 (0.0%) |
| Total | 14 (100.0%) | 0 (0.0%) |
Fertility by Education in Hartville
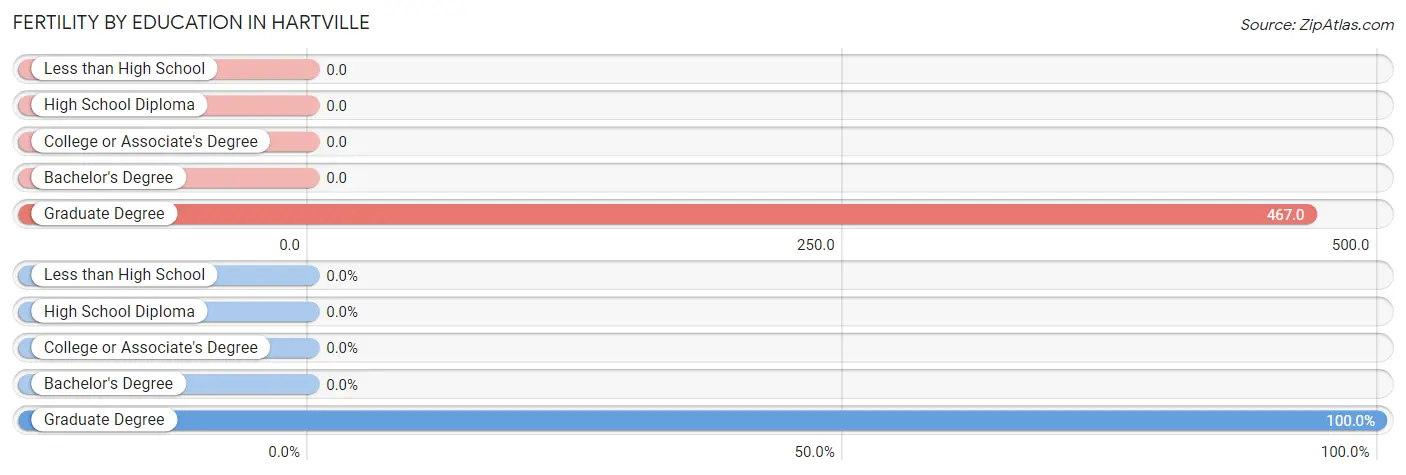
| Educational Attainment | Women with Births | Births / 1,000 Women |
| Less than High School | 0 (0.0%) | 0.0 |
| High School Diploma | 0 (0.0%) | 0.0 |
| College or Associate's Degree | 0 (0.0%) | 0.0 |
| Bachelor's Degree | 0 (0.0%) | 0.0 |
| Graduate Degree | 14 (100.0%) | 467.0 |
| Total | 14 (100.0%) | 27.0 |
Fertility by Education by Marriage Status in Hartville
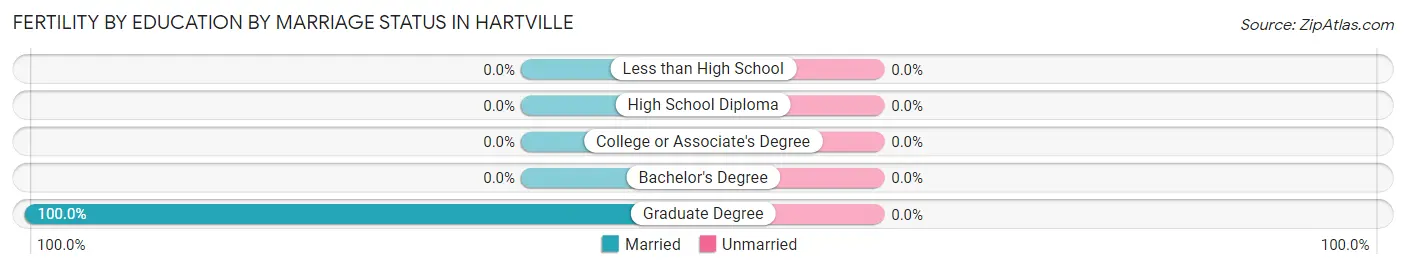
| Educational Attainment | Married | Unmarried |
| Less than High School | 0 (0.0%) | 0 (0.0%) |
| High School Diploma | 0 (0.0%) | 0 (0.0%) |
| College or Associate's Degree | 0 (0.0%) | 0 (0.0%) |
| Bachelor's Degree | 0 (0.0%) | 0 (0.0%) |
| Graduate Degree | 14 (100.0%) | 0 (0.0%) |
| Total | 14 (100.0%) | 0 (0.0%) |
Employment Characteristics in Hartville
Employment by Class of Employer in Hartville
Among the 1,662 employed individuals in Hartville, private company employees (1,154 | 69.4%), not-for-profit organizations (299 | 18.0%), and local government employees (94 | 5.7%) make up the most common classes of employment.
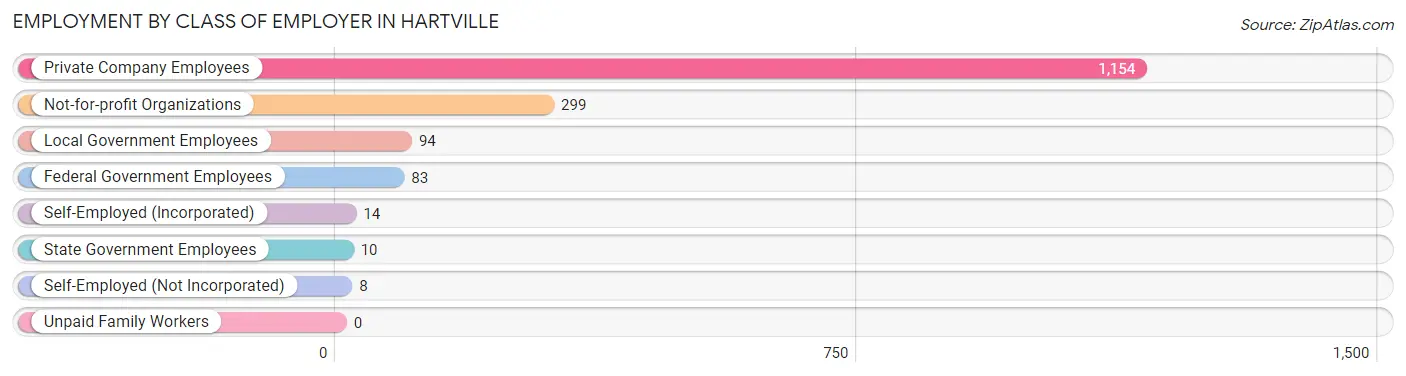
| Employer Class | # Employees | % Employees |
| Private Company Employees | 1,154 | 69.4% |
| Self-Employed (Incorporated) | 14 | 0.8% |
| Self-Employed (Not Incorporated) | 8 | 0.5% |
| Not-for-profit Organizations | 299 | 18.0% |
| Local Government Employees | 94 | 5.7% |
| State Government Employees | 10 | 0.6% |
| Federal Government Employees | 83 | 5.0% |
| Unpaid Family Workers | 0 | 0.0% |
| Total | 1,662 | 100.0% |
Employment Status by Age in Hartville
According to the labor force statistics for Hartville, out of the total population over 16 years of age (2,758), 60.9% or 1,680 individuals are in the labor force, with 1.0% or 17 of them unemployed. The age group with the highest labor force participation rate is 30 to 34 years, with 100.0% or 151 individuals in the labor force. Within the labor force, the 20 to 24 years age range has the highest percentage of unemployed individuals, with 18.9% or 17 of them being unemployed.
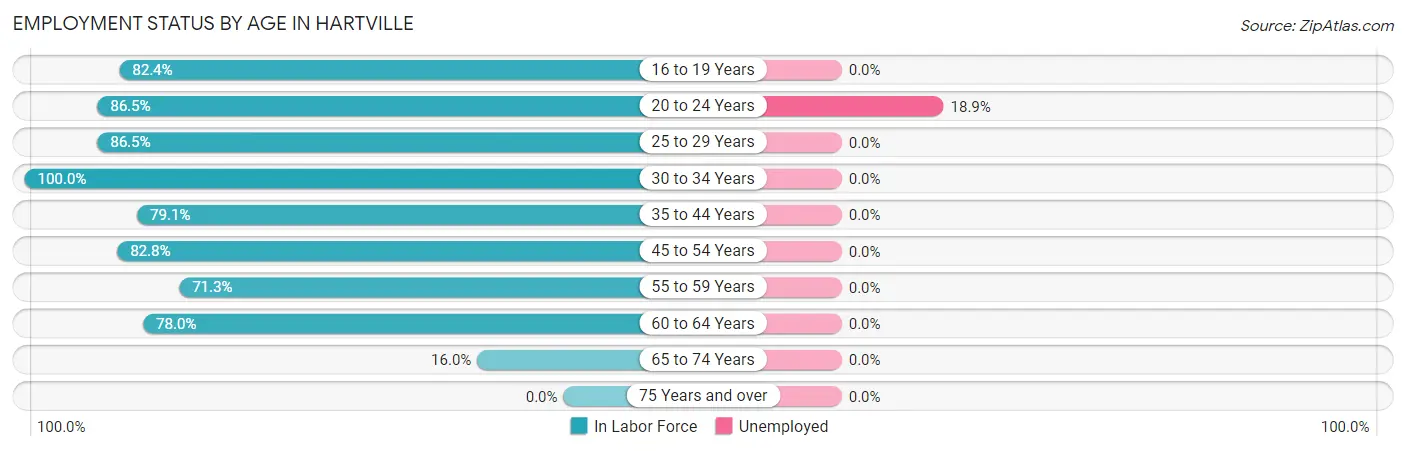
| Age Bracket | In Labor Force | Unemployed |
| 16 to 19 Years | 89 (82.4%) | 0 (0.0%) |
| 20 to 24 Years | 90 (86.5%) | 17 (18.9%) |
| 25 to 29 Years | 321 (86.5%) | 0 (0.0%) |
| 30 to 34 Years | 151 (100.0%) | 0 (0.0%) |
| 35 to 44 Years | 144 (79.1%) | 0 (0.0%) |
| 45 to 54 Years | 352 (82.8%) | 0 (0.0%) |
| 55 to 59 Years | 259 (71.3%) | 0 (0.0%) |
| 60 to 64 Years | 216 (78.0%) | 0 (0.0%) |
| 65 to 74 Years | 57 (16.0%) | 0 (0.0%) |
| 75 Years and over | 0 (0.0%) | 0 (0.0%) |
| Total | 1,680 (60.9%) | 17 (1.0%) |
Employment Status by Educational Attainment in Hartville
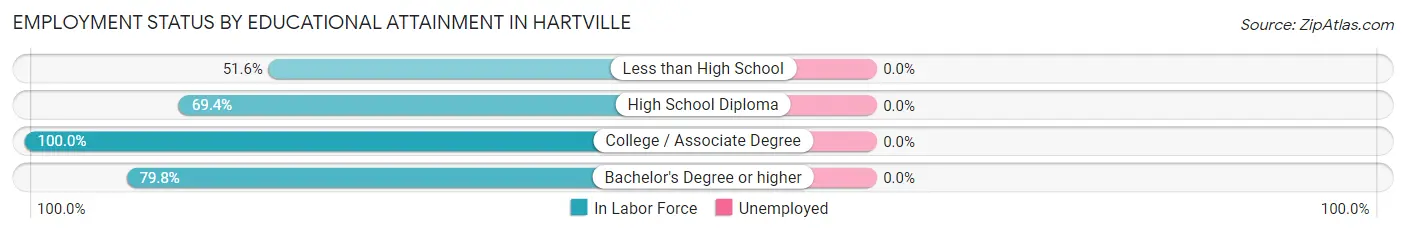
| Educational Attainment | In Labor Force | Unemployed |
| Less than High School | 16 (51.6%) | 0 (0.0%) |
| High School Diploma | 361 (69.4%) | 0 (0.0%) |
| College / Associate Degree | 467 (100.0%) | 0 (0.0%) |
| Bachelor's Degree or higher | 599 (79.8%) | 0 (0.0%) |
| Total | 1,444 (81.6%) | 0 (0.0%) |
Employment Occupations by Sex in Hartville
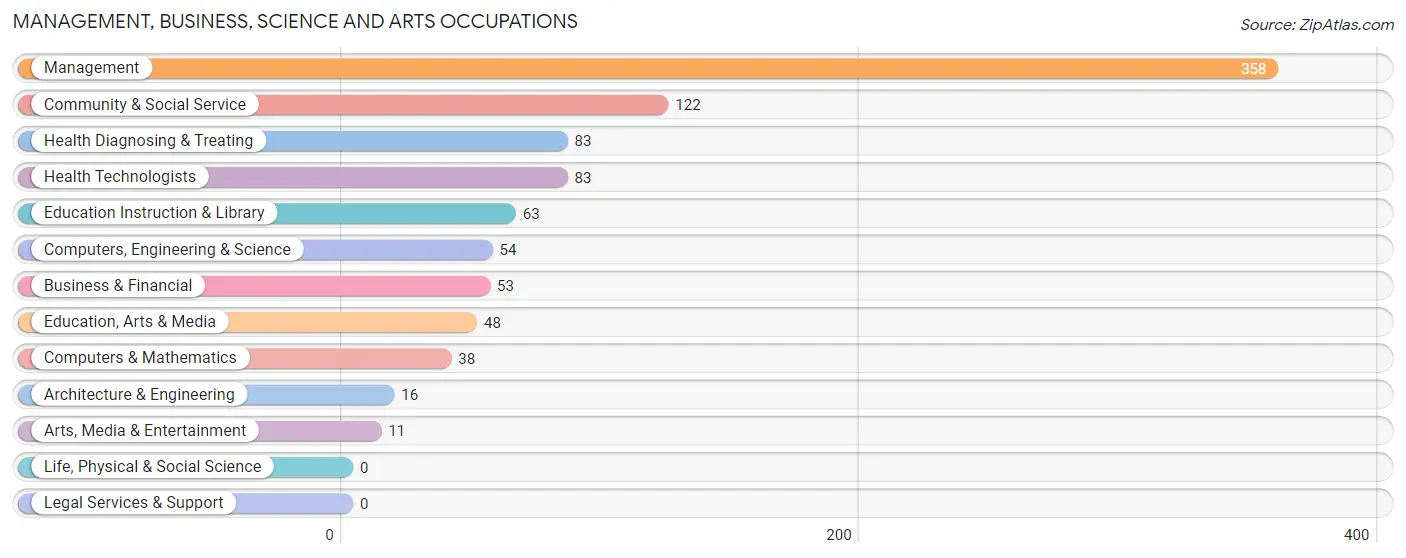
Management, Business, Science and Arts Occupations
The most common Management, Business, Science and Arts occupations in Hartville are Management (358 | 21.5%), Community & Social Service (122 | 7.3%), Health Diagnosing & Treating (83 | 5.0%), Health Technologists (83 | 5.0%), and Education Instruction & Library (63 | 3.8%).
Management, Business, Science and Arts Occupations by Sex
Within the Management, Business, Science and Arts occupations in Hartville, the most male-oriented occupations are Computers & Mathematics (100.0%), Arts, Media & Entertainment (100.0%), and Education, Arts & Media (85.4%), while the most female-oriented occupations are Architecture & Engineering (100.0%), Health Diagnosing & Treating (83.1%), and Health Technologists (83.1%).
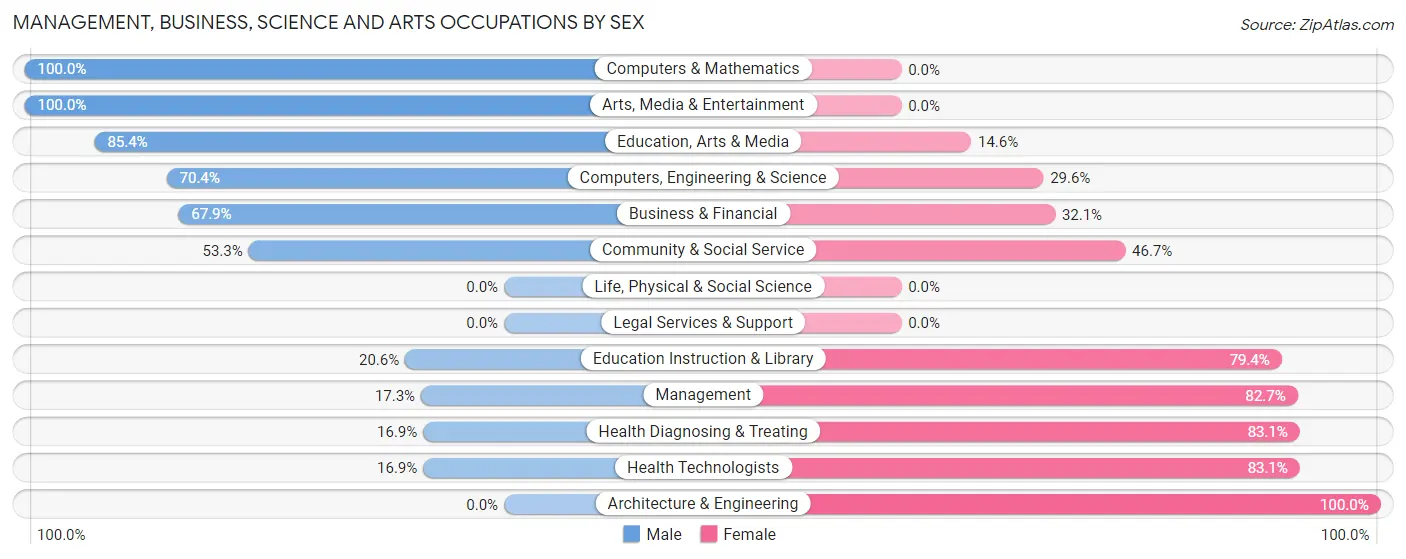
| Occupation | Male | Female |
| Management | 62 (17.3%) | 296 (82.7%) |
| Business & Financial | 36 (67.9%) | 17 (32.1%) |
| Computers, Engineering & Science | 38 (70.4%) | 16 (29.6%) |
| Computers & Mathematics | 38 (100.0%) | 0 (0.0%) |
| Architecture & Engineering | 0 (0.0%) | 16 (100.0%) |
| Life, Physical & Social Science | 0 (0.0%) | 0 (0.0%) |
| Community & Social Service | 65 (53.3%) | 57 (46.7%) |
| Education, Arts & Media | 41 (85.4%) | 7 (14.6%) |
| Legal Services & Support | 0 (0.0%) | 0 (0.0%) |
| Education Instruction & Library | 13 (20.6%) | 50 (79.4%) |
| Arts, Media & Entertainment | 11 (100.0%) | 0 (0.0%) |
| Health Diagnosing & Treating | 14 (16.9%) | 69 (83.1%) |
| Health Technologists | 14 (16.9%) | 69 (83.1%) |
| Total (Category) | 215 (32.1%) | 455 (67.9%) |
| Total (Overall) | 894 (53.8%) | 768 (46.2%) |
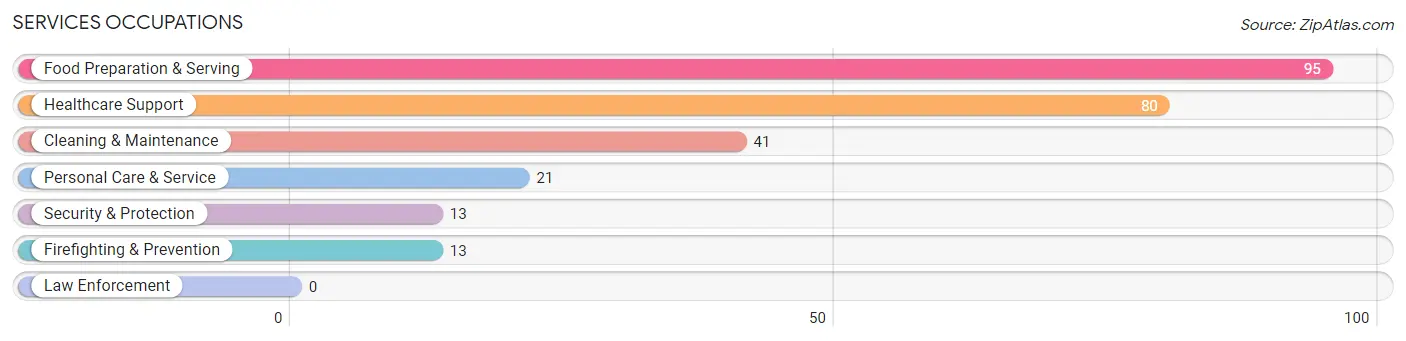
Services Occupations
The most common Services occupations in Hartville are Food Preparation & Serving (95 | 5.7%), Healthcare Support (80 | 4.8%), Cleaning & Maintenance (41 | 2.5%), Personal Care & Service (21 | 1.3%), and Security & Protection (13 | 0.8%).
Services Occupations by Sex
Within the Services occupations in Hartville, the most male-oriented occupations are Security & Protection (100.0%), Firefighting & Prevention (100.0%), and Cleaning & Maintenance (100.0%), while the most female-oriented occupations are Personal Care & Service (100.0%), Healthcare Support (57.5%), and Food Preparation & Serving (9.5%).
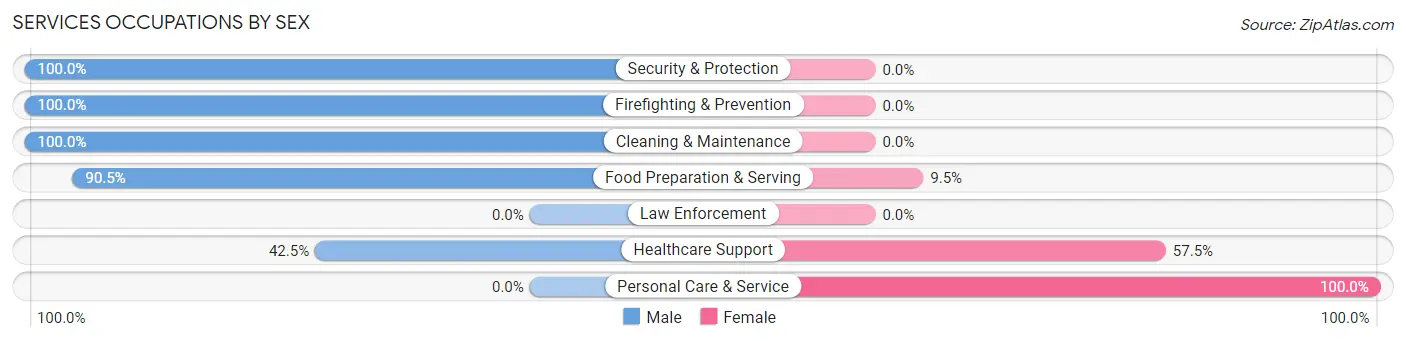
| Occupation | Male | Female |
| Healthcare Support | 34 (42.5%) | 46 (57.5%) |
| Security & Protection | 13 (100.0%) | 0 (0.0%) |
| Firefighting & Prevention | 13 (100.0%) | 0 (0.0%) |
| Law Enforcement | 0 (0.0%) | 0 (0.0%) |
| Food Preparation & Serving | 86 (90.5%) | 9 (9.5%) |
| Cleaning & Maintenance | 41 (100.0%) | 0 (0.0%) |
| Personal Care & Service | 0 (0.0%) | 21 (100.0%) |
| Total (Category) | 174 (69.6%) | 76 (30.4%) |
| Total (Overall) | 894 (53.8%) | 768 (46.2%) |
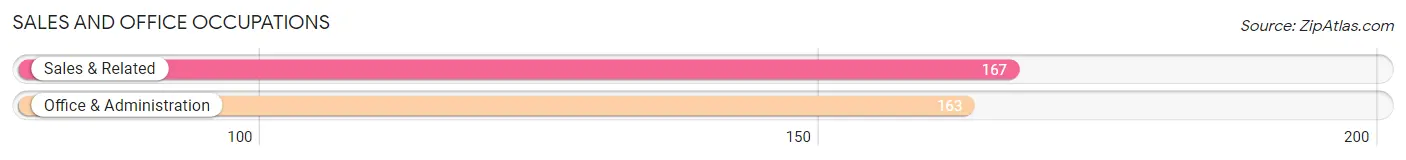
Sales and Office Occupations
The most common Sales and Office occupations in Hartville are Sales & Related (167 | 10.1%), and Office & Administration (163 | 9.8%).
Sales and Office Occupations by Sex
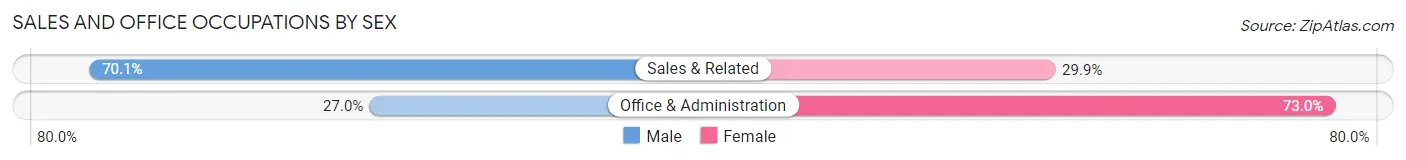
| Occupation | Male | Female |
| Sales & Related | 117 (70.1%) | 50 (29.9%) |
| Office & Administration | 44 (27.0%) | 119 (73.0%) |
| Total (Category) | 161 (48.8%) | 169 (51.2%) |
| Total (Overall) | 894 (53.8%) | 768 (46.2%) |
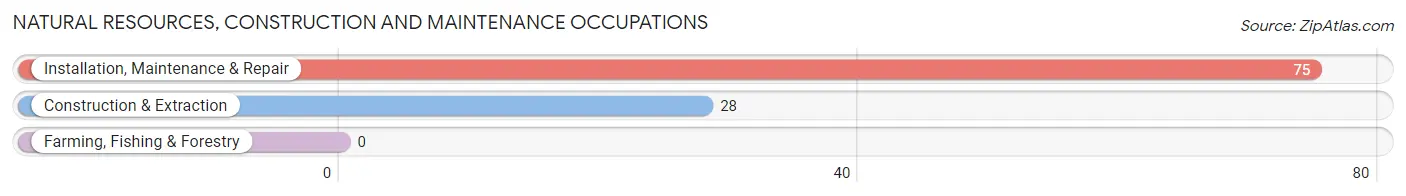
Natural Resources, Construction and Maintenance Occupations
The most common Natural Resources, Construction and Maintenance occupations in Hartville are Installation, Maintenance & Repair (75 | 4.5%), and Construction & Extraction (28 | 1.7%).
Natural Resources, Construction and Maintenance Occupations by Sex
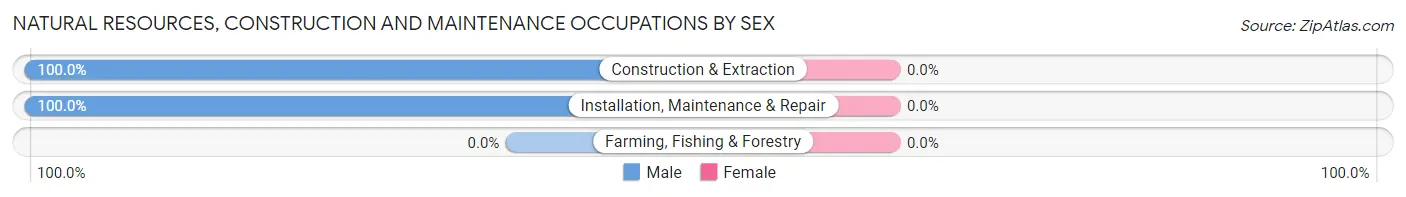
| Occupation | Male | Female |
| Farming, Fishing & Forestry | 0 (0.0%) | 0 (0.0%) |
| Construction & Extraction | 28 (100.0%) | 0 (0.0%) |
| Installation, Maintenance & Repair | 75 (100.0%) | 0 (0.0%) |
| Total (Category) | 103 (100.0%) | 0 (0.0%) |
| Total (Overall) | 894 (53.8%) | 768 (46.2%) |
Production, Transportation and Moving Occupations
The most common Production, Transportation and Moving occupations in Hartville are Production (167 | 10.1%), Material Moving (95 | 5.7%), and Transportation (47 | 2.8%).
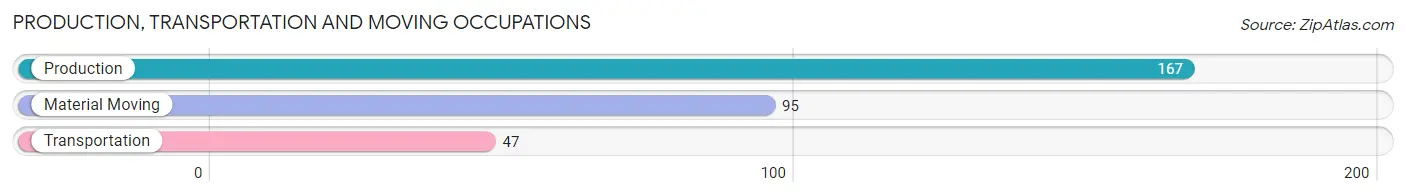
Production, Transportation and Moving Occupations by Sex
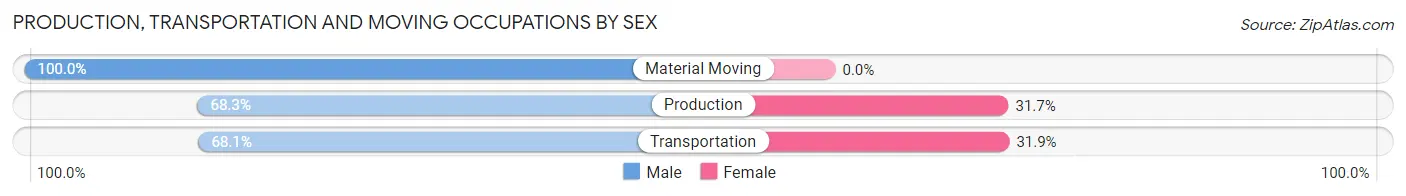
| Occupation | Male | Female |
| Production | 114 (68.3%) | 53 (31.7%) |
| Transportation | 32 (68.1%) | 15 (31.9%) |
| Material Moving | 95 (100.0%) | 0 (0.0%) |
| Total (Category) | 241 (78.0%) | 68 (22.0%) |
| Total (Overall) | 894 (53.8%) | 768 (46.2%) |
Employment Industries by Sex in Hartville
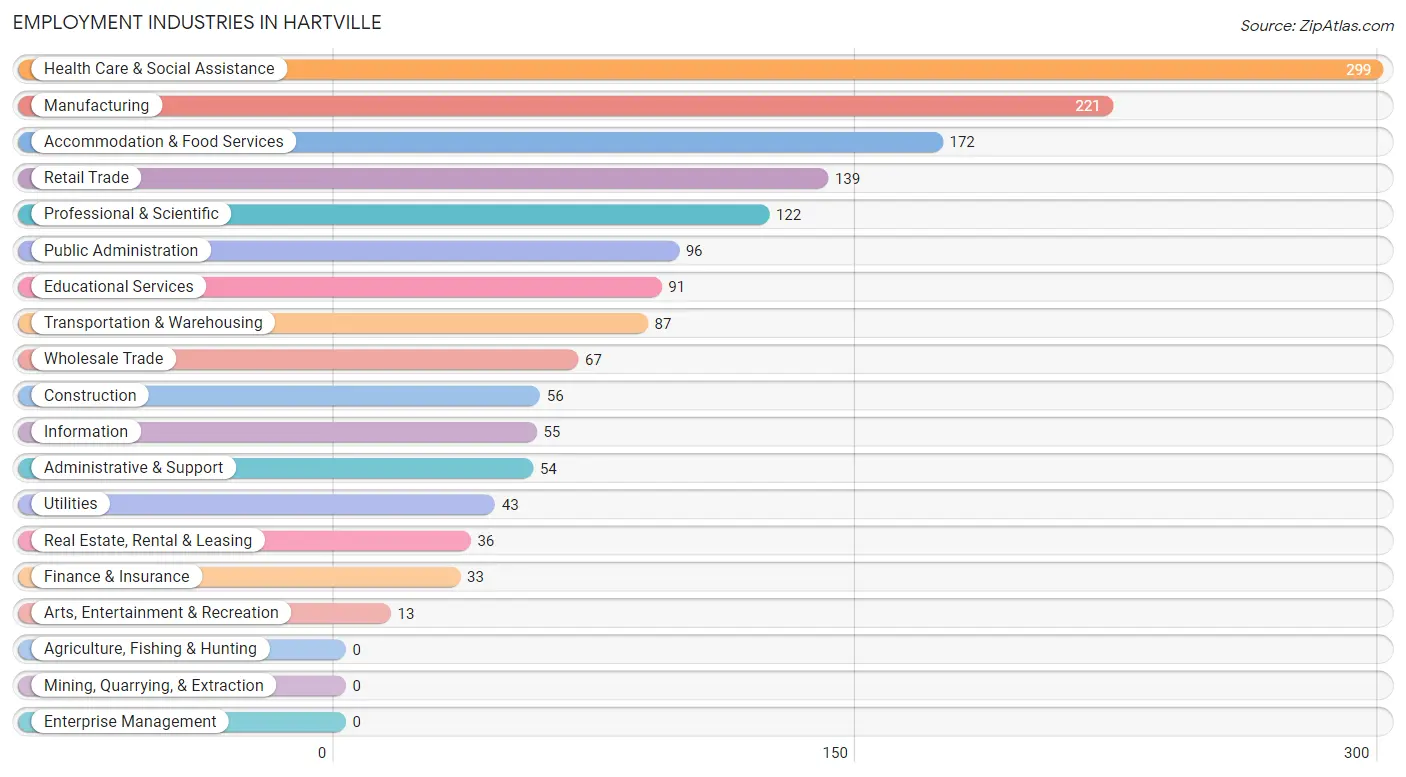
Employment Industries in Hartville
The major employment industries in Hartville include Health Care & Social Assistance (299 | 18.0%), Manufacturing (221 | 13.3%), Accommodation & Food Services (172 | 10.3%), Retail Trade (139 | 8.4%), and Professional & Scientific (122 | 7.3%).
Employment Industries by Sex in Hartville
The Hartville industries that see more men than women are Information (100.0%), Administrative & Support (100.0%), and Arts, Entertainment & Recreation (100.0%), whereas the industries that tend to have a higher number of women are Finance & Insurance (100.0%), Real Estate, Rental & Leasing (100.0%), and Public Administration (89.6%).
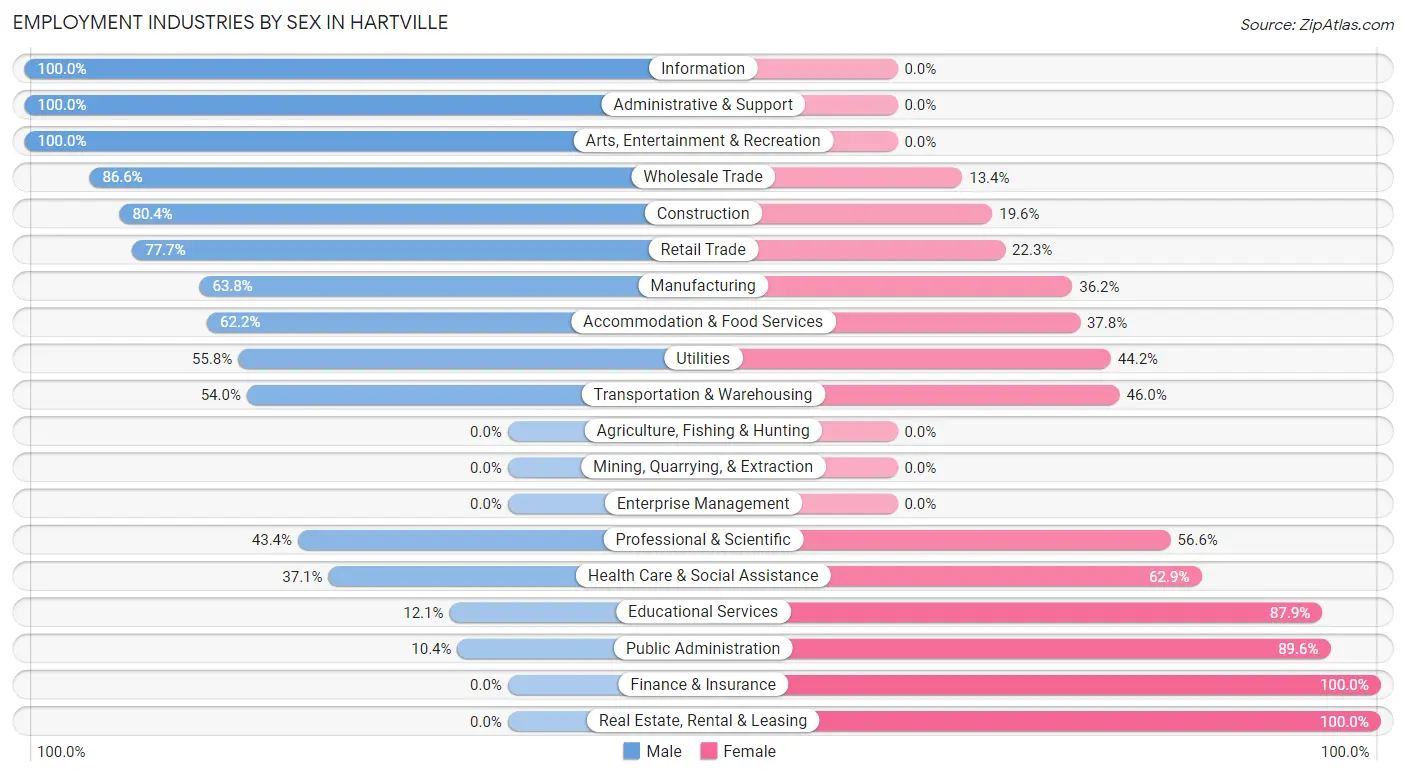
| Industry | Male | Female |
| Agriculture, Fishing & Hunting | 0 (0.0%) | 0 (0.0%) |
| Mining, Quarrying, & Extraction | 0 (0.0%) | 0 (0.0%) |
| Construction | 45 (80.4%) | 11 (19.6%) |
| Manufacturing | 141 (63.8%) | 80 (36.2%) |
| Wholesale Trade | 58 (86.6%) | 9 (13.4%) |
| Retail Trade | 108 (77.7%) | 31 (22.3%) |
| Transportation & Warehousing | 47 (54.0%) | 40 (46.0%) |
| Utilities | 24 (55.8%) | 19 (44.2%) |
| Information | 55 (100.0%) | 0 (0.0%) |
| Finance & Insurance | 0 (0.0%) | 33 (100.0%) |
| Real Estate, Rental & Leasing | 0 (0.0%) | 36 (100.0%) |
| Professional & Scientific | 53 (43.4%) | 69 (56.6%) |
| Enterprise Management | 0 (0.0%) | 0 (0.0%) |
| Administrative & Support | 54 (100.0%) | 0 (0.0%) |
| Educational Services | 11 (12.1%) | 80 (87.9%) |
| Health Care & Social Assistance | 111 (37.1%) | 188 (62.9%) |
| Arts, Entertainment & Recreation | 13 (100.0%) | 0 (0.0%) |
| Accommodation & Food Services | 107 (62.2%) | 65 (37.8%) |
| Public Administration | 10 (10.4%) | 86 (89.6%) |
| Total | 894 (53.8%) | 768 (46.2%) |
Education in Hartville
School Enrollment in Hartville
The most common levels of schooling among the 696 students in Hartville are middle school (240 | 34.5%), elementary school (183 | 26.3%), and college / undergraduate (113 | 16.2%).
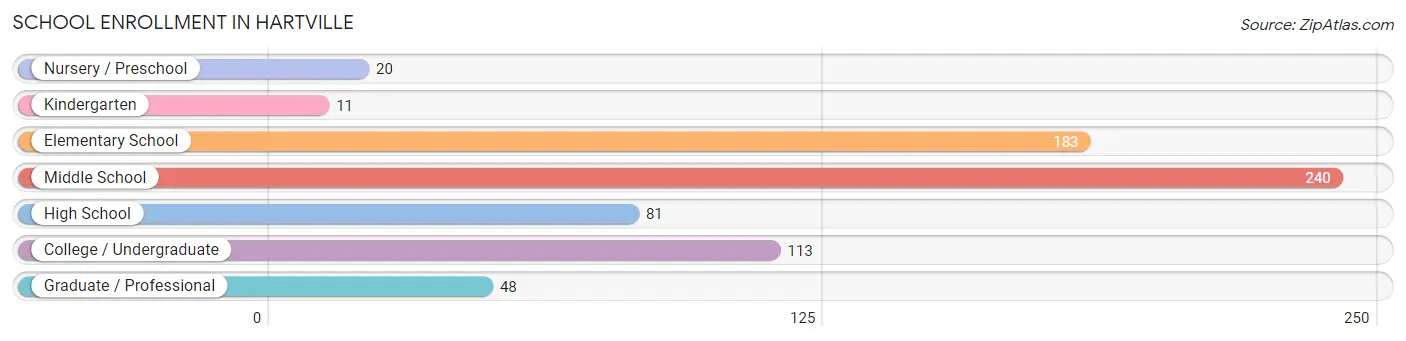
| School Level | # Students | % Students |
| Nursery / Preschool | 20 | 2.9% |
| Kindergarten | 11 | 1.6% |
| Elementary School | 183 | 26.3% |
| Middle School | 240 | 34.5% |
| High School | 81 | 11.6% |
| College / Undergraduate | 113 | 16.2% |
| Graduate / Professional | 48 | 6.9% |
| Total | 696 | 100.0% |
School Enrollment by Age by Funding Source in Hartville
Out of a total of 696 students who are enrolled in schools in Hartville, 67 (9.6%) attend a private institution, while the remaining 629 (90.4%) are enrolled in public schools. The age group of 35 years and over has the highest likelihood of being enrolled in private schools, with 24 (100.0% in the age bracket) enrolled. Conversely, the age group of 3 to 4 year olds has the lowest likelihood of being enrolled in a private school, with 14 (100.0% in the age bracket) attending a public institution.
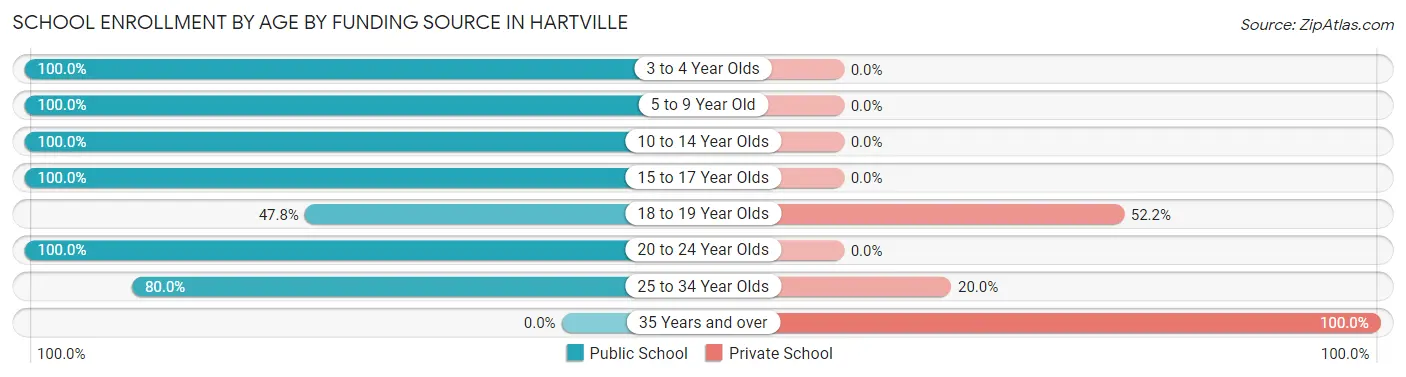
| Age Bracket | Public School | Private School |
| 3 to 4 Year Olds | 14 (100.0%) | 0 (0.0%) |
| 5 to 9 Year Old | 189 (100.0%) | 0 (0.0%) |
| 10 to 14 Year Olds | 191 (100.0%) | 0 (0.0%) |
| 15 to 17 Year Olds | 108 (100.0%) | 0 (0.0%) |
| 18 to 19 Year Olds | 33 (47.8%) | 36 (52.2%) |
| 20 to 24 Year Olds | 66 (100.0%) | 0 (0.0%) |
| 25 to 34 Year Olds | 28 (80.0%) | 7 (20.0%) |
| 35 Years and over | 0 (0.0%) | 24 (100.0%) |
| Total | 629 (90.4%) | 67 (9.6%) |
Educational Attainment by Field of Study in Hartville
Education (204 | 20.9%), business (177 | 18.2%), science & technology (130 | 13.4%), computers & mathematics (122 | 12.5%), and social sciences (97 | 10.0%) are the most common fields of study among 974 individuals in Hartville who have obtained a bachelor's degree or higher.
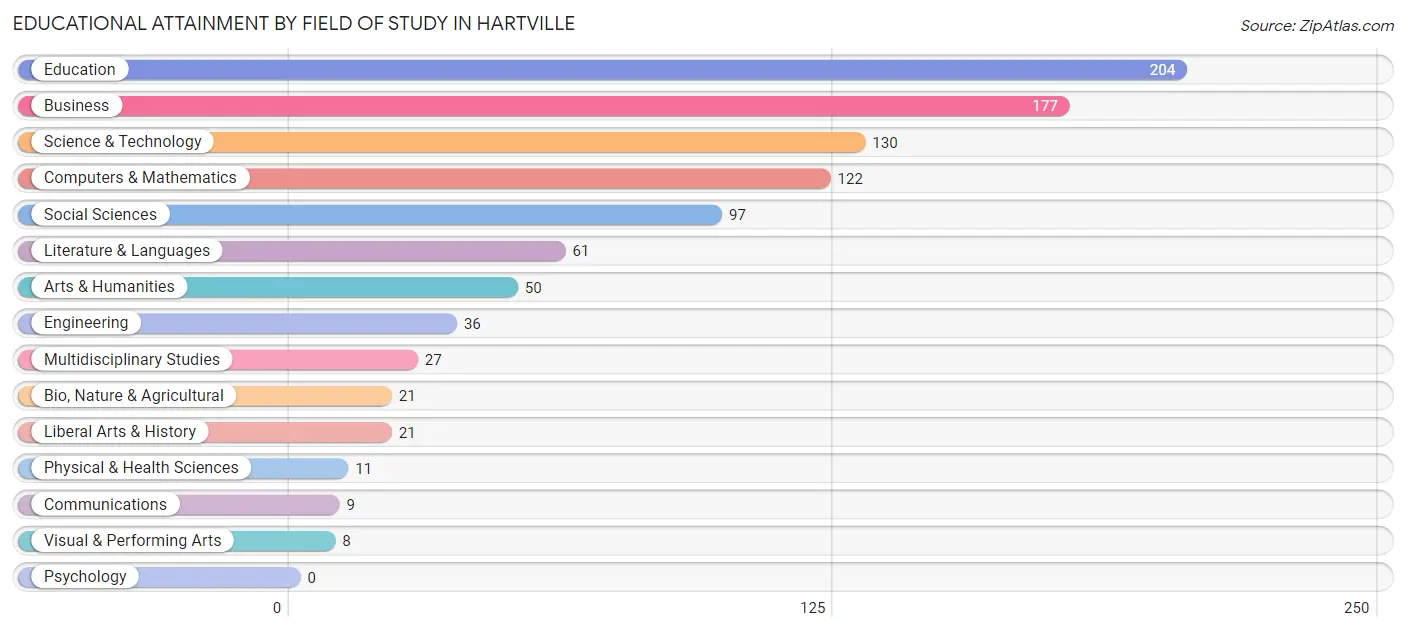
| Field of Study | # Graduates | % Graduates |
| Computers & Mathematics | 122 | 12.5% |
| Bio, Nature & Agricultural | 21 | 2.2% |
| Physical & Health Sciences | 11 | 1.1% |
| Psychology | 0 | 0.0% |
| Social Sciences | 97 | 10.0% |
| Engineering | 36 | 3.7% |
| Multidisciplinary Studies | 27 | 2.8% |
| Science & Technology | 130 | 13.4% |
| Business | 177 | 18.2% |
| Education | 204 | 20.9% |
| Literature & Languages | 61 | 6.3% |
| Liberal Arts & History | 21 | 2.2% |
| Visual & Performing Arts | 8 | 0.8% |
| Communications | 9 | 0.9% |
| Arts & Humanities | 50 | 5.1% |
| Total | 974 | 100.0% |
Transportation & Commute in Hartville
Vehicle Availability by Sex in Hartville
The most prevalent vehicle ownership categories in Hartville are males with 3 vehicles (242, accounting for 27.1%) and females with 3 vehicles (136, making up 31.5%).
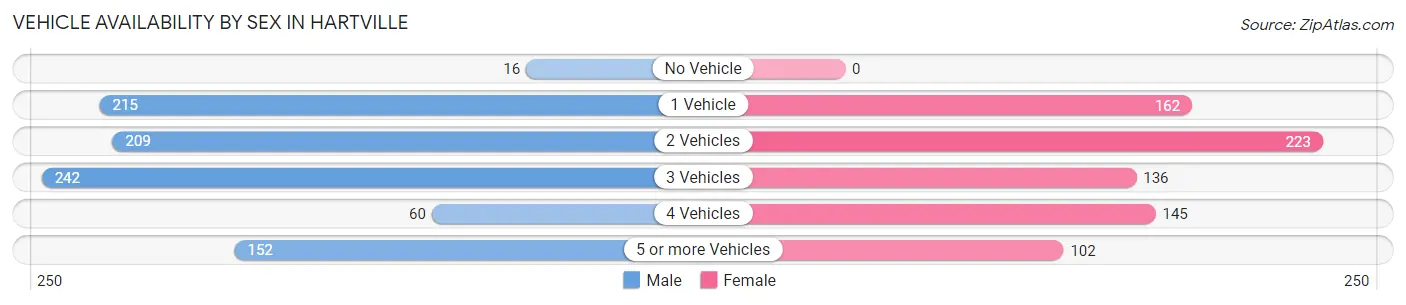
| Vehicles Available | Male | Female |
| No Vehicle | 16 (1.8%) | 0 (0.0%) |
| 1 Vehicle | 215 (24.0%) | 162 (21.1%) |
| 2 Vehicles | 209 (23.4%) | 223 (29.0%) |
| 3 Vehicles | 242 (27.1%) | 136 (17.7%) |
| 4 Vehicles | 60 (6.7%) | 145 (18.9%) |
| 5 or more Vehicles | 152 (17.0%) | 102 (13.3%) |
| Total | 894 (100.0%) | 768 (100.0%) |
Commute Time in Hartville
The most frequently occuring commute durations in Hartville are 20 to 24 minutes (206 commuters, 13.7%), 30 to 34 minutes (188 commuters, 12.5%), and 45 to 59 minutes (172 commuters, 11.5%).
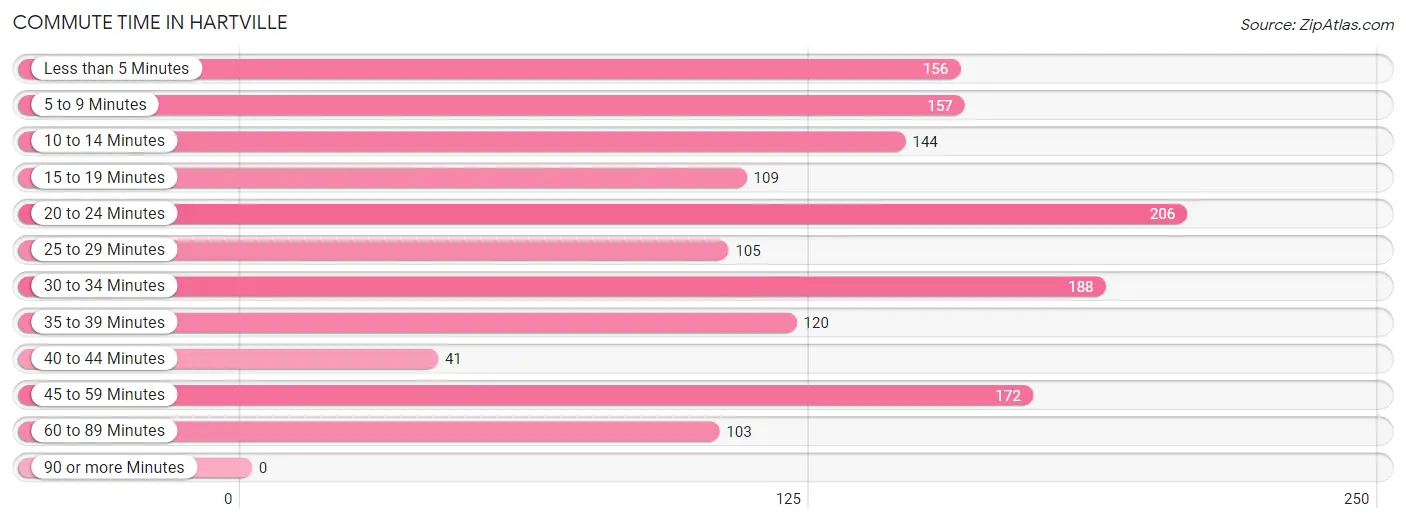
| Commute Time | # Commuters | % Commuters |
| Less than 5 Minutes | 156 | 10.4% |
| 5 to 9 Minutes | 157 | 10.5% |
| 10 to 14 Minutes | 144 | 9.6% |
| 15 to 19 Minutes | 109 | 7.3% |
| 20 to 24 Minutes | 206 | 13.7% |
| 25 to 29 Minutes | 105 | 7.0% |
| 30 to 34 Minutes | 188 | 12.5% |
| 35 to 39 Minutes | 120 | 8.0% |
| 40 to 44 Minutes | 41 | 2.7% |
| 45 to 59 Minutes | 172 | 11.5% |
| 60 to 89 Minutes | 103 | 6.9% |
| 90 or more Minutes | 0 | 0.0% |
Commute Time by Sex in Hartville
The most common commute times in Hartville are 20 to 24 minutes (150 commuters, 17.4%) for males and less than 5 minutes (90 commuters, 14.0%) for females.
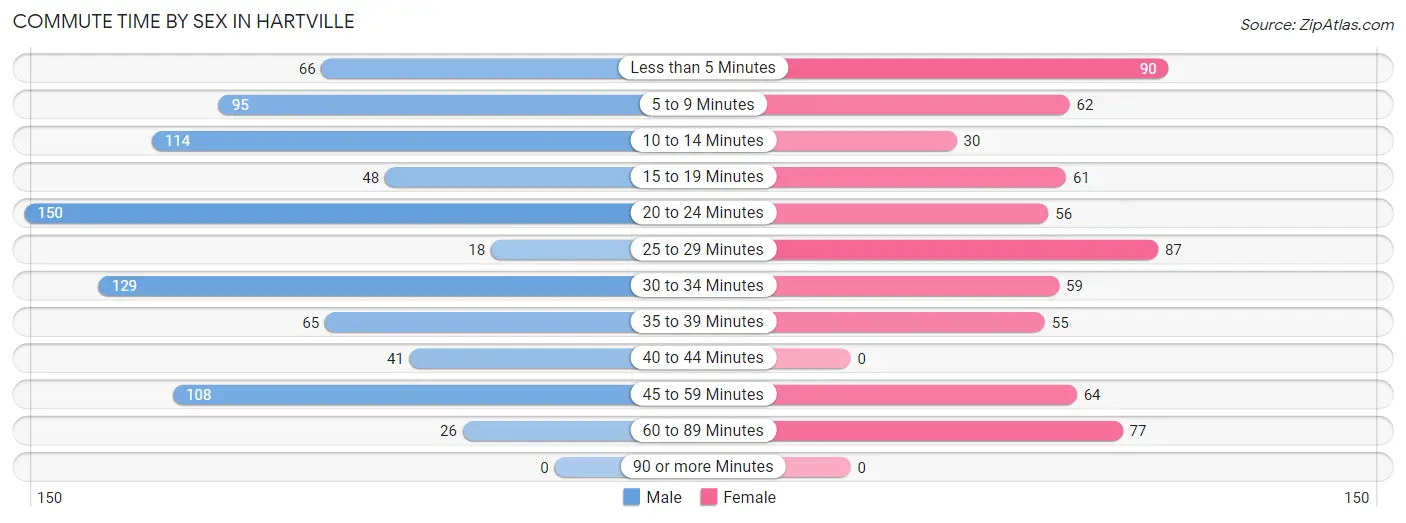
| Commute Time | Male | Female |
| Less than 5 Minutes | 66 (7.7%) | 90 (14.0%) |
| 5 to 9 Minutes | 95 (11.1%) | 62 (9.7%) |
| 10 to 14 Minutes | 114 (13.3%) | 30 (4.7%) |
| 15 to 19 Minutes | 48 (5.6%) | 61 (9.5%) |
| 20 to 24 Minutes | 150 (17.4%) | 56 (8.7%) |
| 25 to 29 Minutes | 18 (2.1%) | 87 (13.6%) |
| 30 to 34 Minutes | 129 (15.0%) | 59 (9.2%) |
| 35 to 39 Minutes | 65 (7.6%) | 55 (8.6%) |
| 40 to 44 Minutes | 41 (4.8%) | 0 (0.0%) |
| 45 to 59 Minutes | 108 (12.6%) | 64 (10.0%) |
| 60 to 89 Minutes | 26 (3.0%) | 77 (12.0%) |
| 90 or more Minutes | 0 (0.0%) | 0 (0.0%) |
Time of Departure to Work by Sex in Hartville
The most frequent times of departure to work in Hartville are 7:00 AM to 7:29 AM (161, 18.7%) for males and 7:00 AM to 7:29 AM (146, 22.8%) for females.
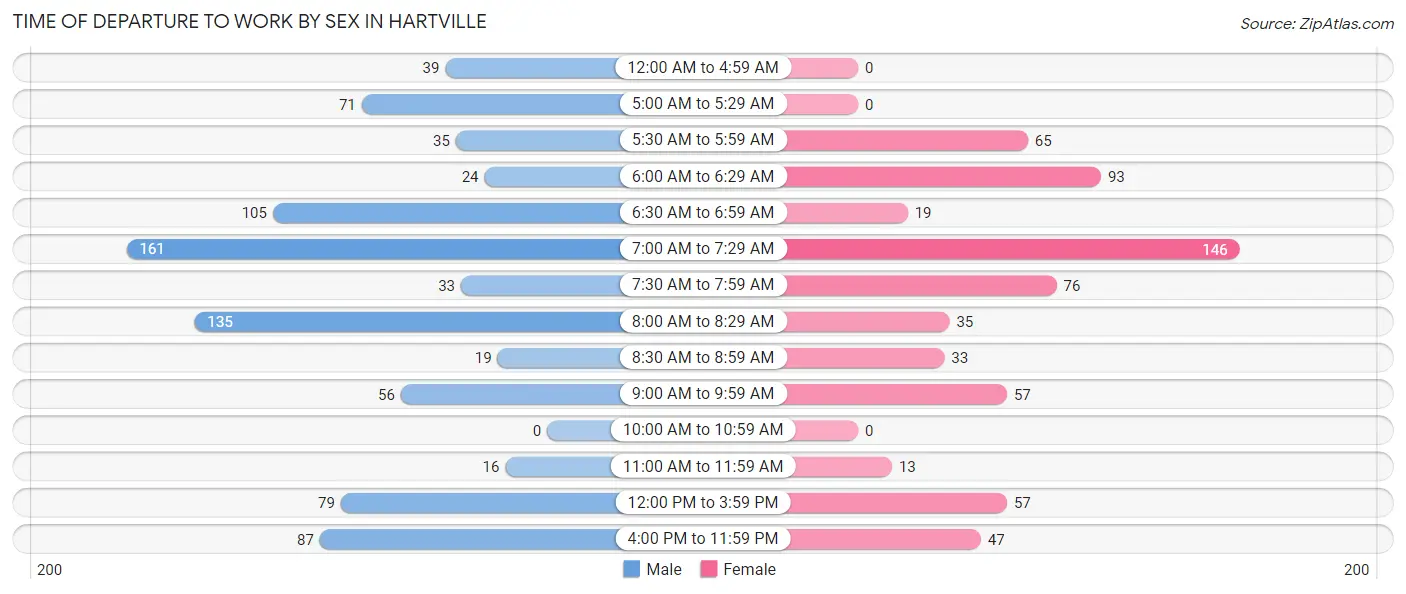
| Time of Departure | Male | Female |
| 12:00 AM to 4:59 AM | 39 (4.5%) | 0 (0.0%) |
| 5:00 AM to 5:29 AM | 71 (8.3%) | 0 (0.0%) |
| 5:30 AM to 5:59 AM | 35 (4.1%) | 65 (10.1%) |
| 6:00 AM to 6:29 AM | 24 (2.8%) | 93 (14.5%) |
| 6:30 AM to 6:59 AM | 105 (12.2%) | 19 (3.0%) |
| 7:00 AM to 7:29 AM | 161 (18.7%) | 146 (22.8%) |
| 7:30 AM to 7:59 AM | 33 (3.8%) | 76 (11.9%) |
| 8:00 AM to 8:29 AM | 135 (15.7%) | 35 (5.5%) |
| 8:30 AM to 8:59 AM | 19 (2.2%) | 33 (5.1%) |
| 9:00 AM to 9:59 AM | 56 (6.5%) | 57 (8.9%) |
| 10:00 AM to 10:59 AM | 0 (0.0%) | 0 (0.0%) |
| 11:00 AM to 11:59 AM | 16 (1.9%) | 13 (2.0%) |
| 12:00 PM to 3:59 PM | 79 (9.2%) | 57 (8.9%) |
| 4:00 PM to 11:59 PM | 87 (10.1%) | 47 (7.3%) |
| Total | 860 (100.0%) | 641 (100.0%) |
Housing Occupancy in Hartville
Occupancy by Ownership in Hartville
Of the total 1,493 dwellings in Hartville, owner-occupied units account for 993 (66.5%), while renter-occupied units make up 500 (33.5%).
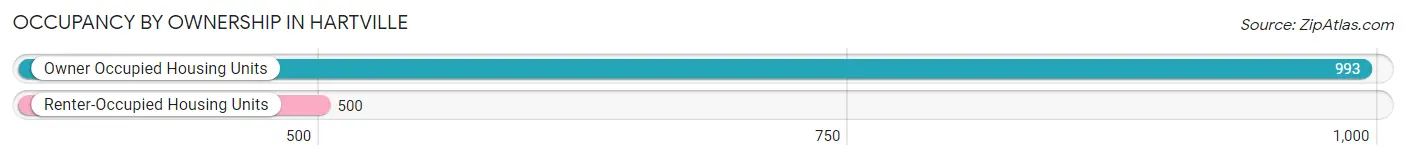
| Occupancy | # Housing Units | % Housing Units |
| Owner Occupied Housing Units | 993 | 66.5% |
| Renter-Occupied Housing Units | 500 | 33.5% |
| Total Occupied Housing Units | 1,493 | 100.0% |
Occupancy by Household Size in Hartville
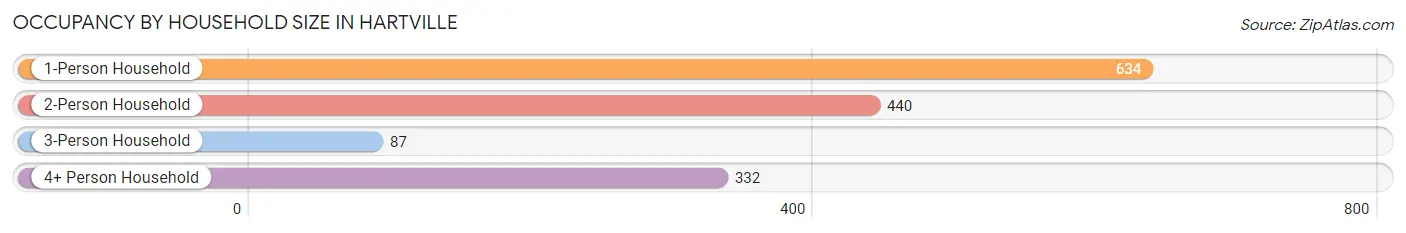
| Household Size | # Housing Units | % Housing Units |
| 1-Person Household | 634 | 42.5% |
| 2-Person Household | 440 | 29.5% |
| 3-Person Household | 87 | 5.8% |
| 4+ Person Household | 332 | 22.2% |
| Total Housing Units | 1,493 | 100.0% |
Occupancy by Ownership by Household Size in Hartville
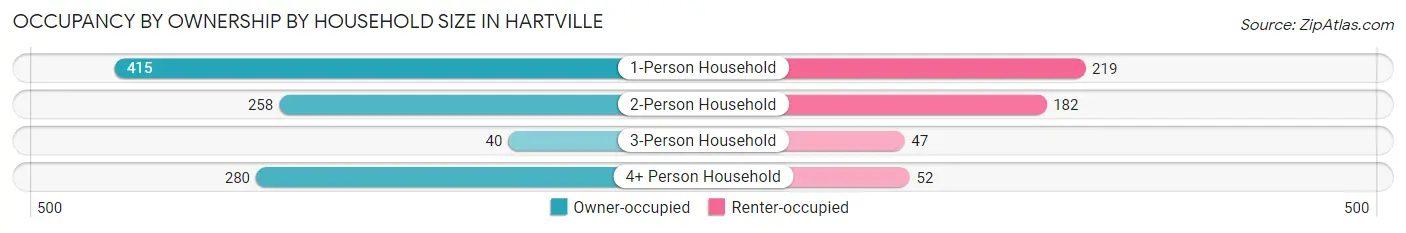
| Household Size | Owner-occupied | Renter-occupied |
| 1-Person Household | 415 (65.5%) | 219 (34.5%) |
| 2-Person Household | 258 (58.6%) | 182 (41.4%) |
| 3-Person Household | 40 (46.0%) | 47 (54.0%) |
| 4+ Person Household | 280 (84.3%) | 52 (15.7%) |
| Total Housing Units | 993 (66.5%) | 500 (33.5%) |
Occupancy by Educational Attainment in Hartville
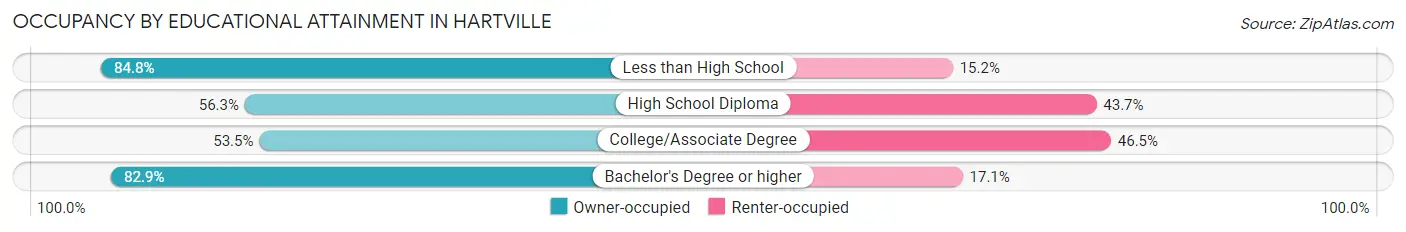
| Household Size | Owner-occupied | Renter-occupied |
| Less than High School | 95 (84.8%) | 17 (15.2%) |
| High School Diploma | 271 (56.3%) | 210 (43.7%) |
| College/Associate Degree | 216 (53.5%) | 188 (46.5%) |
| Bachelor's Degree or higher | 411 (82.9%) | 85 (17.1%) |
Occupancy by Age of Householder in Hartville
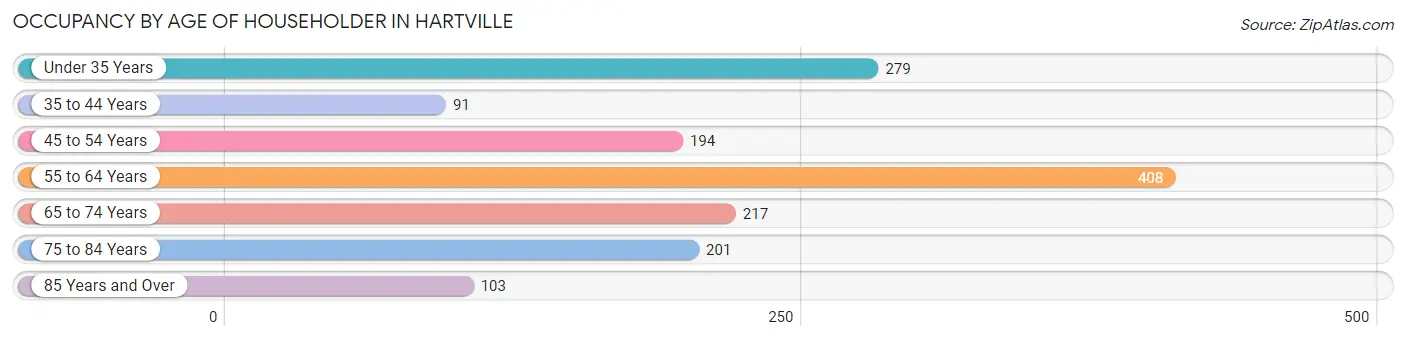
| Age Bracket | # Households | % Households |
| Under 35 Years | 279 | 18.7% |
| 35 to 44 Years | 91 | 6.1% |
| 45 to 54 Years | 194 | 13.0% |
| 55 to 64 Years | 408 | 27.3% |
| 65 to 74 Years | 217 | 14.5% |
| 75 to 84 Years | 201 | 13.5% |
| 85 Years and Over | 103 | 6.9% |
| Total | 1,493 | 100.0% |
Housing Finances in Hartville
Median Income by Occupancy in Hartville
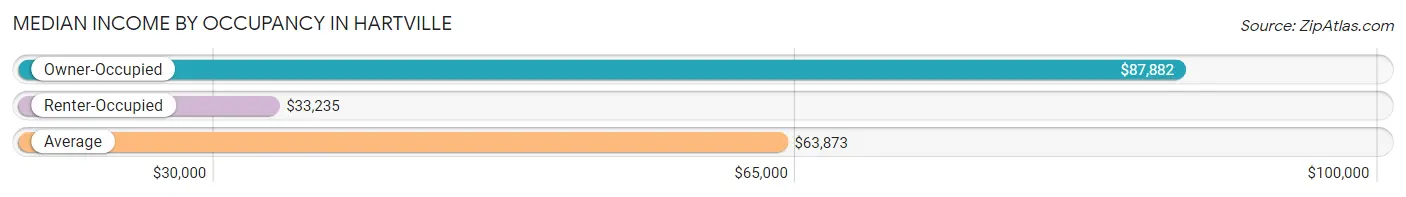
| Occupancy Type | # Households | Median Income |
| Owner-Occupied | 993 (66.5%) | $87,882 |
| Renter-Occupied | 500 (33.5%) | $33,235 |
| Average | 1,493 (100.0%) | $63,873 |
Occupancy by Householder Income Bracket in Hartville
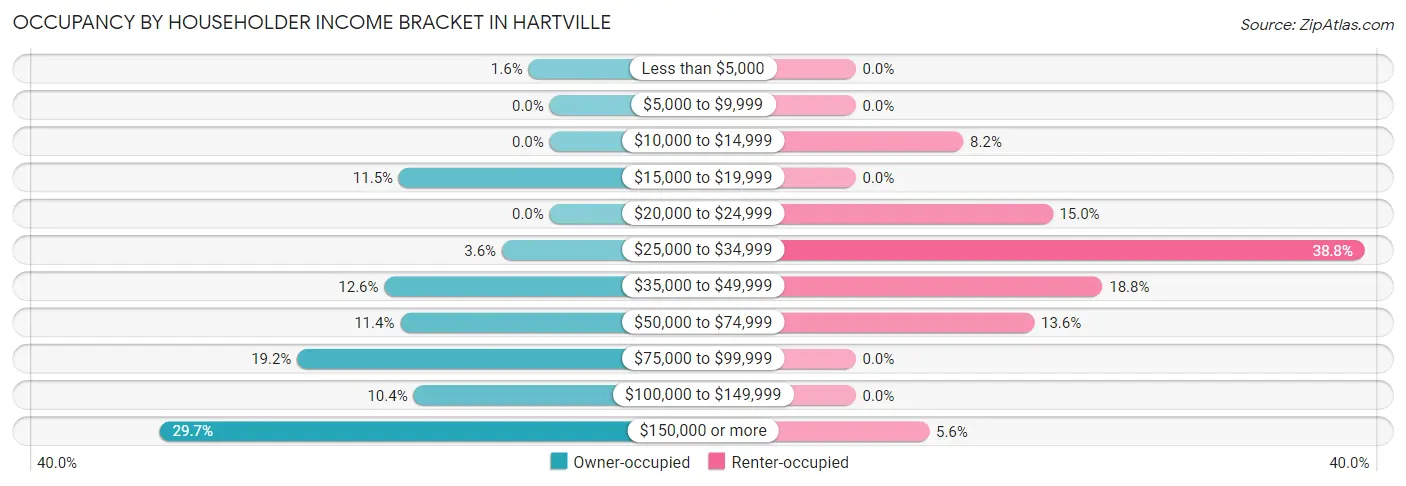
| Income Bracket | Owner-occupied | Renter-occupied |
| Less than $5,000 | 16 (1.6%) | 0 (0.0%) |
| $5,000 to $9,999 | 0 (0.0%) | 0 (0.0%) |
| $10,000 to $14,999 | 0 (0.0%) | 41 (8.2%) |
| $15,000 to $19,999 | 114 (11.5%) | 0 (0.0%) |
| $20,000 to $24,999 | 0 (0.0%) | 75 (15.0%) |
| $25,000 to $34,999 | 36 (3.6%) | 194 (38.8%) |
| $35,000 to $49,999 | 125 (12.6%) | 94 (18.8%) |
| $50,000 to $74,999 | 113 (11.4%) | 68 (13.6%) |
| $75,000 to $99,999 | 191 (19.2%) | 0 (0.0%) |
| $100,000 to $149,999 | 103 (10.4%) | 0 (0.0%) |
| $150,000 or more | 295 (29.7%) | 28 (5.6%) |
| Total | 993 (100.0%) | 500 (100.0%) |
Monthly Housing Cost Tiers in Hartville
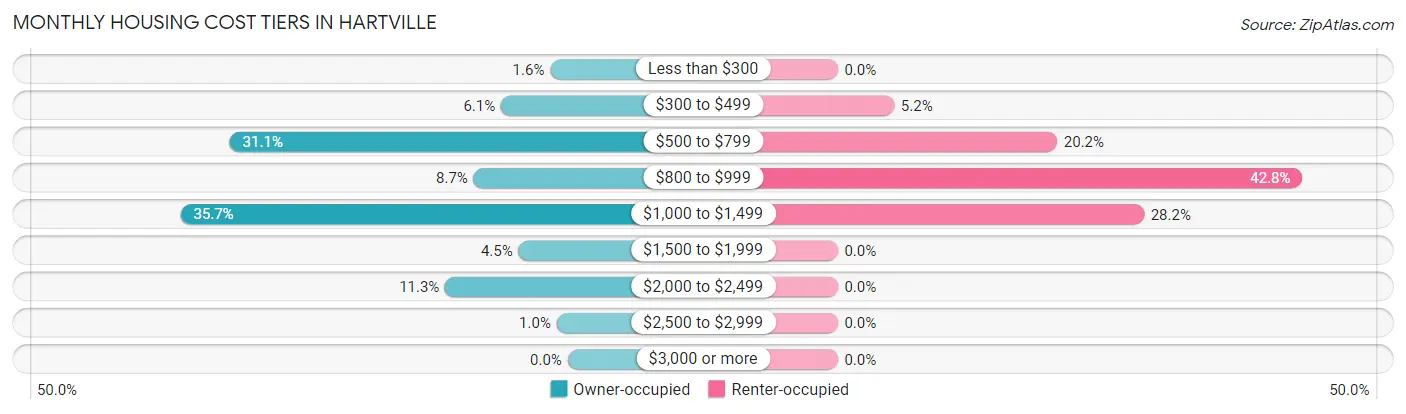
| Monthly Cost | Owner-occupied | Renter-occupied |
| Less than $300 | 16 (1.6%) | 0 (0.0%) |
| $300 to $499 | 61 (6.1%) | 26 (5.2%) |
| $500 to $799 | 309 (31.1%) | 101 (20.2%) |
| $800 to $999 | 86 (8.7%) | 214 (42.8%) |
| $1,000 to $1,499 | 354 (35.6%) | 141 (28.2%) |
| $1,500 to $1,999 | 45 (4.5%) | 0 (0.0%) |
| $2,000 to $2,499 | 112 (11.3%) | 0 (0.0%) |
| $2,500 to $2,999 | 10 (1.0%) | 0 (0.0%) |
| $3,000 or more | 0 (0.0%) | 0 (0.0%) |
| Total | 993 (100.0%) | 500 (100.0%) |
Physical Housing Characteristics in Hartville
Housing Structures in Hartville
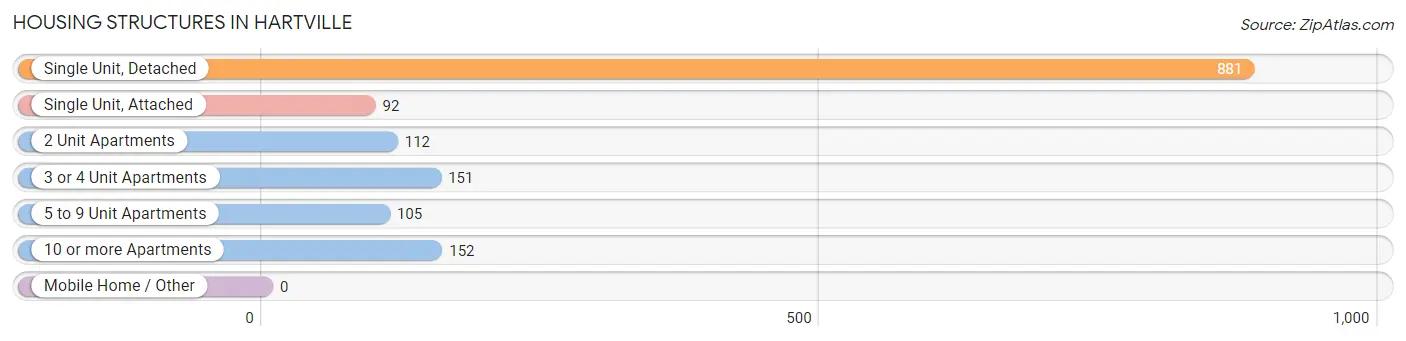
| Structure Type | # Housing Units | % Housing Units |
| Single Unit, Detached | 881 | 59.0% |
| Single Unit, Attached | 92 | 6.2% |
| 2 Unit Apartments | 112 | 7.5% |
| 3 or 4 Unit Apartments | 151 | 10.1% |
| 5 to 9 Unit Apartments | 105 | 7.0% |
| 10 or more Apartments | 152 | 10.2% |
| Mobile Home / Other | 0 | 0.0% |
| Total | 1,493 | 100.0% |
Housing Structures by Occupancy in Hartville
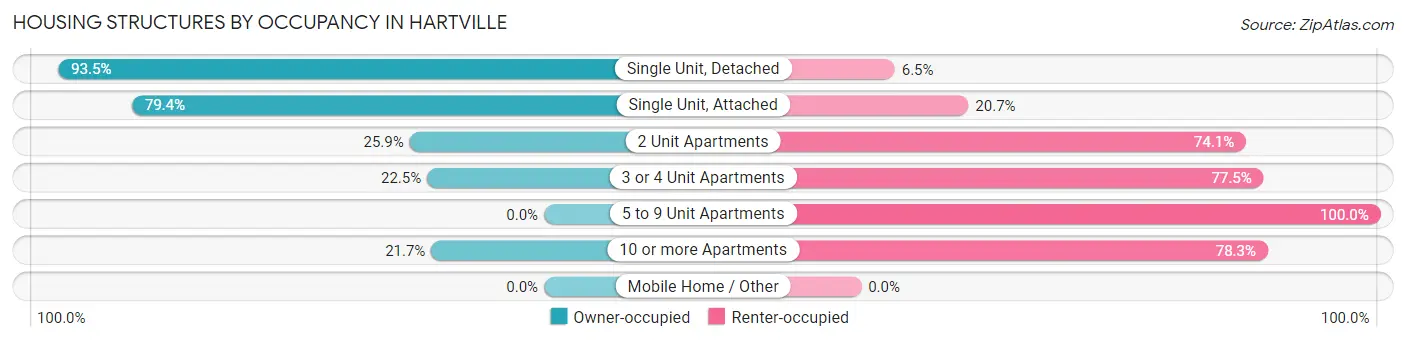
| Structure Type | Owner-occupied | Renter-occupied |
| Single Unit, Detached | 824 (93.5%) | 57 (6.5%) |
| Single Unit, Attached | 73 (79.3%) | 19 (20.6%) |
| 2 Unit Apartments | 29 (25.9%) | 83 (74.1%) |
| 3 or 4 Unit Apartments | 34 (22.5%) | 117 (77.5%) |
| 5 to 9 Unit Apartments | 0 (0.0%) | 105 (100.0%) |
| 10 or more Apartments | 33 (21.7%) | 119 (78.3%) |
| Mobile Home / Other | 0 (0.0%) | 0 (0.0%) |
| Total | 993 (66.5%) | 500 (33.5%) |
Housing Structures by Number of Rooms in Hartville
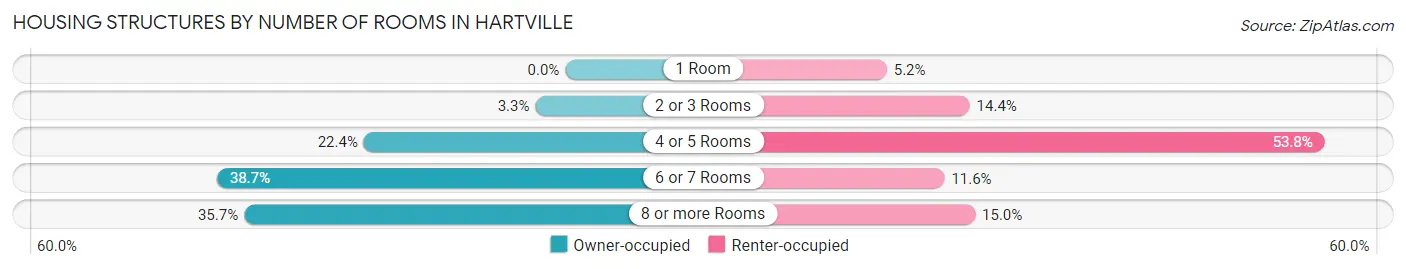
| Number of Rooms | Owner-occupied | Renter-occupied |
| 1 Room | 0 (0.0%) | 26 (5.2%) |
| 2 or 3 Rooms | 33 (3.3%) | 72 (14.4%) |
| 4 or 5 Rooms | 222 (22.4%) | 269 (53.8%) |
| 6 or 7 Rooms | 384 (38.7%) | 58 (11.6%) |
| 8 or more Rooms | 354 (35.6%) | 75 (15.0%) |
| Total | 993 (100.0%) | 500 (100.0%) |
Housing Structure by Heating Type in Hartville
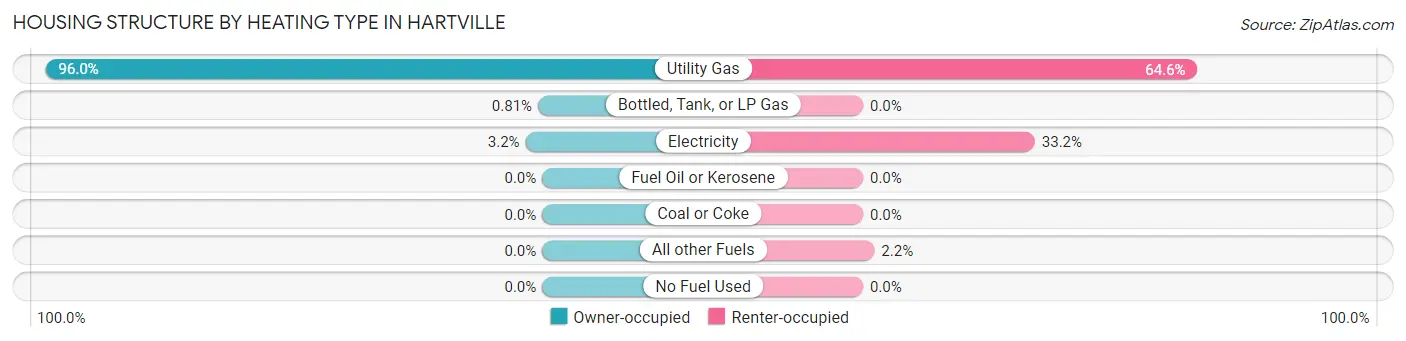
| Heating Type | Owner-occupied | Renter-occupied |
| Utility Gas | 953 (96.0%) | 323 (64.6%) |
| Bottled, Tank, or LP Gas | 8 (0.8%) | 0 (0.0%) |
| Electricity | 32 (3.2%) | 166 (33.2%) |
| Fuel Oil or Kerosene | 0 (0.0%) | 0 (0.0%) |
| Coal or Coke | 0 (0.0%) | 0 (0.0%) |
| All other Fuels | 0 (0.0%) | 11 (2.2%) |
| No Fuel Used | 0 (0.0%) | 0 (0.0%) |
| Total | 993 (100.0%) | 500 (100.0%) |
Household Vehicle Usage in Hartville
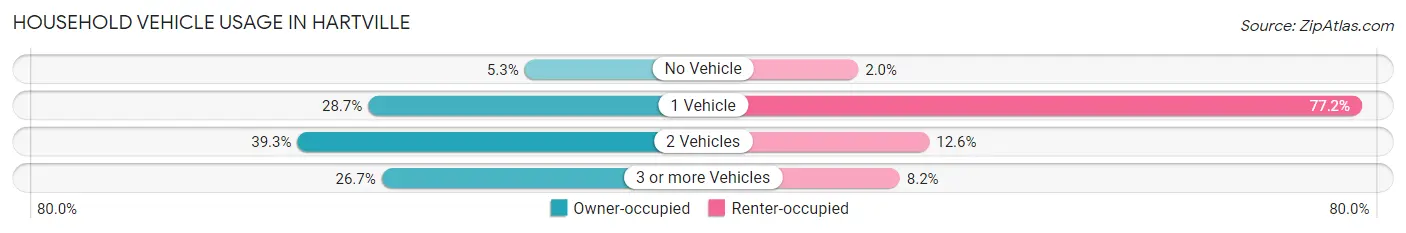
| Vehicles per Household | Owner-occupied | Renter-occupied |
| No Vehicle | 53 (5.3%) | 10 (2.0%) |
| 1 Vehicle | 285 (28.7%) | 386 (77.2%) |
| 2 Vehicles | 390 (39.3%) | 63 (12.6%) |
| 3 or more Vehicles | 265 (26.7%) | 41 (8.2%) |
| Total | 993 (100.0%) | 500 (100.0%) |
Real Estate & Mortgages in Hartville
Real Estate and Mortgage Overview in Hartville
| Characteristic | Without Mortgage | With Mortgage |
| Housing Units | 453 | 540 |
| Median Property Value | $197,900 | $247,000 |
| Median Household Income | $81,454 | $214 |
| Monthly Housing Costs | $622 | $0 |
| Real Estate Taxes | $2,787 | $0 |
Property Value by Mortgage Status in Hartville
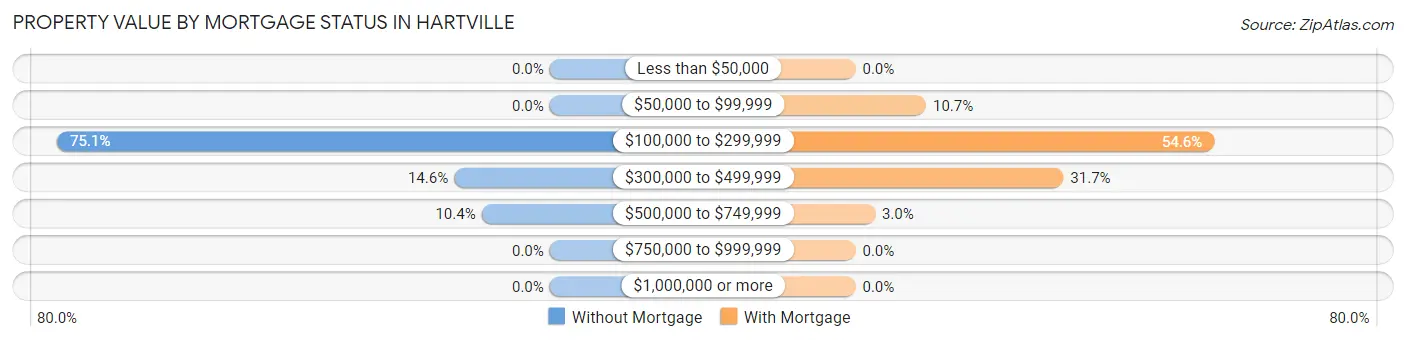
| Property Value | Without Mortgage | With Mortgage |
| Less than $50,000 | 0 (0.0%) | 0 (0.0%) |
| $50,000 to $99,999 | 0 (0.0%) | 58 (10.7%) |
| $100,000 to $299,999 | 340 (75.1%) | 295 (54.6%) |
| $300,000 to $499,999 | 66 (14.6%) | 171 (31.7%) |
| $500,000 to $749,999 | 47 (10.4%) | 16 (3.0%) |
| $750,000 to $999,999 | 0 (0.0%) | 0 (0.0%) |
| $1,000,000 or more | 0 (0.0%) | 0 (0.0%) |
| Total | 453 (100.0%) | 540 (100.0%) |
Household Income by Mortgage Status in Hartville
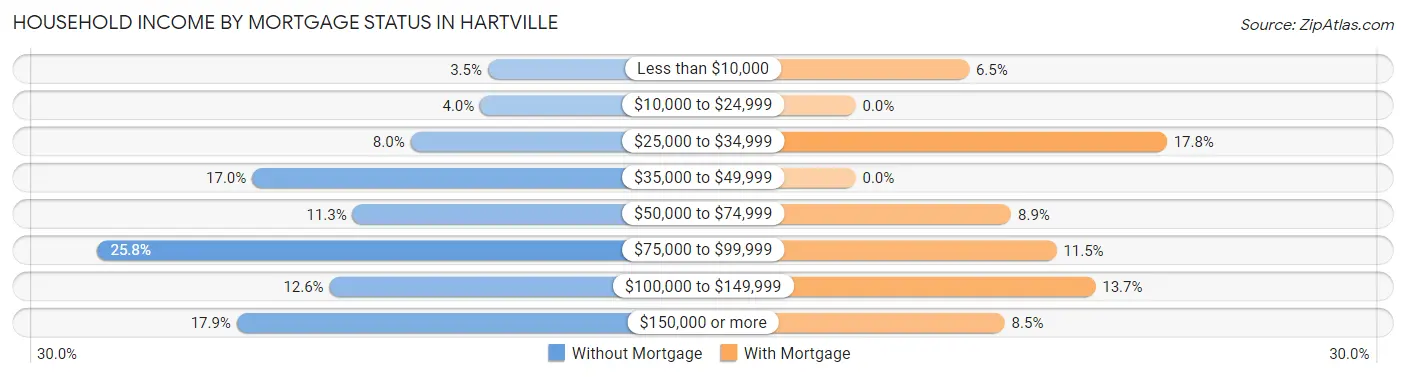
| Household Income | Without Mortgage | With Mortgage |
| Less than $10,000 | 16 (3.5%) | 35 (6.5%) |
| $10,000 to $24,999 | 18 (4.0%) | 0 (0.0%) |
| $25,000 to $34,999 | 36 (8.0%) | 96 (17.8%) |
| $35,000 to $49,999 | 77 (17.0%) | 0 (0.0%) |
| $50,000 to $74,999 | 51 (11.3%) | 48 (8.9%) |
| $75,000 to $99,999 | 117 (25.8%) | 62 (11.5%) |
| $100,000 to $149,999 | 57 (12.6%) | 74 (13.7%) |
| $150,000 or more | 81 (17.9%) | 46 (8.5%) |
| Total | 453 (100.0%) | 540 (100.0%) |
Property Value to Household Income Ratio in Hartville
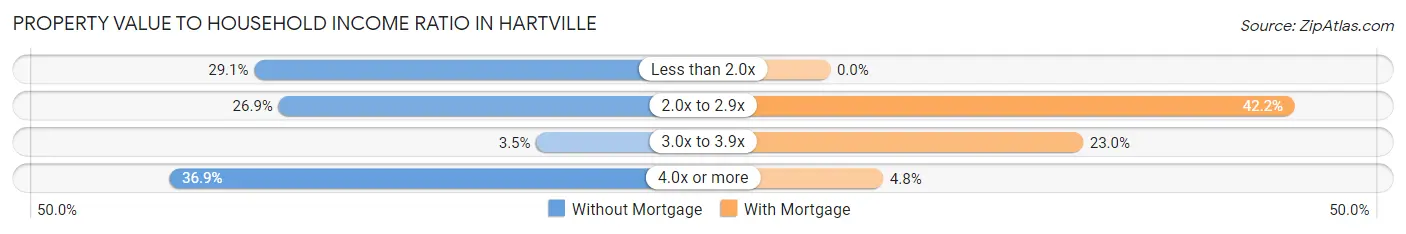
| Value-to-Income Ratio | Without Mortgage | With Mortgage |
| Less than 2.0x | 132 (29.1%) | 0 (0.0%) |
| 2.0x to 2.9x | 122 (26.9%) | 228 (42.2%) |
| 3.0x to 3.9x | 16 (3.5%) | 124 (23.0%) |
| 4.0x or more | 167 (36.9%) | 26 (4.8%) |
| Total | 453 (100.0%) | 540 (100.0%) |
Real Estate Taxes by Mortgage Status in Hartville
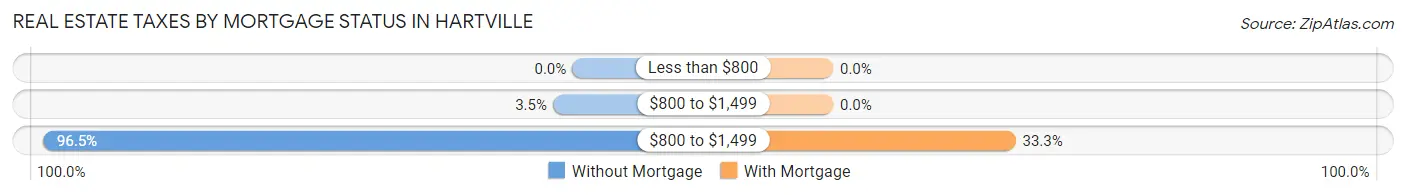
| Property Taxes | Without Mortgage | With Mortgage |
| Less than $800 | 0 (0.0%) | 0 (0.0%) |
| $800 to $1,499 | 16 (3.5%) | 0 (0.0%) |
| $800 to $1,499 | 437 (96.5%) | 180 (33.3%) |
| Total | 453 (100.0%) | 540 (100.0%) |
Health & Disability in Hartville
Health Insurance Coverage by Age in Hartville
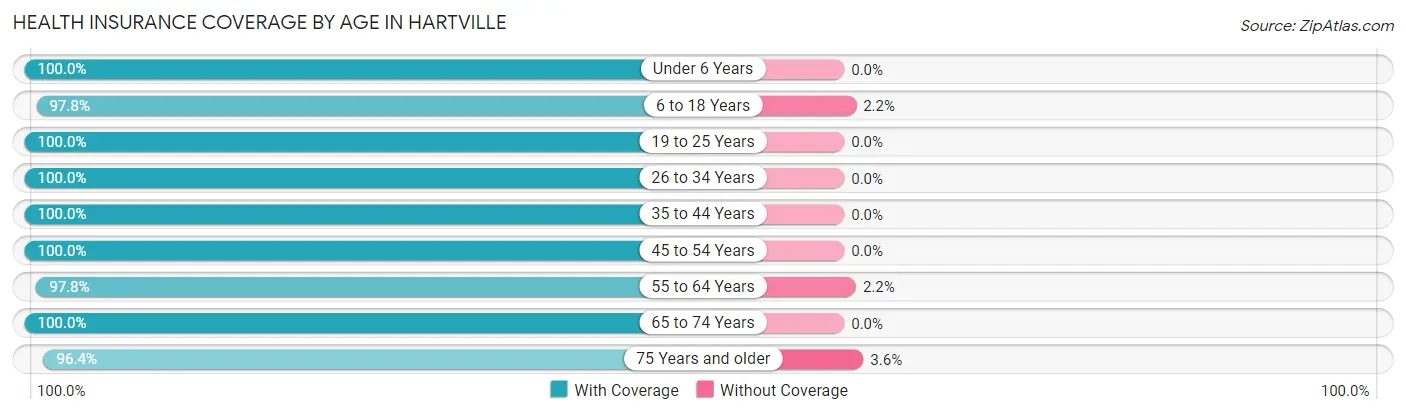
| Age Bracket | With Coverage | Without Coverage |
| Under 6 Years | 96 (100.0%) | 0 (0.0%) |
| 6 to 18 Years | 485 (97.8%) | 11 (2.2%) |
| 19 to 25 Years | 275 (100.0%) | 0 (0.0%) |
| 26 to 34 Years | 427 (100.0%) | 0 (0.0%) |
| 35 to 44 Years | 182 (100.0%) | 0 (0.0%) |
| 45 to 54 Years | 425 (100.0%) | 0 (0.0%) |
| 55 to 64 Years | 626 (97.8%) | 14 (2.2%) |
| 65 to 74 Years | 356 (100.0%) | 0 (0.0%) |
| 75 Years and older | 406 (96.4%) | 15 (3.6%) |
| Total | 3,278 (98.8%) | 40 (1.2%) |
Health Insurance Coverage by Citizenship Status in Hartville
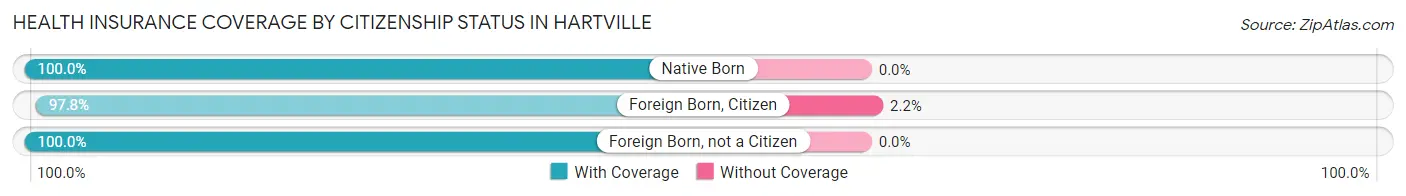
| Citizenship Status | With Coverage | Without Coverage |
| Native Born | 96 (100.0%) | 0 (0.0%) |
| Foreign Born, Citizen | 485 (97.8%) | 11 (2.2%) |
| Foreign Born, not a Citizen | 275 (100.0%) | 0 (0.0%) |
Health Insurance Coverage by Household Income in Hartville
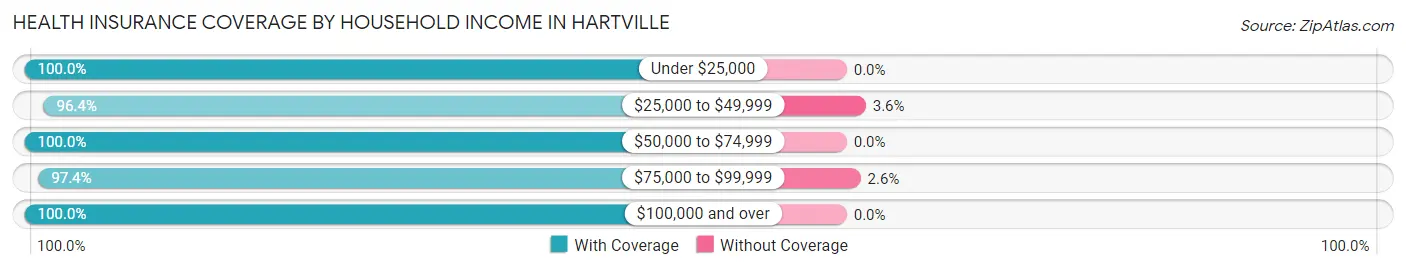
| Household Income | With Coverage | Without Coverage |
| Under $25,000 | 351 (100.0%) | 0 (0.0%) |
| $25,000 to $49,999 | 704 (96.4%) | 26 (3.6%) |
| $50,000 to $74,999 | 286 (100.0%) | 0 (0.0%) |
| $75,000 to $99,999 | 528 (97.4%) | 14 (2.6%) |
| $100,000 and over | 1,391 (100.0%) | 0 (0.0%) |
Public vs Private Health Insurance Coverage by Age in Hartville
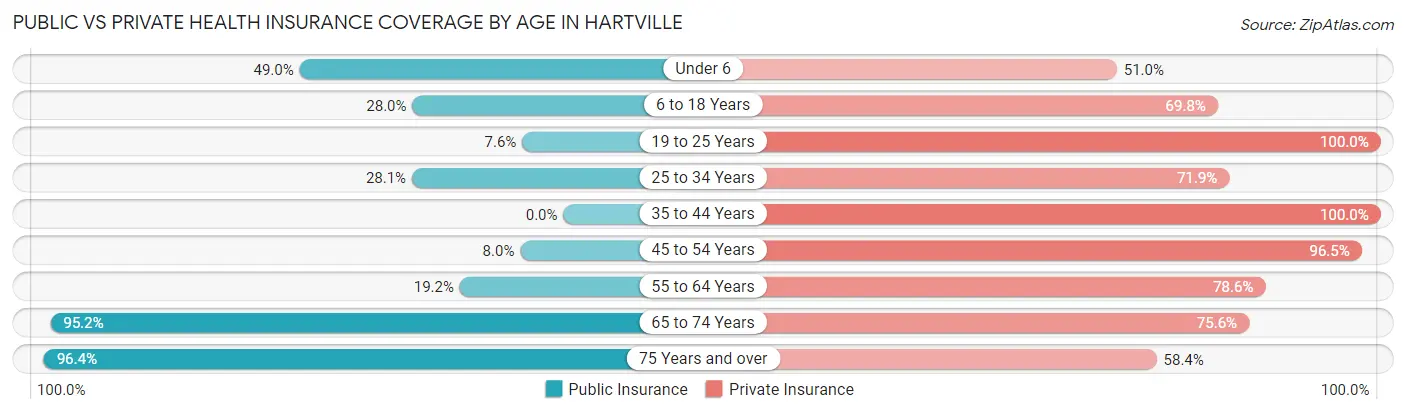
| Age Bracket | Public Insurance | Private Insurance |
| Under 6 | 47 (49.0%) | 49 (51.0%) |
| 6 to 18 Years | 139 (28.0%) | 346 (69.8%) |
| 19 to 25 Years | 21 (7.6%) | 275 (100.0%) |
| 25 to 34 Years | 120 (28.1%) | 307 (71.9%) |
| 35 to 44 Years | 0 (0.0%) | 182 (100.0%) |
| 45 to 54 Years | 34 (8.0%) | 410 (96.5%) |
| 55 to 64 Years | 123 (19.2%) | 503 (78.6%) |
| 65 to 74 Years | 339 (95.2%) | 269 (75.6%) |
| 75 Years and over | 406 (96.4%) | 246 (58.4%) |
| Total | 1,229 (37.0%) | 2,587 (78.0%) |
Disability Status by Sex by Age in Hartville
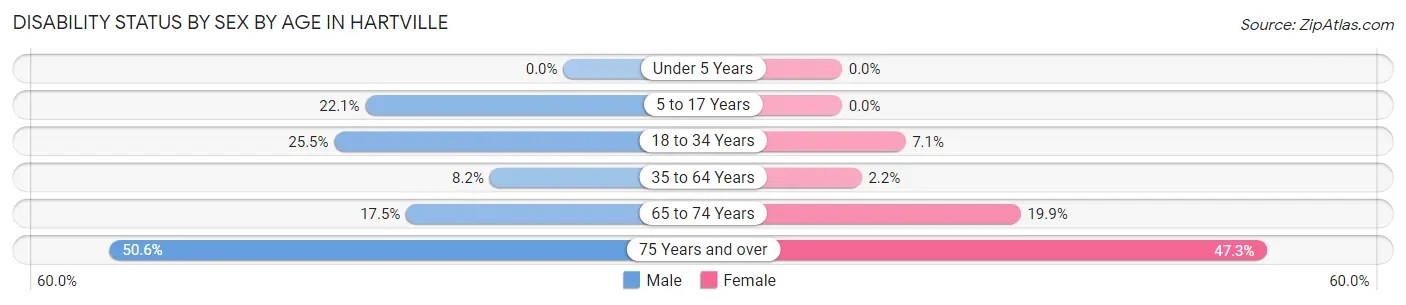
| Age Bracket | Male | Female |
| Under 5 Years | 0 (0.0%) | 0 (0.0%) |
| 5 to 17 Years | 71 (22.1%) | 0 (0.0%) |
| 18 to 34 Years | 114 (25.5%) | 19 (7.1%) |
| 35 to 64 Years | 46 (8.2%) | 15 (2.2%) |
| 65 to 74 Years | 28 (17.5%) | 39 (19.9%) |
| 75 Years and over | 46 (50.5%) | 156 (47.3%) |
Disability Class by Sex by Age in Hartville
Disability Class: Hearing Difficulty
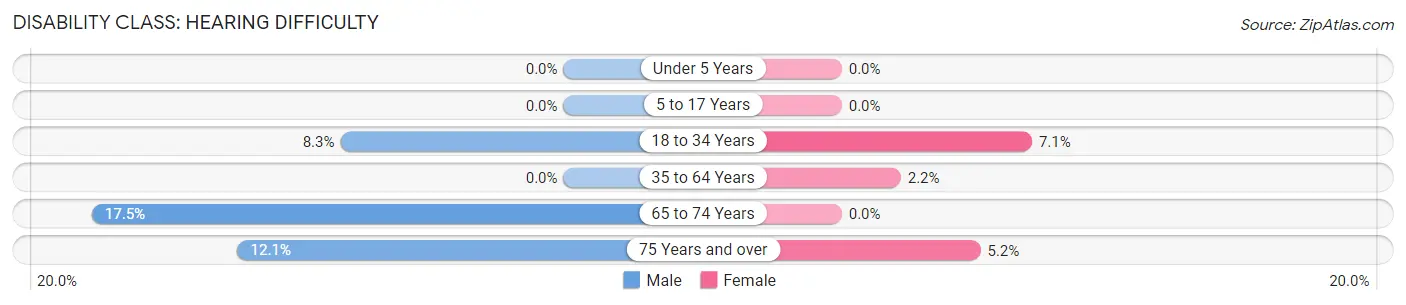
| Age Bracket | Male | Female |
| Under 5 Years | 0 (0.0%) | 0 (0.0%) |
| 5 to 17 Years | 0 (0.0%) | 0 (0.0%) |
| 18 to 34 Years | 37 (8.3%) | 19 (7.1%) |
| 35 to 64 Years | 0 (0.0%) | 15 (2.2%) |
| 65 to 74 Years | 28 (17.5%) | 0 (0.0%) |
| 75 Years and over | 11 (12.1%) | 17 (5.1%) |
Disability Class: Vision Difficulty
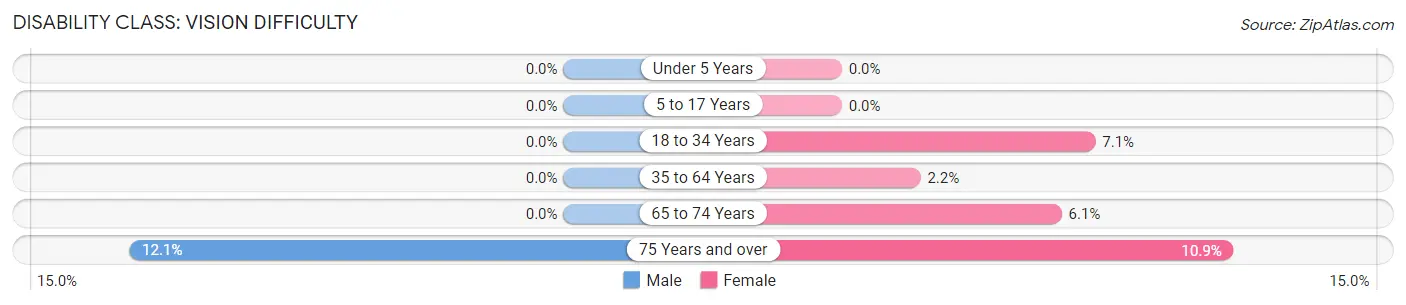
| Age Bracket | Male | Female |
| Under 5 Years | 0 (0.0%) | 0 (0.0%) |
| 5 to 17 Years | 0 (0.0%) | 0 (0.0%) |
| 18 to 34 Years | 0 (0.0%) | 19 (7.1%) |
| 35 to 64 Years | 0 (0.0%) | 15 (2.2%) |
| 65 to 74 Years | 0 (0.0%) | 12 (6.1%) |
| 75 Years and over | 11 (12.1%) | 36 (10.9%) |
Disability Class: Cognitive Difficulty
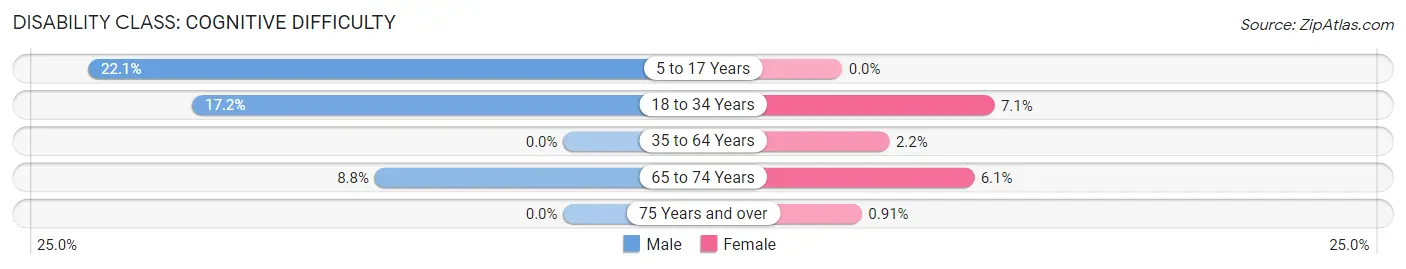
| Age Bracket | Male | Female |
| 5 to 17 Years | 71 (22.1%) | 0 (0.0%) |
| 18 to 34 Years | 77 (17.2%) | 19 (7.1%) |
| 35 to 64 Years | 0 (0.0%) | 15 (2.2%) |
| 65 to 74 Years | 14 (8.7%) | 12 (6.1%) |
| 75 Years and over | 0 (0.0%) | 3 (0.9%) |
Disability Class: Ambulatory Difficulty
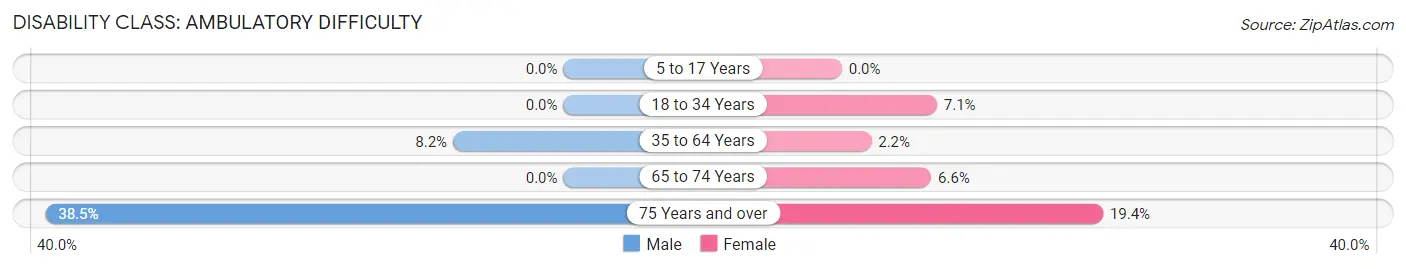
| Age Bracket | Male | Female |
| 5 to 17 Years | 0 (0.0%) | 0 (0.0%) |
| 18 to 34 Years | 0 (0.0%) | 19 (7.1%) |
| 35 to 64 Years | 46 (8.2%) | 15 (2.2%) |
| 65 to 74 Years | 0 (0.0%) | 13 (6.6%) |
| 75 Years and over | 35 (38.5%) | 64 (19.4%) |
Disability Class: Self-Care Difficulty
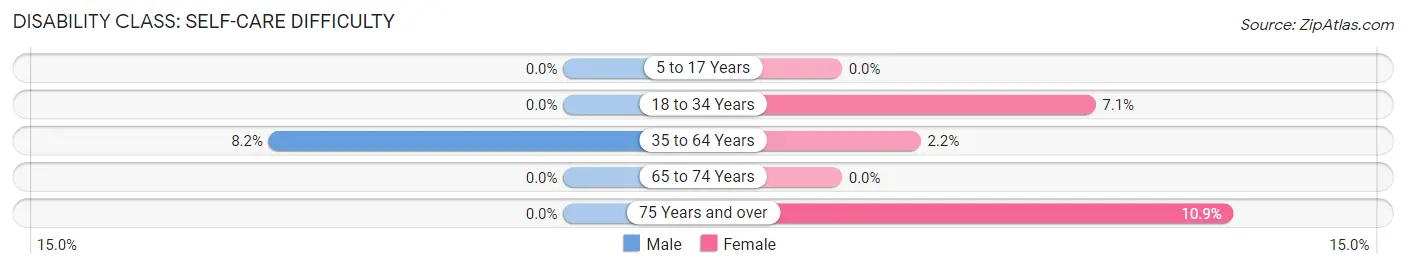
| Age Bracket | Male | Female |
| 5 to 17 Years | 0 (0.0%) | 0 (0.0%) |
| 18 to 34 Years | 0 (0.0%) | 19 (7.1%) |
| 35 to 64 Years | 46 (8.2%) | 15 (2.2%) |
| 65 to 74 Years | 0 (0.0%) | 0 (0.0%) |
| 75 Years and over | 0 (0.0%) | 36 (10.9%) |
Technology Access in Hartville
Computing Device Access in Hartville
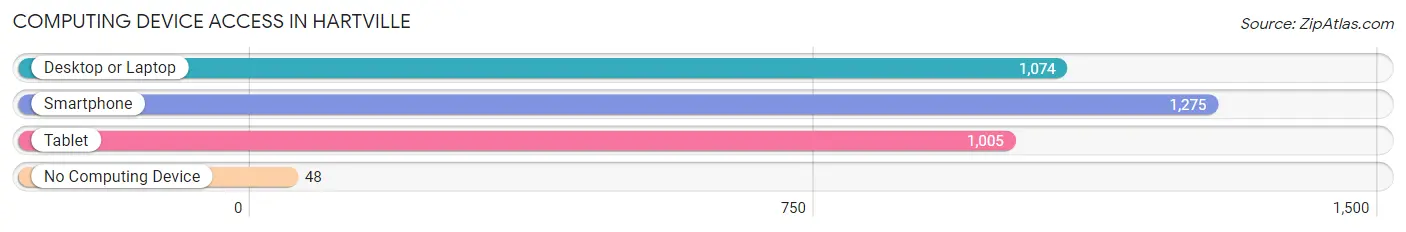
| Device Type | # Households | % Households |
| Desktop or Laptop | 1,074 | 71.9% |
| Smartphone | 1,275 | 85.4% |
| Tablet | 1,005 | 67.3% |
| No Computing Device | 48 | 3.2% |
| Total | 1,493 | 100.0% |
Internet Access in Hartville
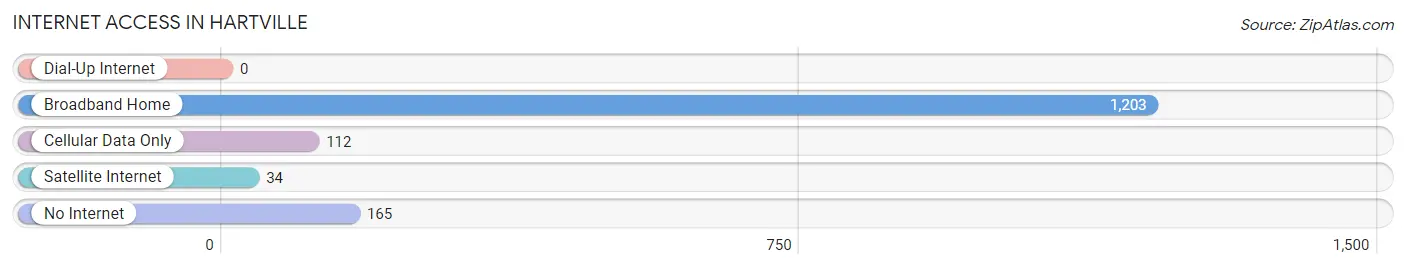
| Internet Type | # Households | % Households |
| Dial-Up Internet | 0 | 0.0% |
| Broadband Home | 1,203 | 80.6% |
| Cellular Data Only | 112 | 7.5% |
| Satellite Internet | 34 | 2.3% |
| No Internet | 165 | 11.1% |
| Total | 1,493 | 100.0% |
Hartville Summary
History
The history of Hartville, Ohio dates back to the early 1800s when the area was first settled by a group of German immigrants. The town was originally known as “Hart’s Mill” after the first settler, John Hart, who built a grist mill on the banks of the Nimishillen Creek. The town was officially incorporated in 1837 and was named after Hart.
The town grew steadily throughout the 19th century, with the construction of a railroad line in 1871 connecting Hartville to Canton and Akron. This allowed for the transportation of goods and people, and helped to spur the growth of the town. By the early 20th century, Hartville had become a thriving agricultural community, with a population of over 1,000 people.
The town continued to grow throughout the 20th century, and by the year 2000, the population had grown to over 3,000 people. The town has seen a number of changes over the years, including the construction of a new high school in the late 1990s, and the opening of a new hospital in the early 2000s.
Geography
Hartville is located in Stark County, Ohio, approximately 25 miles south of Akron and 40 miles north of Canton. The town is situated on the banks of the Nimishillen Creek, and is surrounded by rolling hills and farmland. The town is located in the Appalachian Plateau region of Ohio, and is part of the larger Appalachian Mountains region.
The town has a total area of 4.2 square miles, with 0.2 square miles of water. The town is located at an elevation of 1,068 feet above sea level. The climate in Hartville is classified as humid continental, with hot summers and cold winters.
Economy
The economy of Hartville is largely based on agriculture and manufacturing. The town is home to a number of small businesses, including a number of farms, a feed mill, a lumber yard, and a number of small retail stores. The town is also home to a number of larger employers, including a manufacturing plant, a hospital, and a number of restaurants and hotels.
The town is also home to a number of tourist attractions, including the Hartville Flea Market, the Hartville Kitchen, and the Hartville Hardware. The town is also home to a number of parks and recreational areas, including the Hartville Lake Park and the Hartville Wildlife Area.
Demographics
As of the 2010 census, the population of Hartville was 3,202. The racial makeup of the town was 97.3% White, 0.7% African American, 0.2% Native American, 0.3% Asian, 0.1% Pacific Islander, 0.4% from other races, and 1.0% from two or more races. Hispanic or Latino of any race were 1.2% of the population.
The median income for a household in Hartville was $45,938, and the median income for a family was $51,938. The per capita income for the town was $20,938. About 8.2% of families and 10.2% of the population were below the poverty line, including 14.2% of those under age 18 and 6.2% of those age 65 or over.
Common Questions
What is Per Capita Income in Hartville?
Per Capita income in Hartville is $41,082.
What is the Median Family Income in Hartville?
Median Family Income in Hartville is $80,641.
What is the Median Household income in Hartville?
Median Household Income in Hartville is $63,873.
What is Income or Wage Gap in Hartville?
Income or Wage Gap in Hartville is 9.7%.
Women in Hartville earn 90.3 cents for every dollar earned by a man.
What is Inequality or Gini Index in Hartville?
Inequality or Gini Index in Hartville is 0.46.
What is the Total Population of Hartville?
Total Population of Hartville is 3,318.
What is the Total Male Population of Hartville?
Total Male Population of Hartville is 1,646.
What is the Total Female Population of Hartville?
Total Female Population of Hartville is 1,672.
What is the Ratio of Males per 100 Females in Hartville?
There are 98.44 Males per 100 Females in Hartville.
What is the Ratio of Females per 100 Males in Hartville?
There are 101.58 Females per 100 Males in Hartville.
What is the Median Population Age in Hartville?
Median Population Age in Hartville is 49.4 Years.
What is the Average Family Size in Hartville
Average Family Size in Hartville is 2.9 People.
What is the Average Household Size in Hartville
Average Household Size in Hartville is 2.2 People.
How Large is the Labor Force in Hartville?
There are 1,680 People in the Labor Forcein in Hartville.
What is the Percentage of People in the Labor Force in Hartville?
60.9% of People are in the Labor Force in Hartville.
What is the Unemployment Rate in Hartville?
Unemployment Rate in Hartville is 1.0%.