Carrollton, OH Map & Demographics
Carrollton Map
Carrollton Overview
$34,453
PER CAPITA INCOME
$70,290
AVG FAMILY INCOME
$62,444
AVG HOUSEHOLD INCOME
24.5%
WAGE / INCOME GAP [ % ]
75.5¢/ $1
WAGE / INCOME GAP [ $ ]
0.44
INEQUALITY / GINI INDEX
3,270
TOTAL POPULATION
1,597
MALE POPULATION
1,673
FEMALE POPULATION
95.46
MALES / 100 FEMALES
104.76
FEMALES / 100 MALES
48.0
MEDIAN AGE
2.5
AVG FAMILY SIZE
2.1
AVG HOUSEHOLD SIZE
1,607
LABOR FORCE [ PEOPLE ]
58.0%
PERCENT IN LABOR FORCE
1.1%
UNEMPLOYMENT RATE
Carrollton Zip Codes
Carrollton Area Codes
Income in Carrollton
Income Overview in Carrollton
Per Capita Income in Carrollton is $34,453, while median incomes of families and households are $70,290 and $62,444 respectively.
| Characteristic | Number | Measure |
| Per Capita Income | 3,270 | $34,453 |
| Median Family Income | 1,009 | $70,290 |
| Mean Family Income | 1,009 | $83,568 |
| Median Household Income | 1,458 | $62,444 |
| Mean Household Income | 1,458 | $76,626 |
| Income Deficit | 1,009 | $0 |
| Wage / Income Gap (%) | 3,270 | 24.50% |
| Wage / Income Gap ($) | 3,270 | 75.50¢ per $1 |
| Gini / Inequality Index | 3,270 | 0.44 |
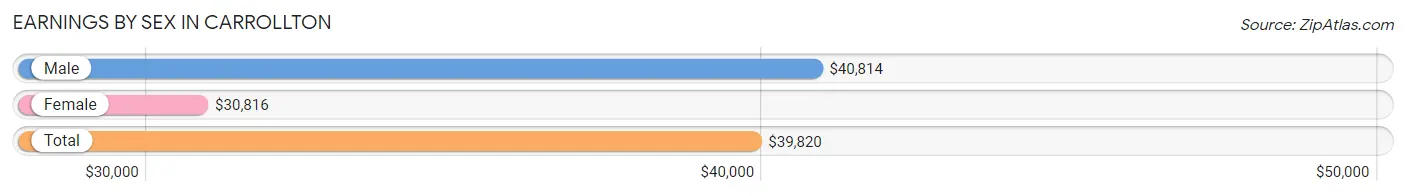
Earnings by Sex in Carrollton
Average Earnings in Carrollton are $39,820, $40,814 for men and $30,816 for women, a difference of 24.5%.
| Sex | Number | Average Earnings |
| Male | 878 (53.0%) | $40,814 |
| Female | 780 (47.0%) | $30,816 |
| Total | 1,658 (100.0%) | $39,820 |
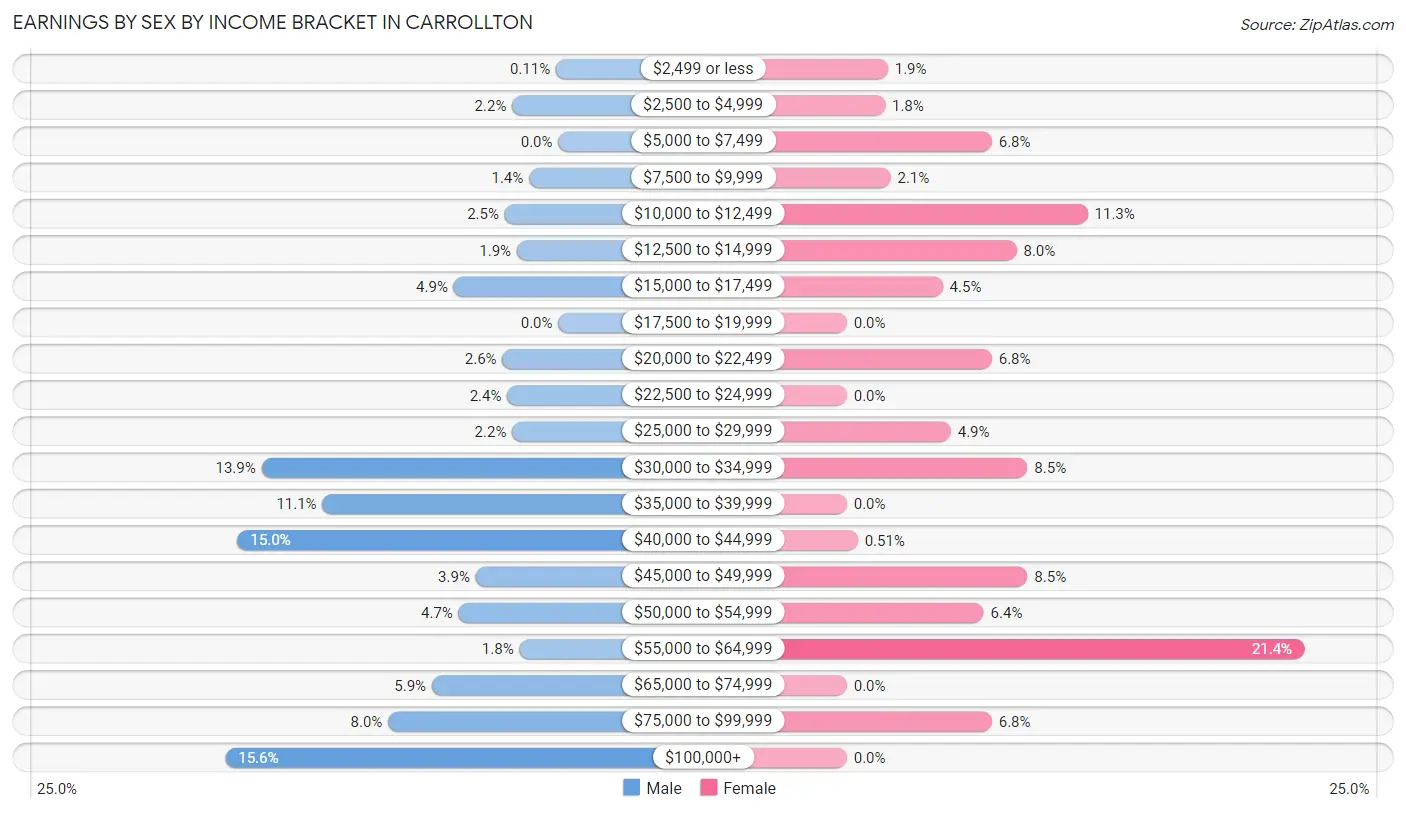
Earnings by Sex by Income Bracket in Carrollton
The most common earnings brackets in Carrollton are $100,000+ for men (137 | 15.6%) and $55,000 to $64,999 for women (167 | 21.4%).
| Income | Male | Female |
| $2,499 or less | 1 (0.1%) | 15 (1.9%) |
| $2,500 to $4,999 | 19 (2.2%) | 14 (1.8%) |
| $5,000 to $7,499 | 0 (0.0%) | 53 (6.8%) |
| $7,500 to $9,999 | 12 (1.4%) | 16 (2.1%) |
| $10,000 to $12,499 | 22 (2.5%) | 88 (11.3%) |
| $12,500 to $14,999 | 17 (1.9%) | 62 (8.0%) |
| $15,000 to $17,499 | 43 (4.9%) | 35 (4.5%) |
| $17,500 to $19,999 | 0 (0.0%) | 0 (0.0%) |
| $20,000 to $22,499 | 23 (2.6%) | 53 (6.8%) |
| $22,500 to $24,999 | 21 (2.4%) | 0 (0.0%) |
| $25,000 to $29,999 | 19 (2.2%) | 38 (4.9%) |
| $30,000 to $34,999 | 122 (13.9%) | 66 (8.5%) |
| $35,000 to $39,999 | 97 (11.1%) | 0 (0.0%) |
| $40,000 to $44,999 | 132 (15.0%) | 4 (0.5%) |
| $45,000 to $49,999 | 34 (3.9%) | 66 (8.5%) |
| $50,000 to $54,999 | 41 (4.7%) | 50 (6.4%) |
| $55,000 to $64,999 | 16 (1.8%) | 167 (21.4%) |
| $65,000 to $74,999 | 52 (5.9%) | 0 (0.0%) |
| $75,000 to $99,999 | 70 (8.0%) | 53 (6.8%) |
| $100,000+ | 137 (15.6%) | 0 (0.0%) |
| Total | 878 (100.0%) | 780 (100.0%) |
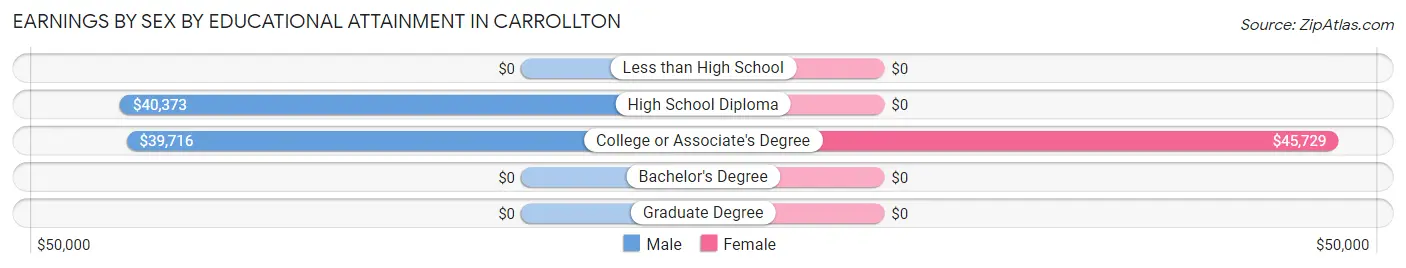
Earnings by Sex by Educational Attainment in Carrollton
Average earnings in Carrollton are $40,720 for men and $31,276 for women, a difference of 23.2%. Men with an educational attainment of high school diploma enjoy the highest average annual earnings of $40,373, while those with college or associate's degree education earn the least with $39,716. Women with an educational attainment of college or associate's degree earn the most with the average annual earnings of $45,729, while those with college or associate's degree education have the smallest earnings of $45,729.
| Educational Attainment | Male Income | Female Income |
| Less than High School | - | - |
| High School Diploma | $40,373 | $0 |
| College or Associate's Degree | $39,716 | $45,729 |
| Bachelor's Degree | - | - |
| Graduate Degree | - | - |
| Total | $40,720 | $31,276 |
Family Income in Carrollton
Family Income Brackets in Carrollton
According to the Carrollton family income data, there are 354 families falling into the $50,000 to $74,999 income range, which is the most common income bracket and makes up 35.1% of all families.
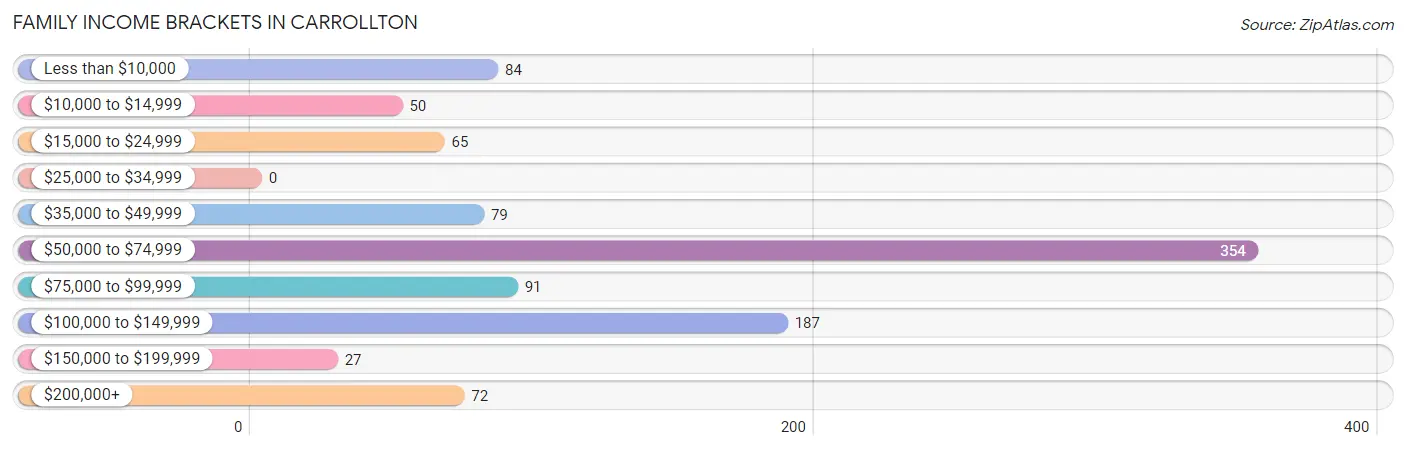
| Income Bracket | # Families | % Families |
| Less than $10,000 | 84 | 8.3% |
| $10,000 to $14,999 | 50 | 5.0% |
| $15,000 to $24,999 | 65 | 6.4% |
| $25,000 to $34,999 | 0 | 0.0% |
| $35,000 to $49,999 | 79 | 7.8% |
| $50,000 to $74,999 | 354 | 35.1% |
| $75,000 to $99,999 | 91 | 9.0% |
| $100,000 to $149,999 | 187 | 18.5% |
| $150,000 to $199,999 | 27 | 2.7% |
| $200,000+ | 72 | 7.1% |
Family Income by Famaliy Size in Carrollton
3-person families (246 | 24.4%) account for the highest median family income in Carrollton with $102,789 per family, while 3-person families (246 | 24.4%) have the highest median income of $34,263 per family member.
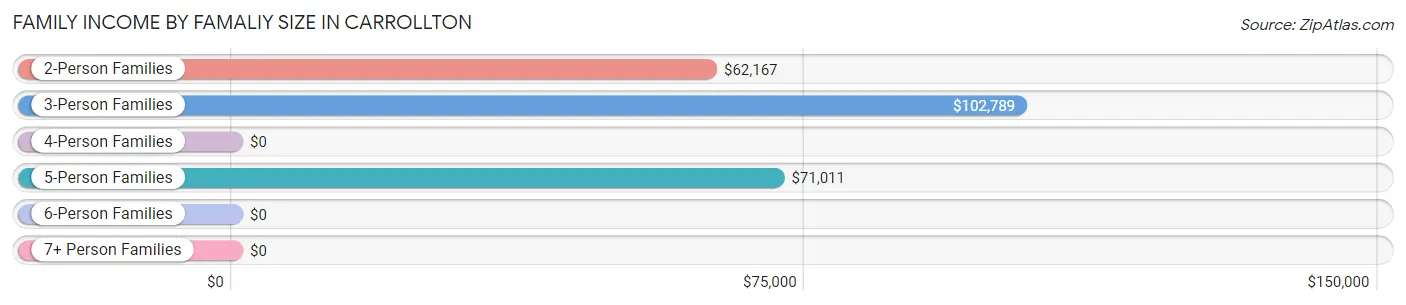
| Income Bracket | # Families | Median Income |
| 2-Person Families | 596 (59.1%) | $62,167 |
| 3-Person Families | 246 (24.4%) | $102,789 |
| 4-Person Families | 57 (5.7%) | $0 |
| 5-Person Families | 98 (9.7%) | $71,011 |
| 6-Person Families | 12 (1.2%) | $0 |
| 7+ Person Families | 0 (0.0%) | $0 |
| Total | 1,009 (100.0%) | $70,290 |
Family Income by Number of Earners in Carrollton
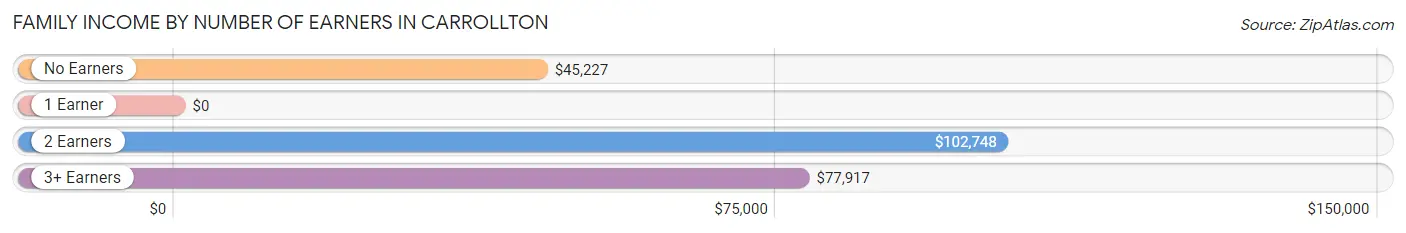
| Number of Earners | # Families | Median Income |
| No Earners | 340 (33.7%) | $45,227 |
| 1 Earner | 161 (16.0%) | $0 |
| 2 Earners | 407 (40.3%) | $102,748 |
| 3+ Earners | 101 (10.0%) | $77,917 |
| Total | 1,009 (100.0%) | $70,290 |
Household Income in Carrollton
Household Income Brackets in Carrollton
With 455 households falling in the category, the $50,000 to $74,999 income range is the most frequent in Carrollton, accounting for 31.2% of all households. In contrast, only 55 households (3.8%) fall into the $25,000 to $34,999 income bracket, making it the least populous group.
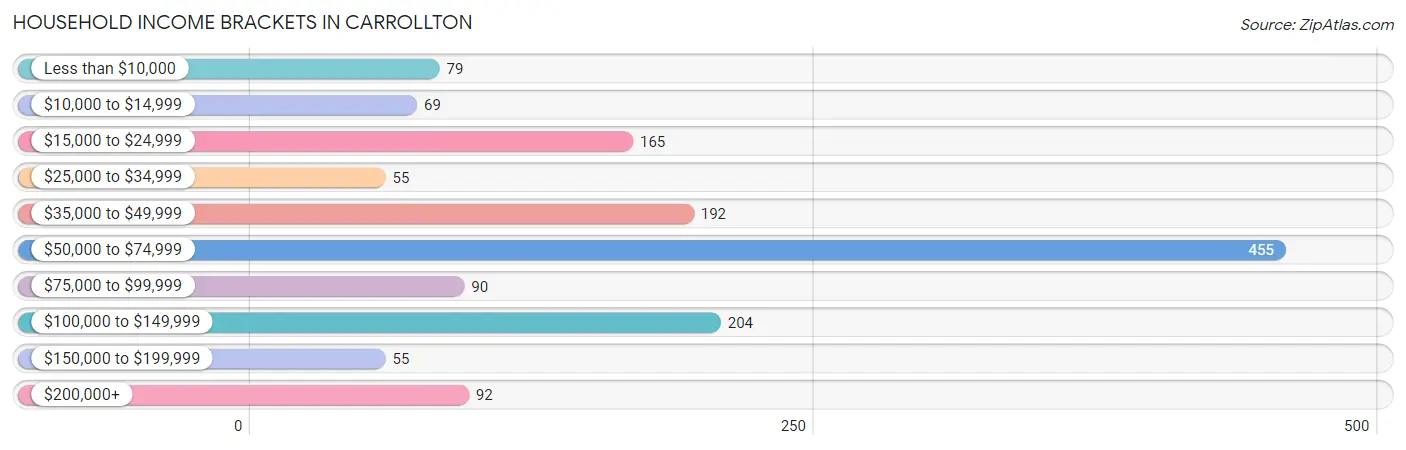
| Income Bracket | # Households | % Households |
| Less than $10,000 | 79 | 5.4% |
| $10,000 to $14,999 | 69 | 4.7% |
| $15,000 to $24,999 | 165 | 11.3% |
| $25,000 to $34,999 | 55 | 3.8% |
| $35,000 to $49,999 | 192 | 13.2% |
| $50,000 to $74,999 | 455 | 31.2% |
| $75,000 to $99,999 | 90 | 6.2% |
| $100,000 to $149,999 | 204 | 14.0% |
| $150,000 to $199,999 | 55 | 3.8% |
| $200,000+ | 92 | 6.3% |
Household Income by Householder Age in Carrollton
The median household income in Carrollton is $62,444, with the highest median household income of $72,708 found in the 45 to 64 years age bracket for the primary householder. A total of 502 households (34.4%) fall into this category. Meanwhile, the 15 to 24 years age bracket for the primary householder has the lowest median household income of $0, with 50 households (3.4%) in this group.
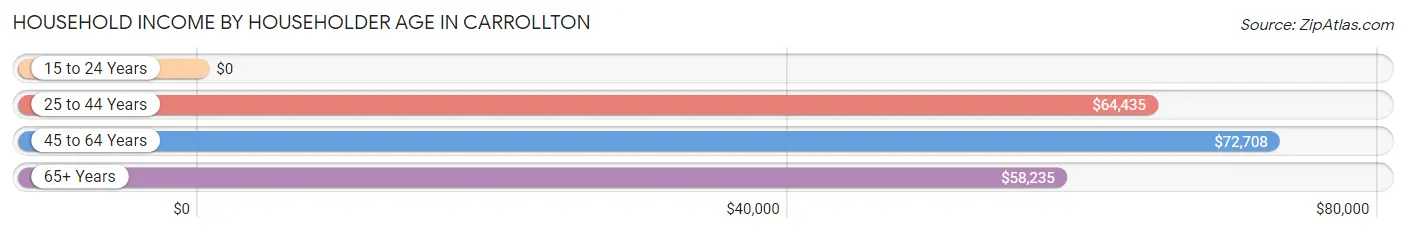
| Income Bracket | # Households | Median Income |
| 15 to 24 Years | 50 (3.4%) | $0 |
| 25 to 44 Years | 444 (30.4%) | $64,435 |
| 45 to 64 Years | 502 (34.4%) | $72,708 |
| 65+ Years | 462 (31.7%) | $58,235 |
| Total | 1,458 (100.0%) | $62,444 |
Poverty in Carrollton
Income Below Poverty by Sex and Age in Carrollton
With 5.4% poverty level for males and 19.7% for females among the residents of Carrollton, 6 to 11 year old males and 5 year old females are the most vulnerable to poverty, with 18 males (39.1%) and 35 females (100.0%) in their respective age groups living below the poverty level.
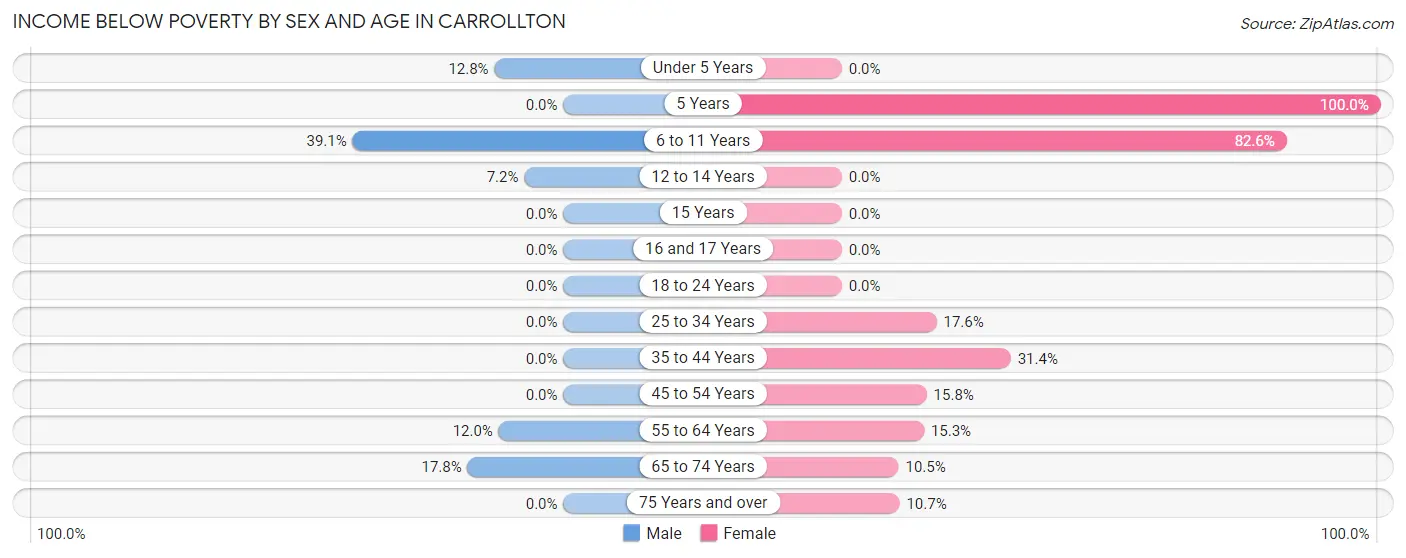
| Age Bracket | Male | Female |
| Under 5 Years | 11 (12.8%) | 0 (0.0%) |
| 5 Years | 0 (0.0%) | 35 (100.0%) |
| 6 to 11 Years | 18 (39.1%) | 90 (82.6%) |
| 12 to 14 Years | 11 (7.2%) | 0 (0.0%) |
| 15 Years | 0 (0.0%) | 0 (0.0%) |
| 16 and 17 Years | 0 (0.0%) | 0 (0.0%) |
| 18 to 24 Years | 0 (0.0%) | 0 (0.0%) |
| 25 to 34 Years | 0 (0.0%) | 38 (17.6%) |
| 35 to 44 Years | 0 (0.0%) | 37 (31.4%) |
| 45 to 54 Years | 0 (0.0%) | 46 (15.8%) |
| 55 to 64 Years | 21 (12.0%) | 27 (15.2%) |
| 65 to 74 Years | 24 (17.8%) | 22 (10.5%) |
| 75 Years and over | 0 (0.0%) | 24 (10.7%) |
| Total | 85 (5.4%) | 319 (19.7%) |
Income Above Poverty by Sex and Age in Carrollton
According to the poverty statistics in Carrollton, males aged 16 and 17 years and females aged 12 to 14 years are the age groups that are most secure financially, with 100.0% of males and 100.0% of females in these age groups living above the poverty line.
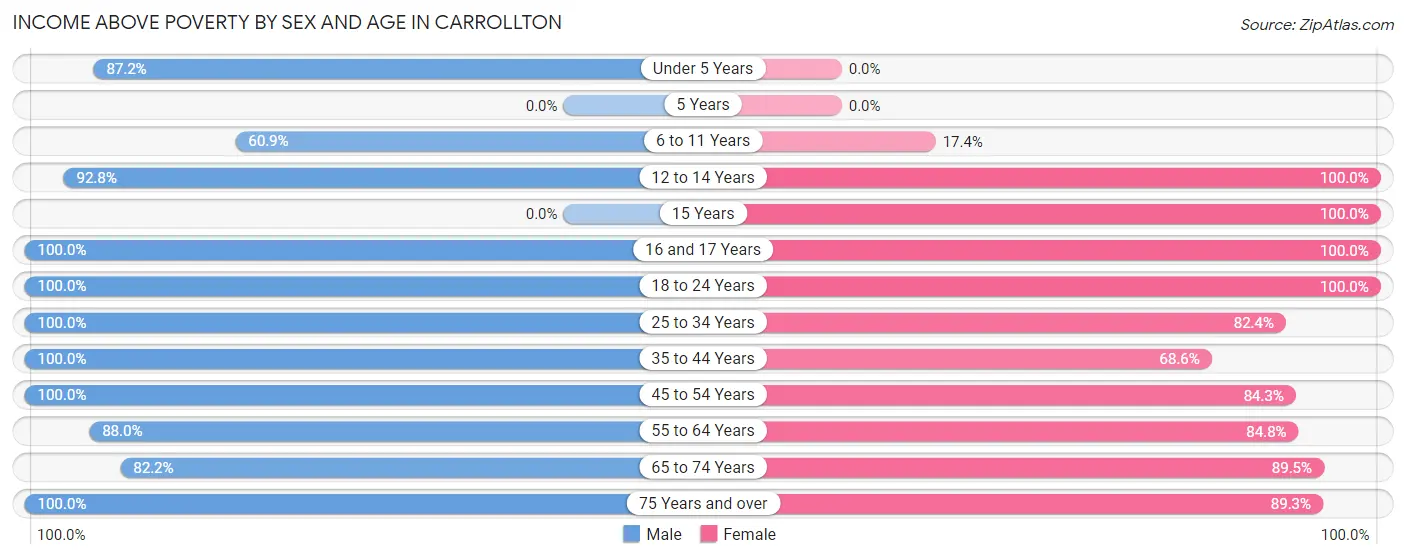
| Age Bracket | Male | Female |
| Under 5 Years | 75 (87.2%) | 0 (0.0%) |
| 5 Years | 0 (0.0%) | 0 (0.0%) |
| 6 to 11 Years | 28 (60.9%) | 19 (17.4%) |
| 12 to 14 Years | 141 (92.8%) | 54 (100.0%) |
| 15 Years | 0 (0.0%) | 13 (100.0%) |
| 16 and 17 Years | 25 (100.0%) | 83 (100.0%) |
| 18 to 24 Years | 101 (100.0%) | 88 (100.0%) |
| 25 to 34 Years | 301 (100.0%) | 178 (82.4%) |
| 35 to 44 Years | 151 (100.0%) | 81 (68.6%) |
| 45 to 54 Years | 208 (100.0%) | 246 (84.3%) |
| 55 to 64 Years | 154 (88.0%) | 150 (84.8%) |
| 65 to 74 Years | 111 (82.2%) | 187 (89.5%) |
| 75 Years and over | 190 (100.0%) | 200 (89.3%) |
| Total | 1,485 (94.6%) | 1,299 (80.3%) |
Income Below Poverty Among Married-Couple Families in Carrollton
The poverty statistics for married-couple families in Carrollton show that 3.2% or 24 of the total 759 families live below the poverty line. Families with no children have the highest poverty rate of 5.1%, comprising of 24 families. On the other hand, families with 1 or 2 children have the lowest poverty rate of 0.0%, which includes 0 families.
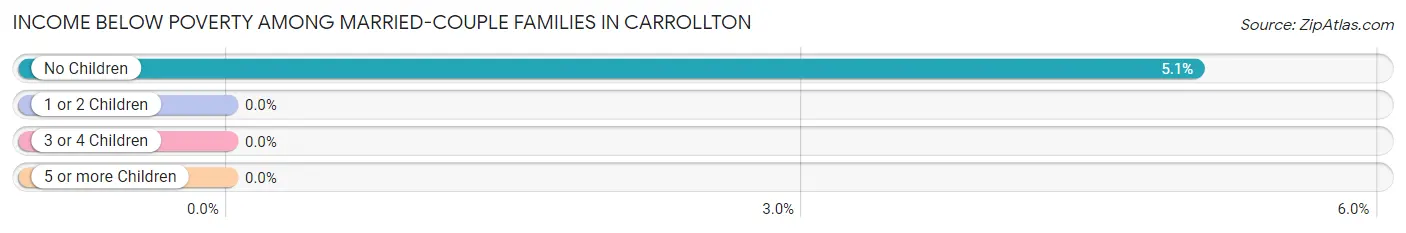
| Children | Above Poverty | Below Poverty |
| No Children | 451 (95.0%) | 24 (5.1%) |
| 1 or 2 Children | 225 (100.0%) | 0 (0.0%) |
| 3 or 4 Children | 59 (100.0%) | 0 (0.0%) |
| 5 or more Children | 0 (0.0%) | 0 (0.0%) |
| Total | 735 (96.8%) | 24 (3.2%) |
Income Below Poverty Among Single-Parent Households in Carrollton
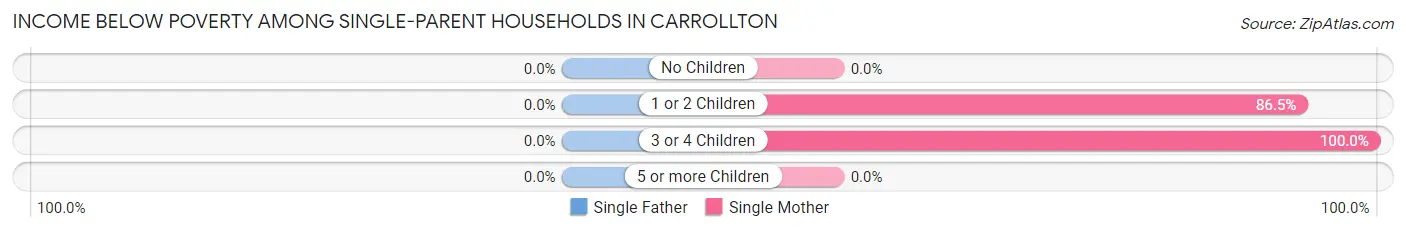
| Children | Single Father | Single Mother |
| No Children | 0 (0.0%) | 0 (0.0%) |
| 1 or 2 Children | 0 (0.0%) | 109 (86.5%) |
| 3 or 4 Children | 0 (0.0%) | 12 (100.0%) |
| 5 or more Children | 0 (0.0%) | 0 (0.0%) |
| Total | 0 (0.0%) | 121 (65.4%) |
Income Below Poverty Among Married-Couple vs Single-Parent Households in Carrollton
The poverty data for Carrollton shows that 24 of the married-couple family households (3.2%) and 121 of the single-parent households (48.4%) are living below the poverty level. Within the married-couple family households, those with no children have the highest poverty rate, with 24 households (5.1%) falling below the poverty line. Among the single-parent households, those with 3 or 4 children have the highest poverty rate, with 12 household (100.0%) living below poverty.
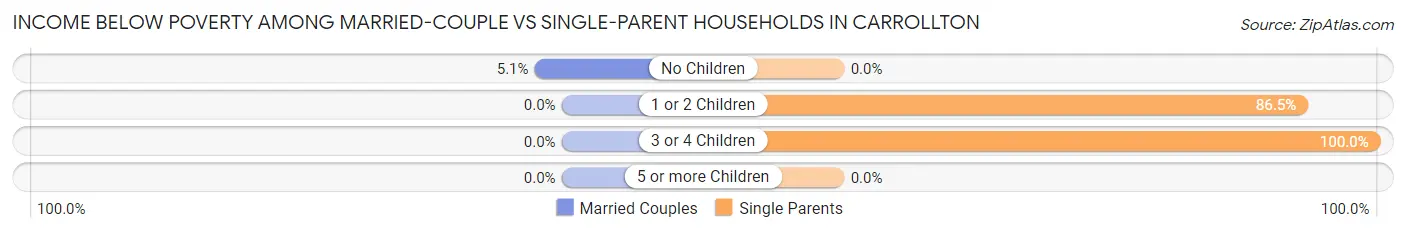
| Children | Married-Couple Families | Single-Parent Households |
| No Children | 24 (5.1%) | 0 (0.0%) |
| 1 or 2 Children | 0 (0.0%) | 109 (86.5%) |
| 3 or 4 Children | 0 (0.0%) | 12 (100.0%) |
| 5 or more Children | 0 (0.0%) | 0 (0.0%) |
| Total | 24 (3.2%) | 121 (48.4%) |
Race in Carrollton
The most populous races in Carrollton are White / Caucasian (3,217 | 98.4%), Black / African American (47 | 1.4%), and Hispanic or Latino (19 | 0.6%).
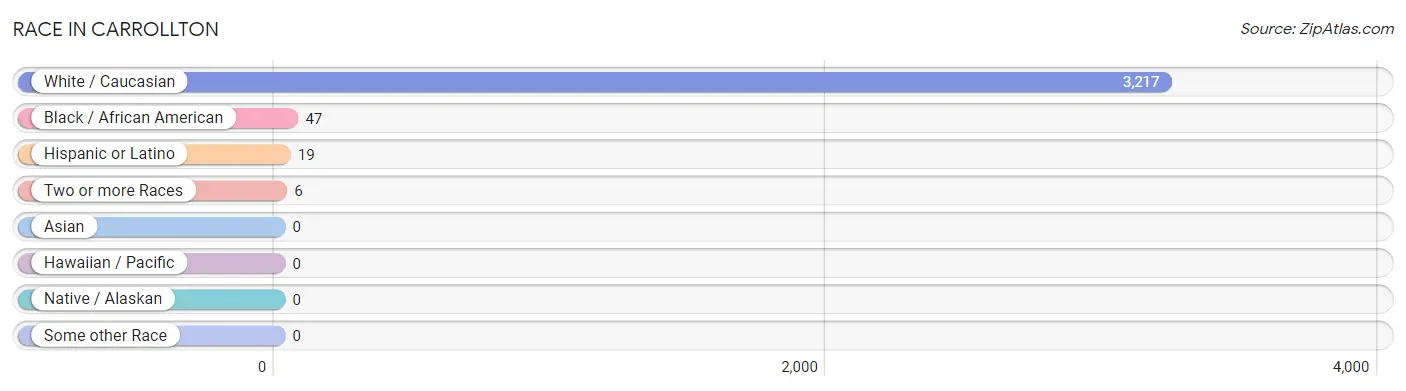
| Race | # Population | % Population |
| Asian | 0 | 0.0% |
| Black / African American | 47 | 1.4% |
| Hawaiian / Pacific | 0 | 0.0% |
| Hispanic or Latino | 19 | 0.6% |
| Native / Alaskan | 0 | 0.0% |
| White / Caucasian | 3,217 | 98.4% |
| Two or more Races | 6 | 0.2% |
| Some other Race | 0 | 0.0% |
| Total | 3,270 | 100.0% |
Ancestry in Carrollton
The most populous ancestries reported in Carrollton are German (858 | 26.2%), English (511 | 15.6%), Irish (354 | 10.8%), Italian (266 | 8.1%), and American (237 | 7.2%), together accounting for 68.1% of all Carrollton residents.
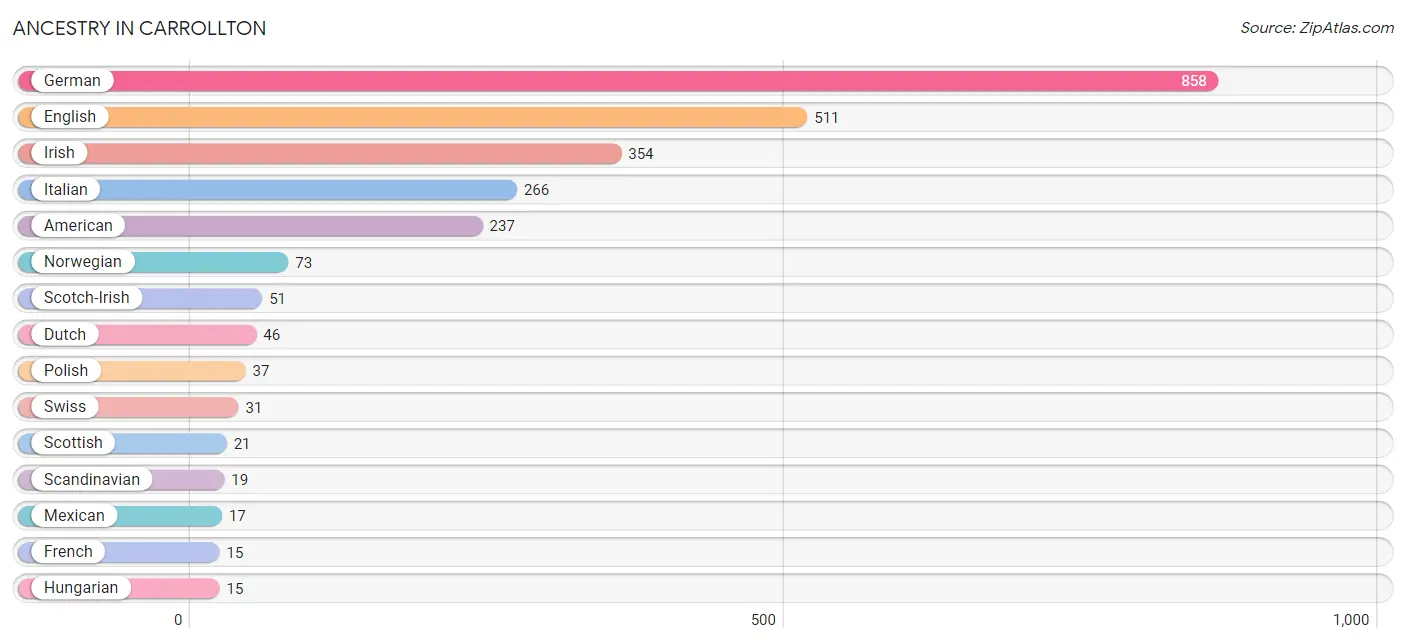
| Ancestry | # Population | % Population |
| American | 237 | 7.2% |
| Central American | 1 | 0.0% |
| Central American Indian | 1 | 0.0% |
| Croatian | 13 | 0.4% |
| Dominican | 1 | 0.0% |
| Dutch | 46 | 1.4% |
| English | 511 | 15.6% |
| French | 15 | 0.5% |
| German | 858 | 26.2% |
| Hungarian | 15 | 0.5% |
| Irish | 354 | 10.8% |
| Italian | 266 | 8.1% |
| Lithuanian | 3 | 0.1% |
| Mexican | 17 | 0.5% |
| Nigerian | 3 | 0.1% |
| Norwegian | 73 | 2.2% |
| Polish | 37 | 1.1% |
| Salvadoran | 1 | 0.0% |
| Scandinavian | 19 | 0.6% |
| Scotch-Irish | 51 | 1.6% |
| Scottish | 21 | 0.6% |
| Slovak | 6 | 0.2% |
| Subsaharan African | 3 | 0.1% |
| Swiss | 31 | 0.9% | View All 24 Rows |
Immigrants in Carrollton
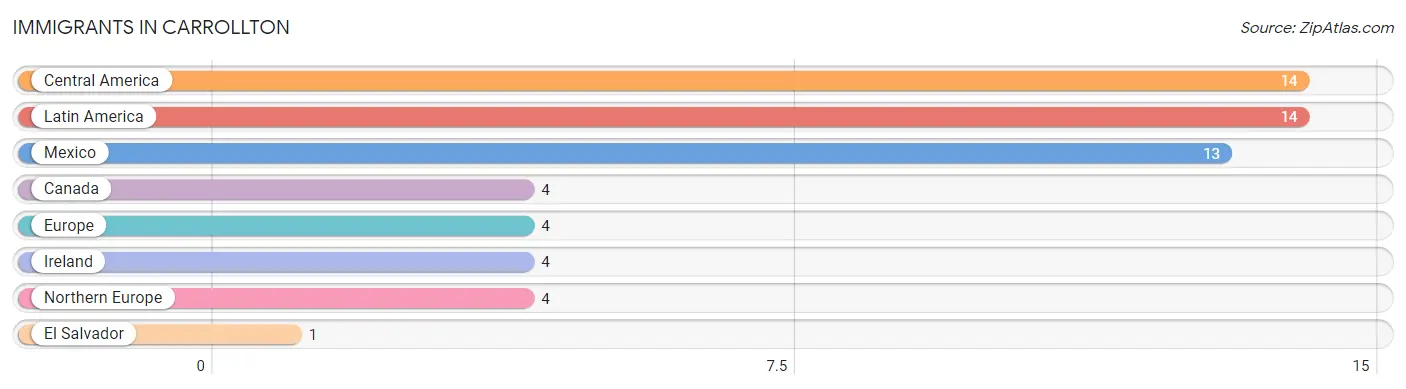
The most numerous immigrant groups reported in Carrollton came from Central America (14 | 0.4%), Latin America (14 | 0.4%), Mexico (13 | 0.4%), Canada (4 | 0.1%), and Europe (4 | 0.1%), together accounting for 1.5% of all Carrollton residents.
| Immigration Origin | # Population | % Population |
| Canada | 4 | 0.1% |
| Central America | 14 | 0.4% |
| El Salvador | 1 | 0.0% |
| Europe | 4 | 0.1% |
| Ireland | 4 | 0.1% |
| Latin America | 14 | 0.4% |
| Mexico | 13 | 0.4% |
| Northern Europe | 4 | 0.1% | View All 8 Rows |
Sex and Age in Carrollton
Sex and Age in Carrollton
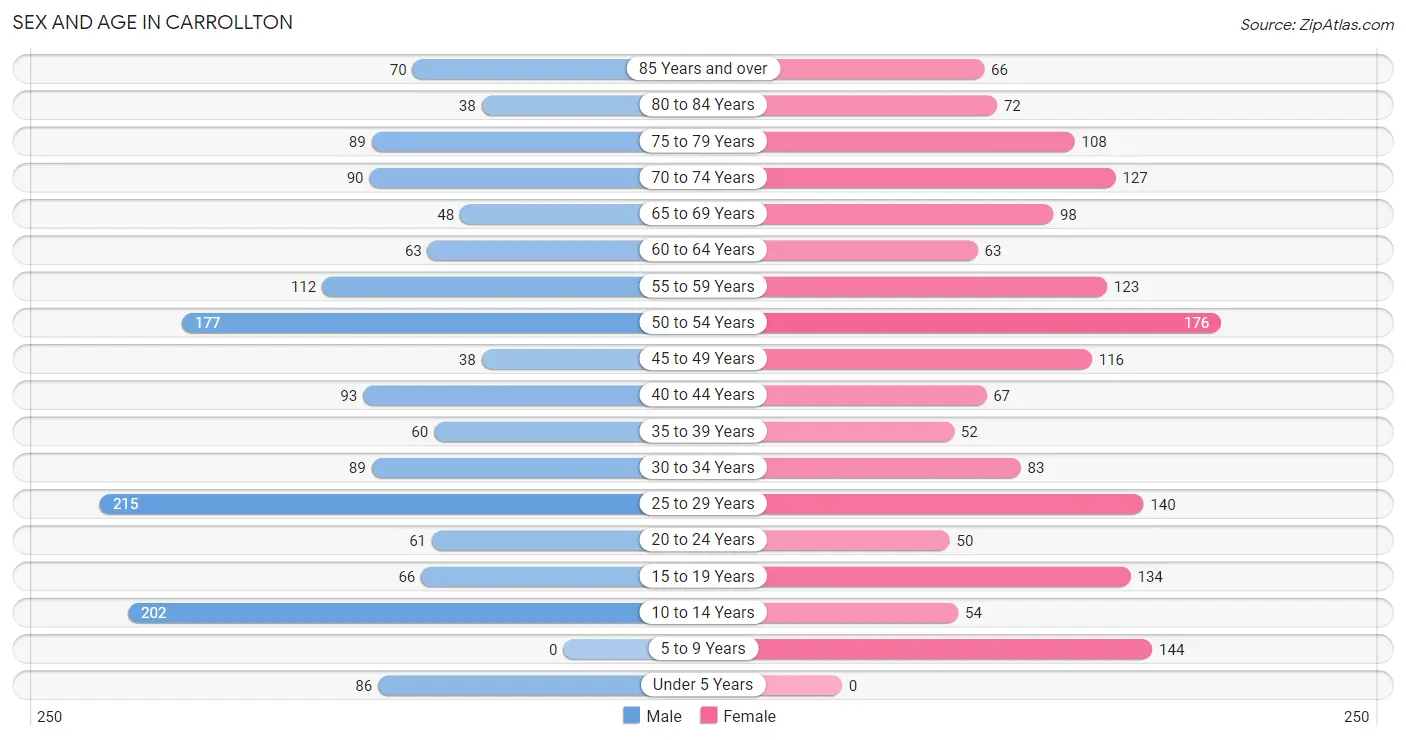
The most populous age groups in Carrollton are 25 to 29 Years (215 | 13.5%) for men and 50 to 54 Years (176 | 10.5%) for women.
| Age Bracket | Male | Female |
| Under 5 Years | 86 (5.4%) | 0 (0.0%) |
| 5 to 9 Years | 0 (0.0%) | 144 (8.6%) |
| 10 to 14 Years | 202 (12.7%) | 54 (3.2%) |
| 15 to 19 Years | 66 (4.1%) | 134 (8.0%) |
| 20 to 24 Years | 61 (3.8%) | 50 (3.0%) |
| 25 to 29 Years | 215 (13.5%) | 140 (8.4%) |
| 30 to 34 Years | 89 (5.6%) | 83 (5.0%) |
| 35 to 39 Years | 60 (3.8%) | 52 (3.1%) |
| 40 to 44 Years | 93 (5.8%) | 67 (4.0%) |
| 45 to 49 Years | 38 (2.4%) | 116 (6.9%) |
| 50 to 54 Years | 177 (11.1%) | 176 (10.5%) |
| 55 to 59 Years | 112 (7.0%) | 123 (7.3%) |
| 60 to 64 Years | 63 (3.9%) | 63 (3.8%) |
| 65 to 69 Years | 48 (3.0%) | 98 (5.9%) |
| 70 to 74 Years | 90 (5.6%) | 127 (7.6%) |
| 75 to 79 Years | 89 (5.6%) | 108 (6.5%) |
| 80 to 84 Years | 38 (2.4%) | 72 (4.3%) |
| 85 Years and over | 70 (4.4%) | 66 (4.0%) |
| Total | 1,597 (100.0%) | 1,673 (100.0%) |
Families and Households in Carrollton
Median Family Size in Carrollton
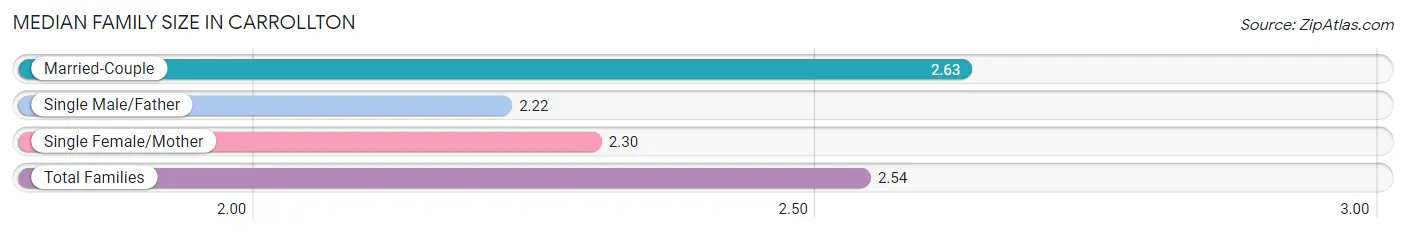
The median family size in Carrollton is 2.54 persons per family, with married-couple families (759 | 75.2%) accounting for the largest median family size of 2.63 persons per family. On the other hand, single male/father families (65 | 6.4%) represent the smallest median family size with 2.22 persons per family.
| Family Type | # Families | Family Size |
| Married-Couple | 759 (75.2%) | 2.63 |
| Single Male/Father | 65 (6.4%) | 2.22 |
| Single Female/Mother | 185 (18.3%) | 2.30 |
| Total Families | 1,009 (100.0%) | 2.54 |
Median Household Size in Carrollton
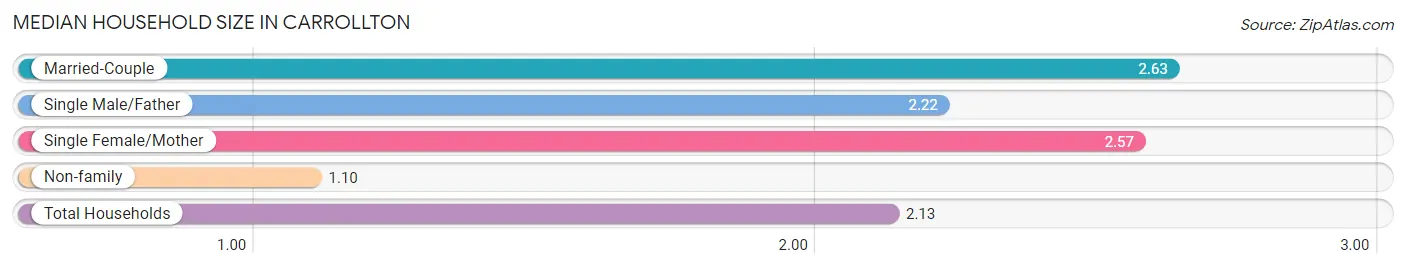
The median household size in Carrollton is 2.13 persons per household, with married-couple households (759 | 52.1%) accounting for the largest median household size of 2.63 persons per household. non-family households (449 | 30.8%) represent the smallest median household size with 1.10 persons per household.
| Household Type | # Households | Household Size |
| Married-Couple | 759 (52.1%) | 2.63 |
| Single Male/Father | 65 (4.5%) | 2.22 |
| Single Female/Mother | 185 (12.7%) | 2.57 |
| Non-family | 449 (30.8%) | 1.10 |
| Total Households | 1,458 (100.0%) | 2.13 |
Household Size by Marriage Status in Carrollton
Out of a total of 1,458 households in Carrollton, 1,009 (69.2%) are family households, while 449 (30.8%) are nonfamily households. The most numerous type of family households are 2-person households, comprising 579, and the most common type of nonfamily households are 1-person households, comprising 400.
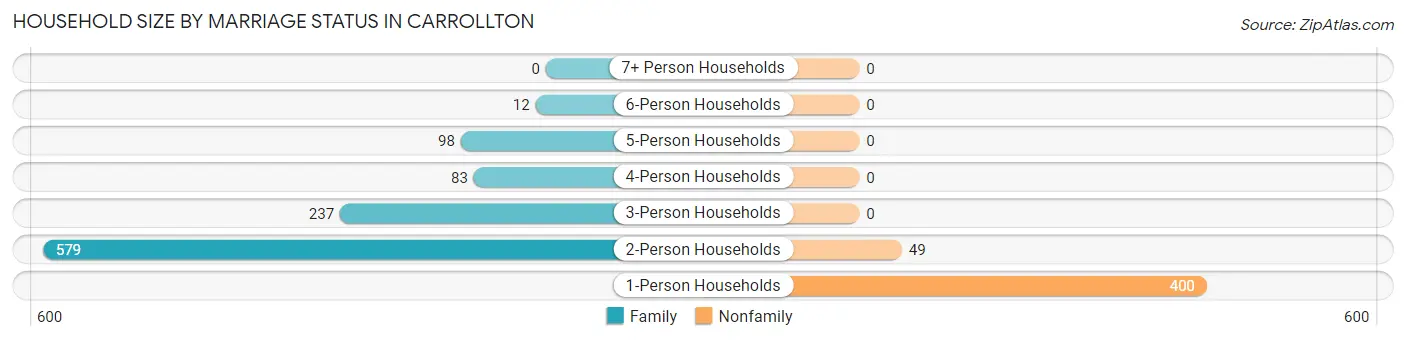
| Household Size | Family Households | Nonfamily Households |
| 1-Person Households | - | 400 (27.4%) |
| 2-Person Households | 579 (39.7%) | 49 (3.4%) |
| 3-Person Households | 237 (16.3%) | 0 (0.0%) |
| 4-Person Households | 83 (5.7%) | 0 (0.0%) |
| 5-Person Households | 98 (6.7%) | 0 (0.0%) |
| 6-Person Households | 12 (0.8%) | 0 (0.0%) |
| 7+ Person Households | 0 (0.0%) | 0 (0.0%) |
| Total | 1,009 (69.2%) | 449 (30.8%) |
Female Fertility in Carrollton
Fertility by Age in Carrollton
| Age Bracket | Women with Births | Births / 1,000 Women |
| 15 to 19 years | 0 (0.0%) | 0.0 |
| 20 to 34 years | 0 (0.0%) | 0.0 |
| 35 to 50 years | 0 (0.0%) | 0.0 |
| Total | 0 (0.0%) | 0.0 |
Fertility by Age by Marriage Status in Carrollton
| Age Bracket | Married | Unmarried |
| 15 to 19 years | 0 (0.0%) | 0 (0.0%) |
| 20 to 34 years | 0 (0.0%) | 0 (0.0%) |
| 35 to 50 years | 0 (0.0%) | 0 (0.0%) |
| Total | 0 (0.0%) | 0 (0.0%) |
Fertility by Education in Carrollton
| Educational Attainment | Women with Births | Births / 1,000 Women |
| Less than High School | 0 (0.0%) | 0.0 |
| High School Diploma | 0 (0.0%) | 0.0 |
| College or Associate's Degree | 0 (0.0%) | 0.0 |
| Bachelor's Degree | 0 (0.0%) | 0.0 |
| Graduate Degree | 0 (0.0%) | 0.0 |
| Total | 0 (0.0%) | 0.0 |
Fertility by Education by Marriage Status in Carrollton
| Educational Attainment | Married | Unmarried |
| Less than High School | 0 (0.0%) | 0 (0.0%) |
| High School Diploma | 0 (0.0%) | 0 (0.0%) |
| College or Associate's Degree | 0 (0.0%) | 0 (0.0%) |
| Bachelor's Degree | 0 (0.0%) | 0 (0.0%) |
| Graduate Degree | 0 (0.0%) | 0 (0.0%) |
| Total | 0 (0.0%) | 0 (0.0%) |
Employment Characteristics in Carrollton
Employment by Class of Employer in Carrollton
Among the 1,590 employed individuals in Carrollton, private company employees (1,159 | 72.9%), local government employees (134 | 8.4%), and not-for-profit organizations (109 | 6.9%) make up the most common classes of employment.
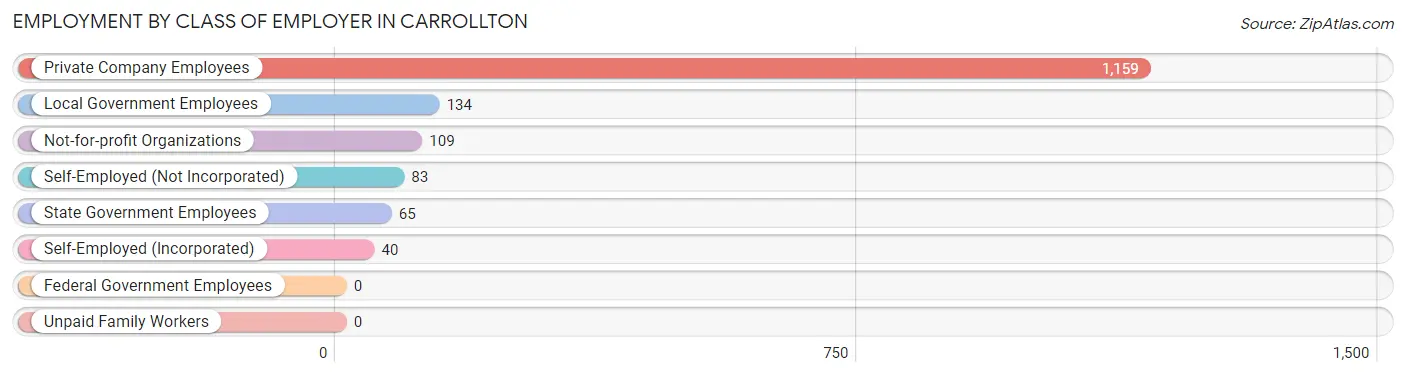
| Employer Class | # Employees | % Employees |
| Private Company Employees | 1,159 | 72.9% |
| Self-Employed (Incorporated) | 40 | 2.5% |
| Self-Employed (Not Incorporated) | 83 | 5.2% |
| Not-for-profit Organizations | 109 | 6.9% |
| Local Government Employees | 134 | 8.4% |
| State Government Employees | 65 | 4.1% |
| Federal Government Employees | 0 | 0.0% |
| Unpaid Family Workers | 0 | 0.0% |
| Total | 1,590 | 100.0% |
Employment Status by Age in Carrollton
According to the labor force statistics for Carrollton, out of the total population over 16 years of age (2,771), 58.0% or 1,607 individuals are in the labor force, with 1.1% or 18 of them unemployed. The age group with the highest labor force participation rate is 20 to 24 years, with 99.1% or 110 individuals in the labor force. Within the labor force, the 65 to 74 years age range has the highest percentage of unemployed individuals, with 34.0% or 18 of them being unemployed.
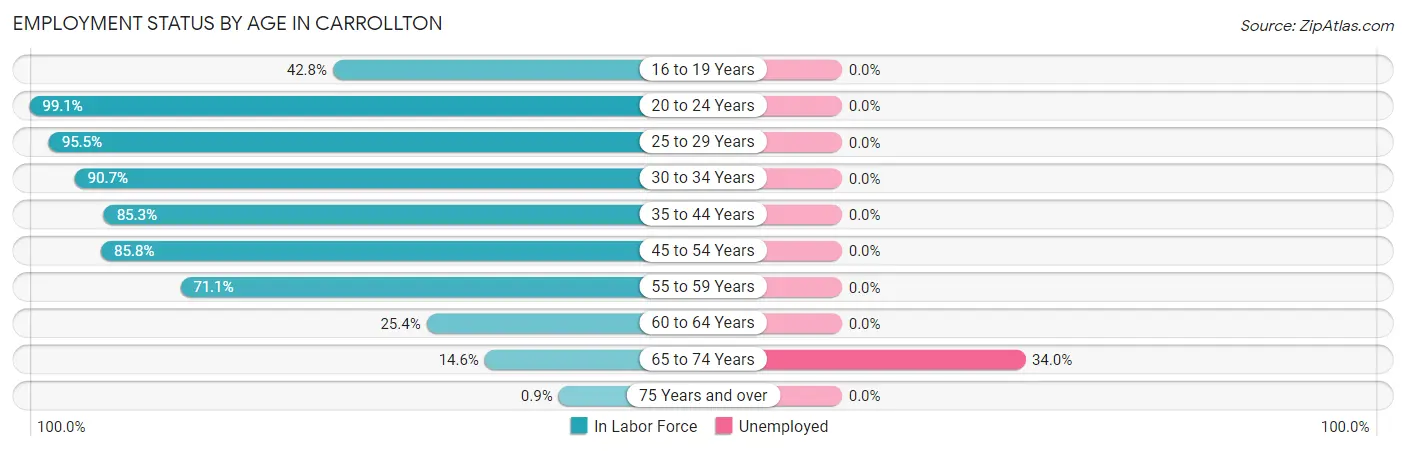
| Age Bracket | In Labor Force | Unemployed |
| 16 to 19 Years | 80 (42.8%) | 0 (0.0%) |
| 20 to 24 Years | 110 (99.1%) | 0 (0.0%) |
| 25 to 29 Years | 339 (95.5%) | 0 (0.0%) |
| 30 to 34 Years | 156 (90.7%) | 0 (0.0%) |
| 35 to 44 Years | 232 (85.3%) | 0 (0.0%) |
| 45 to 54 Years | 435 (85.8%) | 0 (0.0%) |
| 55 to 59 Years | 167 (71.1%) | 0 (0.0%) |
| 60 to 64 Years | 32 (25.4%) | 0 (0.0%) |
| 65 to 74 Years | 53 (14.6%) | 18 (34.0%) |
| 75 Years and over | 4 (0.9%) | 0 (0.0%) |
| Total | 1,607 (58.0%) | 18 (1.1%) |
Employment Status by Educational Attainment in Carrollton
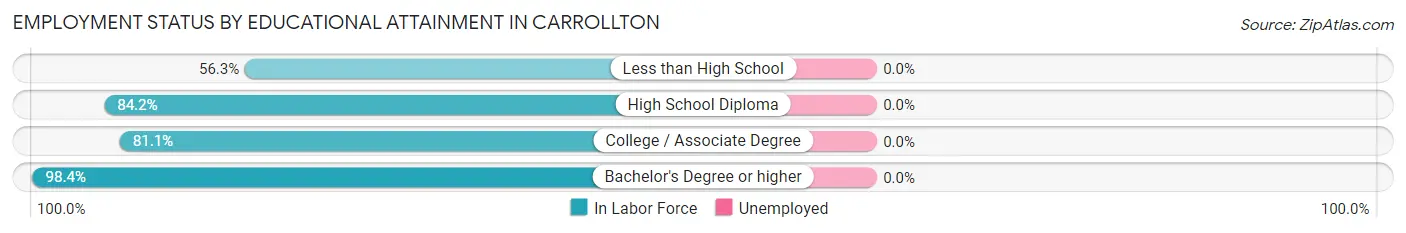
| Educational Attainment | In Labor Force | Unemployed |
| Less than High School | 116 (56.3%) | 0 (0.0%) |
| High School Diploma | 474 (84.2%) | 0 (0.0%) |
| College / Associate Degree | 528 (81.1%) | 0 (0.0%) |
| Bachelor's Degree or higher | 243 (98.4%) | 0 (0.0%) |
| Total | 1,360 (81.6%) | 0 (0.0%) |
Employment Occupations by Sex in Carrollton
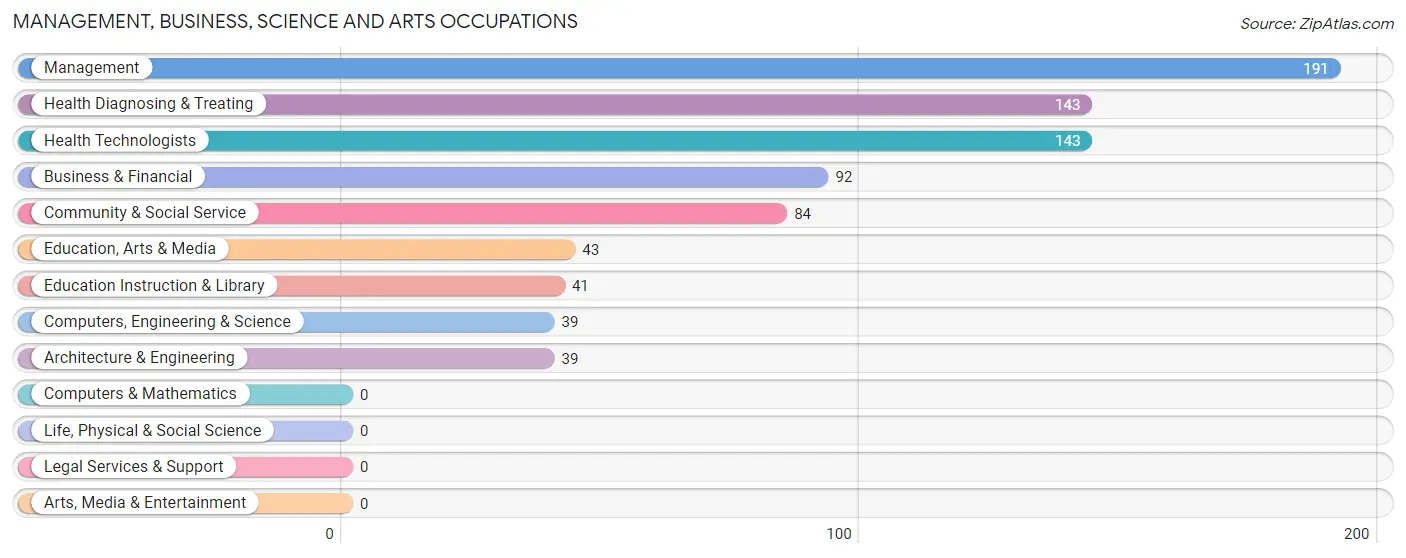
Management, Business, Science and Arts Occupations
The most common Management, Business, Science and Arts occupations in Carrollton are Management (191 | 12.0%), Health Diagnosing & Treating (143 | 9.0%), Health Technologists (143 | 9.0%), Business & Financial (92 | 5.8%), and Community & Social Service (84 | 5.3%).
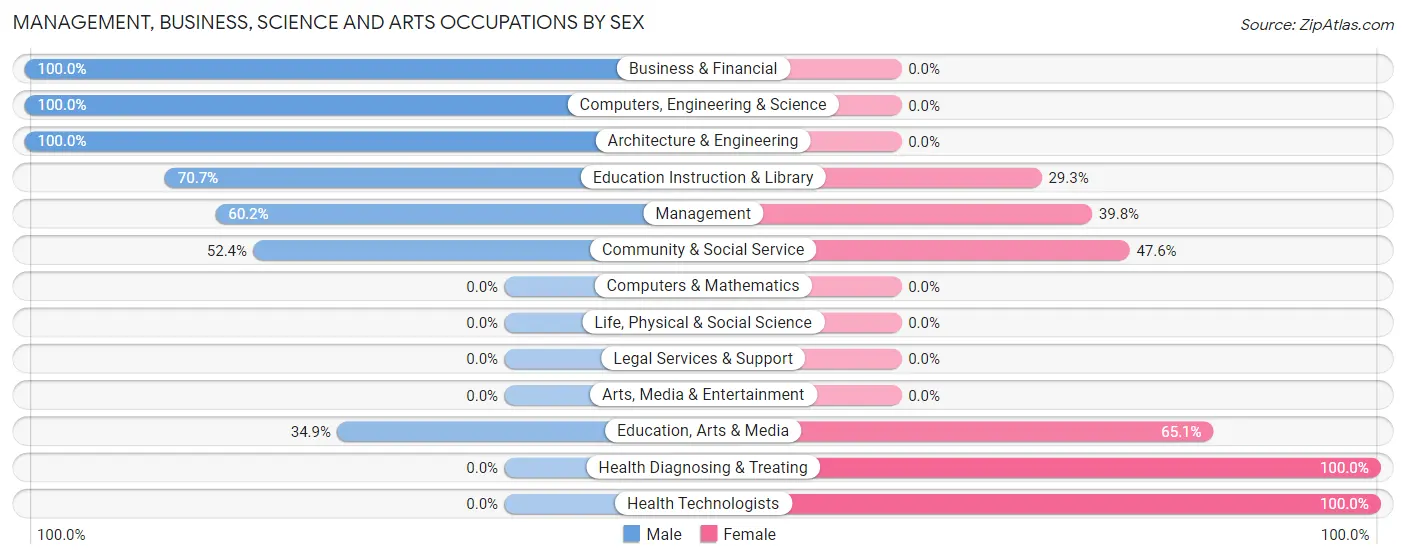
Management, Business, Science and Arts Occupations by Sex
Within the Management, Business, Science and Arts occupations in Carrollton, the most male-oriented occupations are Business & Financial (100.0%), Computers, Engineering & Science (100.0%), and Architecture & Engineering (100.0%), while the most female-oriented occupations are Health Diagnosing & Treating (100.0%), Health Technologists (100.0%), and Education, Arts & Media (65.1%).
| Occupation | Male | Female |
| Management | 115 (60.2%) | 76 (39.8%) |
| Business & Financial | 92 (100.0%) | 0 (0.0%) |
| Computers, Engineering & Science | 39 (100.0%) | 0 (0.0%) |
| Computers & Mathematics | 0 (0.0%) | 0 (0.0%) |
| Architecture & Engineering | 39 (100.0%) | 0 (0.0%) |
| Life, Physical & Social Science | 0 (0.0%) | 0 (0.0%) |
| Community & Social Service | 44 (52.4%) | 40 (47.6%) |
| Education, Arts & Media | 15 (34.9%) | 28 (65.1%) |
| Legal Services & Support | 0 (0.0%) | 0 (0.0%) |
| Education Instruction & Library | 29 (70.7%) | 12 (29.3%) |
| Arts, Media & Entertainment | 0 (0.0%) | 0 (0.0%) |
| Health Diagnosing & Treating | 0 (0.0%) | 143 (100.0%) |
| Health Technologists | 0 (0.0%) | 143 (100.0%) |
| Total (Category) | 290 (52.8%) | 259 (47.2%) |
| Total (Overall) | 833 (52.4%) | 757 (47.6%) |
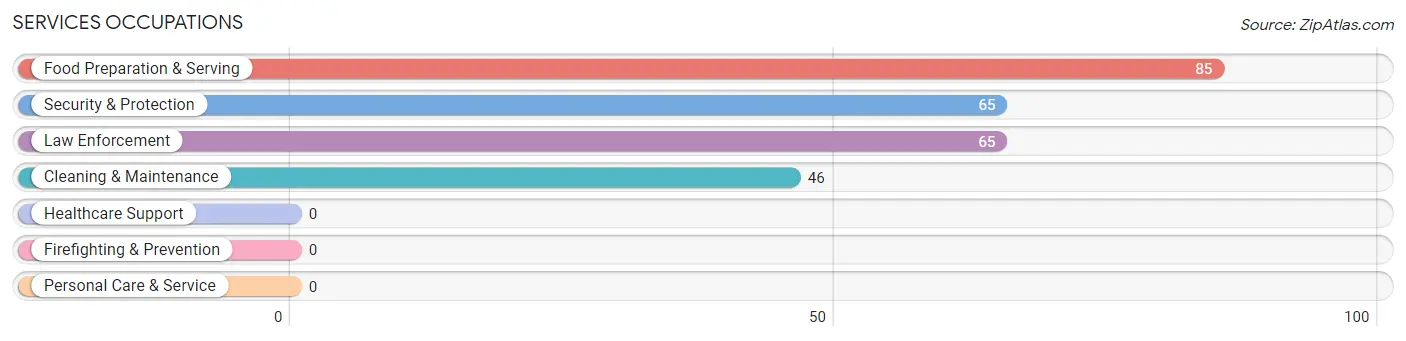
Services Occupations
The most common Services occupations in Carrollton are Food Preparation & Serving (85 | 5.3%), Security & Protection (65 | 4.1%), Law Enforcement (65 | 4.1%), and Cleaning & Maintenance (46 | 2.9%).
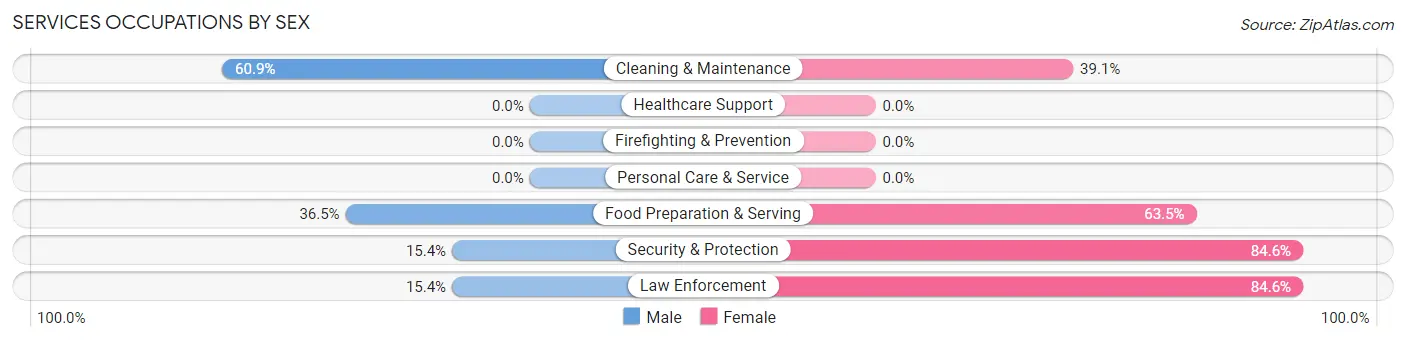
Services Occupations by Sex
Within the Services occupations in Carrollton, the most male-oriented occupations are Cleaning & Maintenance (60.9%), Food Preparation & Serving (36.5%), and Security & Protection (15.4%), while the most female-oriented occupations are Security & Protection (84.6%), Law Enforcement (84.6%), and Food Preparation & Serving (63.5%).
| Occupation | Male | Female |
| Healthcare Support | 0 (0.0%) | 0 (0.0%) |
| Security & Protection | 10 (15.4%) | 55 (84.6%) |
| Firefighting & Prevention | 0 (0.0%) | 0 (0.0%) |
| Law Enforcement | 10 (15.4%) | 55 (84.6%) |
| Food Preparation & Serving | 31 (36.5%) | 54 (63.5%) |
| Cleaning & Maintenance | 28 (60.9%) | 18 (39.1%) |
| Personal Care & Service | 0 (0.0%) | 0 (0.0%) |
| Total (Category) | 69 (35.2%) | 127 (64.8%) |
| Total (Overall) | 833 (52.4%) | 757 (47.6%) |
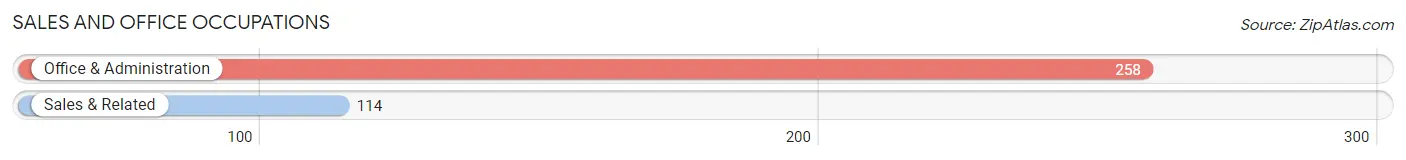
Sales and Office Occupations
The most common Sales and Office occupations in Carrollton are Office & Administration (258 | 16.2%), and Sales & Related (114 | 7.2%).
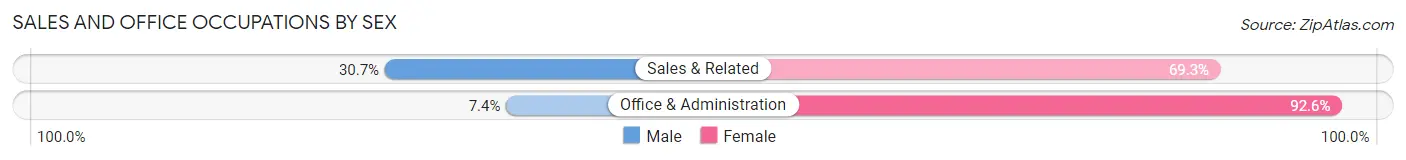
Sales and Office Occupations by Sex
| Occupation | Male | Female |
| Sales & Related | 35 (30.7%) | 79 (69.3%) |
| Office & Administration | 19 (7.4%) | 239 (92.6%) |
| Total (Category) | 54 (14.5%) | 318 (85.5%) |
| Total (Overall) | 833 (52.4%) | 757 (47.6%) |
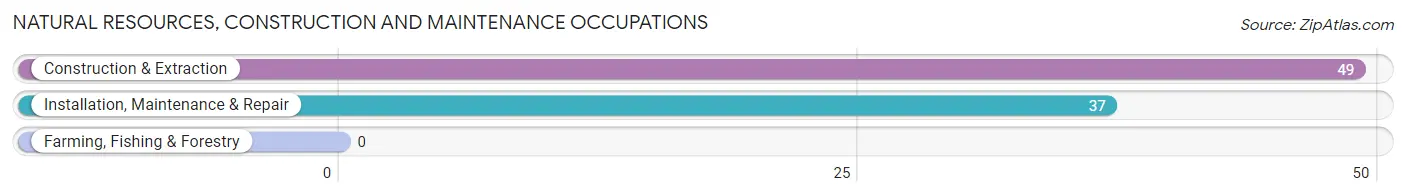
Natural Resources, Construction and Maintenance Occupations
The most common Natural Resources, Construction and Maintenance occupations in Carrollton are Construction & Extraction (49 | 3.1%), and Installation, Maintenance & Repair (37 | 2.3%).
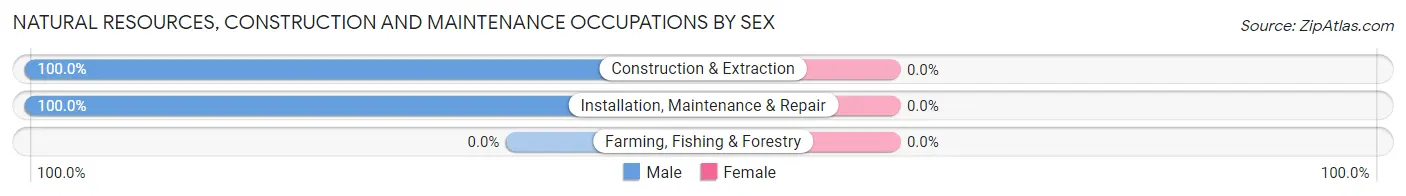
Natural Resources, Construction and Maintenance Occupations by Sex
| Occupation | Male | Female |
| Farming, Fishing & Forestry | 0 (0.0%) | 0 (0.0%) |
| Construction & Extraction | 49 (100.0%) | 0 (0.0%) |
| Installation, Maintenance & Repair | 37 (100.0%) | 0 (0.0%) |
| Total (Category) | 86 (100.0%) | 0 (0.0%) |
| Total (Overall) | 833 (52.4%) | 757 (47.6%) |
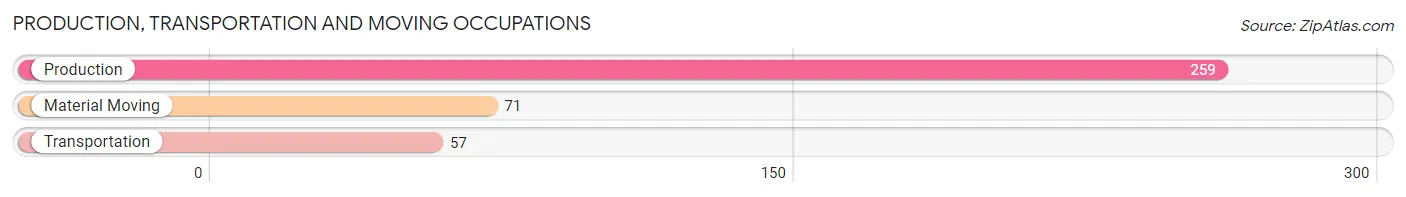
Production, Transportation and Moving Occupations
The most common Production, Transportation and Moving occupations in Carrollton are Production (259 | 16.3%), Material Moving (71 | 4.5%), and Transportation (57 | 3.6%).
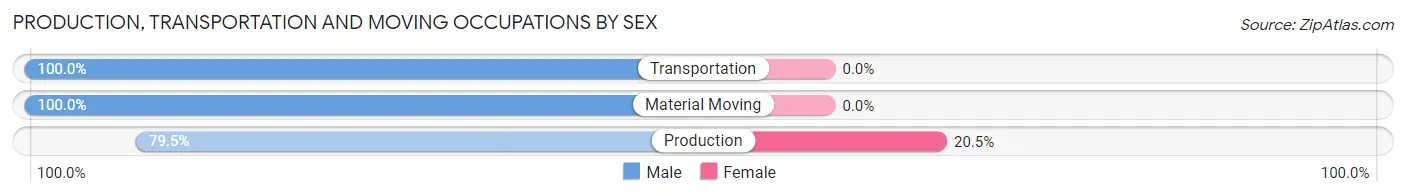
Production, Transportation and Moving Occupations by Sex
| Occupation | Male | Female |
| Production | 206 (79.5%) | 53 (20.5%) |
| Transportation | 57 (100.0%) | 0 (0.0%) |
| Material Moving | 71 (100.0%) | 0 (0.0%) |
| Total (Category) | 334 (86.3%) | 53 (13.7%) |
| Total (Overall) | 833 (52.4%) | 757 (47.6%) |
Employment Industries by Sex in Carrollton
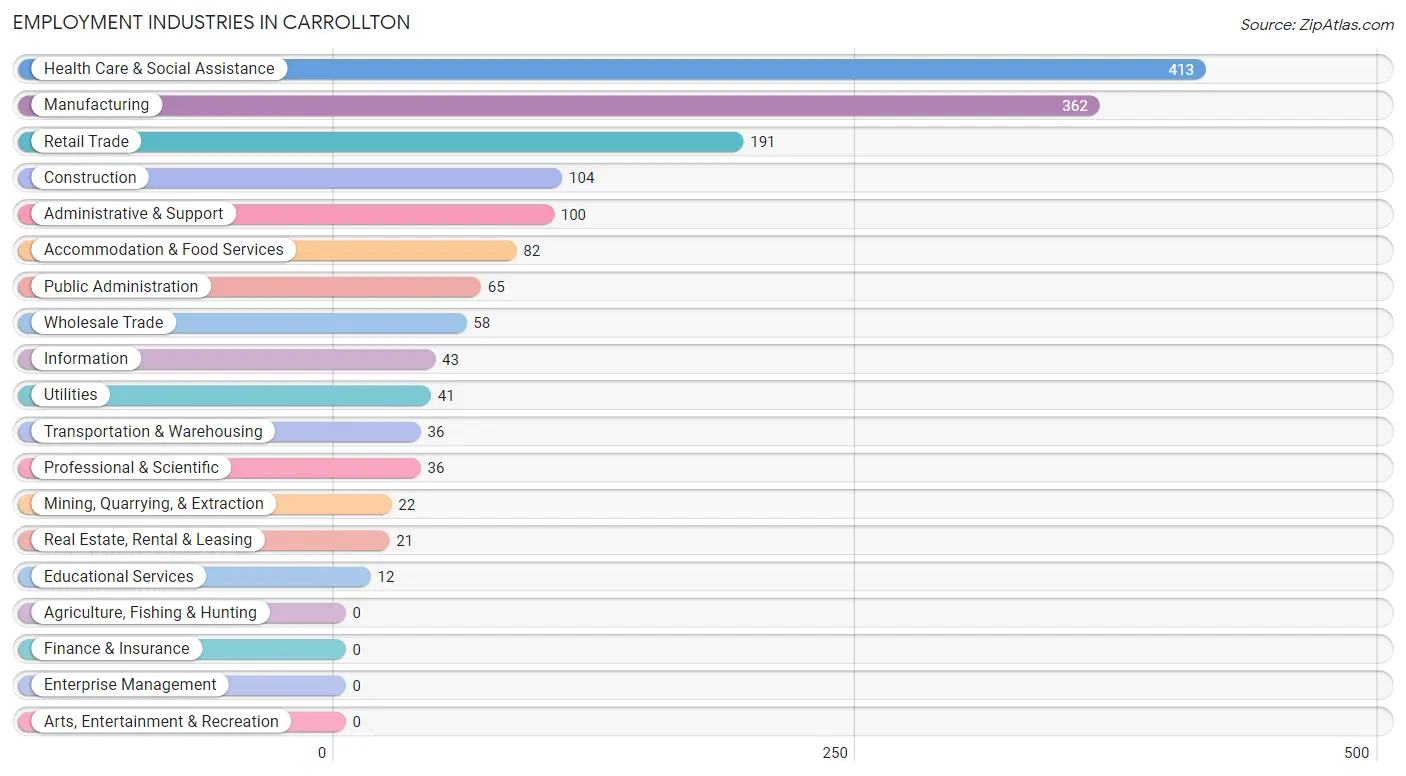
Employment Industries in Carrollton
The major employment industries in Carrollton include Health Care & Social Assistance (413 | 26.0%), Manufacturing (362 | 22.8%), Retail Trade (191 | 12.0%), Construction (104 | 6.5%), and Administrative & Support (100 | 6.3%).
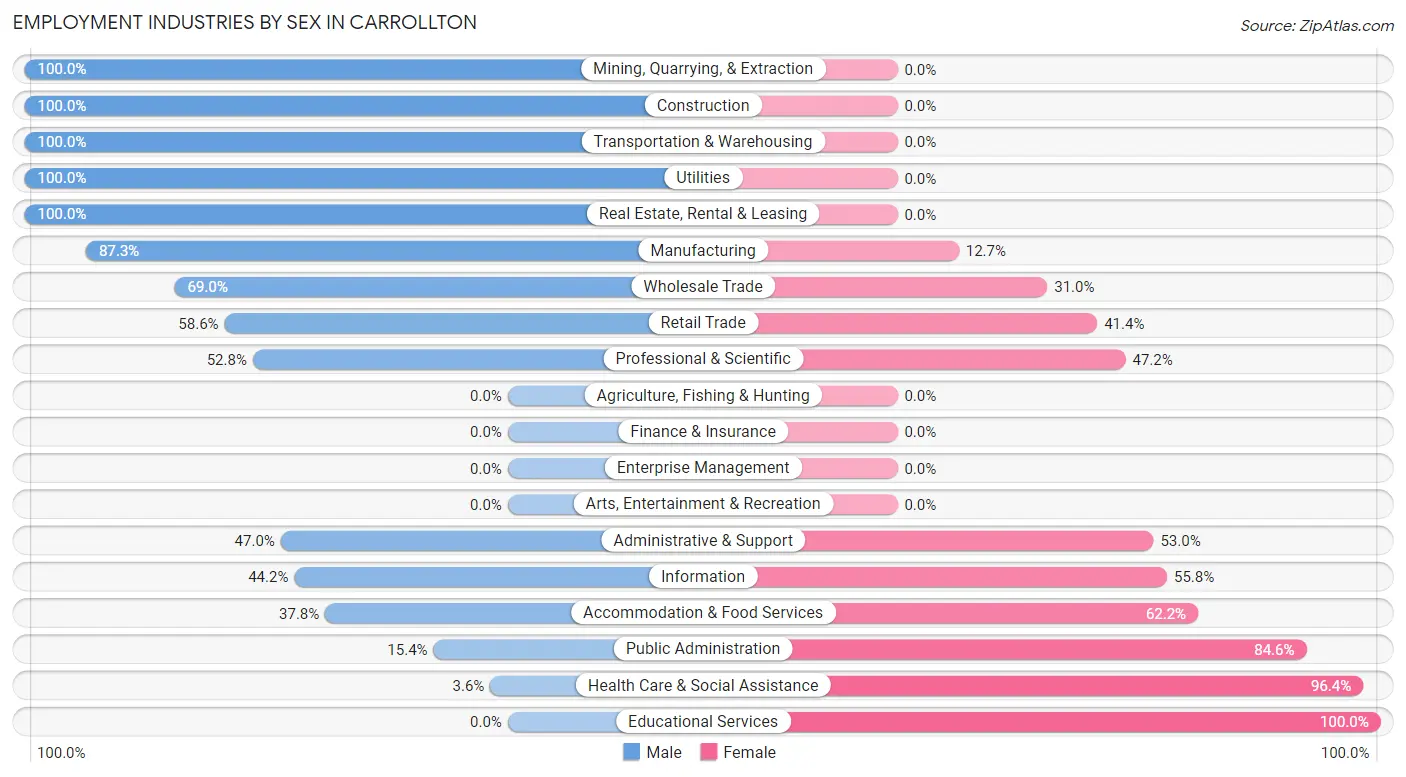
Employment Industries by Sex in Carrollton
The Carrollton industries that see more men than women are Mining, Quarrying, & Extraction (100.0%), Construction (100.0%), and Transportation & Warehousing (100.0%), whereas the industries that tend to have a higher number of women are Educational Services (100.0%), Health Care & Social Assistance (96.4%), and Public Administration (84.6%).
| Industry | Male | Female |
| Agriculture, Fishing & Hunting | 0 (0.0%) | 0 (0.0%) |
| Mining, Quarrying, & Extraction | 22 (100.0%) | 0 (0.0%) |
| Construction | 104 (100.0%) | 0 (0.0%) |
| Manufacturing | 316 (87.3%) | 46 (12.7%) |
| Wholesale Trade | 40 (69.0%) | 18 (31.0%) |
| Retail Trade | 112 (58.6%) | 79 (41.4%) |
| Transportation & Warehousing | 36 (100.0%) | 0 (0.0%) |
| Utilities | 41 (100.0%) | 0 (0.0%) |
| Information | 19 (44.2%) | 24 (55.8%) |
| Finance & Insurance | 0 (0.0%) | 0 (0.0%) |
| Real Estate, Rental & Leasing | 21 (100.0%) | 0 (0.0%) |
| Professional & Scientific | 19 (52.8%) | 17 (47.2%) |
| Enterprise Management | 0 (0.0%) | 0 (0.0%) |
| Administrative & Support | 47 (47.0%) | 53 (53.0%) |
| Educational Services | 0 (0.0%) | 12 (100.0%) |
| Health Care & Social Assistance | 15 (3.6%) | 398 (96.4%) |
| Arts, Entertainment & Recreation | 0 (0.0%) | 0 (0.0%) |
| Accommodation & Food Services | 31 (37.8%) | 51 (62.2%) |
| Public Administration | 10 (15.4%) | 55 (84.6%) |
| Total | 833 (52.4%) | 757 (47.6%) |
Education in Carrollton
School Enrollment in Carrollton
The most common levels of schooling among the 659 students in Carrollton are middle school (287 | 43.5%), high school (173 | 26.3%), and college / undergraduate (102 | 15.5%).
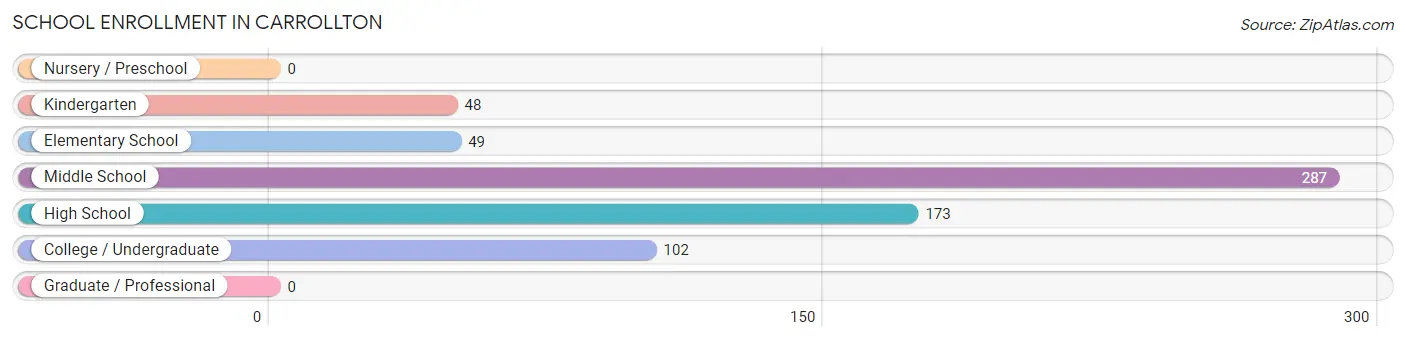
| School Level | # Students | % Students |
| Nursery / Preschool | 0 | 0.0% |
| Kindergarten | 48 | 7.3% |
| Elementary School | 49 | 7.4% |
| Middle School | 287 | 43.5% |
| High School | 173 | 26.3% |
| College / Undergraduate | 102 | 15.5% |
| Graduate / Professional | 0 | 0.0% |
| Total | 659 | 100.0% |
School Enrollment by Age by Funding Source in Carrollton
Out of a total of 659 students who are enrolled in schools in Carrollton, 12 (1.8%) attend a private institution, while the remaining 647 (98.2%) are enrolled in public schools. The age group of 18 to 19 year olds has the highest likelihood of being enrolled in private schools, with 12 (18.8% in the age bracket) enrolled. Conversely, the age group of 5 to 9 year old has the lowest likelihood of being enrolled in a private school, with 97 (100.0% in the age bracket) attending a public institution.
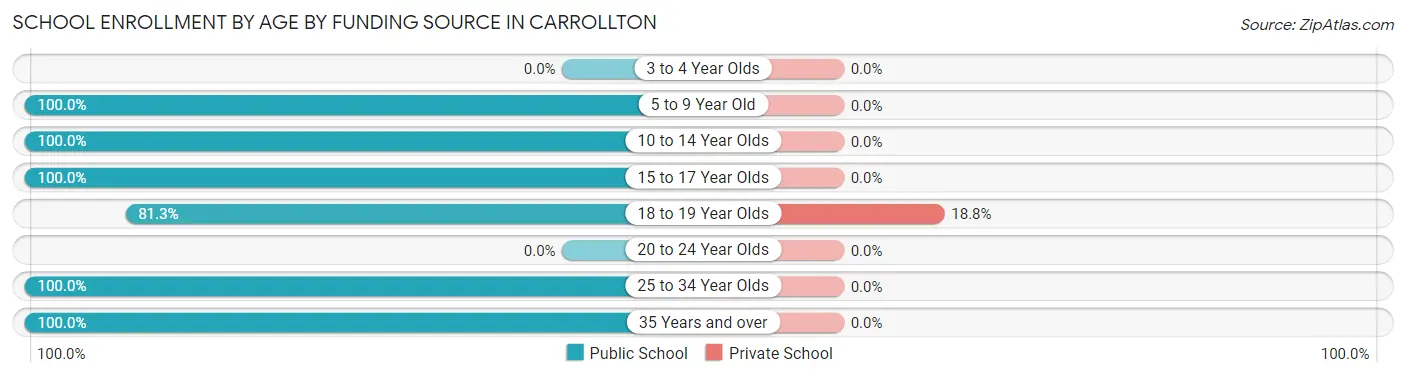
| Age Bracket | Public School | Private School |
| 3 to 4 Year Olds | 0 (0.0%) | 0 (0.0%) |
| 5 to 9 Year Old | 97 (100.0%) | 0 (0.0%) |
| 10 to 14 Year Olds | 256 (100.0%) | 0 (0.0%) |
| 15 to 17 Year Olds | 121 (100.0%) | 0 (0.0%) |
| 18 to 19 Year Olds | 52 (81.2%) | 12 (18.8%) |
| 20 to 24 Year Olds | 0 (0.0%) | 0 (0.0%) |
| 25 to 34 Year Olds | 61 (100.0%) | 0 (0.0%) |
| 35 Years and over | 60 (100.0%) | 0 (0.0%) |
| Total | 647 (98.2%) | 12 (1.8%) |
Educational Attainment by Field of Study in Carrollton
Business (121 | 27.3%), education (100 | 22.5%), social sciences (54 | 12.2%), computers & mathematics (47 | 10.6%), and science & technology (39 | 8.8%) are the most common fields of study among 444 individuals in Carrollton who have obtained a bachelor's degree or higher.
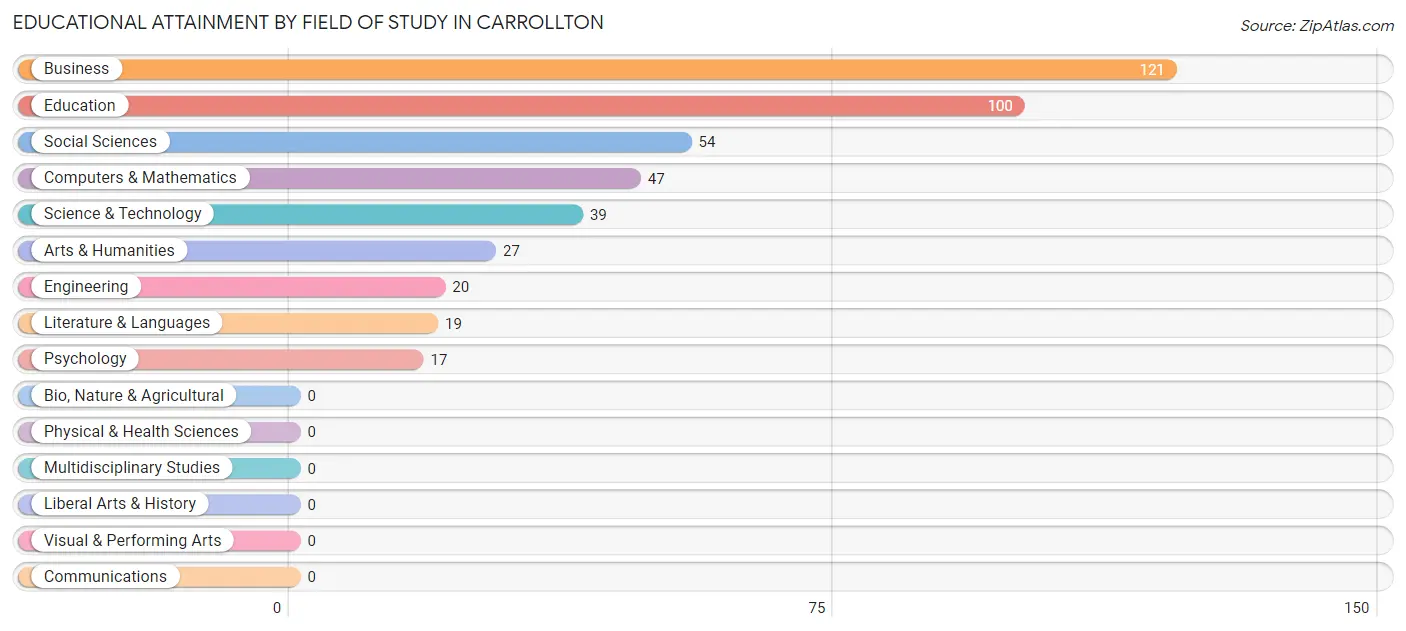
| Field of Study | # Graduates | % Graduates |
| Computers & Mathematics | 47 | 10.6% |
| Bio, Nature & Agricultural | 0 | 0.0% |
| Physical & Health Sciences | 0 | 0.0% |
| Psychology | 17 | 3.8% |
| Social Sciences | 54 | 12.2% |
| Engineering | 20 | 4.5% |
| Multidisciplinary Studies | 0 | 0.0% |
| Science & Technology | 39 | 8.8% |
| Business | 121 | 27.3% |
| Education | 100 | 22.5% |
| Literature & Languages | 19 | 4.3% |
| Liberal Arts & History | 0 | 0.0% |
| Visual & Performing Arts | 0 | 0.0% |
| Communications | 0 | 0.0% |
| Arts & Humanities | 27 | 6.1% |
| Total | 444 | 100.0% |
Transportation & Commute in Carrollton
Vehicle Availability by Sex in Carrollton
The most prevalent vehicle ownership categories in Carrollton are males with 2 vehicles (315, accounting for 38.2%) and females with 2 vehicles (438, making up 42.1%).
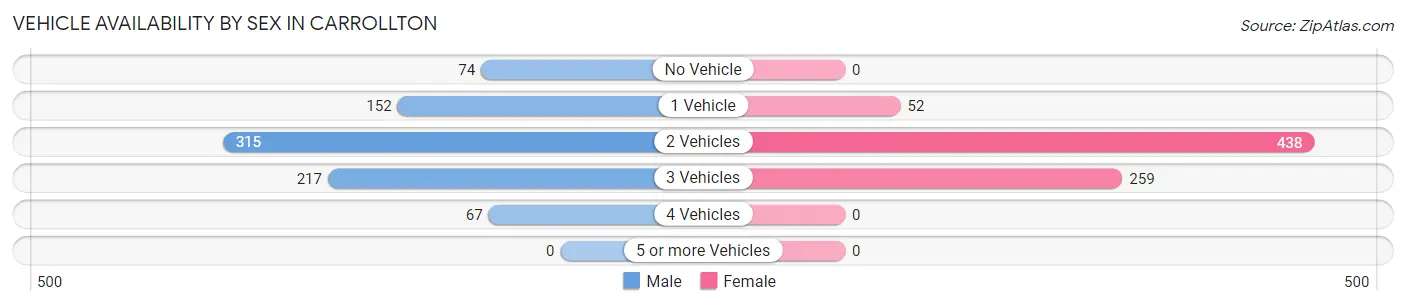
| Vehicles Available | Male | Female |
| No Vehicle | 74 (9.0%) | 0 (0.0%) |
| 1 Vehicle | 152 (18.4%) | 52 (6.9%) |
| 2 Vehicles | 315 (38.2%) | 438 (58.5%) |
| 3 Vehicles | 217 (26.3%) | 259 (34.6%) |
| 4 Vehicles | 67 (8.1%) | 0 (0.0%) |
| 5 or more Vehicles | 0 (0.0%) | 0 (0.0%) |
| Total | 825 (100.0%) | 749 (100.0%) |
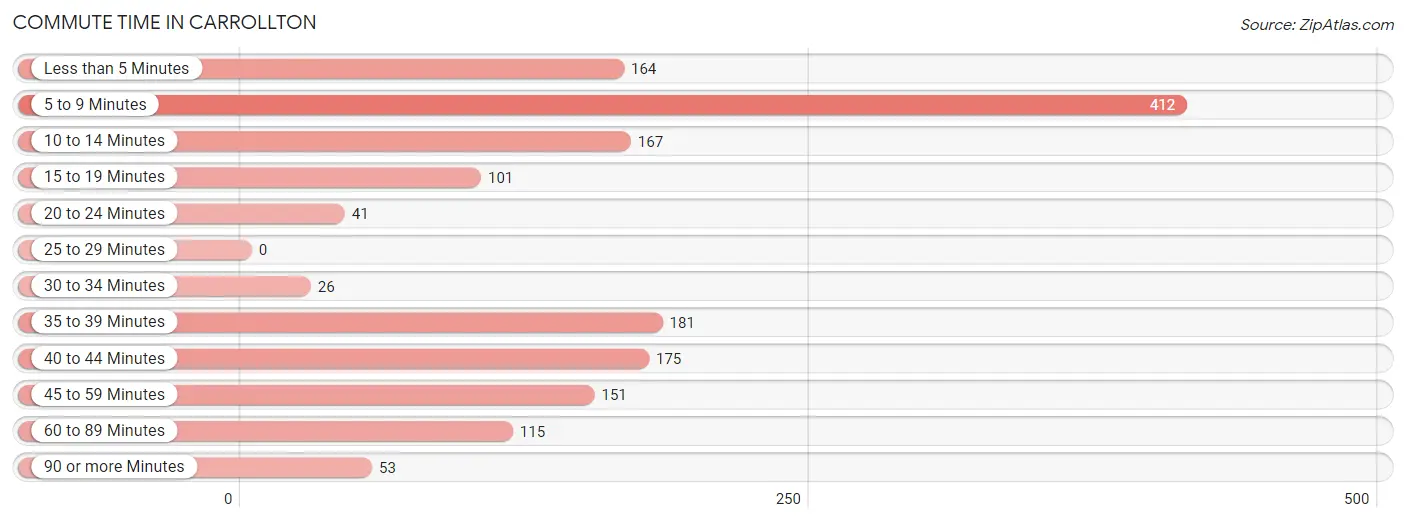
Commute Time in Carrollton
The most frequently occuring commute durations in Carrollton are 5 to 9 minutes (412 commuters, 26.0%), 35 to 39 minutes (181 commuters, 11.4%), and 40 to 44 minutes (175 commuters, 11.0%).
| Commute Time | # Commuters | % Commuters |
| Less than 5 Minutes | 164 | 10.3% |
| 5 to 9 Minutes | 412 | 26.0% |
| 10 to 14 Minutes | 167 | 10.5% |
| 15 to 19 Minutes | 101 | 6.4% |
| 20 to 24 Minutes | 41 | 2.6% |
| 25 to 29 Minutes | 0 | 0.0% |
| 30 to 34 Minutes | 26 | 1.6% |
| 35 to 39 Minutes | 181 | 11.4% |
| 40 to 44 Minutes | 175 | 11.0% |
| 45 to 59 Minutes | 151 | 9.5% |
| 60 to 89 Minutes | 115 | 7.2% |
| 90 or more Minutes | 53 | 3.3% |
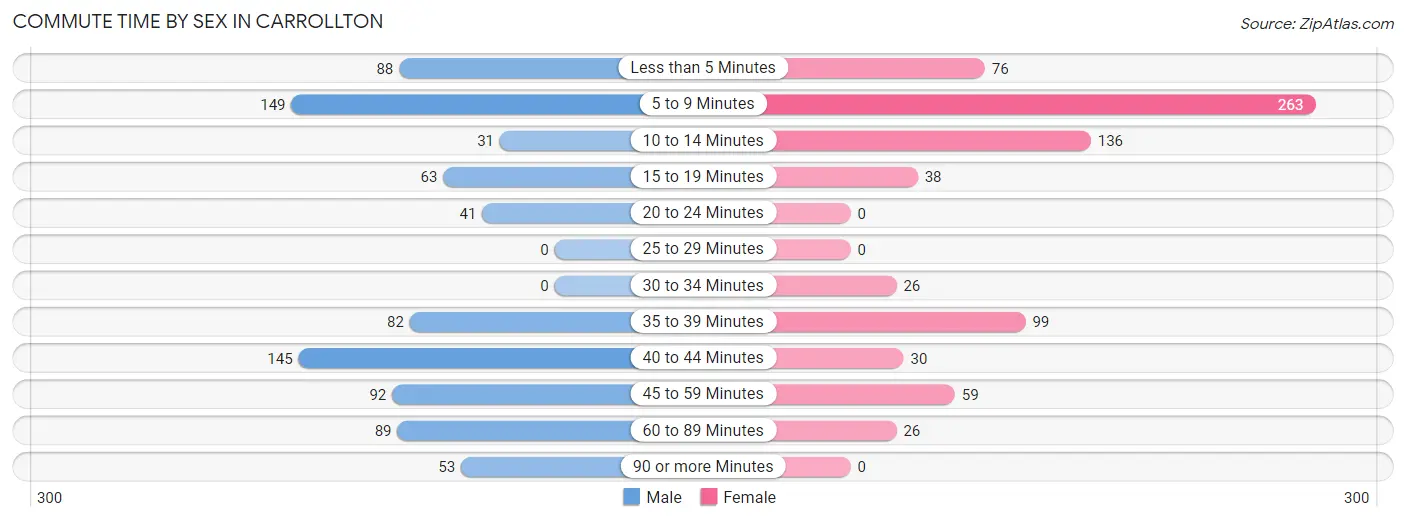
Commute Time by Sex in Carrollton
The most common commute times in Carrollton are 5 to 9 minutes (149 commuters, 17.9%) for males and 5 to 9 minutes (263 commuters, 34.9%) for females.
| Commute Time | Male | Female |
| Less than 5 Minutes | 88 (10.6%) | 76 (10.1%) |
| 5 to 9 Minutes | 149 (17.9%) | 263 (34.9%) |
| 10 to 14 Minutes | 31 (3.7%) | 136 (18.1%) |
| 15 to 19 Minutes | 63 (7.6%) | 38 (5.1%) |
| 20 to 24 Minutes | 41 (4.9%) | 0 (0.0%) |
| 25 to 29 Minutes | 0 (0.0%) | 0 (0.0%) |
| 30 to 34 Minutes | 0 (0.0%) | 26 (3.5%) |
| 35 to 39 Minutes | 82 (9.8%) | 99 (13.2%) |
| 40 to 44 Minutes | 145 (17.4%) | 30 (4.0%) |
| 45 to 59 Minutes | 92 (11.0%) | 59 (7.8%) |
| 60 to 89 Minutes | 89 (10.7%) | 26 (3.5%) |
| 90 or more Minutes | 53 (6.4%) | 0 (0.0%) |
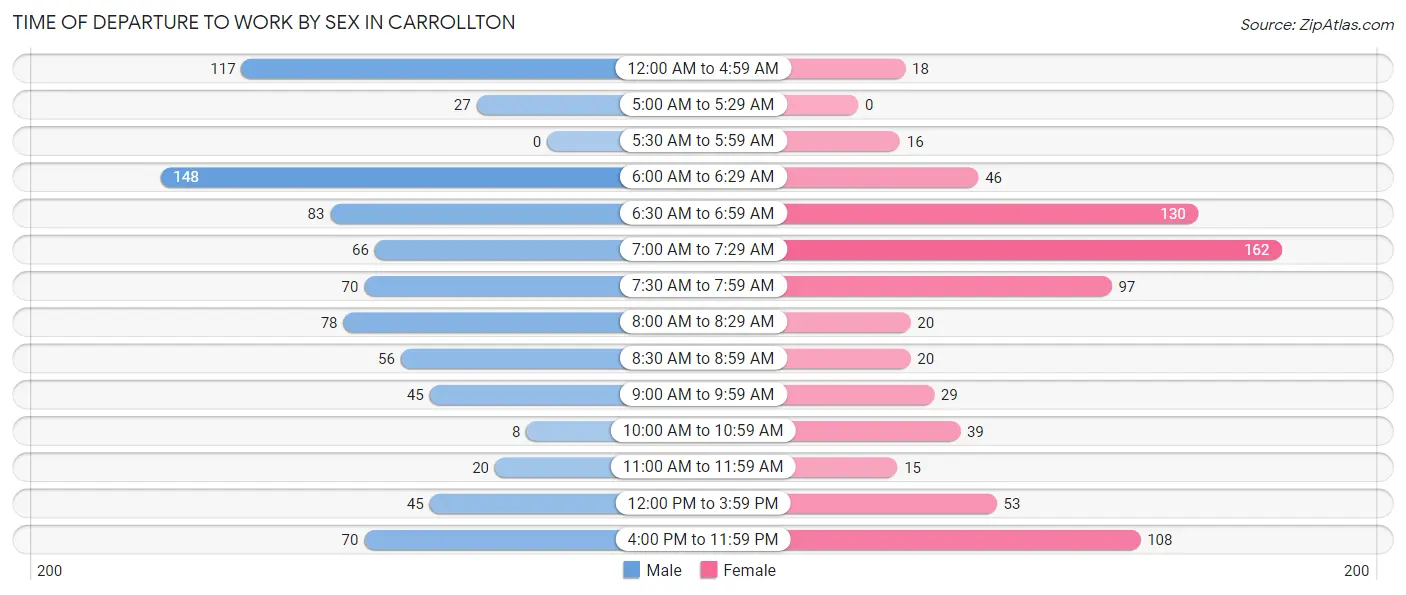
Time of Departure to Work by Sex in Carrollton
The most frequent times of departure to work in Carrollton are 6:00 AM to 6:29 AM (148, 17.8%) for males and 7:00 AM to 7:29 AM (162, 21.5%) for females.
| Time of Departure | Male | Female |
| 12:00 AM to 4:59 AM | 117 (14.1%) | 18 (2.4%) |
| 5:00 AM to 5:29 AM | 27 (3.2%) | 0 (0.0%) |
| 5:30 AM to 5:59 AM | 0 (0.0%) | 16 (2.1%) |
| 6:00 AM to 6:29 AM | 148 (17.8%) | 46 (6.1%) |
| 6:30 AM to 6:59 AM | 83 (10.0%) | 130 (17.3%) |
| 7:00 AM to 7:29 AM | 66 (7.9%) | 162 (21.5%) |
| 7:30 AM to 7:59 AM | 70 (8.4%) | 97 (12.9%) |
| 8:00 AM to 8:29 AM | 78 (9.4%) | 20 (2.7%) |
| 8:30 AM to 8:59 AM | 56 (6.7%) | 20 (2.7%) |
| 9:00 AM to 9:59 AM | 45 (5.4%) | 29 (3.8%) |
| 10:00 AM to 10:59 AM | 8 (1.0%) | 39 (5.2%) |
| 11:00 AM to 11:59 AM | 20 (2.4%) | 15 (2.0%) |
| 12:00 PM to 3:59 PM | 45 (5.4%) | 53 (7.0%) |
| 4:00 PM to 11:59 PM | 70 (8.4%) | 108 (14.3%) |
| Total | 833 (100.0%) | 753 (100.0%) |
Housing Occupancy in Carrollton
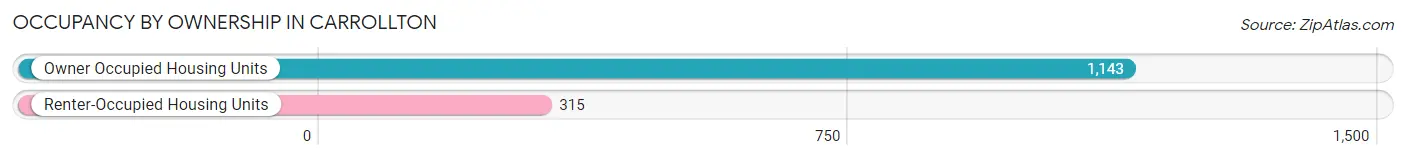
Occupancy by Ownership in Carrollton
Of the total 1,458 dwellings in Carrollton, owner-occupied units account for 1,143 (78.4%), while renter-occupied units make up 315 (21.6%).
| Occupancy | # Housing Units | % Housing Units |
| Owner Occupied Housing Units | 1,143 | 78.4% |
| Renter-Occupied Housing Units | 315 | 21.6% |
| Total Occupied Housing Units | 1,458 | 100.0% |
Occupancy by Household Size in Carrollton
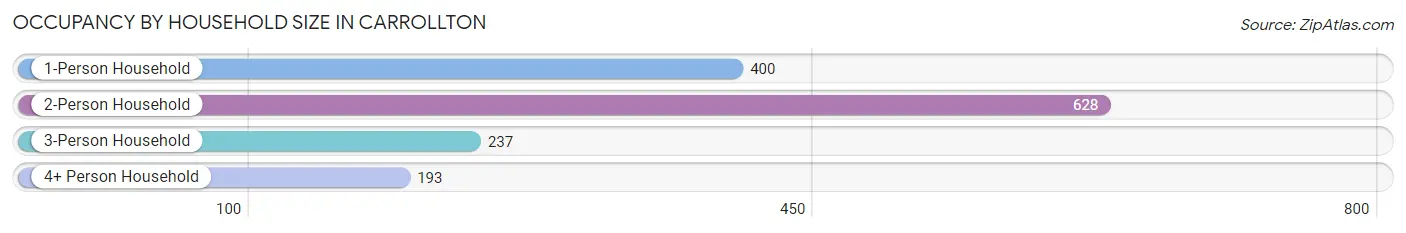
| Household Size | # Housing Units | % Housing Units |
| 1-Person Household | 400 | 27.4% |
| 2-Person Household | 628 | 43.1% |
| 3-Person Household | 237 | 16.3% |
| 4+ Person Household | 193 | 13.2% |
| Total Housing Units | 1,458 | 100.0% |
Occupancy by Ownership by Household Size in Carrollton
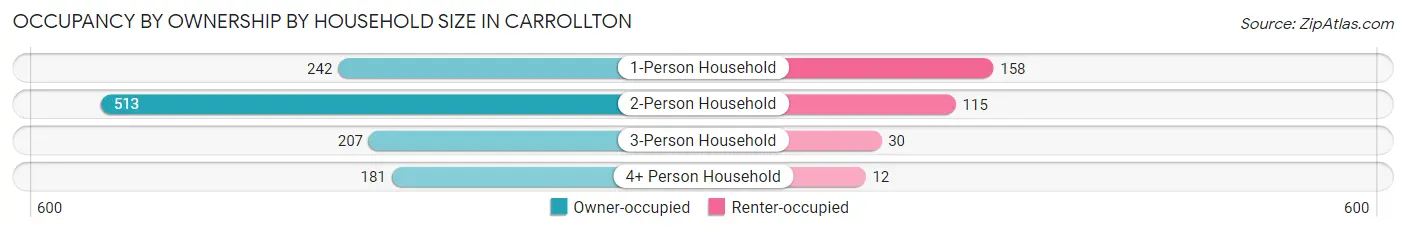
| Household Size | Owner-occupied | Renter-occupied |
| 1-Person Household | 242 (60.5%) | 158 (39.5%) |
| 2-Person Household | 513 (81.7%) | 115 (18.3%) |
| 3-Person Household | 207 (87.3%) | 30 (12.7%) |
| 4+ Person Household | 181 (93.8%) | 12 (6.2%) |
| Total Housing Units | 1,143 (78.4%) | 315 (21.6%) |
Occupancy by Educational Attainment in Carrollton
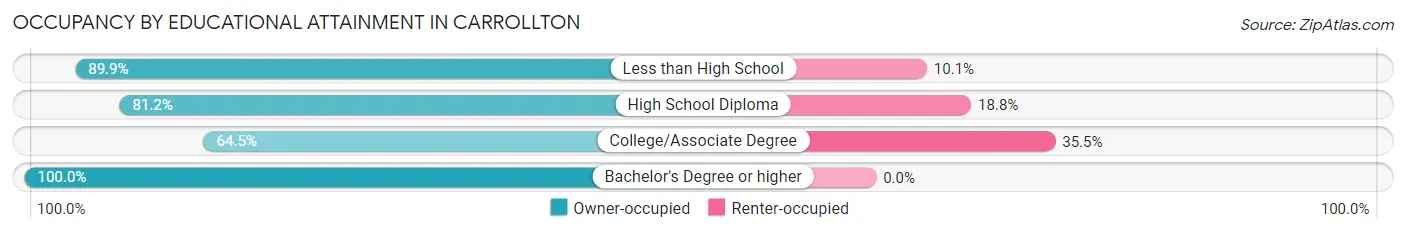
| Household Size | Owner-occupied | Renter-occupied |
| Less than High School | 161 (89.9%) | 18 (10.1%) |
| High School Diploma | 319 (81.2%) | 74 (18.8%) |
| College/Associate Degree | 405 (64.5%) | 223 (35.5%) |
| Bachelor's Degree or higher | 258 (100.0%) | 0 (0.0%) |
Occupancy by Age of Householder in Carrollton
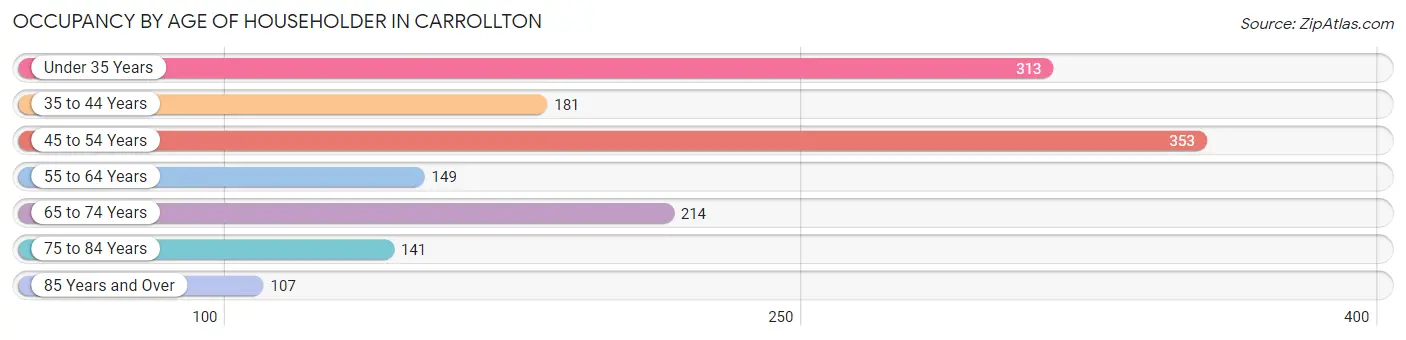
| Age Bracket | # Households | % Households |
| Under 35 Years | 313 | 21.5% |
| 35 to 44 Years | 181 | 12.4% |
| 45 to 54 Years | 353 | 24.2% |
| 55 to 64 Years | 149 | 10.2% |
| 65 to 74 Years | 214 | 14.7% |
| 75 to 84 Years | 141 | 9.7% |
| 85 Years and Over | 107 | 7.3% |
| Total | 1,458 | 100.0% |
Housing Finances in Carrollton
Median Income by Occupancy in Carrollton
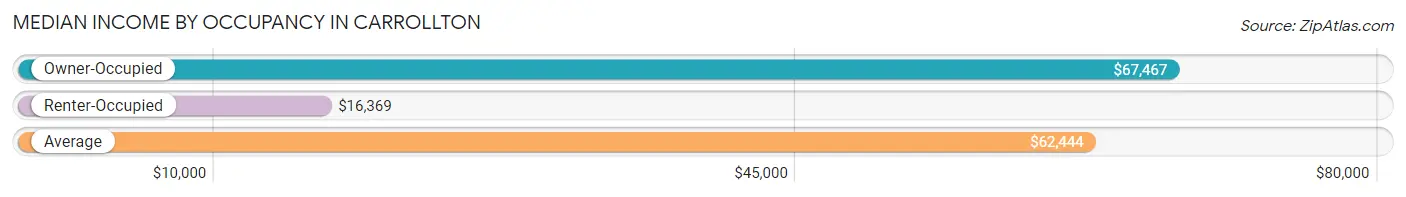
| Occupancy Type | # Households | Median Income |
| Owner-Occupied | 1,143 (78.4%) | $67,467 |
| Renter-Occupied | 315 (21.6%) | $16,369 |
| Average | 1,458 (100.0%) | $62,444 |
Occupancy by Householder Income Bracket in Carrollton
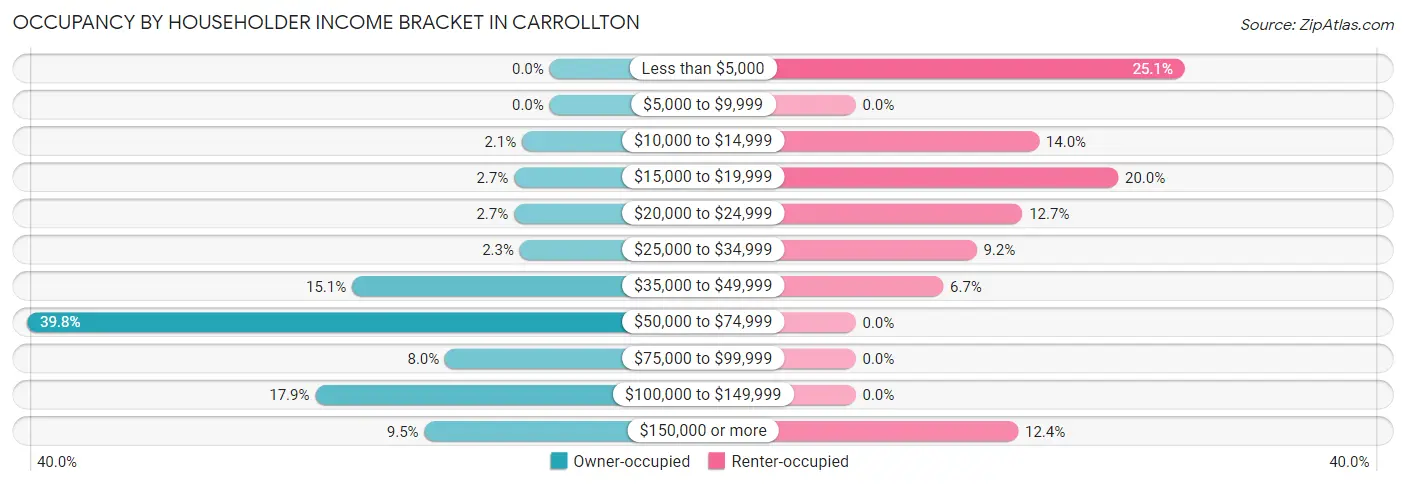
| Income Bracket | Owner-occupied | Renter-occupied |
| Less than $5,000 | 0 (0.0%) | 79 (25.1%) |
| $5,000 to $9,999 | 0 (0.0%) | 0 (0.0%) |
| $10,000 to $14,999 | 24 (2.1%) | 44 (14.0%) |
| $15,000 to $19,999 | 31 (2.7%) | 63 (20.0%) |
| $20,000 to $24,999 | 31 (2.7%) | 40 (12.7%) |
| $25,000 to $34,999 | 26 (2.3%) | 29 (9.2%) |
| $35,000 to $49,999 | 172 (15.0%) | 21 (6.7%) |
| $50,000 to $74,999 | 455 (39.8%) | 0 (0.0%) |
| $75,000 to $99,999 | 91 (8.0%) | 0 (0.0%) |
| $100,000 to $149,999 | 204 (17.8%) | 0 (0.0%) |
| $150,000 or more | 109 (9.5%) | 39 (12.4%) |
| Total | 1,143 (100.0%) | 315 (100.0%) |
Monthly Housing Cost Tiers in Carrollton
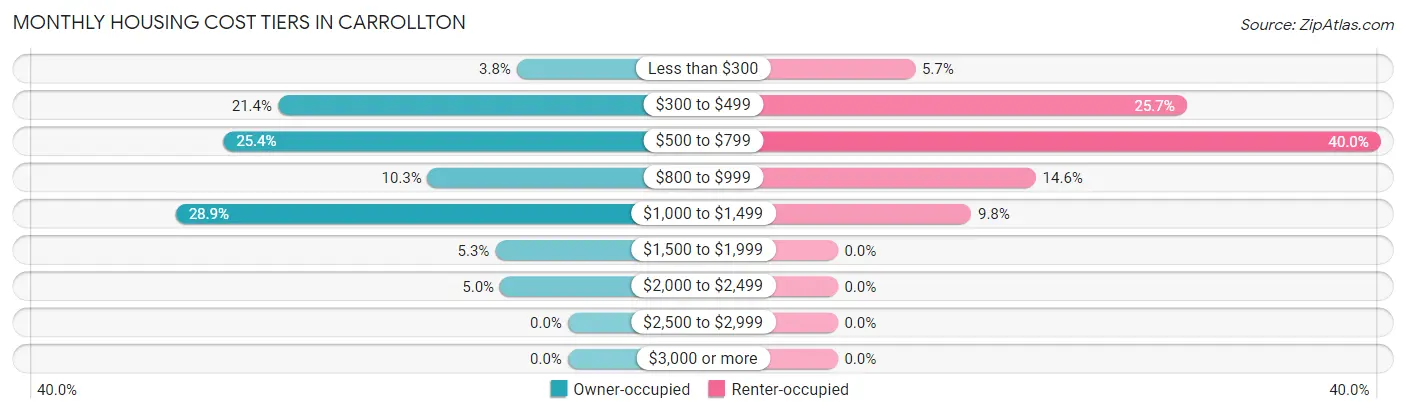
| Monthly Cost | Owner-occupied | Renter-occupied |
| Less than $300 | 43 (3.8%) | 18 (5.7%) |
| $300 to $499 | 244 (21.3%) | 81 (25.7%) |
| $500 to $799 | 290 (25.4%) | 126 (40.0%) |
| $800 to $999 | 118 (10.3%) | 46 (14.6%) |
| $1,000 to $1,499 | 330 (28.9%) | 31 (9.8%) |
| $1,500 to $1,999 | 61 (5.3%) | 0 (0.0%) |
| $2,000 to $2,499 | 57 (5.0%) | 0 (0.0%) |
| $2,500 to $2,999 | 0 (0.0%) | 0 (0.0%) |
| $3,000 or more | 0 (0.0%) | 0 (0.0%) |
| Total | 1,143 (100.0%) | 315 (100.0%) |
Physical Housing Characteristics in Carrollton
Housing Structures in Carrollton
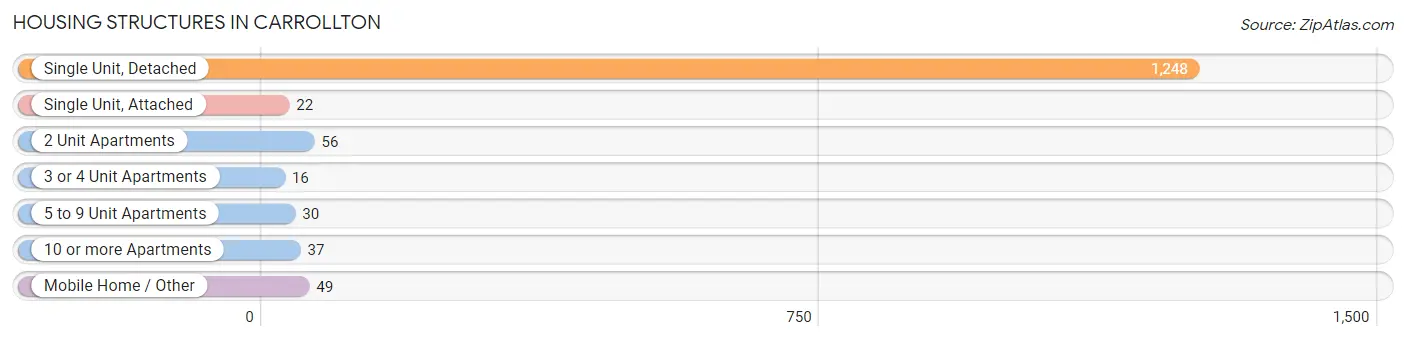
| Structure Type | # Housing Units | % Housing Units |
| Single Unit, Detached | 1,248 | 85.6% |
| Single Unit, Attached | 22 | 1.5% |
| 2 Unit Apartments | 56 | 3.8% |
| 3 or 4 Unit Apartments | 16 | 1.1% |
| 5 to 9 Unit Apartments | 30 | 2.1% |
| 10 or more Apartments | 37 | 2.5% |
| Mobile Home / Other | 49 | 3.4% |
| Total | 1,458 | 100.0% |
Housing Structures by Occupancy in Carrollton
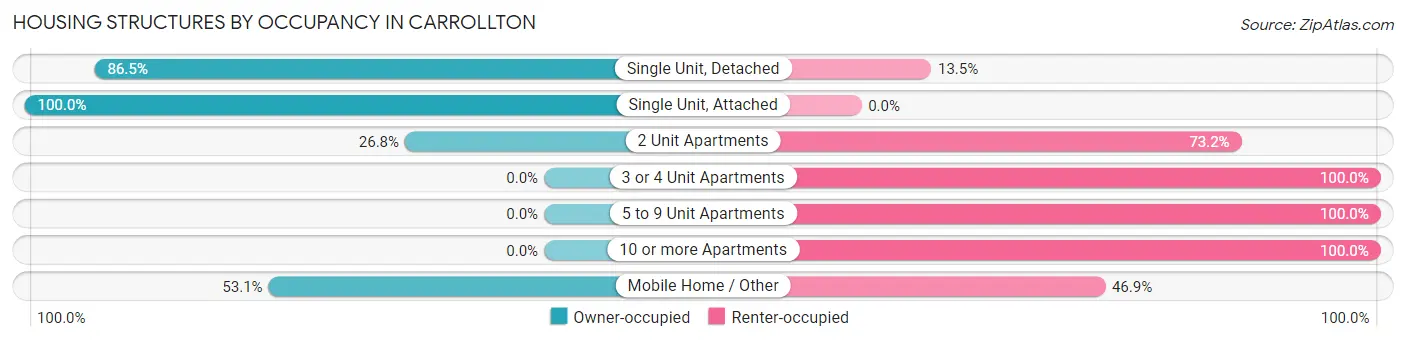
| Structure Type | Owner-occupied | Renter-occupied |
| Single Unit, Detached | 1,080 (86.5%) | 168 (13.5%) |
| Single Unit, Attached | 22 (100.0%) | 0 (0.0%) |
| 2 Unit Apartments | 15 (26.8%) | 41 (73.2%) |
| 3 or 4 Unit Apartments | 0 (0.0%) | 16 (100.0%) |
| 5 to 9 Unit Apartments | 0 (0.0%) | 30 (100.0%) |
| 10 or more Apartments | 0 (0.0%) | 37 (100.0%) |
| Mobile Home / Other | 26 (53.1%) | 23 (46.9%) |
| Total | 1,143 (78.4%) | 315 (21.6%) |
Housing Structures by Number of Rooms in Carrollton
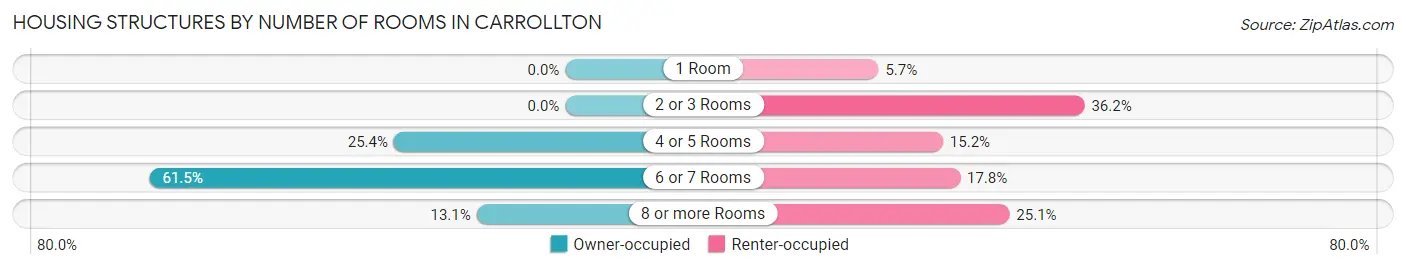
| Number of Rooms | Owner-occupied | Renter-occupied |
| 1 Room | 0 (0.0%) | 18 (5.7%) |
| 2 or 3 Rooms | 0 (0.0%) | 114 (36.2%) |
| 4 or 5 Rooms | 290 (25.4%) | 48 (15.2%) |
| 6 or 7 Rooms | 703 (61.5%) | 56 (17.8%) |
| 8 or more Rooms | 150 (13.1%) | 79 (25.1%) |
| Total | 1,143 (100.0%) | 315 (100.0%) |
Housing Structure by Heating Type in Carrollton
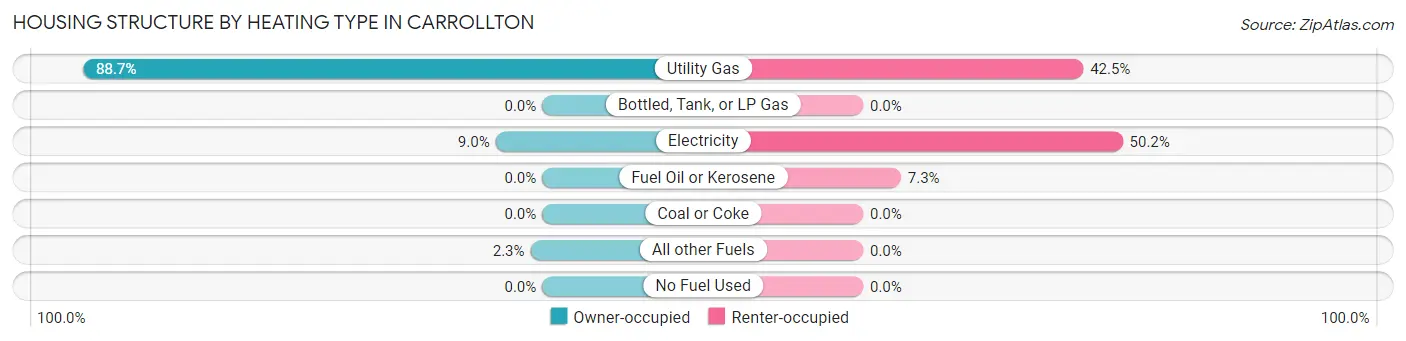
| Heating Type | Owner-occupied | Renter-occupied |
| Utility Gas | 1,014 (88.7%) | 134 (42.5%) |
| Bottled, Tank, or LP Gas | 0 (0.0%) | 0 (0.0%) |
| Electricity | 103 (9.0%) | 158 (50.2%) |
| Fuel Oil or Kerosene | 0 (0.0%) | 23 (7.3%) |
| Coal or Coke | 0 (0.0%) | 0 (0.0%) |
| All other Fuels | 26 (2.3%) | 0 (0.0%) |
| No Fuel Used | 0 (0.0%) | 0 (0.0%) |
| Total | 1,143 (100.0%) | 315 (100.0%) |
Household Vehicle Usage in Carrollton
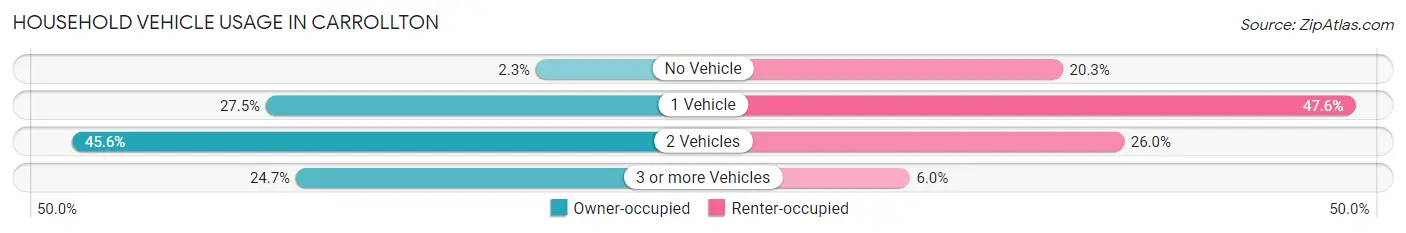
| Vehicles per Household | Owner-occupied | Renter-occupied |
| No Vehicle | 26 (2.3%) | 64 (20.3%) |
| 1 Vehicle | 314 (27.5%) | 150 (47.6%) |
| 2 Vehicles | 521 (45.6%) | 82 (26.0%) |
| 3 or more Vehicles | 282 (24.7%) | 19 (6.0%) |
| Total | 1,143 (100.0%) | 315 (100.0%) |
Real Estate & Mortgages in Carrollton
Real Estate and Mortgage Overview in Carrollton
| Characteristic | Without Mortgage | With Mortgage |
| Housing Units | 441 | 702 |
| Median Property Value | $90,900 | $134,100 |
| Median Household Income | $61,125 | $98 |
| Monthly Housing Costs | $415 | $0 |
| Real Estate Taxes | $1,314 | $28 |
Property Value by Mortgage Status in Carrollton
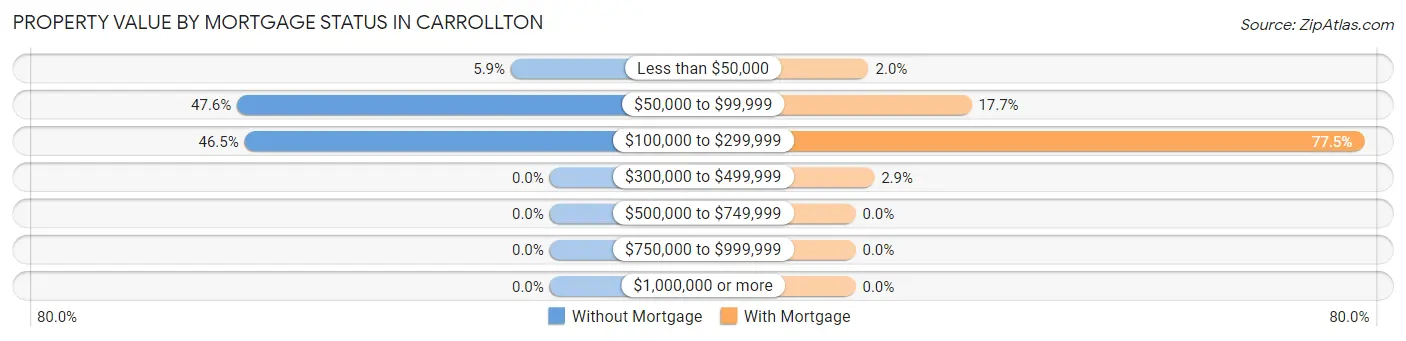
| Property Value | Without Mortgage | With Mortgage |
| Less than $50,000 | 26 (5.9%) | 14 (2.0%) |
| $50,000 to $99,999 | 210 (47.6%) | 124 (17.7%) |
| $100,000 to $299,999 | 205 (46.5%) | 544 (77.5%) |
| $300,000 to $499,999 | 0 (0.0%) | 20 (2.9%) |
| $500,000 to $749,999 | 0 (0.0%) | 0 (0.0%) |
| $750,000 to $999,999 | 0 (0.0%) | 0 (0.0%) |
| $1,000,000 or more | 0 (0.0%) | 0 (0.0%) |
| Total | 441 (100.0%) | 702 (100.0%) |
Household Income by Mortgage Status in Carrollton
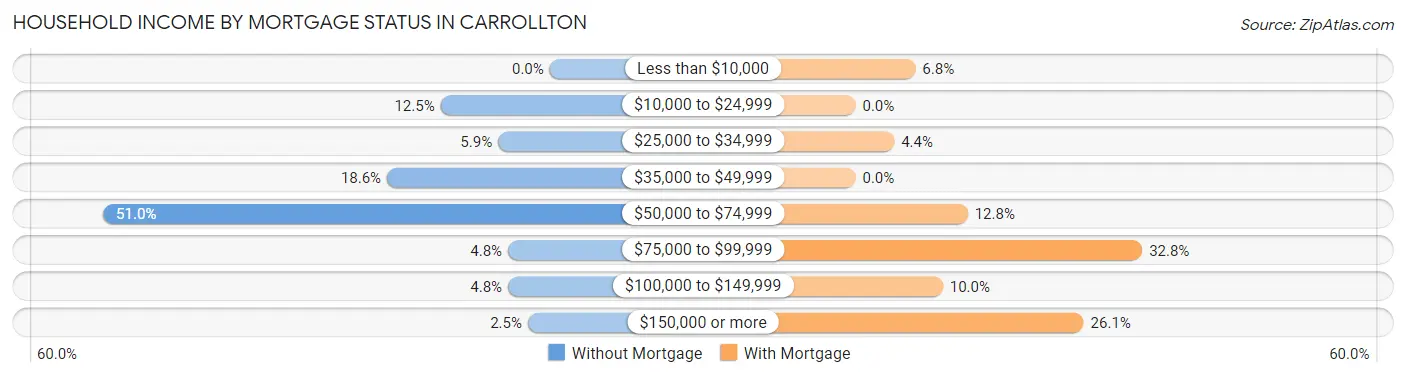
| Household Income | Without Mortgage | With Mortgage |
| Less than $10,000 | 0 (0.0%) | 48 (6.8%) |
| $10,000 to $24,999 | 55 (12.5%) | 0 (0.0%) |
| $25,000 to $34,999 | 26 (5.9%) | 31 (4.4%) |
| $35,000 to $49,999 | 82 (18.6%) | 0 (0.0%) |
| $50,000 to $74,999 | 225 (51.0%) | 90 (12.8%) |
| $75,000 to $99,999 | 21 (4.8%) | 230 (32.8%) |
| $100,000 to $149,999 | 21 (4.8%) | 70 (10.0%) |
| $150,000 or more | 11 (2.5%) | 183 (26.1%) |
| Total | 441 (100.0%) | 702 (100.0%) |
Property Value to Household Income Ratio in Carrollton
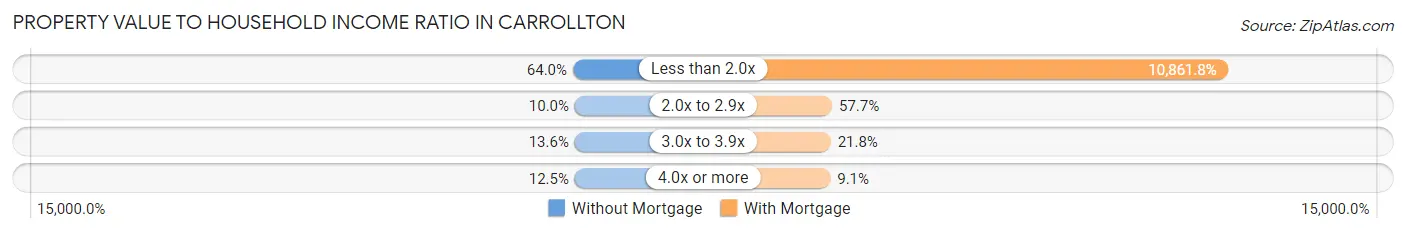
| Value-to-Income Ratio | Without Mortgage | With Mortgage |
| Less than 2.0x | 282 (63.9%) | 76,250 (10,861.8%) |
| 2.0x to 2.9x | 44 (10.0%) | 405 (57.7%) |
| 3.0x to 3.9x | 60 (13.6%) | 153 (21.8%) |
| 4.0x or more | 55 (12.5%) | 64 (9.1%) |
| Total | 441 (100.0%) | 702 (100.0%) |
Real Estate Taxes by Mortgage Status in Carrollton
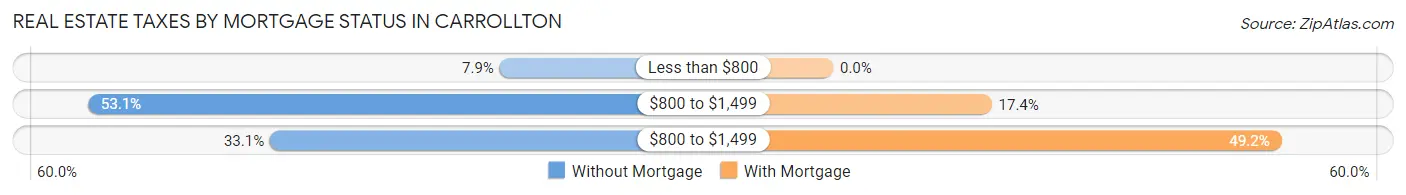
| Property Taxes | Without Mortgage | With Mortgage |
| Less than $800 | 35 (7.9%) | 0 (0.0%) |
| $800 to $1,499 | 234 (53.1%) | 122 (17.4%) |
| $800 to $1,499 | 146 (33.1%) | 345 (49.1%) |
| Total | 441 (100.0%) | 702 (100.0%) |
Health & Disability in Carrollton
Health Insurance Coverage by Age in Carrollton
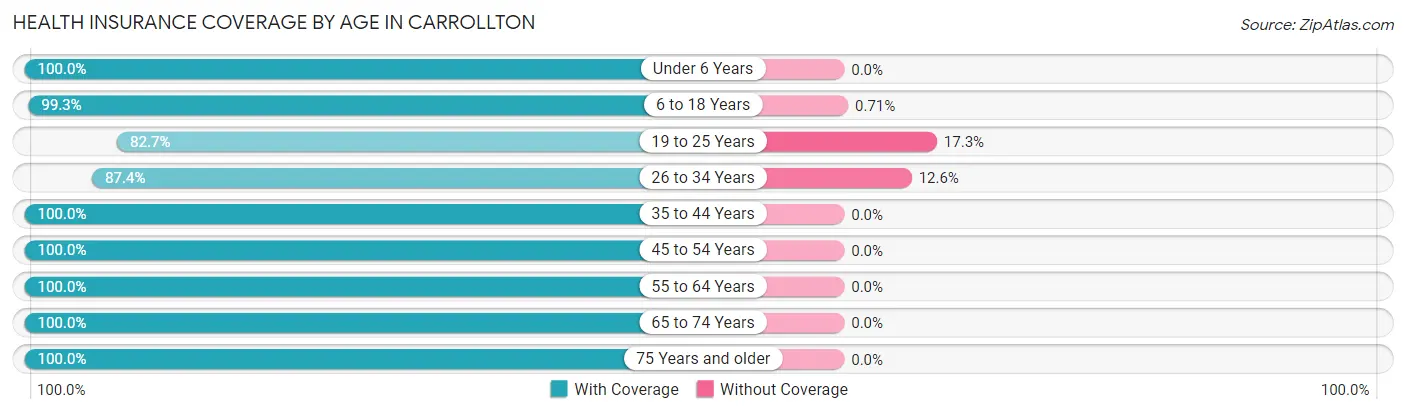
| Age Bracket | With Coverage | Without Coverage |
| Under 6 Years | 121 (100.0%) | 0 (0.0%) |
| 6 to 18 Years | 561 (99.3%) | 4 (0.7%) |
| 19 to 25 Years | 91 (82.7%) | 19 (17.3%) |
| 26 to 34 Years | 452 (87.4%) | 65 (12.6%) |
| 35 to 44 Years | 269 (100.0%) | 0 (0.0%) |
| 45 to 54 Years | 500 (100.0%) | 0 (0.0%) |
| 55 to 64 Years | 352 (100.0%) | 0 (0.0%) |
| 65 to 74 Years | 344 (100.0%) | 0 (0.0%) |
| 75 Years and older | 414 (100.0%) | 0 (0.0%) |
| Total | 3,104 (97.2%) | 88 (2.8%) |
Health Insurance Coverage by Citizenship Status in Carrollton
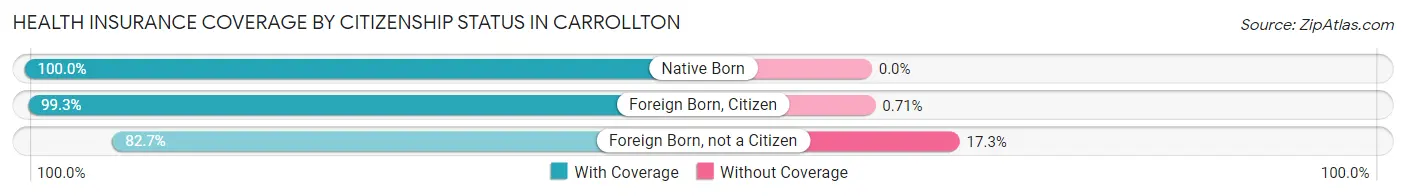
| Citizenship Status | With Coverage | Without Coverage |
| Native Born | 121 (100.0%) | 0 (0.0%) |
| Foreign Born, Citizen | 561 (99.3%) | 4 (0.7%) |
| Foreign Born, not a Citizen | 91 (82.7%) | 19 (17.3%) |
Health Insurance Coverage by Household Income in Carrollton
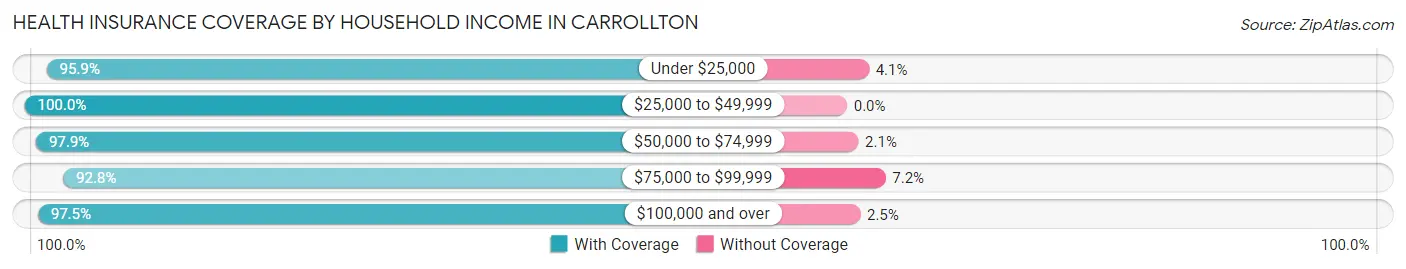
| Household Income | With Coverage | Without Coverage |
| Under $25,000 | 467 (95.9%) | 20 (4.1%) |
| $25,000 to $49,999 | 398 (100.0%) | 0 (0.0%) |
| $50,000 to $74,999 | 1,013 (97.9%) | 22 (2.1%) |
| $75,000 to $99,999 | 244 (92.8%) | 19 (7.2%) |
| $100,000 and over | 903 (97.5%) | 23 (2.5%) |
Public vs Private Health Insurance Coverage by Age in Carrollton
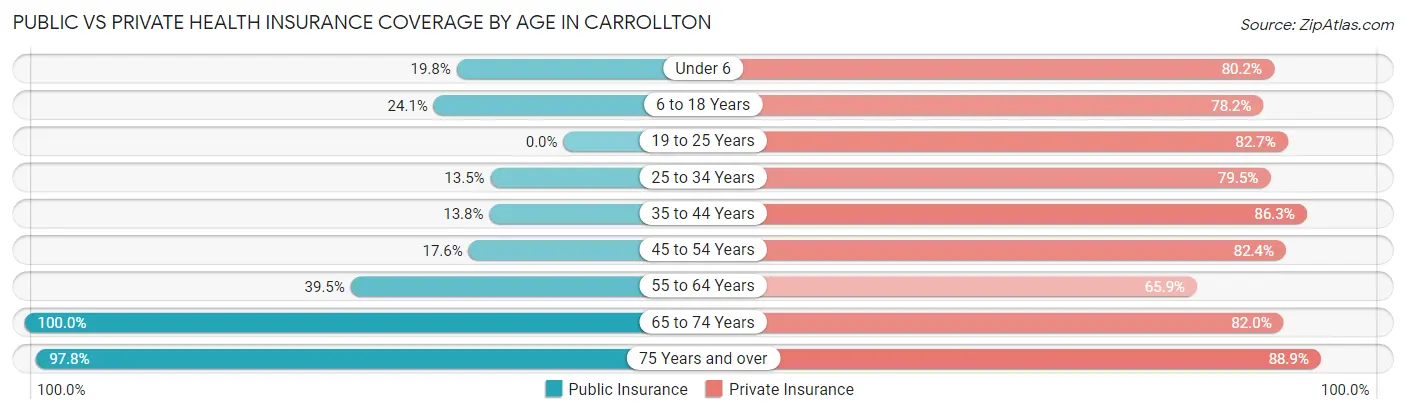
| Age Bracket | Public Insurance | Private Insurance |
| Under 6 | 24 (19.8%) | 97 (80.2%) |
| 6 to 18 Years | 136 (24.1%) | 442 (78.2%) |
| 19 to 25 Years | 0 (0.0%) | 91 (82.7%) |
| 25 to 34 Years | 70 (13.5%) | 411 (79.5%) |
| 35 to 44 Years | 37 (13.8%) | 232 (86.3%) |
| 45 to 54 Years | 88 (17.6%) | 412 (82.4%) |
| 55 to 64 Years | 139 (39.5%) | 232 (65.9%) |
| 65 to 74 Years | 344 (100.0%) | 282 (82.0%) |
| 75 Years and over | 405 (97.8%) | 368 (88.9%) |
| Total | 1,243 (38.9%) | 2,567 (80.4%) |
Disability Status by Sex by Age in Carrollton
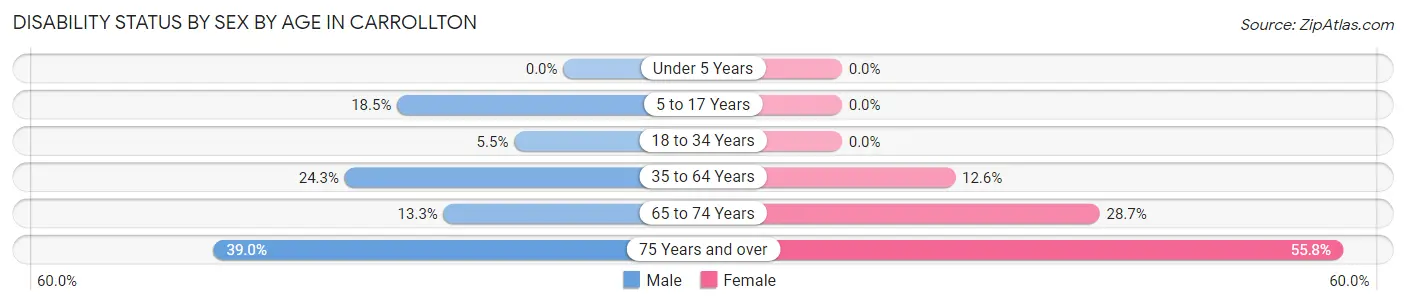
| Age Bracket | Male | Female |
| Under 5 Years | 0 (0.0%) | 0 (0.0%) |
| 5 to 17 Years | 42 (18.5%) | 0 (0.0%) |
| 18 to 34 Years | 22 (5.5%) | 0 (0.0%) |
| 35 to 64 Years | 130 (24.3%) | 74 (12.6%) |
| 65 to 74 Years | 18 (13.3%) | 60 (28.7%) |
| 75 Years and over | 74 (39.0%) | 125 (55.8%) |
Disability Class by Sex by Age in Carrollton
Disability Class: Hearing Difficulty
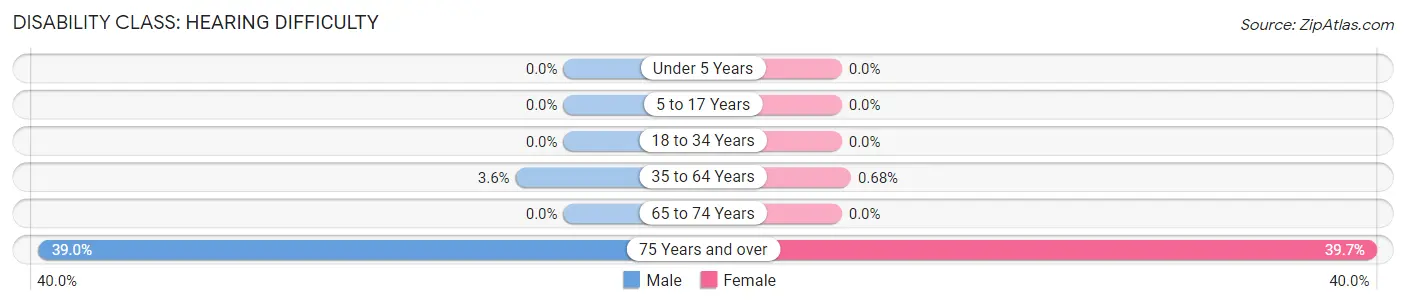
| Age Bracket | Male | Female |
| Under 5 Years | 0 (0.0%) | 0 (0.0%) |
| 5 to 17 Years | 0 (0.0%) | 0 (0.0%) |
| 18 to 34 Years | 0 (0.0%) | 0 (0.0%) |
| 35 to 64 Years | 19 (3.6%) | 4 (0.7%) |
| 65 to 74 Years | 0 (0.0%) | 0 (0.0%) |
| 75 Years and over | 74 (39.0%) | 89 (39.7%) |
Disability Class: Vision Difficulty
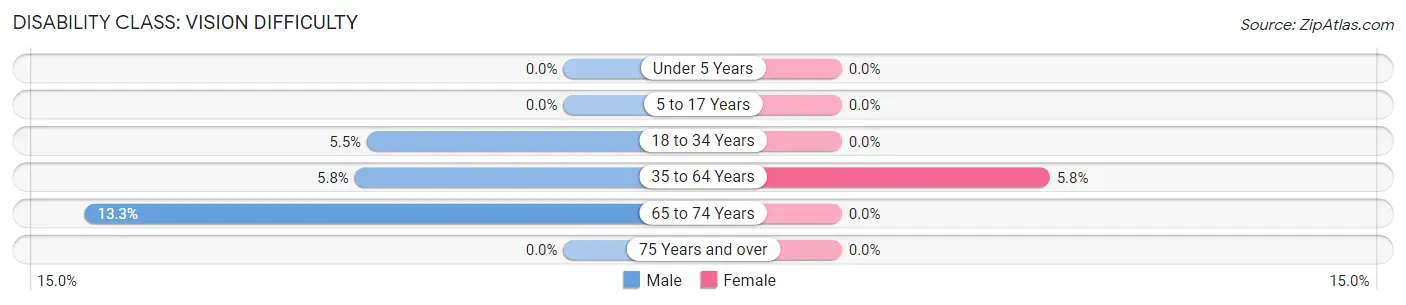
| Age Bracket | Male | Female |
| Under 5 Years | 0 (0.0%) | 0 (0.0%) |
| 5 to 17 Years | 0 (0.0%) | 0 (0.0%) |
| 18 to 34 Years | 22 (5.5%) | 0 (0.0%) |
| 35 to 64 Years | 31 (5.8%) | 34 (5.8%) |
| 65 to 74 Years | 18 (13.3%) | 0 (0.0%) |
| 75 Years and over | 0 (0.0%) | 0 (0.0%) |
Disability Class: Cognitive Difficulty
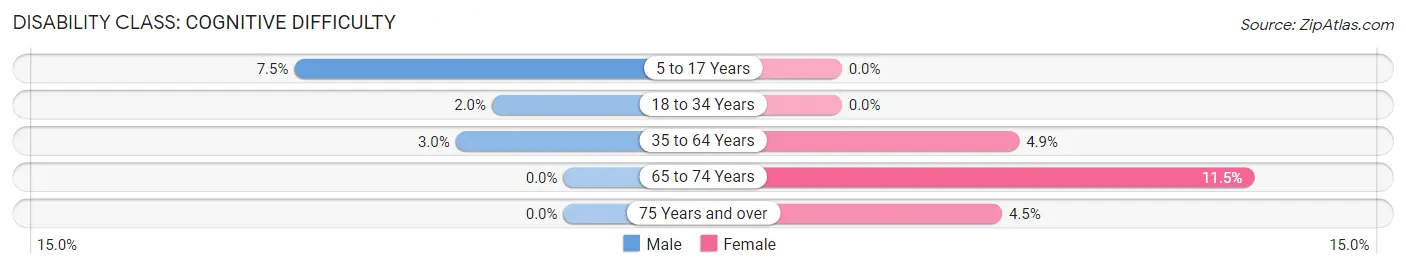
| Age Bracket | Male | Female |
| 5 to 17 Years | 17 (7.5%) | 0 (0.0%) |
| 18 to 34 Years | 8 (2.0%) | 0 (0.0%) |
| 35 to 64 Years | 16 (3.0%) | 29 (4.9%) |
| 65 to 74 Years | 0 (0.0%) | 24 (11.5%) |
| 75 Years and over | 0 (0.0%) | 10 (4.5%) |
Disability Class: Ambulatory Difficulty
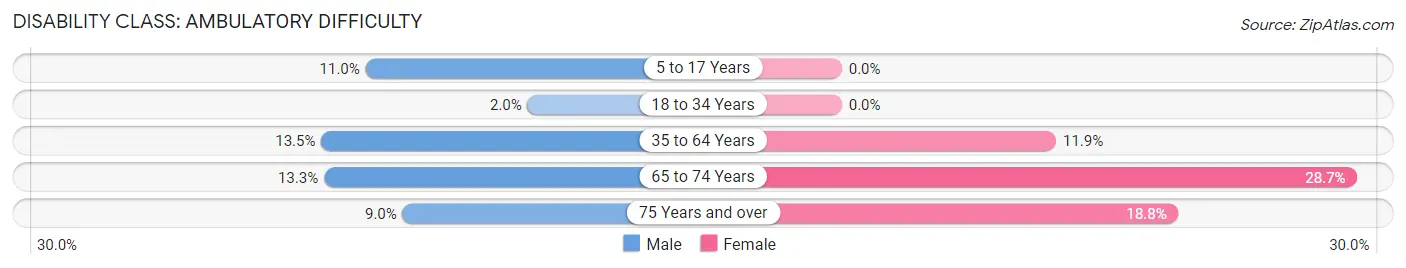
| Age Bracket | Male | Female |
| 5 to 17 Years | 25 (11.0%) | 0 (0.0%) |
| 18 to 34 Years | 8 (2.0%) | 0 (0.0%) |
| 35 to 64 Years | 72 (13.5%) | 70 (11.9%) |
| 65 to 74 Years | 18 (13.3%) | 60 (28.7%) |
| 75 Years and over | 17 (8.9%) | 42 (18.8%) |
Disability Class: Self-Care Difficulty
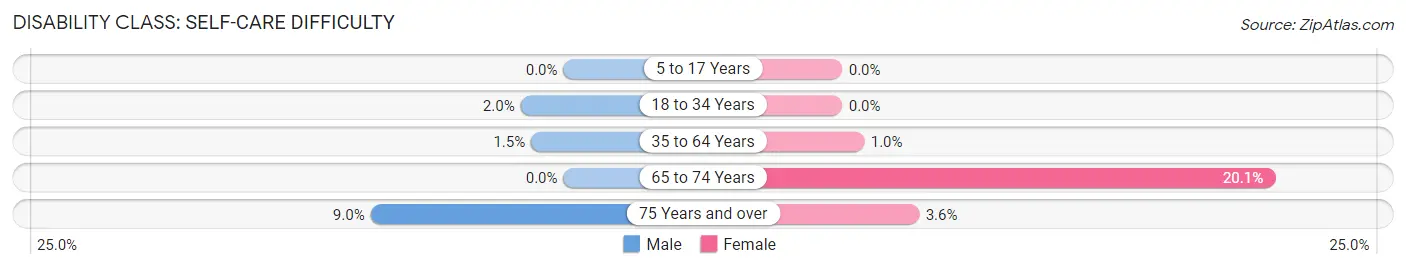
| Age Bracket | Male | Female |
| 5 to 17 Years | 0 (0.0%) | 0 (0.0%) |
| 18 to 34 Years | 8 (2.0%) | 0 (0.0%) |
| 35 to 64 Years | 8 (1.5%) | 6 (1.0%) |
| 65 to 74 Years | 0 (0.0%) | 42 (20.1%) |
| 75 Years and over | 17 (8.9%) | 8 (3.6%) |
Technology Access in Carrollton
Computing Device Access in Carrollton
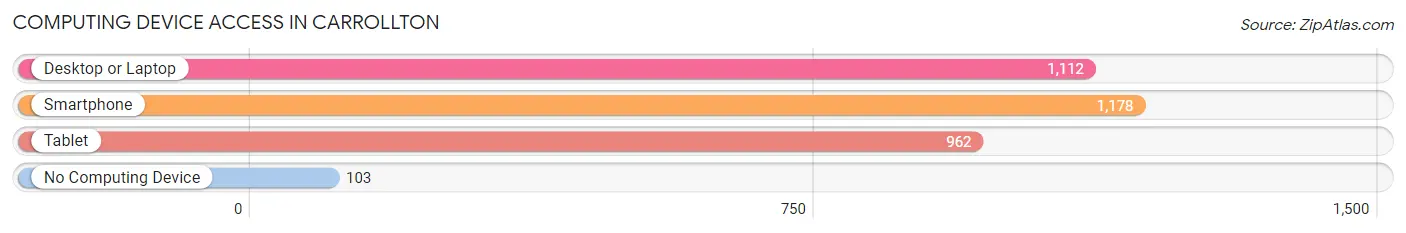
| Device Type | # Households | % Households |
| Desktop or Laptop | 1,112 | 76.3% |
| Smartphone | 1,178 | 80.8% |
| Tablet | 962 | 66.0% |
| No Computing Device | 103 | 7.1% |
| Total | 1,458 | 100.0% |
Internet Access in Carrollton
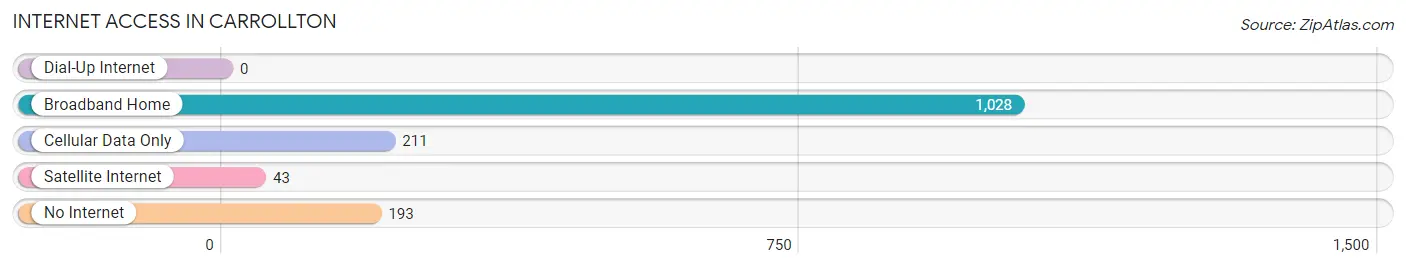
| Internet Type | # Households | % Households |
| Dial-Up Internet | 0 | 0.0% |
| Broadband Home | 1,028 | 70.5% |
| Cellular Data Only | 211 | 14.5% |
| Satellite Internet | 43 | 2.9% |
| No Internet | 193 | 13.2% |
| Total | 1,458 | 100.0% |
Carrollton Summary
Carrollton, Ohio is a small village located in the northeastern part of the state, in Carroll County. It is situated along the Ohio River, and is part of the Canton-Massillon Metropolitan Statistical Area. The village has a population of approximately 2,500 people, and is known for its rural charm and small-town atmosphere.
History
Carrollton was founded in 1817 by a group of settlers from Pennsylvania. The village was named after Charles Carroll, a signer of the Declaration of Independence. The village was originally a farming community, and the first settlers were primarily of German and English descent.
In 1820, the village was incorporated, and the first post office was established. The village grew slowly, and by the mid-1800s, it had become a popular stop for travelers on the Ohio River. The village was also home to several mills, which provided employment for many of the residents.
In the late 1800s, the village began to experience a period of growth. The railroad was extended to the village, and several new businesses were established. The village also became a popular tourist destination, and several hotels and resorts were built.
Geography
Carrollton is located in northeastern Ohio, in Carroll County. It is situated along the Ohio River, and is part of the Canton-Massillon Metropolitan Statistical Area. The village has a total area of 1.3 square miles, all of which is land.
The village is located in a rural area, and is surrounded by rolling hills and farmland. The Ohio River is the main source of water for the village, and there are several small creeks and streams in the area. The village is located approximately 30 miles from Canton, and 60 miles from Cleveland.
Economy
The economy of Carrollton is largely based on agriculture and tourism. The village is home to several farms, and the surrounding area is known for its production of corn, soybeans, and wheat. The village is also home to several small businesses, including restaurants, shops, and other services.
Tourism is also an important part of the local economy. The village is home to several hotels and resorts, and is a popular destination for outdoor activities such as fishing, boating, and camping. The village also hosts several festivals and events throughout the year, which attract visitors from all over the region.
Demographics
As of the 2010 census, the population of Carrollton was 2,521. The racial makeup of the village was 97.3% White, 0.7% African American, 0.2% Native American, 0.3% Asian, 0.1% Pacific Islander, 0.3% from other races, and 1.2% from two or more races. Hispanic or Latino of any race were 1.2% of the population.
The median household income in the village was $41,250, and the median family income was $48,750. The per capita income for the village was $19,945. About 11.2% of families and 13.2% of the population were below the poverty line, including 17.2% of those under age 18 and 8.2% of those age 65 or over.
Common Questions
What is Per Capita Income in Carrollton?
Per Capita income in Carrollton is $34,453.
What is the Median Family Income in Carrollton?
Median Family Income in Carrollton is $70,290.
What is the Median Household income in Carrollton?
Median Household Income in Carrollton is $62,444.
What is Income or Wage Gap in Carrollton?
Income or Wage Gap in Carrollton is 24.5%.
Women in Carrollton earn 75.5 cents for every dollar earned by a man.
What is Inequality or Gini Index in Carrollton?
Inequality or Gini Index in Carrollton is 0.44.
What is the Total Population of Carrollton?
Total Population of Carrollton is 3,270.
What is the Total Male Population of Carrollton?
Total Male Population of Carrollton is 1,597.
What is the Total Female Population of Carrollton?
Total Female Population of Carrollton is 1,673.
What is the Ratio of Males per 100 Females in Carrollton?
There are 95.46 Males per 100 Females in Carrollton.
What is the Ratio of Females per 100 Males in Carrollton?
There are 104.76 Females per 100 Males in Carrollton.
What is the Median Population Age in Carrollton?
Median Population Age in Carrollton is 48.0 Years.
What is the Average Family Size in Carrollton
Average Family Size in Carrollton is 2.5 People.
What is the Average Household Size in Carrollton
Average Household Size in Carrollton is 2.1 People.
How Large is the Labor Force in Carrollton?
There are 1,607 People in the Labor Forcein in Carrollton.
What is the Percentage of People in the Labor Force in Carrollton?
58.0% of People are in the Labor Force in Carrollton.
What is the Unemployment Rate in Carrollton?
Unemployment Rate in Carrollton is 1.1%.