Stony Ridge, OH Map & Demographics
Stony Ridge Map
Stony Ridge Overview
$35,160
PER CAPITA INCOME
$64,915
AVG FAMILY INCOME
$65,885
AVG HOUSEHOLD INCOME
0.17
INEQUALITY / GINI INDEX
659
TOTAL POPULATION
361
MALE POPULATION
298
FEMALE POPULATION
121.14
MALES / 100 FEMALES
82.55
FEMALES / 100 MALES
57.5
MEDIAN AGE
3.0
AVG FAMILY SIZE
2.3
AVG HOUSEHOLD SIZE
331
LABOR FORCE [ PEOPLE ]
57.3%
PERCENT IN LABOR FORCE
Stony Ridge Zip Codes
Stony Ridge Area Codes
Income in Stony Ridge
Income Overview in Stony Ridge
Per Capita Income in Stony Ridge is $35,160, while median incomes of families and households are $64,915 and $65,885 respectively.
| Characteristic | Number | Measure |
| Per Capita Income | 659 | $35,160 |
| Median Family Income | 170 | $64,915 |
| Mean Family Income | 170 | $78,348 |
| Median Household Income | 288 | $65,885 |
| Mean Household Income | 288 | $75,635 |
| Income Deficit | 170 | $0 |
| Wage / Income Gap (%) | 659 | 0.00% |
| Wage / Income Gap ($) | 659 | 100.00¢ per $1 |
| Gini / Inequality Index | 659 | 0.17 |
Earnings by Sex in Stony Ridge
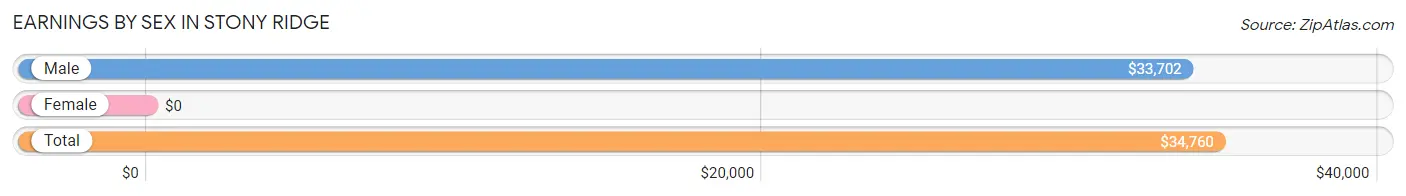
| Sex | Number | Average Earnings |
| Male | 137 (41.4%) | $33,702 |
| Female | 194 (58.6%) | $0 |
| Total | 331 (100.0%) | $34,760 |
Earnings by Sex by Income Bracket in Stony Ridge
The most common earnings brackets in Stony Ridge are $22,500 to $24,999 for men (46 | 33.6%) and $2,500 to $4,999 for women (68 | 35.0%).
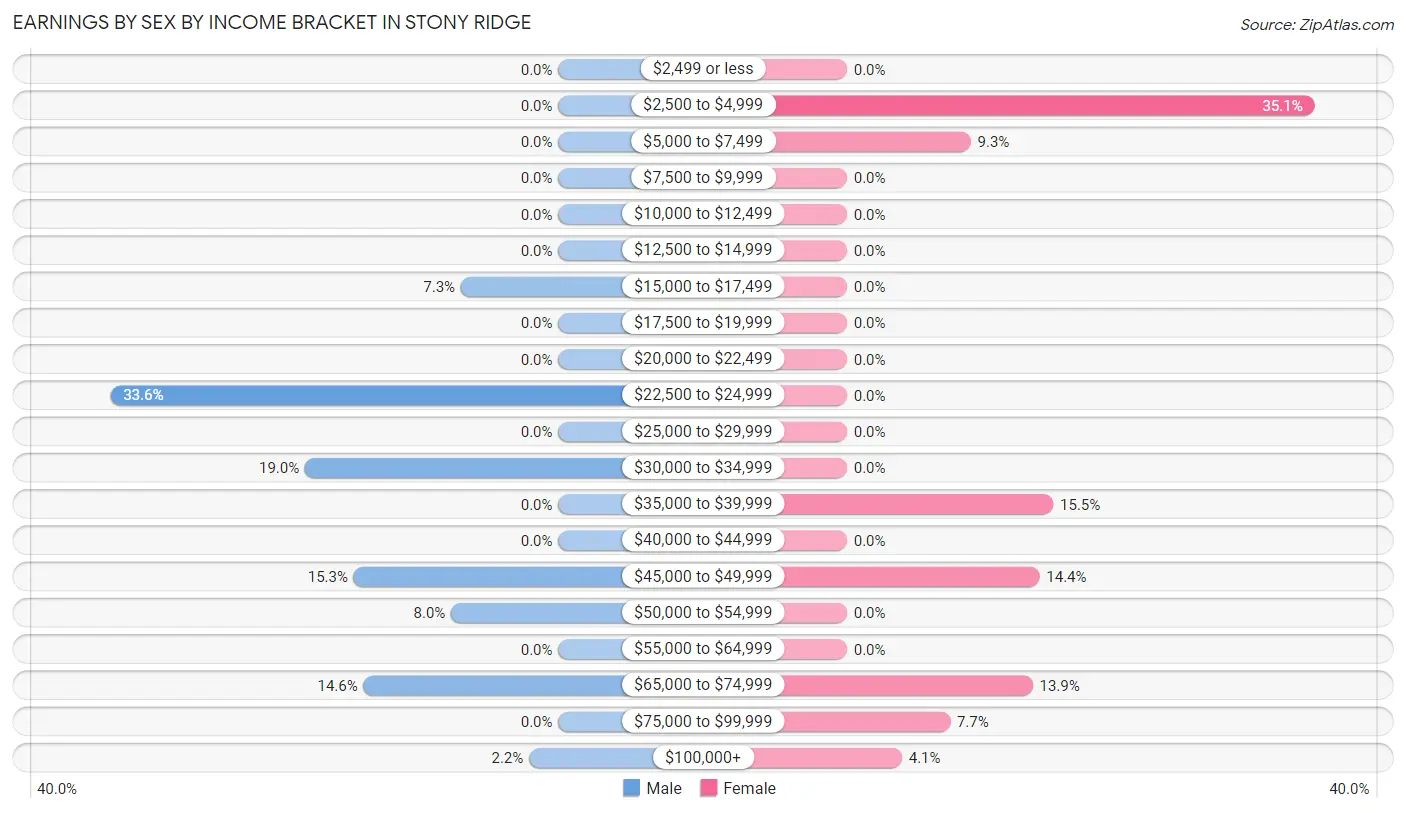
| Income | Male | Female |
| $2,499 or less | 0 (0.0%) | 0 (0.0%) |
| $2,500 to $4,999 | 0 (0.0%) | 68 (35.0%) |
| $5,000 to $7,499 | 0 (0.0%) | 18 (9.3%) |
| $7,500 to $9,999 | 0 (0.0%) | 0 (0.0%) |
| $10,000 to $12,499 | 0 (0.0%) | 0 (0.0%) |
| $12,500 to $14,999 | 0 (0.0%) | 0 (0.0%) |
| $15,000 to $17,499 | 10 (7.3%) | 0 (0.0%) |
| $17,500 to $19,999 | 0 (0.0%) | 0 (0.0%) |
| $20,000 to $22,499 | 0 (0.0%) | 0 (0.0%) |
| $22,500 to $24,999 | 46 (33.6%) | 0 (0.0%) |
| $25,000 to $29,999 | 0 (0.0%) | 0 (0.0%) |
| $30,000 to $34,999 | 26 (19.0%) | 0 (0.0%) |
| $35,000 to $39,999 | 0 (0.0%) | 30 (15.5%) |
| $40,000 to $44,999 | 0 (0.0%) | 0 (0.0%) |
| $45,000 to $49,999 | 21 (15.3%) | 28 (14.4%) |
| $50,000 to $54,999 | 11 (8.0%) | 0 (0.0%) |
| $55,000 to $64,999 | 0 (0.0%) | 0 (0.0%) |
| $65,000 to $74,999 | 20 (14.6%) | 27 (13.9%) |
| $75,000 to $99,999 | 0 (0.0%) | 15 (7.7%) |
| $100,000+ | 3 (2.2%) | 8 (4.1%) |
| Total | 137 (100.0%) | 194 (100.0%) |
Earnings by Sex by Educational Attainment in Stony Ridge
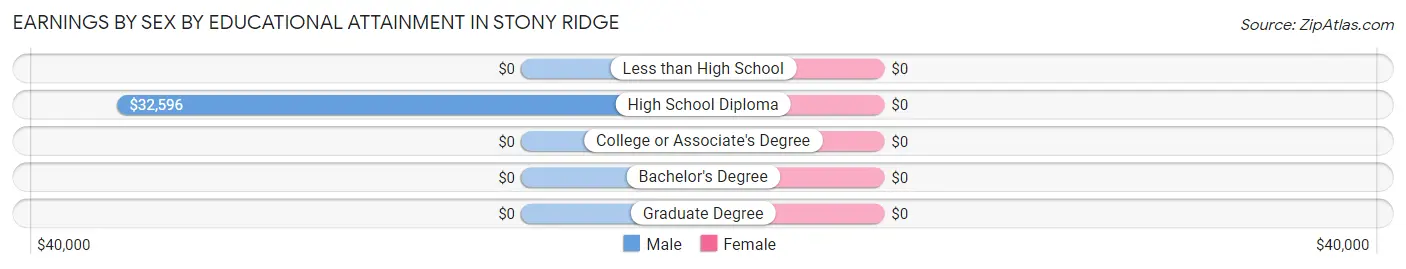
| Educational Attainment | Male Income | Female Income |
| Less than High School | - | - |
| High School Diploma | $32,596 | $0 |
| College or Associate's Degree | - | - |
| Bachelor's Degree | - | - |
| Graduate Degree | - | - |
| Total | $33,702 | $0 |
Family Income in Stony Ridge
Family Income Brackets in Stony Ridge
According to the Stony Ridge family income data, there are 90 families falling into the $50,000 to $74,999 income range, which is the most common income bracket and makes up 52.9% of all families.
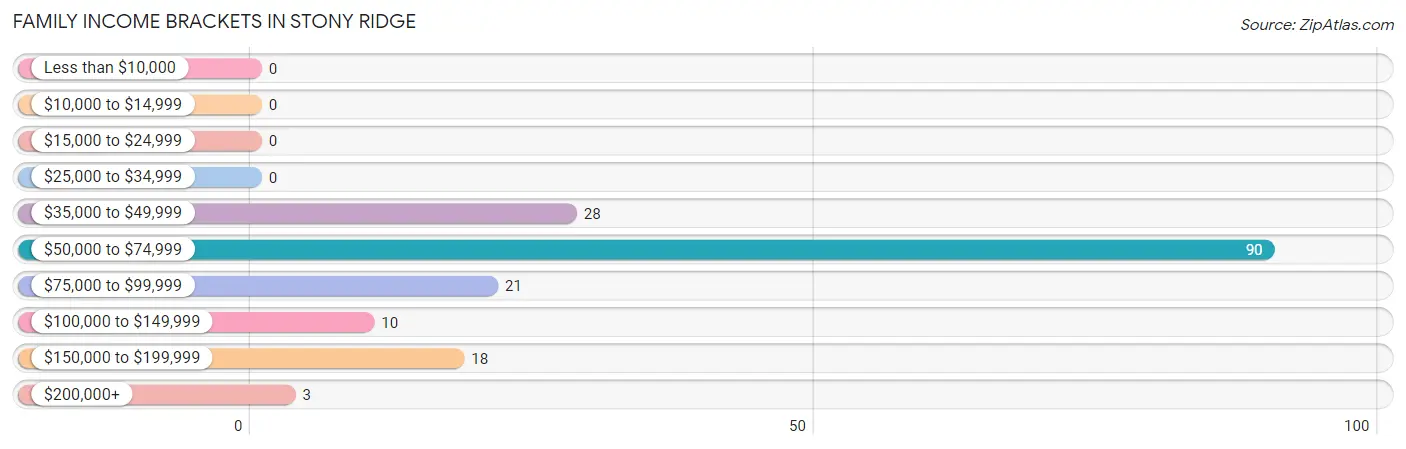
| Income Bracket | # Families | % Families |
| Less than $10,000 | 0 | 0.0% |
| $10,000 to $14,999 | 0 | 0.0% |
| $15,000 to $24,999 | 0 | 0.0% |
| $25,000 to $34,999 | 0 | 0.0% |
| $35,000 to $49,999 | 28 | 16.5% |
| $50,000 to $74,999 | 90 | 52.9% |
| $75,000 to $99,999 | 21 | 12.4% |
| $100,000 to $149,999 | 10 | 5.9% |
| $150,000 to $199,999 | 18 | 10.6% |
| $200,000+ | 3 | 1.8% |
Family Income by Famaliy Size in Stony Ridge
3-person families (34 | 20.0%) account for the highest median family income in Stony Ridge with $75,833 per family, while 2-person families (97 | 57.1%) have the highest median income of $31,684 per family member.
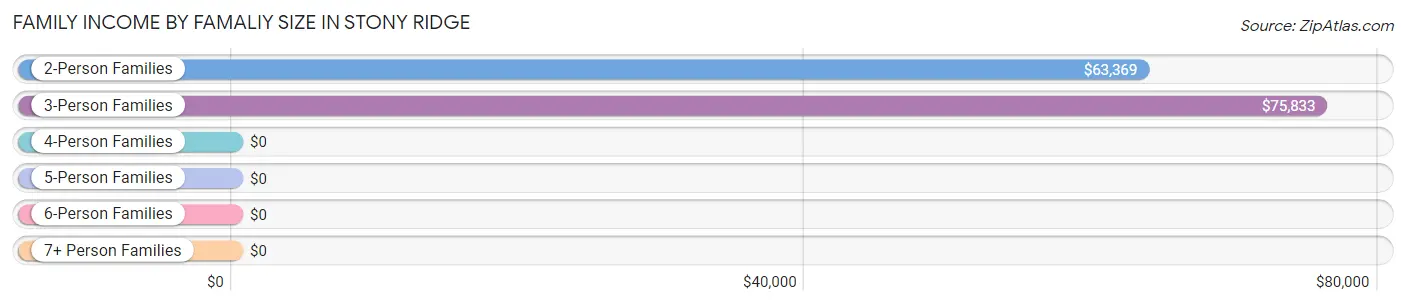
| Income Bracket | # Families | Median Income |
| 2-Person Families | 97 (57.1%) | $63,369 |
| 3-Person Families | 34 (20.0%) | $75,833 |
| 4-Person Families | 31 (18.2%) | $0 |
| 5-Person Families | 8 (4.7%) | $0 |
| 6-Person Families | 0 (0.0%) | $0 |
| 7+ Person Families | 0 (0.0%) | $0 |
| Total | 170 (100.0%) | $64,915 |
Family Income by Number of Earners in Stony Ridge
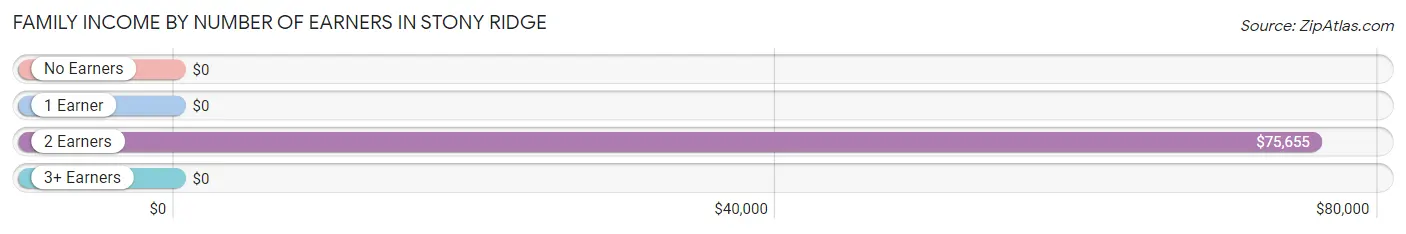
| Number of Earners | # Families | Median Income |
| No Earners | 10 (5.9%) | $0 |
| 1 Earner | 87 (51.2%) | $0 |
| 2 Earners | 73 (42.9%) | $75,655 |
| 3+ Earners | 0 (0.0%) | $0 |
| Total | 170 (100.0%) | $64,915 |
Household Income in Stony Ridge
Household Income Brackets in Stony Ridge
With 184 households falling in the category, the $50,000 to $74,999 income range is the most frequent in Stony Ridge, accounting for 63.9% of all households.
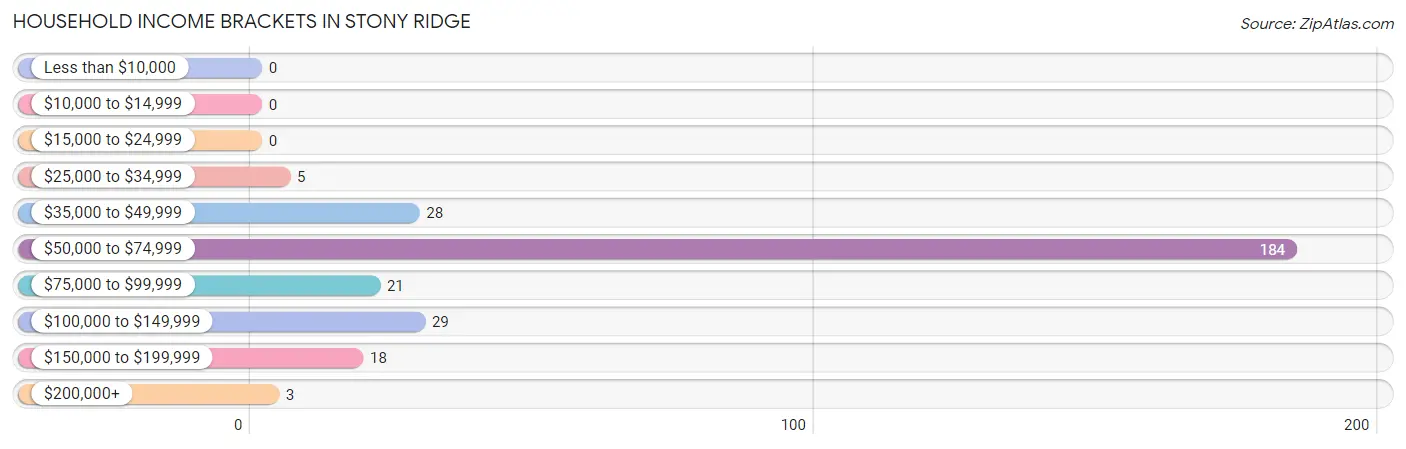
| Income Bracket | # Households | % Households |
| Less than $10,000 | 0 | 0.0% |
| $10,000 to $14,999 | 0 | 0.0% |
| $15,000 to $24,999 | 0 | 0.0% |
| $25,000 to $34,999 | 5 | 1.7% |
| $35,000 to $49,999 | 28 | 9.7% |
| $50,000 to $74,999 | 184 | 63.9% |
| $75,000 to $99,999 | 21 | 7.3% |
| $100,000 to $149,999 | 29 | 10.1% |
| $150,000 to $199,999 | 18 | 6.3% |
| $200,000+ | 3 | 1.0% |
Household Income by Householder Age in Stony Ridge
The median household income in Stony Ridge is $65,885, with the highest median household income of $68,274 found in the 45 to 64 years age bracket for the primary householder. A total of 125 households (43.4%) fall into this category. Meanwhile, the 15 to 24 years age bracket for the primary householder has the lowest median household income of $0, with 28 households (9.7%) in this group.
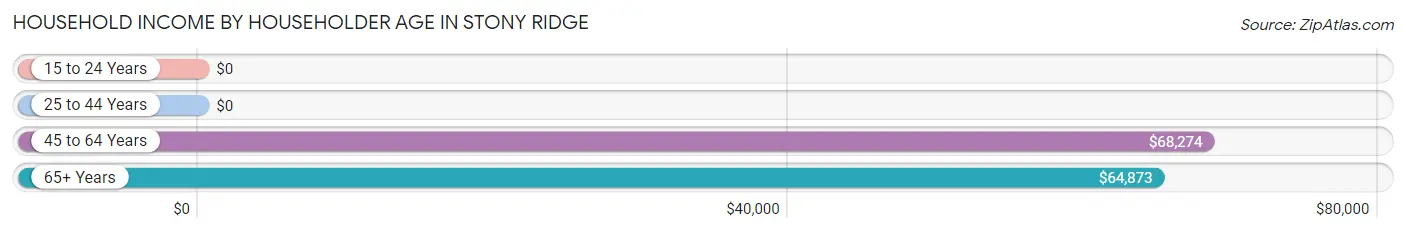
| Income Bracket | # Households | Median Income |
| 15 to 24 Years | 28 (9.7%) | $0 |
| 25 to 44 Years | 13 (4.5%) | $0 |
| 45 to 64 Years | 125 (43.4%) | $68,274 |
| 65+ Years | 122 (42.4%) | $64,873 |
| Total | 288 (100.0%) | $65,885 |
Poverty in Stony Ridge
Income Below Poverty by Sex and Age in Stony Ridge
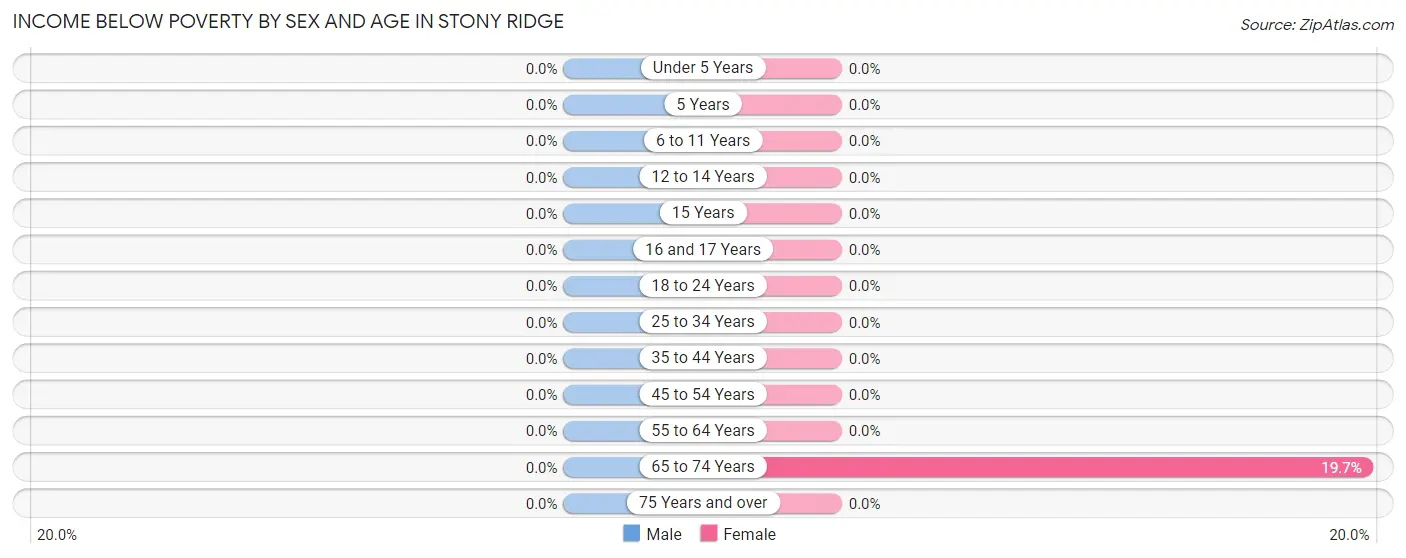
| Age Bracket | Male | Female |
| Under 5 Years | 0 (0.0%) | 0 (0.0%) |
| 5 Years | 0 (0.0%) | 0 (0.0%) |
| 6 to 11 Years | 0 (0.0%) | 0 (0.0%) |
| 12 to 14 Years | 0 (0.0%) | 0 (0.0%) |
| 15 Years | 0 (0.0%) | 0 (0.0%) |
| 16 and 17 Years | 0 (0.0%) | 0 (0.0%) |
| 18 to 24 Years | 0 (0.0%) | 0 (0.0%) |
| 25 to 34 Years | 0 (0.0%) | 0 (0.0%) |
| 35 to 44 Years | 0 (0.0%) | 0 (0.0%) |
| 45 to 54 Years | 0 (0.0%) | 0 (0.0%) |
| 55 to 64 Years | 0 (0.0%) | 0 (0.0%) |
| 65 to 74 Years | 0 (0.0%) | 15 (19.7%) |
| 75 Years and over | 0 (0.0%) | 0 (0.0%) |
| Total | 0 (0.0%) | 15 (5.0%) |
Income Above Poverty by Sex and Age in Stony Ridge
According to the poverty statistics in Stony Ridge, males aged under 5 years and females aged under 5 years are the age groups that are most secure financially, with 100.0% of males and 100.0% of females in these age groups living above the poverty line.
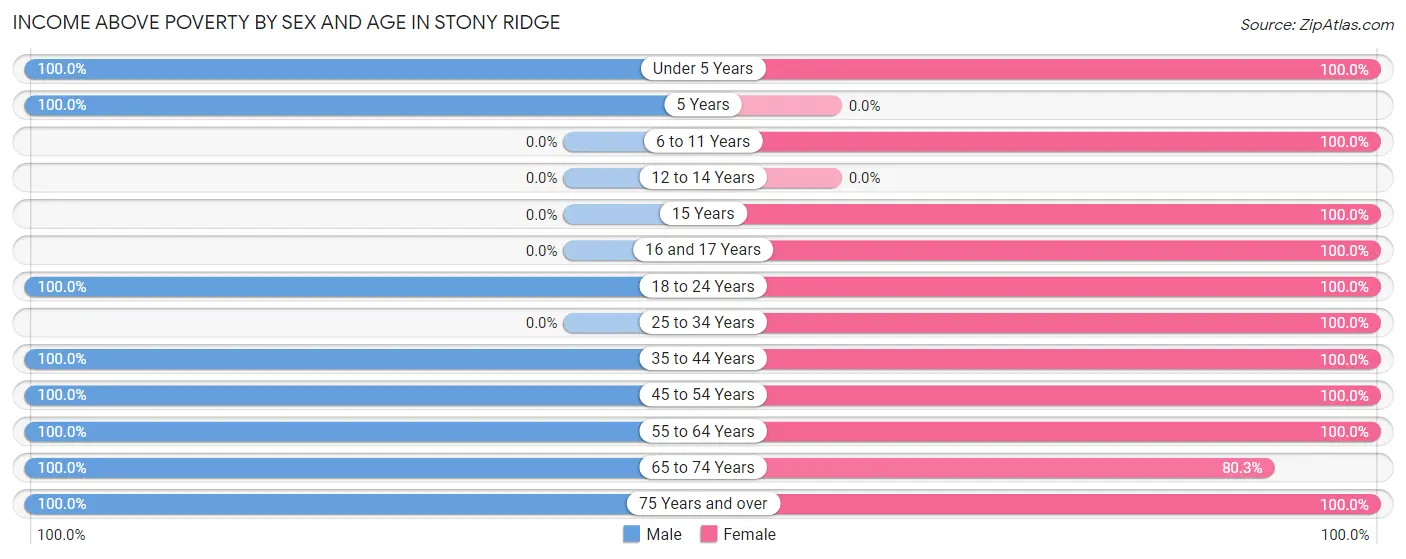
| Age Bracket | Male | Female |
| Under 5 Years | 17 (100.0%) | 12 (100.0%) |
| 5 Years | 19 (100.0%) | 0 (0.0%) |
| 6 to 11 Years | 0 (0.0%) | 25 (100.0%) |
| 12 to 14 Years | 0 (0.0%) | 0 (0.0%) |
| 15 Years | 0 (0.0%) | 8 (100.0%) |
| 16 and 17 Years | 0 (0.0%) | 14 (100.0%) |
| 18 to 24 Years | 11 (100.0%) | 28 (100.0%) |
| 25 to 34 Years | 0 (0.0%) | 25 (100.0%) |
| 35 to 44 Years | 36 (100.0%) | 3 (100.0%) |
| 45 to 54 Years | 85 (100.0%) | 15 (100.0%) |
| 55 to 64 Years | 91 (100.0%) | 72 (100.0%) |
| 65 to 74 Years | 74 (100.0%) | 61 (80.3%) |
| 75 Years and over | 28 (100.0%) | 20 (100.0%) |
| Total | 361 (100.0%) | 283 (95.0%) |
Income Below Poverty Among Married-Couple Families in Stony Ridge
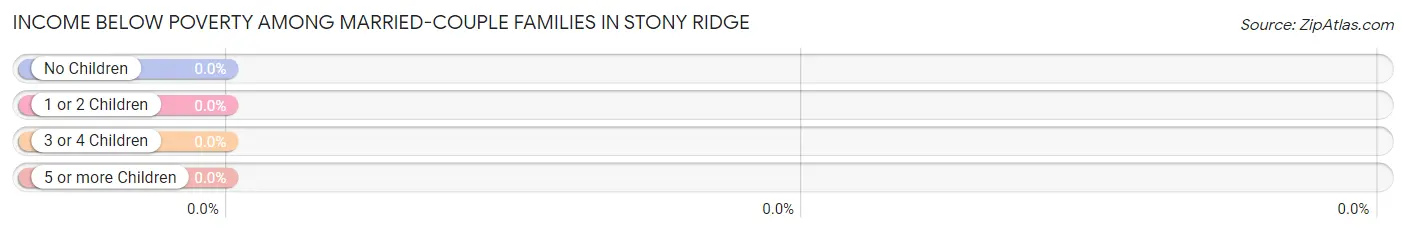
| Children | Above Poverty | Below Poverty |
| No Children | 90 (100.0%) | 0 (0.0%) |
| 1 or 2 Children | 21 (100.0%) | 0 (0.0%) |
| 3 or 4 Children | 0 (0.0%) | 0 (0.0%) |
| 5 or more Children | 0 (0.0%) | 0 (0.0%) |
| Total | 111 (100.0%) | 0 (0.0%) |
Income Below Poverty Among Single-Parent Households in Stony Ridge
| Children | Single Father | Single Mother |
| No Children | 0 (0.0%) | 0 (0.0%) |
| 1 or 2 Children | 0 (0.0%) | 0 (0.0%) |
| 3 or 4 Children | 0 (0.0%) | 0 (0.0%) |
| 5 or more Children | 0 (0.0%) | 0 (0.0%) |
| Total | 0 (0.0%) | 0 (0.0%) |
Income Below Poverty Among Married-Couple vs Single-Parent Households in Stony Ridge
| Children | Married-Couple Families | Single-Parent Households |
| No Children | 0 (0.0%) | 0 (0.0%) |
| 1 or 2 Children | 0 (0.0%) | 0 (0.0%) |
| 3 or 4 Children | 0 (0.0%) | 0 (0.0%) |
| 5 or more Children | 0 (0.0%) | 0 (0.0%) |
| Total | 0 (0.0%) | 0 (0.0%) |
Race in Stony Ridge
The most populous races in Stony Ridge are White / Caucasian (590 | 89.5%), Hispanic or Latino (69 | 10.5%), and Some other Race (69 | 10.5%).
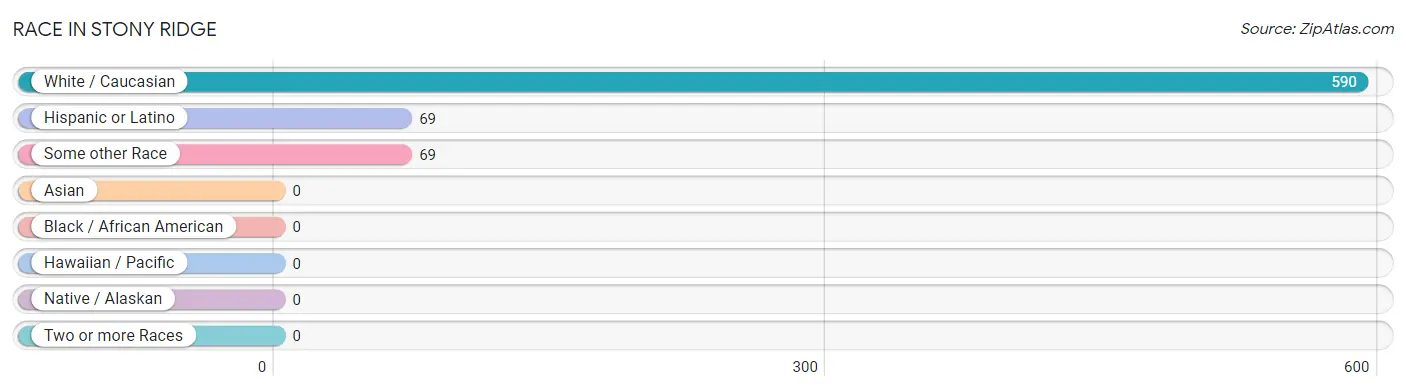
| Race | # Population | % Population |
| Asian | 0 | 0.0% |
| Black / African American | 0 | 0.0% |
| Hawaiian / Pacific | 0 | 0.0% |
| Hispanic or Latino | 69 | 10.5% |
| Native / Alaskan | 0 | 0.0% |
| White / Caucasian | 590 | 89.5% |
| Two or more Races | 0 | 0.0% |
| Some other Race | 69 | 10.5% |
| Total | 659 | 100.0% |
Ancestry in Stony Ridge
The most populous ancestries reported in Stony Ridge are German (282 | 42.8%), Irish (137 | 20.8%), English (123 | 18.7%), Mexican (69 | 10.5%), and British (67 | 10.2%), together accounting for 102.9% of all Stony Ridge residents.
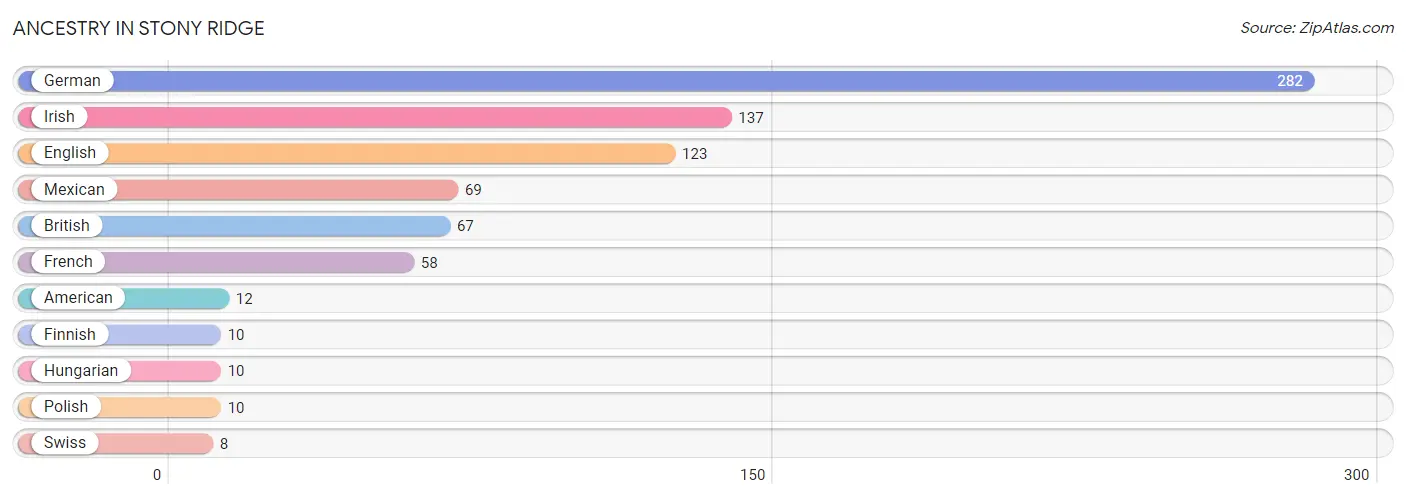
| Ancestry | # Population | % Population |
| American | 12 | 1.8% |
| British | 67 | 10.2% |
| English | 123 | 18.7% |
| Finnish | 10 | 1.5% |
| French | 58 | 8.8% |
| German | 282 | 42.8% |
| Hungarian | 10 | 1.5% |
| Irish | 137 | 20.8% |
| Mexican | 69 | 10.5% |
| Polish | 10 | 1.5% |
| Swiss | 8 | 1.2% | View All 11 Rows |
Immigrants in Stony Ridge

| Immigration Origin | # Population | % Population | View All 0 Rows |
Sex and Age in Stony Ridge
Sex and Age in Stony Ridge
The most populous age groups in Stony Ridge are 65 to 69 Years (74 | 20.5%) for men and 65 to 69 Years (76 | 25.5%) for women.
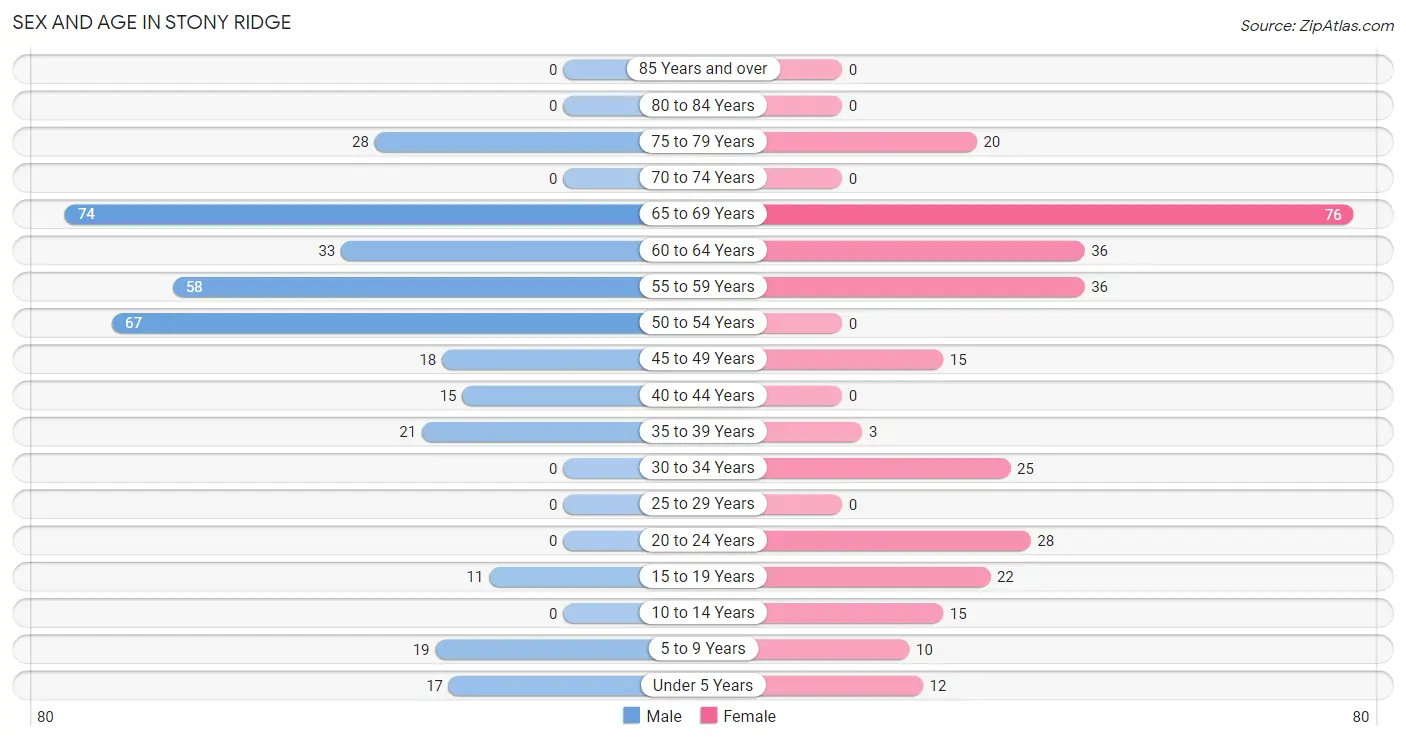
| Age Bracket | Male | Female |
| Under 5 Years | 17 (4.7%) | 12 (4.0%) |
| 5 to 9 Years | 19 (5.3%) | 10 (3.4%) |
| 10 to 14 Years | 0 (0.0%) | 15 (5.0%) |
| 15 to 19 Years | 11 (3.0%) | 22 (7.4%) |
| 20 to 24 Years | 0 (0.0%) | 28 (9.4%) |
| 25 to 29 Years | 0 (0.0%) | 0 (0.0%) |
| 30 to 34 Years | 0 (0.0%) | 25 (8.4%) |
| 35 to 39 Years | 21 (5.8%) | 3 (1.0%) |
| 40 to 44 Years | 15 (4.2%) | 0 (0.0%) |
| 45 to 49 Years | 18 (5.0%) | 15 (5.0%) |
| 50 to 54 Years | 67 (18.6%) | 0 (0.0%) |
| 55 to 59 Years | 58 (16.1%) | 36 (12.1%) |
| 60 to 64 Years | 33 (9.1%) | 36 (12.1%) |
| 65 to 69 Years | 74 (20.5%) | 76 (25.5%) |
| 70 to 74 Years | 0 (0.0%) | 0 (0.0%) |
| 75 to 79 Years | 28 (7.8%) | 20 (6.7%) |
| 80 to 84 Years | 0 (0.0%) | 0 (0.0%) |
| 85 Years and over | 0 (0.0%) | 0 (0.0%) |
| Total | 361 (100.0%) | 298 (100.0%) |
Families and Households in Stony Ridge
Median Family Size in Stony Ridge
The median family size in Stony Ridge is 2.97 persons per family, with married-couple families (111 | 65.3%) accounting for the largest median family size of 3.25 persons per family. On the other hand, single female/mother families (38 | 22.4%) represent the smallest median family size with 2.00 persons per family.
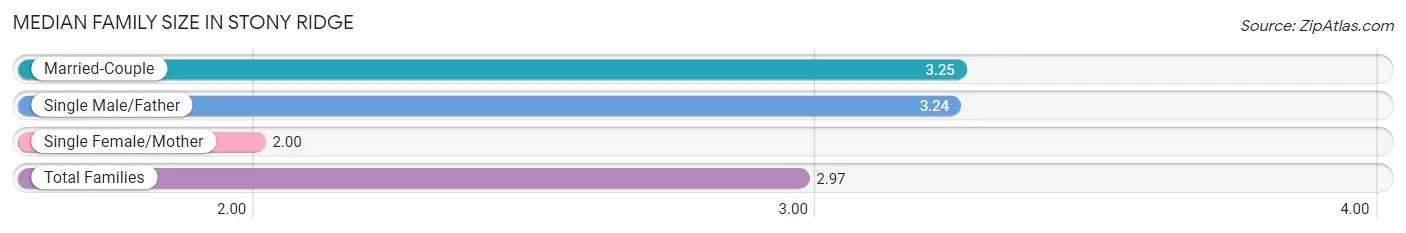
| Family Type | # Families | Family Size |
| Married-Couple | 111 (65.3%) | 3.25 |
| Single Male/Father | 21 (12.3%) | 3.24 |
| Single Female/Mother | 38 (22.4%) | 2.00 |
| Total Families | 170 (100.0%) | 2.97 |
Median Household Size in Stony Ridge
The median household size in Stony Ridge is 2.29 persons per household, with married-couple households (111 | 38.5%) accounting for the largest median household size of 3.25 persons per household. non-family households (118 | 41.0%) represent the smallest median household size with 1.31 persons per household.
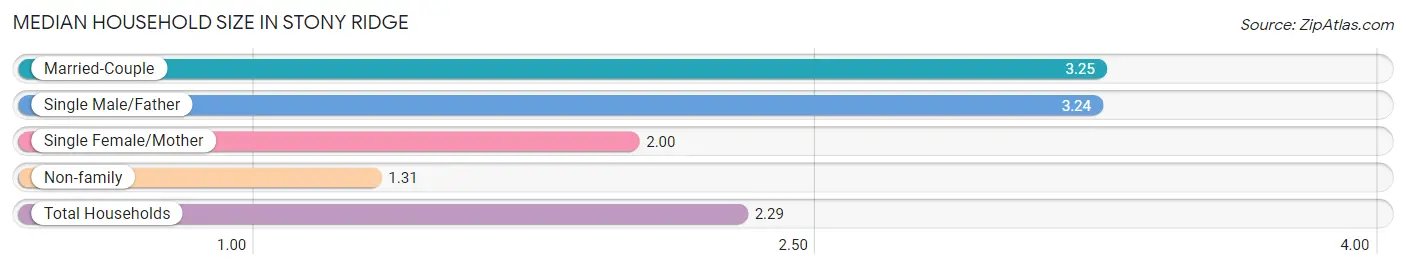
| Household Type | # Households | Household Size |
| Married-Couple | 111 (38.5%) | 3.25 |
| Single Male/Father | 21 (7.3%) | 3.24 |
| Single Female/Mother | 38 (13.2%) | 2.00 |
| Non-family | 118 (41.0%) | 1.31 |
| Total Households | 288 (100.0%) | 2.29 |
Household Size by Marriage Status in Stony Ridge
Out of a total of 288 households in Stony Ridge, 170 (59.0%) are family households, while 118 (41.0%) are nonfamily households. The most numerous type of family households are 2-person households, comprising 97, and the most common type of nonfamily households are 1-person households, comprising 107.
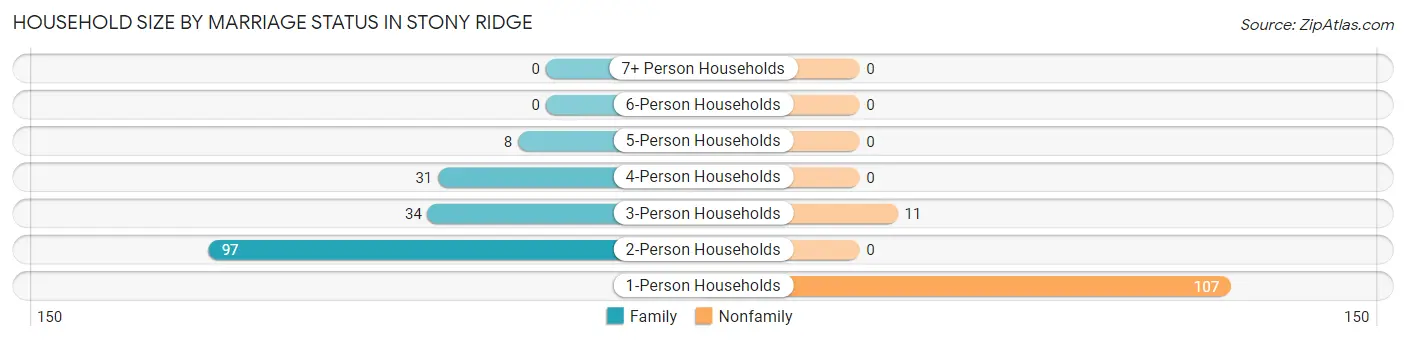
| Household Size | Family Households | Nonfamily Households |
| 1-Person Households | - | 107 (37.1%) |
| 2-Person Households | 97 (33.7%) | 0 (0.0%) |
| 3-Person Households | 34 (11.8%) | 11 (3.8%) |
| 4-Person Households | 31 (10.8%) | 0 (0.0%) |
| 5-Person Households | 8 (2.8%) | 0 (0.0%) |
| 6-Person Households | 0 (0.0%) | 0 (0.0%) |
| 7+ Person Households | 0 (0.0%) | 0 (0.0%) |
| Total | 170 (59.0%) | 118 (41.0%) |
Female Fertility in Stony Ridge
Fertility by Age in Stony Ridge
Average fertility rate in Stony Ridge is 108.0 births per 1,000 women. Women in the age bracket of 20 to 34 years have the highest fertility rate with 189.0 births per 1,000 women. Women in the age bracket of 20 to 34 years acount for 100.0% of all women with births.
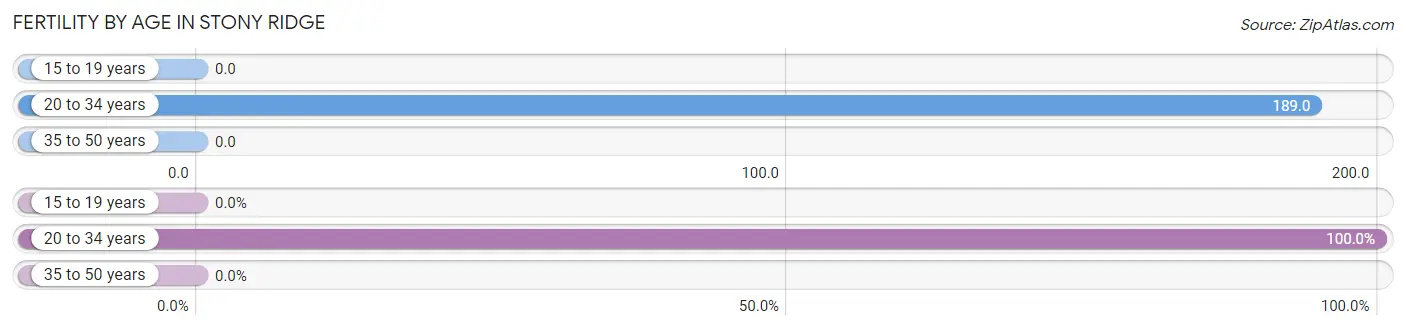
| Age Bracket | Women with Births | Births / 1,000 Women |
| 15 to 19 years | 0 (0.0%) | 0.0 |
| 20 to 34 years | 10 (100.0%) | 189.0 |
| 35 to 50 years | 0 (0.0%) | 0.0 |
| Total | 10 (100.0%) | 108.0 |
Fertility by Age by Marriage Status in Stony Ridge
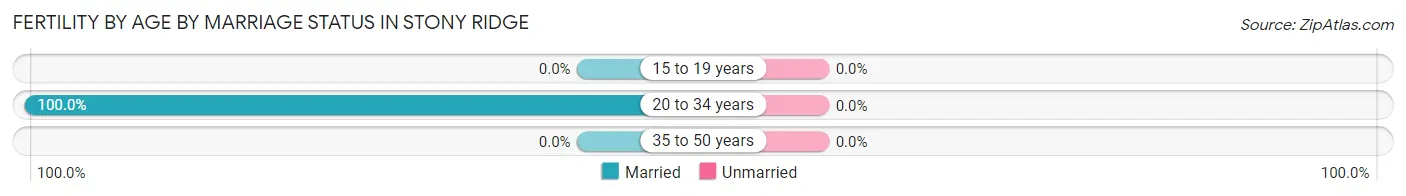
| Age Bracket | Married | Unmarried |
| 15 to 19 years | 0 (0.0%) | 0 (0.0%) |
| 20 to 34 years | 10 (100.0%) | 0 (0.0%) |
| 35 to 50 years | 0 (0.0%) | 0 (0.0%) |
| Total | 10 (100.0%) | 0 (0.0%) |
Fertility by Education in Stony Ridge
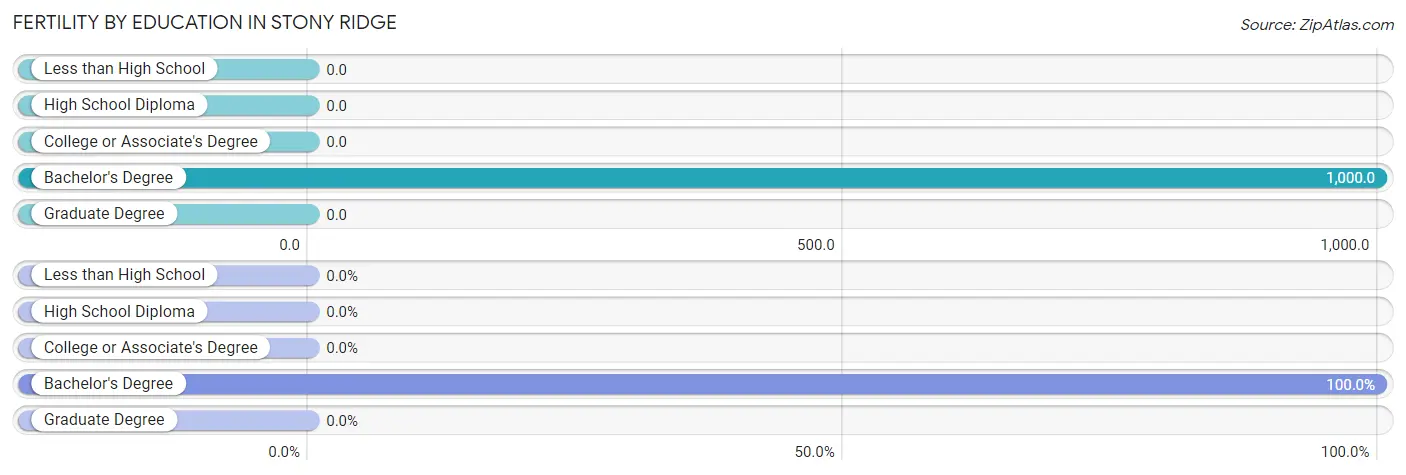
| Educational Attainment | Women with Births | Births / 1,000 Women |
| Less than High School | 0 (0.0%) | 0.0 |
| High School Diploma | 0 (0.0%) | 0.0 |
| College or Associate's Degree | 0 (0.0%) | 0.0 |
| Bachelor's Degree | 10 (100.0%) | 1,000.0 |
| Graduate Degree | 0 (0.0%) | 0.0 |
| Total | 10 (100.0%) | 108.0 |
Fertility by Education by Marriage Status in Stony Ridge
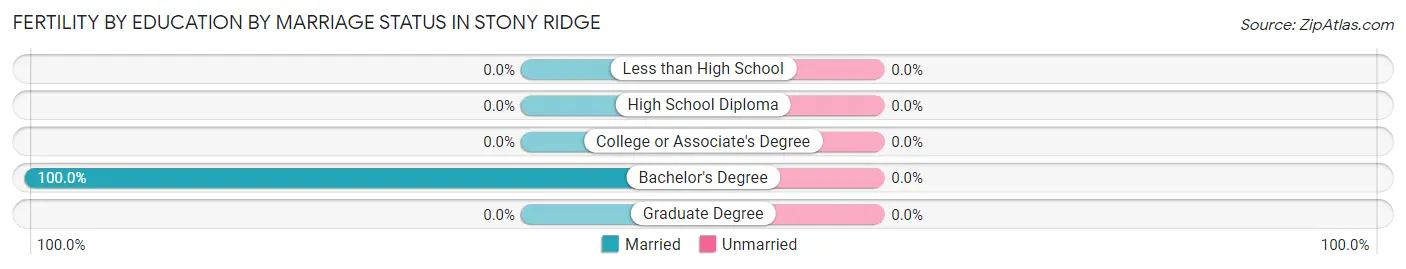
| Educational Attainment | Married | Unmarried |
| Less than High School | 0 (0.0%) | 0 (0.0%) |
| High School Diploma | 0 (0.0%) | 0 (0.0%) |
| College or Associate's Degree | 0 (0.0%) | 0 (0.0%) |
| Bachelor's Degree | 10 (100.0%) | 0 (0.0%) |
| Graduate Degree | 0 (0.0%) | 0 (0.0%) |
| Total | 10 (100.0%) | 0 (0.0%) |
Employment Characteristics in Stony Ridge
Employment by Class of Employer in Stony Ridge
Among the 331 employed individuals in Stony Ridge, private company employees (250 | 75.5%), not-for-profit organizations (40 | 12.1%), and state government employees (28 | 8.5%) make up the most common classes of employment.
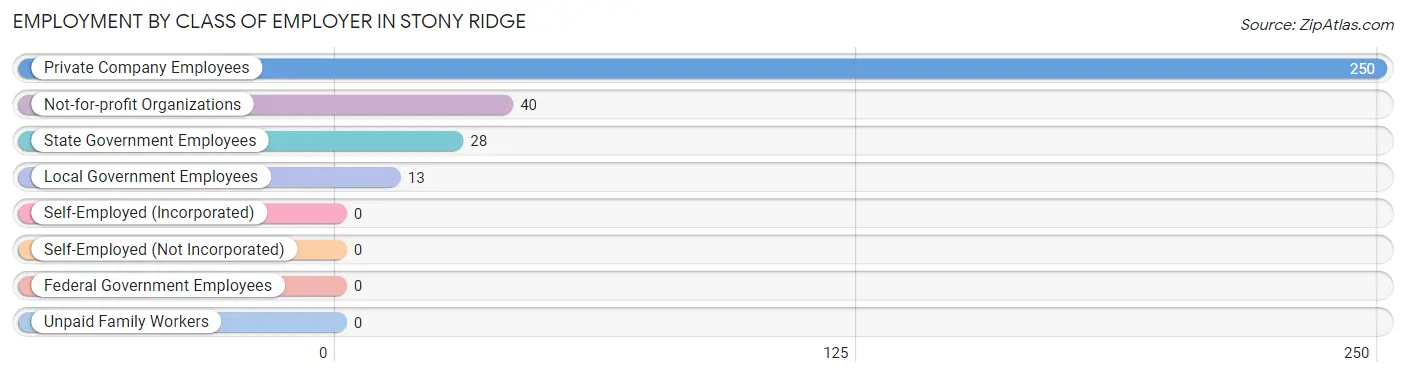
| Employer Class | # Employees | % Employees |
| Private Company Employees | 250 | 75.5% |
| Self-Employed (Incorporated) | 0 | 0.0% |
| Self-Employed (Not Incorporated) | 0 | 0.0% |
| Not-for-profit Organizations | 40 | 12.1% |
| Local Government Employees | 13 | 3.9% |
| State Government Employees | 28 | 8.5% |
| Federal Government Employees | 0 | 0.0% |
| Unpaid Family Workers | 0 | 0.0% |
| Total | 331 | 100.0% |
Employment Status by Age in Stony Ridge
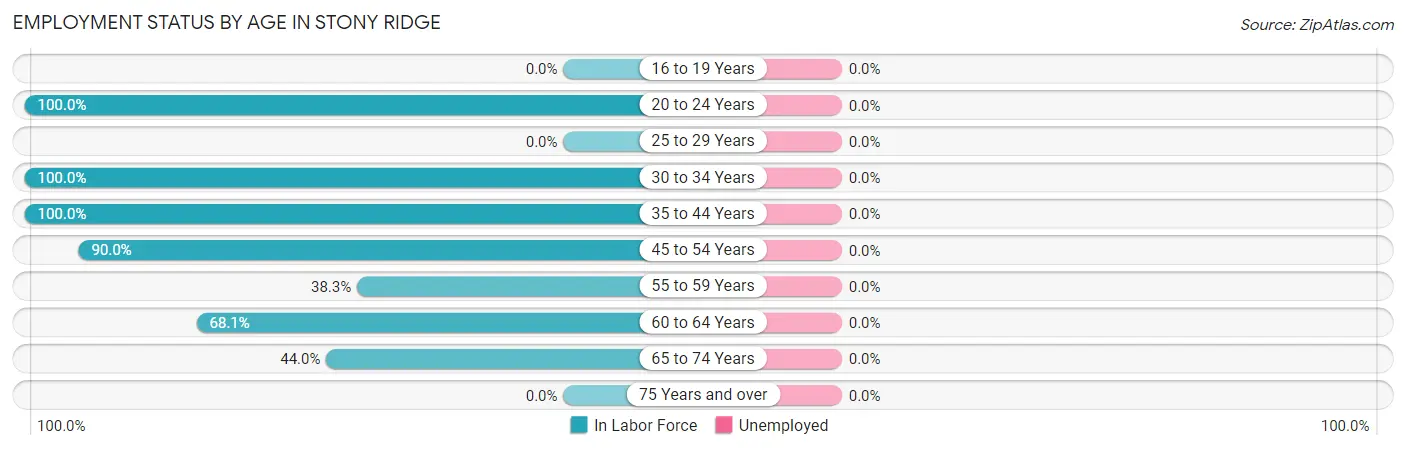
| Age Bracket | In Labor Force | Unemployed |
| 16 to 19 Years | 0 (0.0%) | 0 (0.0%) |
| 20 to 24 Years | 28 (100.0%) | 0 (0.0%) |
| 25 to 29 Years | 0 (0.0%) | 0 (0.0%) |
| 30 to 34 Years | 25 (100.0%) | 0 (0.0%) |
| 35 to 44 Years | 39 (100.0%) | 0 (0.0%) |
| 45 to 54 Years | 90 (90.0%) | 0 (0.0%) |
| 55 to 59 Years | 36 (38.3%) | 0 (0.0%) |
| 60 to 64 Years | 47 (68.1%) | 0 (0.0%) |
| 65 to 74 Years | 66 (44.0%) | 0 (0.0%) |
| 75 Years and over | 0 (0.0%) | 0 (0.0%) |
| Total | 331 (57.3%) | 0 (0.0%) |
Employment Status by Educational Attainment in Stony Ridge
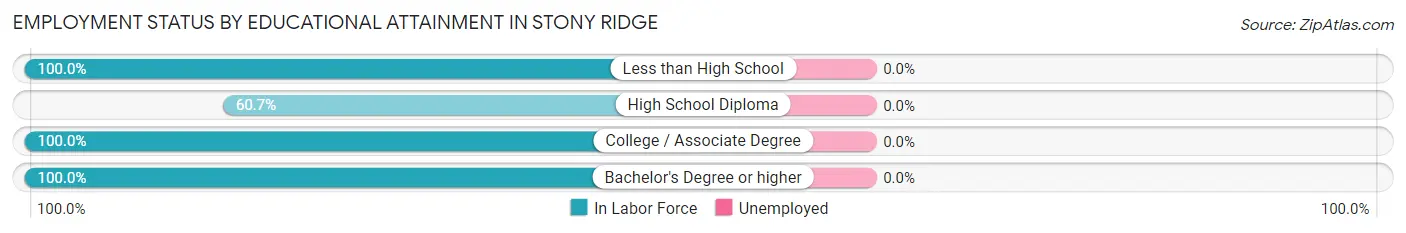
| Educational Attainment | In Labor Force | Unemployed |
| Less than High School | 21 (100.0%) | 0 (0.0%) |
| High School Diploma | 139 (60.7%) | 0 (0.0%) |
| College / Associate Degree | 39 (100.0%) | 0 (0.0%) |
| Bachelor's Degree or higher | 38 (100.0%) | 0 (0.0%) |
| Total | 237 (72.5%) | 0 (0.0%) |
Employment Occupations by Sex in Stony Ridge
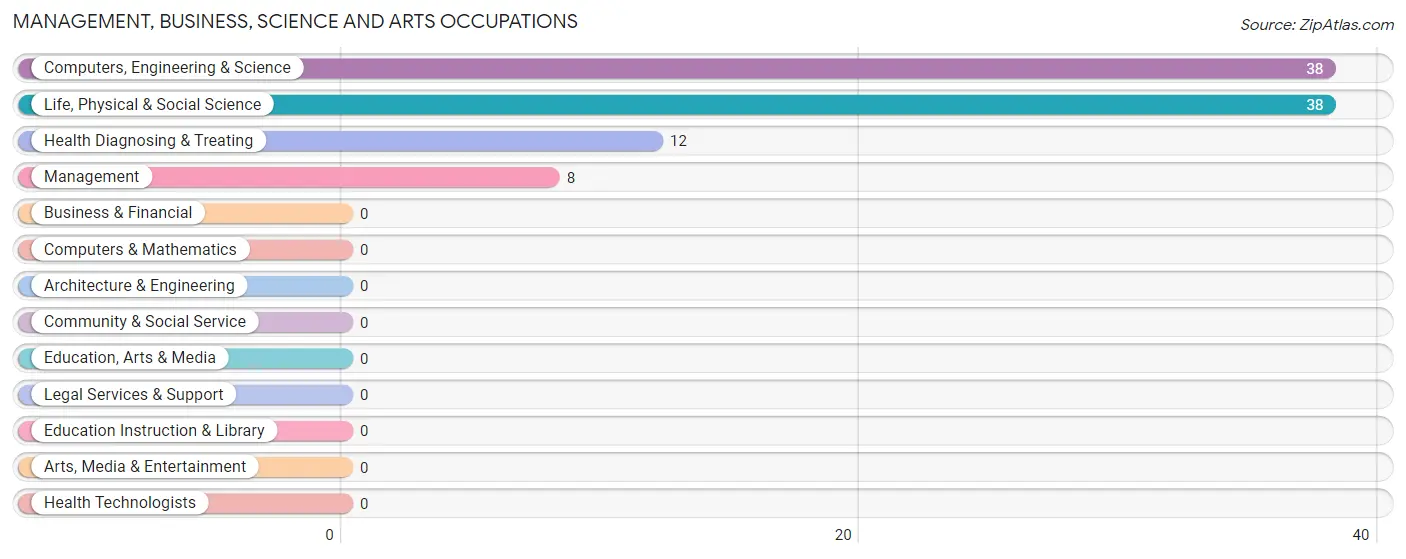
Management, Business, Science and Arts Occupations
The most common Management, Business, Science and Arts occupations in Stony Ridge are Computers, Engineering & Science (38 | 11.5%), Life, Physical & Social Science (38 | 11.5%), Health Diagnosing & Treating (12 | 3.6%), and Management (8 | 2.4%).
Management, Business, Science and Arts Occupations by Sex
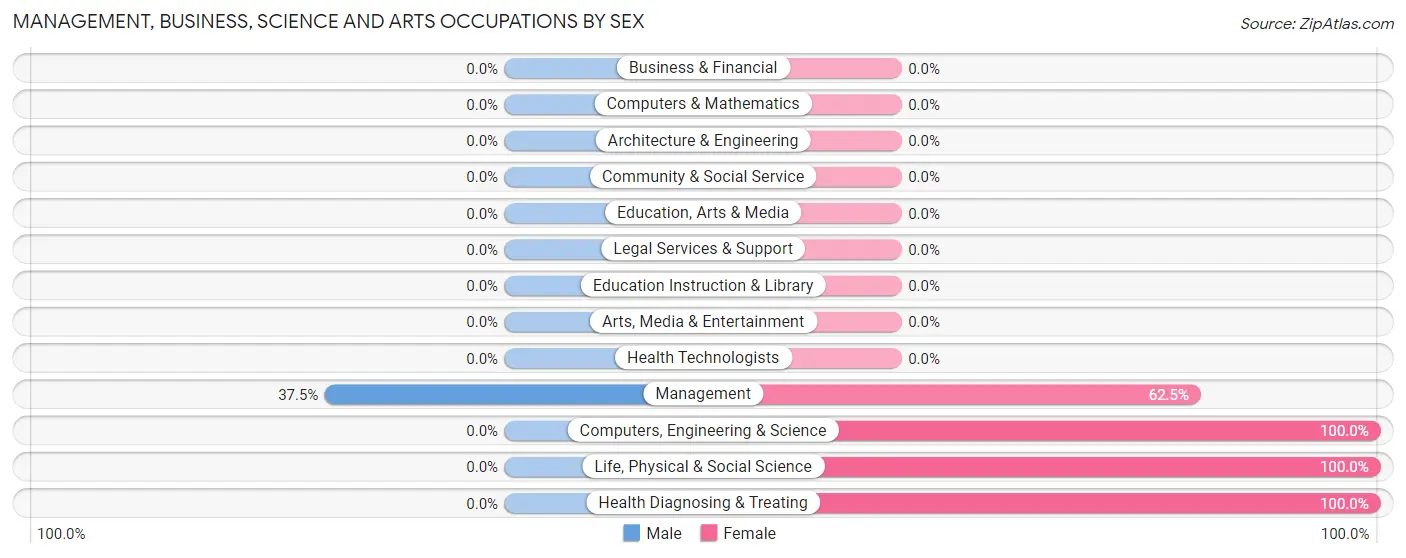
| Occupation | Male | Female |
| Management | 3 (37.5%) | 5 (62.5%) |
| Business & Financial | 0 (0.0%) | 0 (0.0%) |
| Computers, Engineering & Science | 0 (0.0%) | 38 (100.0%) |
| Computers & Mathematics | 0 (0.0%) | 0 (0.0%) |
| Architecture & Engineering | 0 (0.0%) | 0 (0.0%) |
| Life, Physical & Social Science | 0 (0.0%) | 38 (100.0%) |
| Community & Social Service | 0 (0.0%) | 0 (0.0%) |
| Education, Arts & Media | 0 (0.0%) | 0 (0.0%) |
| Legal Services & Support | 0 (0.0%) | 0 (0.0%) |
| Education Instruction & Library | 0 (0.0%) | 0 (0.0%) |
| Arts, Media & Entertainment | 0 (0.0%) | 0 (0.0%) |
| Health Diagnosing & Treating | 0 (0.0%) | 12 (100.0%) |
| Health Technologists | 0 (0.0%) | 0 (0.0%) |
| Total (Category) | 3 (5.2%) | 55 (94.8%) |
| Total (Overall) | 137 (41.4%) | 194 (58.6%) |
Services Occupations
The most common Services occupations in Stony Ridge are Cleaning & Maintenance (26 | 7.9%), Healthcare Support (10 | 3.0%), and Food Preparation & Serving (7 | 2.1%).
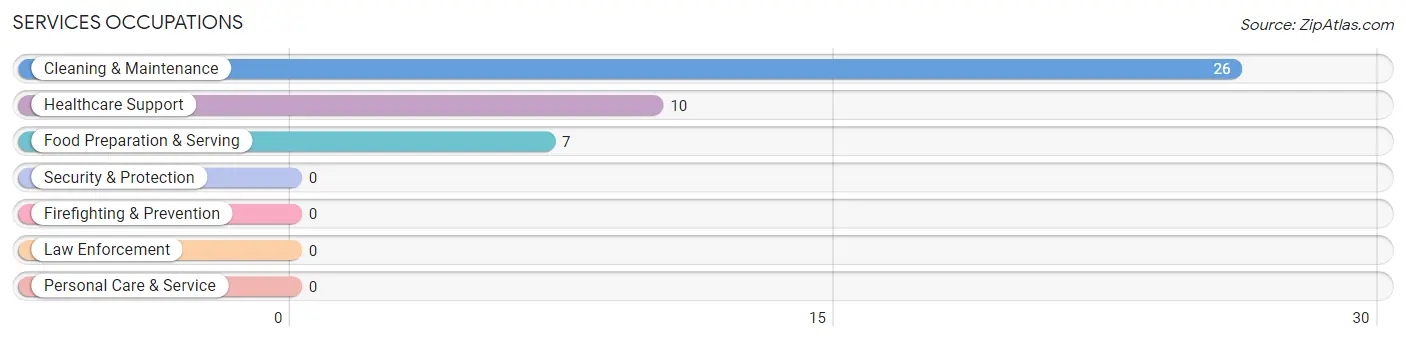
Services Occupations by Sex
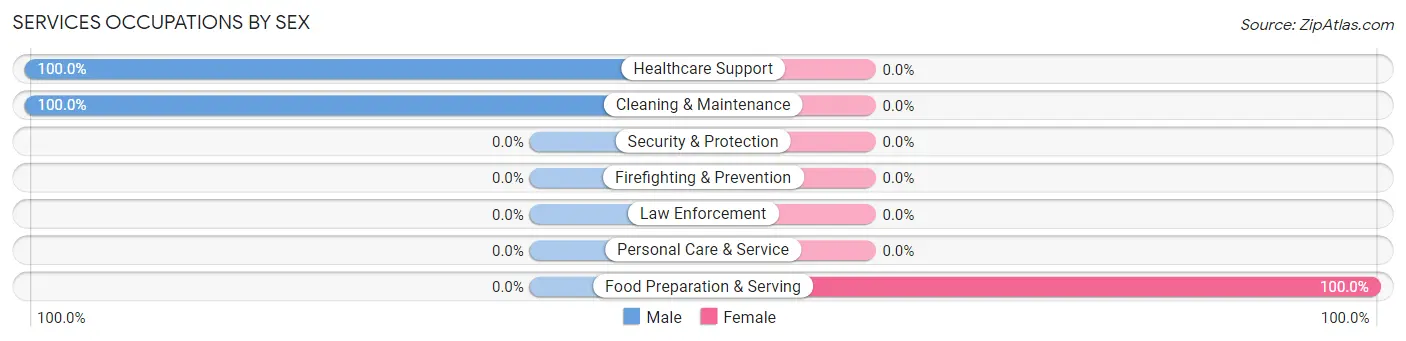
| Occupation | Male | Female |
| Healthcare Support | 10 (100.0%) | 0 (0.0%) |
| Security & Protection | 0 (0.0%) | 0 (0.0%) |
| Firefighting & Prevention | 0 (0.0%) | 0 (0.0%) |
| Law Enforcement | 0 (0.0%) | 0 (0.0%) |
| Food Preparation & Serving | 0 (0.0%) | 7 (100.0%) |
| Cleaning & Maintenance | 26 (100.0%) | 0 (0.0%) |
| Personal Care & Service | 0 (0.0%) | 0 (0.0%) |
| Total (Category) | 36 (83.7%) | 7 (16.3%) |
| Total (Overall) | 137 (41.4%) | 194 (58.6%) |
Sales and Office Occupations
The most common Sales and Office occupations in Stony Ridge are Office & Administration (82 | 24.8%), and Sales & Related (42 | 12.7%).
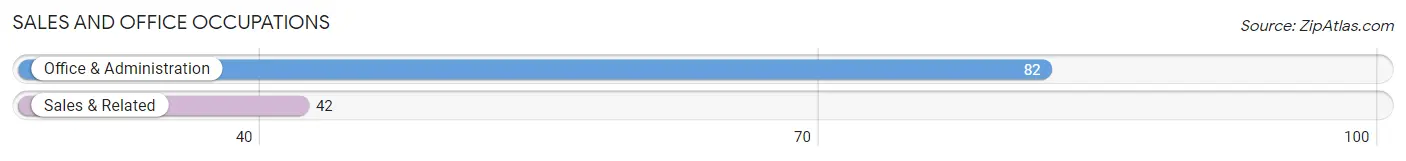
Sales and Office Occupations by Sex
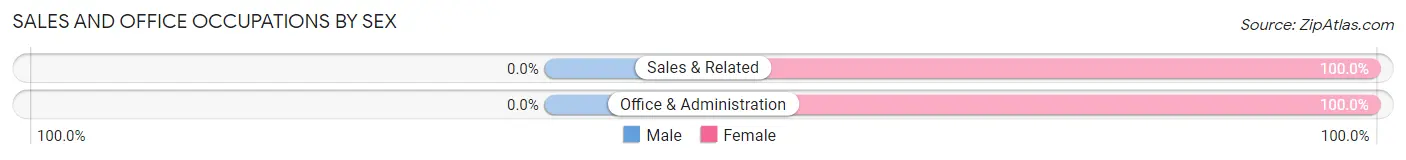
| Occupation | Male | Female |
| Sales & Related | 0 (0.0%) | 42 (100.0%) |
| Office & Administration | 0 (0.0%) | 82 (100.0%) |
| Total (Category) | 0 (0.0%) | 124 (100.0%) |
| Total (Overall) | 137 (41.4%) | 194 (58.6%) |
Natural Resources, Construction and Maintenance Occupations
The most common Natural Resources, Construction and Maintenance occupations in Stony Ridge are , and Installation, Maintenance & Repair (8 | 2.4%).
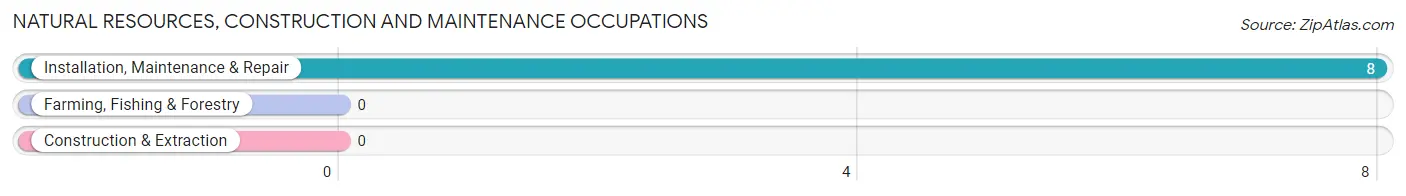
Natural Resources, Construction and Maintenance Occupations by Sex
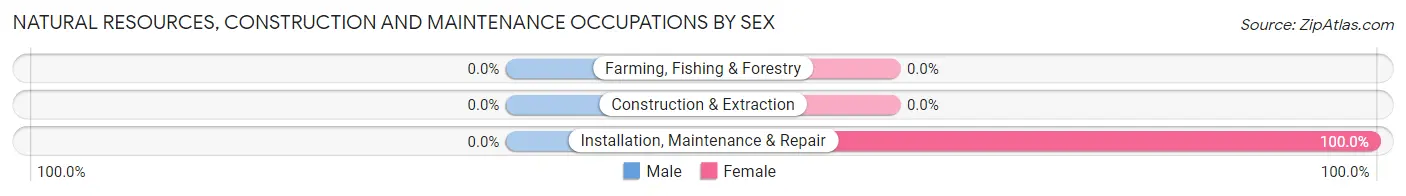
| Occupation | Male | Female |
| Farming, Fishing & Forestry | 0 (0.0%) | 0 (0.0%) |
| Construction & Extraction | 0 (0.0%) | 0 (0.0%) |
| Installation, Maintenance & Repair | 0 (0.0%) | 8 (100.0%) |
| Total (Category) | 0 (0.0%) | 8 (100.0%) |
| Total (Overall) | 137 (41.4%) | 194 (58.6%) |
Production, Transportation and Moving Occupations
The most common Production, Transportation and Moving occupations in Stony Ridge are Material Moving (67 | 20.2%), and Production (31 | 9.4%).
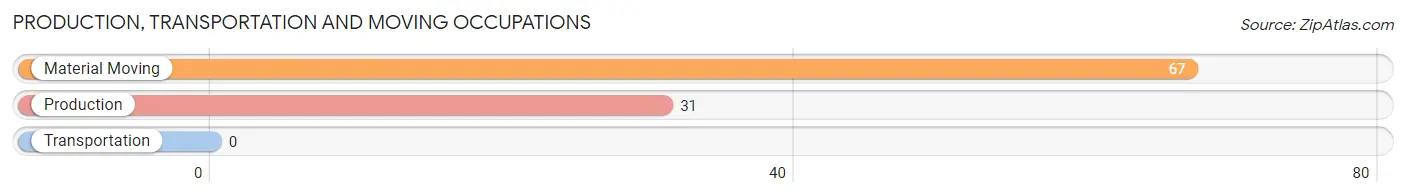
Production, Transportation and Moving Occupations by Sex
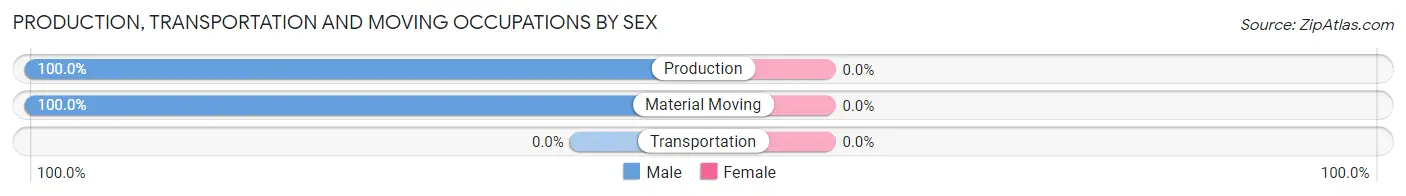
| Occupation | Male | Female |
| Production | 31 (100.0%) | 0 (0.0%) |
| Transportation | 0 (0.0%) | 0 (0.0%) |
| Material Moving | 67 (100.0%) | 0 (0.0%) |
| Total (Category) | 98 (100.0%) | 0 (0.0%) |
| Total (Overall) | 137 (41.4%) | 194 (58.6%) |
Employment Industries by Sex in Stony Ridge
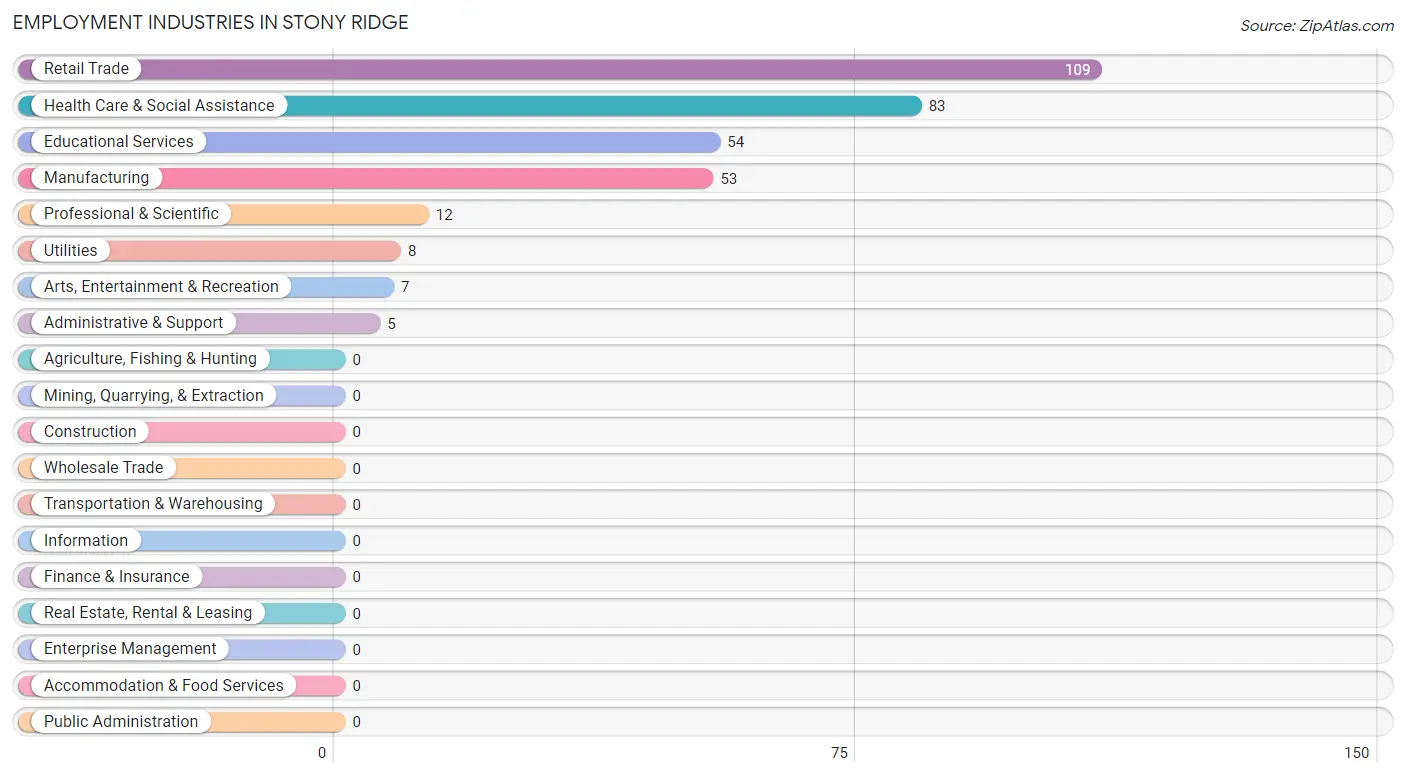
Employment Industries in Stony Ridge
The major employment industries in Stony Ridge include Retail Trade (109 | 32.9%), Health Care & Social Assistance (83 | 25.1%), Educational Services (54 | 16.3%), Manufacturing (53 | 16.0%), and Professional & Scientific (12 | 3.6%).
Employment Industries by Sex in Stony Ridge
The Stony Ridge industries that see more men than women are Utilities (100.0%), Professional & Scientific (100.0%), and Administrative & Support (100.0%), whereas the industries that tend to have a higher number of women are Arts, Entertainment & Recreation (100.0%), Health Care & Social Assistance (87.9%), and Educational Services (61.1%).
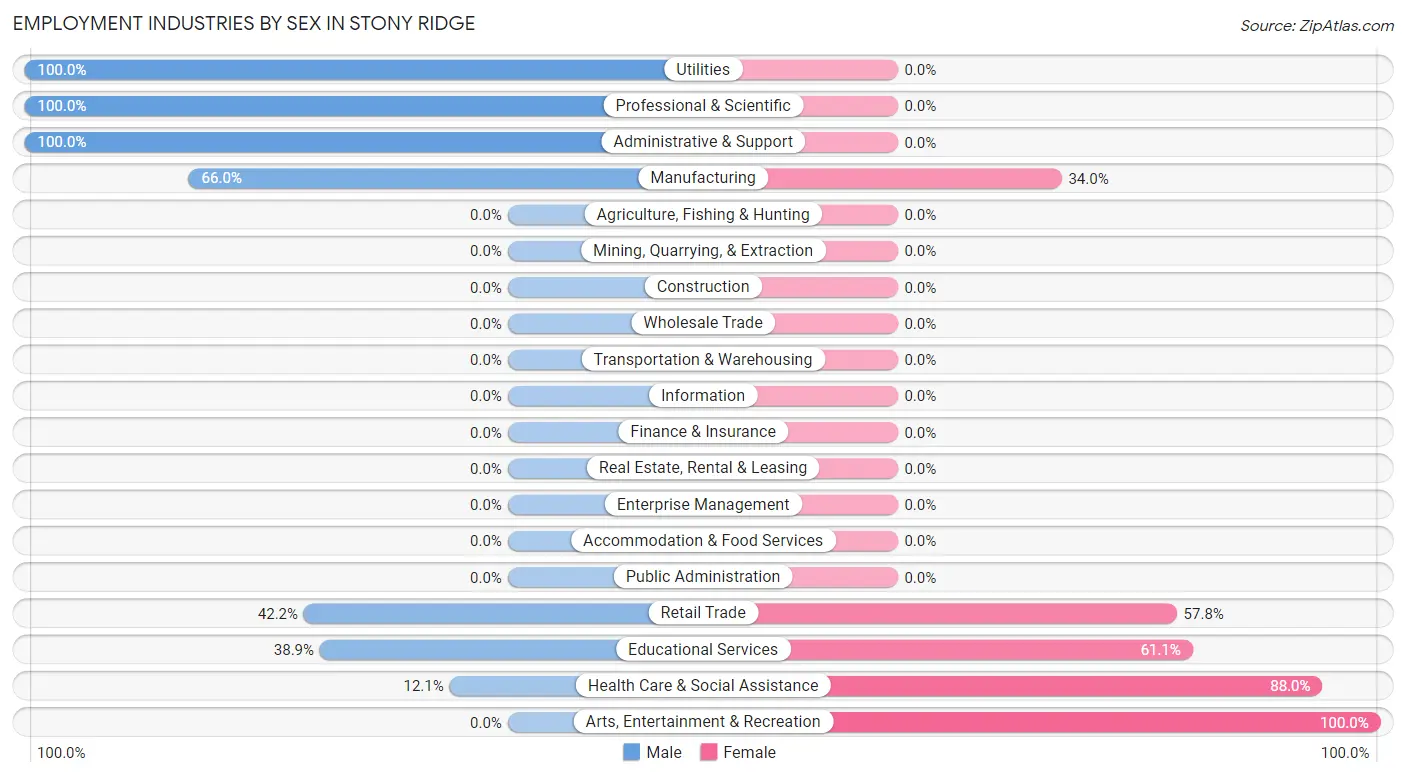
| Industry | Male | Female |
| Agriculture, Fishing & Hunting | 0 (0.0%) | 0 (0.0%) |
| Mining, Quarrying, & Extraction | 0 (0.0%) | 0 (0.0%) |
| Construction | 0 (0.0%) | 0 (0.0%) |
| Manufacturing | 35 (66.0%) | 18 (34.0%) |
| Wholesale Trade | 0 (0.0%) | 0 (0.0%) |
| Retail Trade | 46 (42.2%) | 63 (57.8%) |
| Transportation & Warehousing | 0 (0.0%) | 0 (0.0%) |
| Utilities | 8 (100.0%) | 0 (0.0%) |
| Information | 0 (0.0%) | 0 (0.0%) |
| Finance & Insurance | 0 (0.0%) | 0 (0.0%) |
| Real Estate, Rental & Leasing | 0 (0.0%) | 0 (0.0%) |
| Professional & Scientific | 12 (100.0%) | 0 (0.0%) |
| Enterprise Management | 0 (0.0%) | 0 (0.0%) |
| Administrative & Support | 5 (100.0%) | 0 (0.0%) |
| Educational Services | 21 (38.9%) | 33 (61.1%) |
| Health Care & Social Assistance | 10 (12.0%) | 73 (87.9%) |
| Arts, Entertainment & Recreation | 0 (0.0%) | 7 (100.0%) |
| Accommodation & Food Services | 0 (0.0%) | 0 (0.0%) |
| Public Administration | 0 (0.0%) | 0 (0.0%) |
| Total | 137 (41.4%) | 194 (58.6%) |
Education in Stony Ridge
School Enrollment in Stony Ridge
The most common levels of schooling among the 86 students in Stony Ridge are elementary school (25 | 29.1%), high school (25 | 29.1%), and kindergarten (19 | 22.1%).
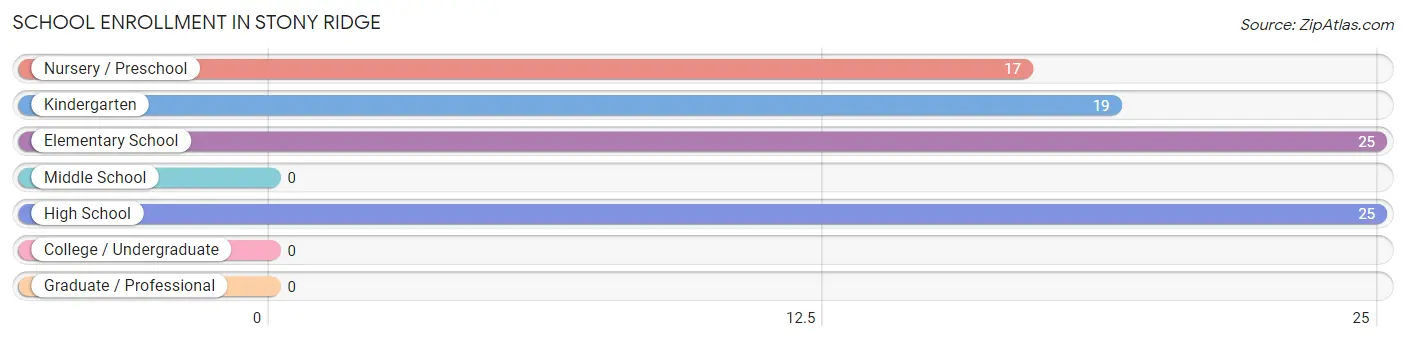
| School Level | # Students | % Students |
| Nursery / Preschool | 17 | 19.8% |
| Kindergarten | 19 | 22.1% |
| Elementary School | 25 | 29.1% |
| Middle School | 0 | 0.0% |
| High School | 25 | 29.1% |
| College / Undergraduate | 0 | 0.0% |
| Graduate / Professional | 0 | 0.0% |
| Total | 86 | 100.0% |
School Enrollment by Age by Funding Source in Stony Ridge
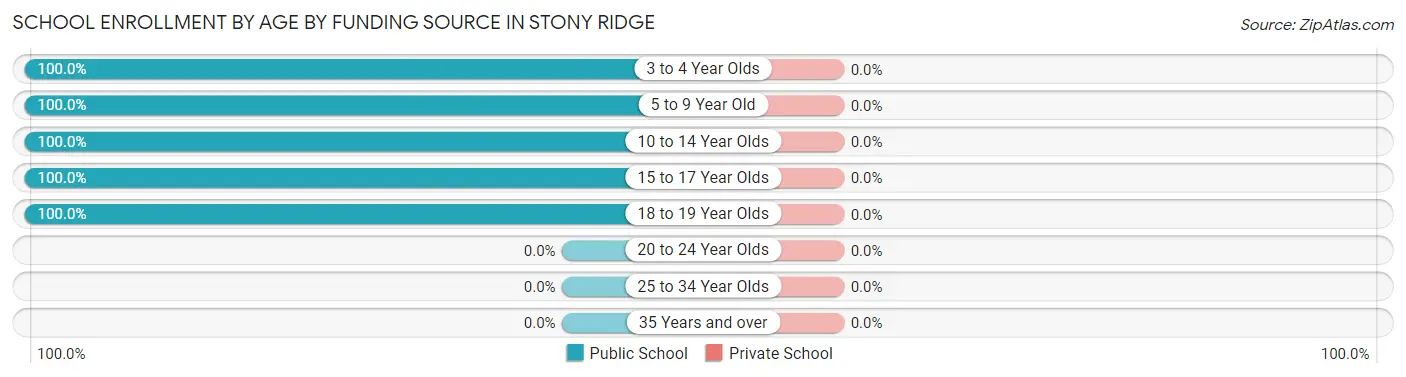
| Age Bracket | Public School | Private School |
| 3 to 4 Year Olds | 17 (100.0%) | 0 (0.0%) |
| 5 to 9 Year Old | 29 (100.0%) | 0 (0.0%) |
| 10 to 14 Year Olds | 15 (100.0%) | 0 (0.0%) |
| 15 to 17 Year Olds | 14 (100.0%) | 0 (0.0%) |
| 18 to 19 Year Olds | 11 (100.0%) | 0 (0.0%) |
| 20 to 24 Year Olds | 0 (0.0%) | 0 (0.0%) |
| 25 to 34 Year Olds | 0 (0.0%) | 0 (0.0%) |
| 35 Years and over | 0 (0.0%) | 0 (0.0%) |
| Total | 86 (100.0%) | 0 (0.0%) |
Educational Attainment by Field of Study in Stony Ridge
Education (28 | 42.4%), visual & performing arts (28 | 42.4%), and computers & mathematics (10 | 15.1%) are the most common fields of study among 66 individuals in Stony Ridge who have obtained a bachelor's degree or higher.
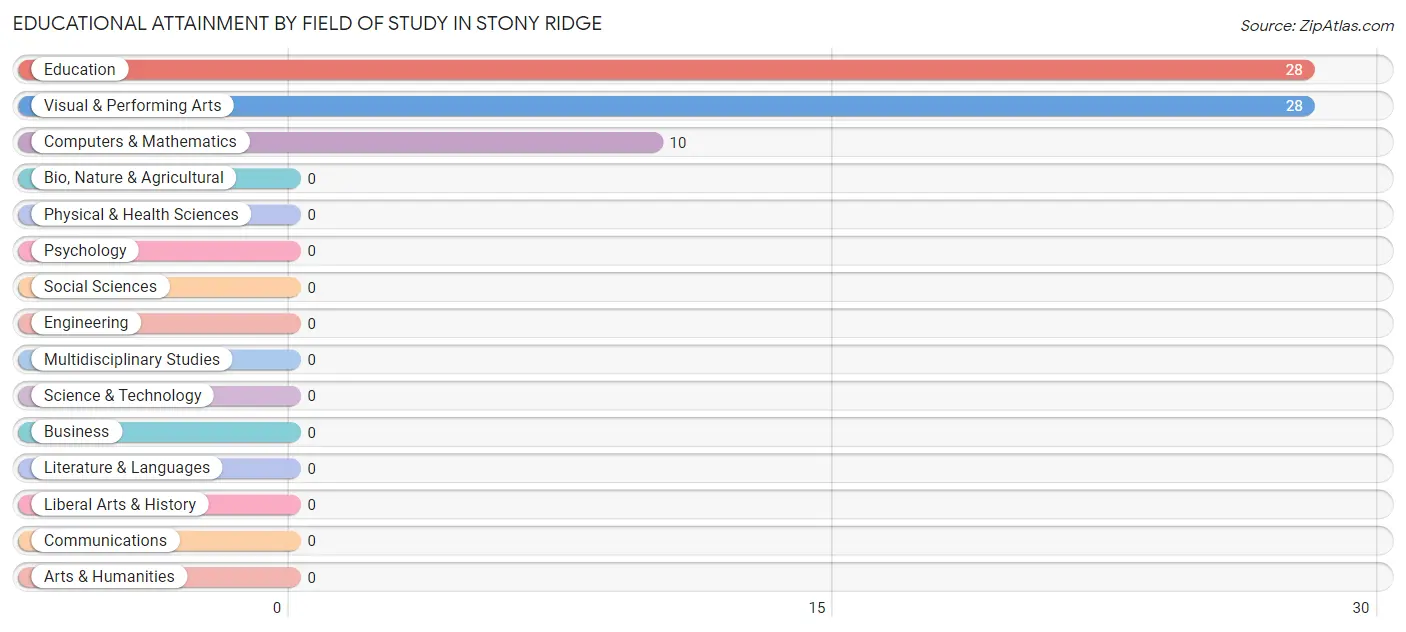
| Field of Study | # Graduates | % Graduates |
| Computers & Mathematics | 10 | 15.1% |
| Bio, Nature & Agricultural | 0 | 0.0% |
| Physical & Health Sciences | 0 | 0.0% |
| Psychology | 0 | 0.0% |
| Social Sciences | 0 | 0.0% |
| Engineering | 0 | 0.0% |
| Multidisciplinary Studies | 0 | 0.0% |
| Science & Technology | 0 | 0.0% |
| Business | 0 | 0.0% |
| Education | 28 | 42.4% |
| Literature & Languages | 0 | 0.0% |
| Liberal Arts & History | 0 | 0.0% |
| Visual & Performing Arts | 28 | 42.4% |
| Communications | 0 | 0.0% |
| Arts & Humanities | 0 | 0.0% |
| Total | 66 | 100.0% |
Transportation & Commute in Stony Ridge
Vehicle Availability by Sex in Stony Ridge
The most prevalent vehicle ownership categories in Stony Ridge are males with 3 vehicles (63, accounting for 46.0%) and females with 3 vehicles (24, making up 32.5%).
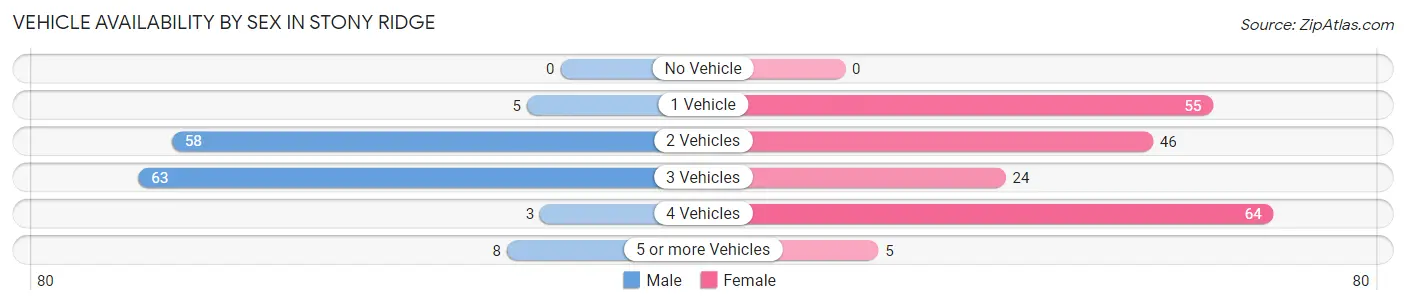
| Vehicles Available | Male | Female |
| No Vehicle | 0 (0.0%) | 0 (0.0%) |
| 1 Vehicle | 5 (3.6%) | 55 (28.3%) |
| 2 Vehicles | 58 (42.3%) | 46 (23.7%) |
| 3 Vehicles | 63 (46.0%) | 24 (12.4%) |
| 4 Vehicles | 3 (2.2%) | 64 (33.0%) |
| 5 or more Vehicles | 8 (5.8%) | 5 (2.6%) |
| Total | 137 (100.0%) | 194 (100.0%) |
Commute Time in Stony Ridge
The most frequently occuring commute durations in Stony Ridge are 25 to 29 minutes (129 commuters, 41.6%), 10 to 14 minutes (62 commuters, 20.0%), and 30 to 34 minutes (41 commuters, 13.2%).
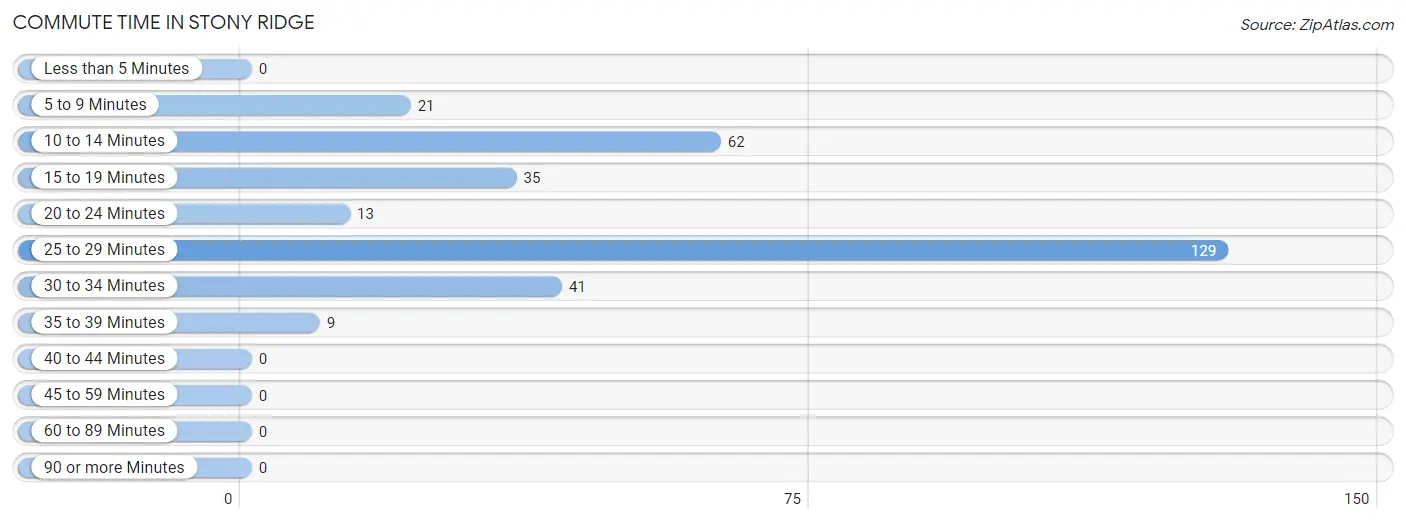
| Commute Time | # Commuters | % Commuters |
| Less than 5 Minutes | 0 | 0.0% |
| 5 to 9 Minutes | 21 | 6.8% |
| 10 to 14 Minutes | 62 | 20.0% |
| 15 to 19 Minutes | 35 | 11.3% |
| 20 to 24 Minutes | 13 | 4.2% |
| 25 to 29 Minutes | 129 | 41.6% |
| 30 to 34 Minutes | 41 | 13.2% |
| 35 to 39 Minutes | 9 | 2.9% |
| 40 to 44 Minutes | 0 | 0.0% |
| 45 to 59 Minutes | 0 | 0.0% |
| 60 to 89 Minutes | 0 | 0.0% |
| 90 or more Minutes | 0 | 0.0% |
Commute Time by Sex in Stony Ridge
The most common commute times in Stony Ridge are 25 to 29 minutes (58 commuters, 42.3%) for males and 25 to 29 minutes (71 commuters, 41.0%) for females.
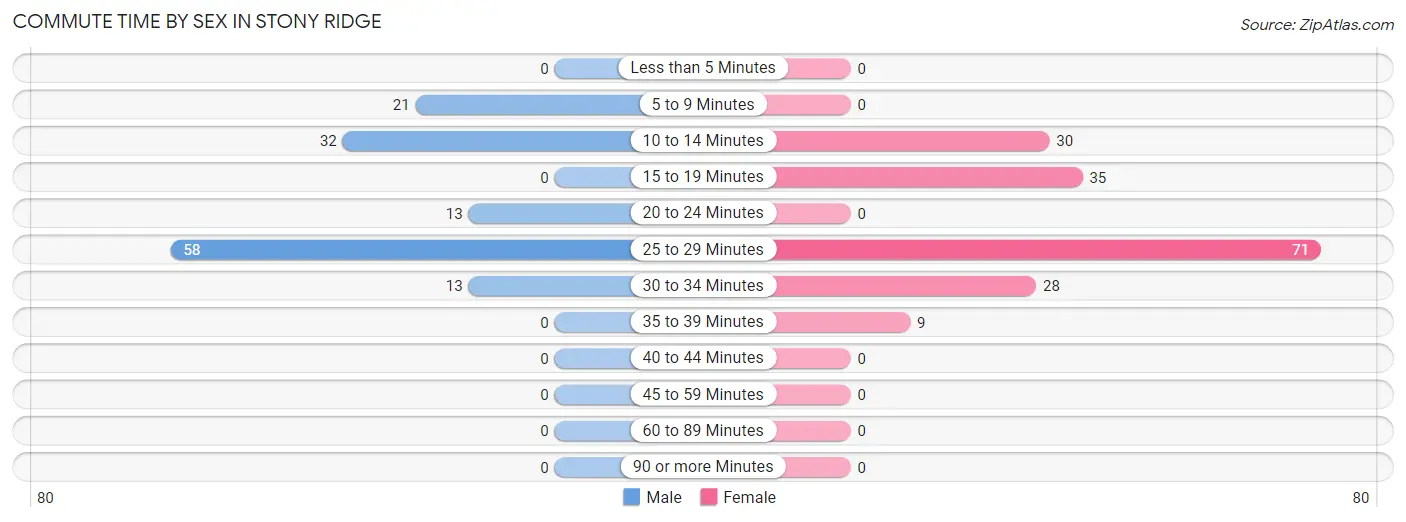
| Commute Time | Male | Female |
| Less than 5 Minutes | 0 (0.0%) | 0 (0.0%) |
| 5 to 9 Minutes | 21 (15.3%) | 0 (0.0%) |
| 10 to 14 Minutes | 32 (23.4%) | 30 (17.3%) |
| 15 to 19 Minutes | 0 (0.0%) | 35 (20.2%) |
| 20 to 24 Minutes | 13 (9.5%) | 0 (0.0%) |
| 25 to 29 Minutes | 58 (42.3%) | 71 (41.0%) |
| 30 to 34 Minutes | 13 (9.5%) | 28 (16.2%) |
| 35 to 39 Minutes | 0 (0.0%) | 9 (5.2%) |
| 40 to 44 Minutes | 0 (0.0%) | 0 (0.0%) |
| 45 to 59 Minutes | 0 (0.0%) | 0 (0.0%) |
| 60 to 89 Minutes | 0 (0.0%) | 0 (0.0%) |
| 90 or more Minutes | 0 (0.0%) | 0 (0.0%) |
Time of Departure to Work by Sex in Stony Ridge
The most frequent times of departure to work in Stony Ridge are 7:00 AM to 7:29 AM (60, 43.8%) for males and 5:30 AM to 5:59 AM (69, 39.9%) for females.
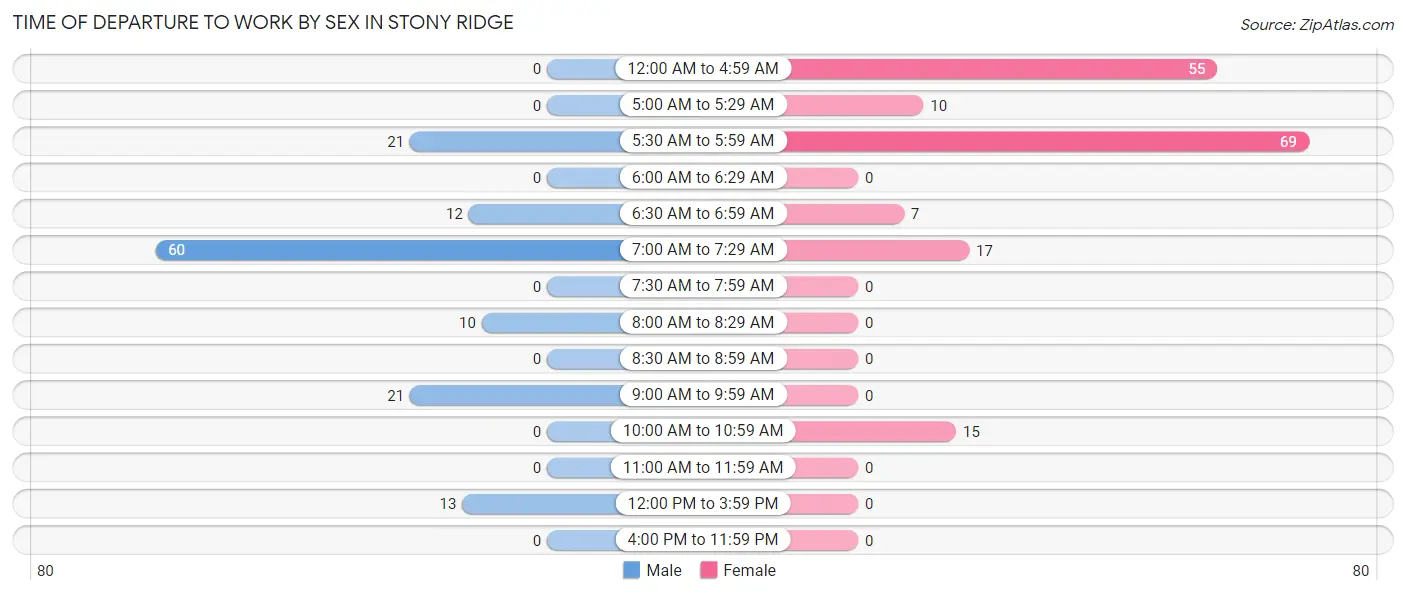
| Time of Departure | Male | Female |
| 12:00 AM to 4:59 AM | 0 (0.0%) | 55 (31.8%) |
| 5:00 AM to 5:29 AM | 0 (0.0%) | 10 (5.8%) |
| 5:30 AM to 5:59 AM | 21 (15.3%) | 69 (39.9%) |
| 6:00 AM to 6:29 AM | 0 (0.0%) | 0 (0.0%) |
| 6:30 AM to 6:59 AM | 12 (8.8%) | 7 (4.1%) |
| 7:00 AM to 7:29 AM | 60 (43.8%) | 17 (9.8%) |
| 7:30 AM to 7:59 AM | 0 (0.0%) | 0 (0.0%) |
| 8:00 AM to 8:29 AM | 10 (7.3%) | 0 (0.0%) |
| 8:30 AM to 8:59 AM | 0 (0.0%) | 0 (0.0%) |
| 9:00 AM to 9:59 AM | 21 (15.3%) | 0 (0.0%) |
| 10:00 AM to 10:59 AM | 0 (0.0%) | 15 (8.7%) |
| 11:00 AM to 11:59 AM | 0 (0.0%) | 0 (0.0%) |
| 12:00 PM to 3:59 PM | 13 (9.5%) | 0 (0.0%) |
| 4:00 PM to 11:59 PM | 0 (0.0%) | 0 (0.0%) |
| Total | 137 (100.0%) | 173 (100.0%) |
Housing Occupancy in Stony Ridge
Occupancy by Ownership in Stony Ridge
Of the total 288 dwellings in Stony Ridge, owner-occupied units account for 202 (70.1%), while renter-occupied units make up 86 (29.9%).
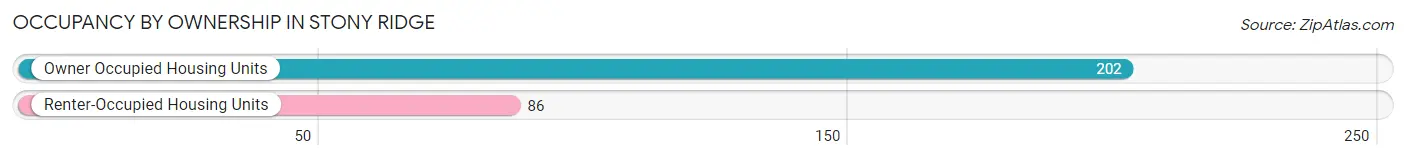
| Occupancy | # Housing Units | % Housing Units |
| Owner Occupied Housing Units | 202 | 70.1% |
| Renter-Occupied Housing Units | 86 | 29.9% |
| Total Occupied Housing Units | 288 | 100.0% |
Occupancy by Household Size in Stony Ridge
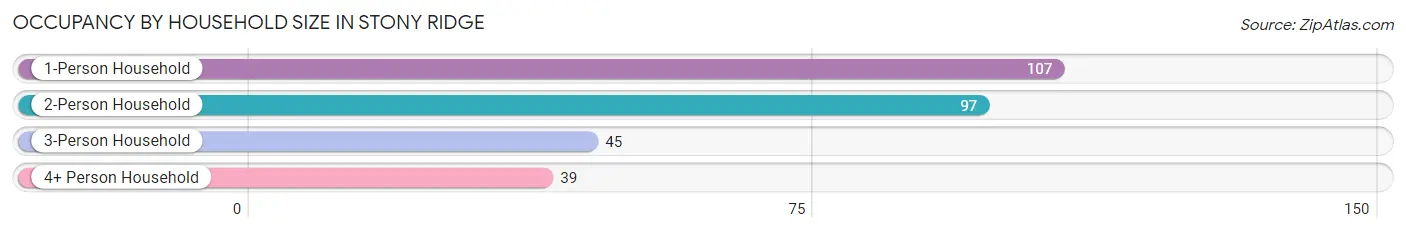
| Household Size | # Housing Units | % Housing Units |
| 1-Person Household | 107 | 37.1% |
| 2-Person Household | 97 | 33.7% |
| 3-Person Household | 45 | 15.6% |
| 4+ Person Household | 39 | 13.5% |
| Total Housing Units | 288 | 100.0% |
Occupancy by Ownership by Household Size in Stony Ridge
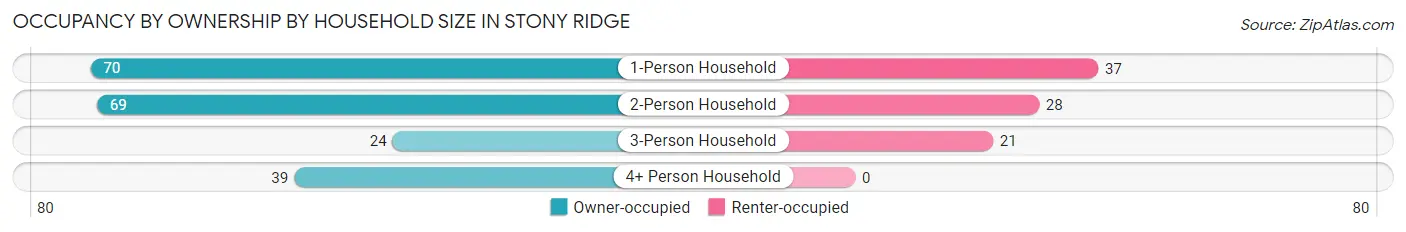
| Household Size | Owner-occupied | Renter-occupied |
| 1-Person Household | 70 (65.4%) | 37 (34.6%) |
| 2-Person Household | 69 (71.1%) | 28 (28.9%) |
| 3-Person Household | 24 (53.3%) | 21 (46.7%) |
| 4+ Person Household | 39 (100.0%) | 0 (0.0%) |
| Total Housing Units | 202 (70.1%) | 86 (29.9%) |
Occupancy by Educational Attainment in Stony Ridge
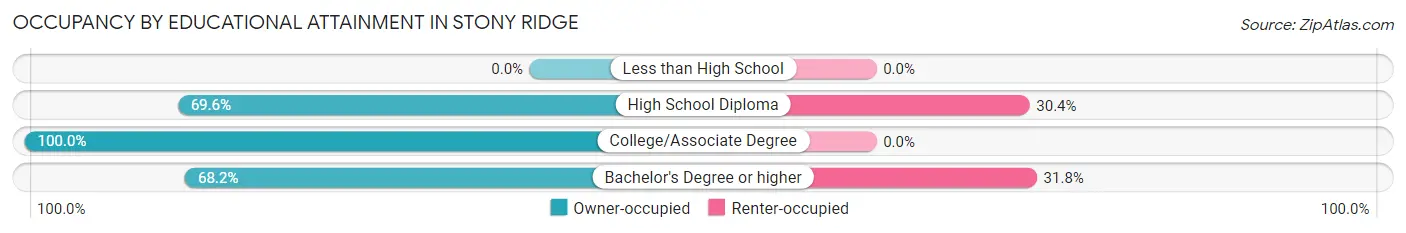
| Household Size | Owner-occupied | Renter-occupied |
| Less than High School | 0 (0.0%) | 0 (0.0%) |
| High School Diploma | 149 (69.6%) | 65 (30.4%) |
| College/Associate Degree | 8 (100.0%) | 0 (0.0%) |
| Bachelor's Degree or higher | 45 (68.2%) | 21 (31.8%) |
Occupancy by Age of Householder in Stony Ridge
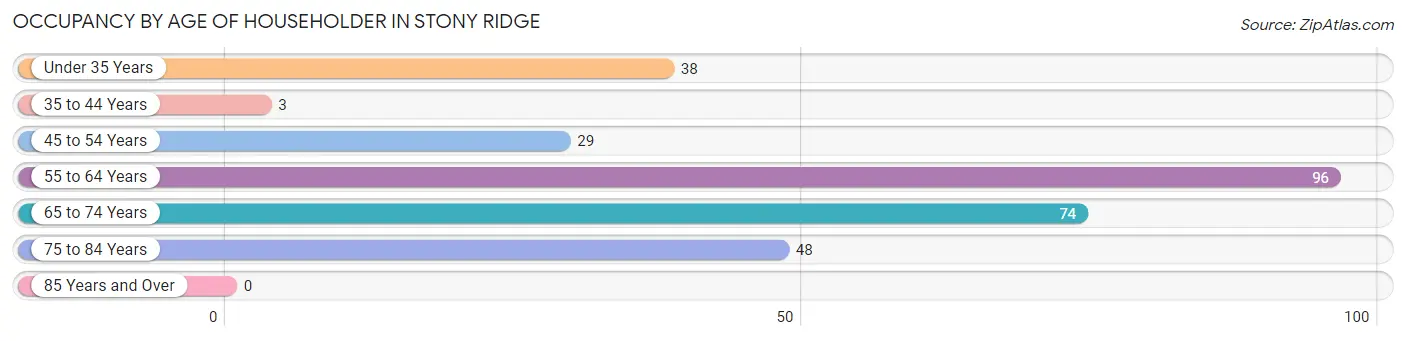
| Age Bracket | # Households | % Households |
| Under 35 Years | 38 | 13.2% |
| 35 to 44 Years | 3 | 1.0% |
| 45 to 54 Years | 29 | 10.1% |
| 55 to 64 Years | 96 | 33.3% |
| 65 to 74 Years | 74 | 25.7% |
| 75 to 84 Years | 48 | 16.7% |
| 85 Years and Over | 0 | 0.0% |
| Total | 288 | 100.0% |
Housing Finances in Stony Ridge
Median Income by Occupancy in Stony Ridge
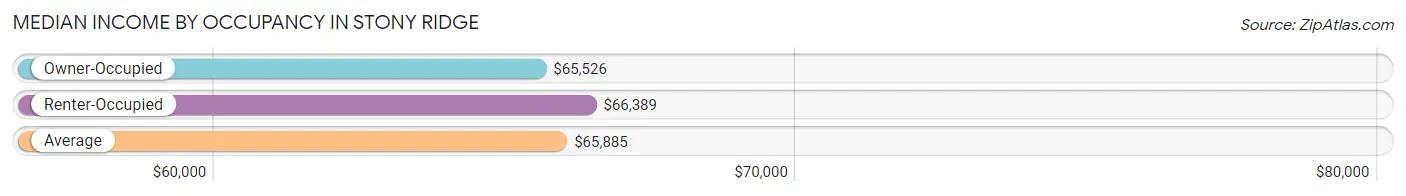
| Occupancy Type | # Households | Median Income |
| Owner-Occupied | 202 (70.1%) | $65,526 |
| Renter-Occupied | 86 (29.9%) | $66,389 |
| Average | 288 (100.0%) | $65,885 |
Occupancy by Householder Income Bracket in Stony Ridge
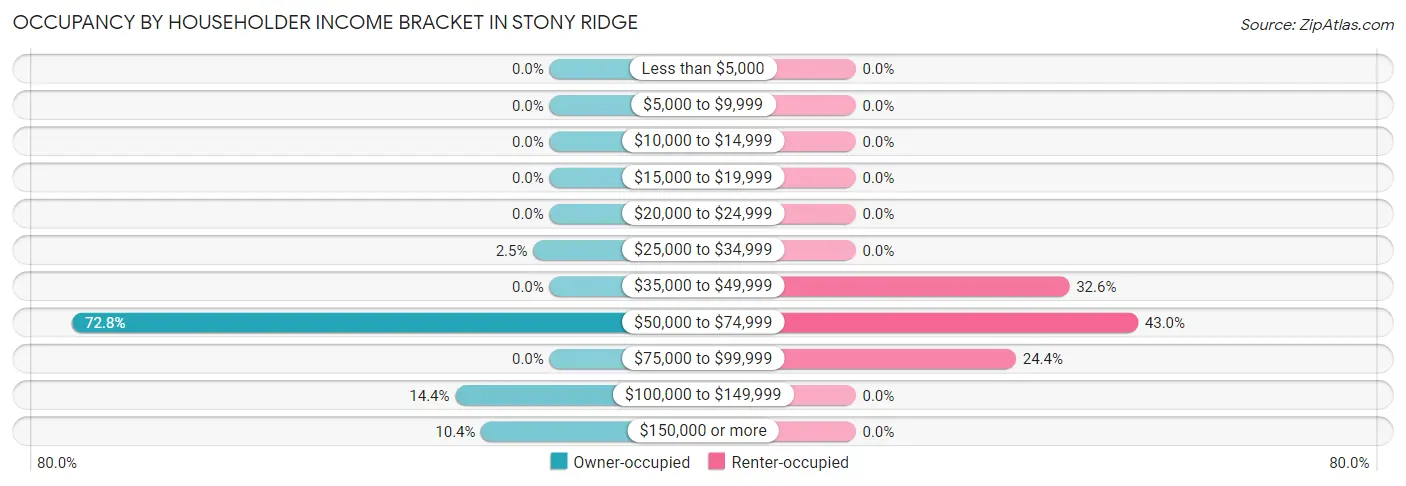
| Income Bracket | Owner-occupied | Renter-occupied |
| Less than $5,000 | 0 (0.0%) | 0 (0.0%) |
| $5,000 to $9,999 | 0 (0.0%) | 0 (0.0%) |
| $10,000 to $14,999 | 0 (0.0%) | 0 (0.0%) |
| $15,000 to $19,999 | 0 (0.0%) | 0 (0.0%) |
| $20,000 to $24,999 | 0 (0.0%) | 0 (0.0%) |
| $25,000 to $34,999 | 5 (2.5%) | 0 (0.0%) |
| $35,000 to $49,999 | 0 (0.0%) | 28 (32.6%) |
| $50,000 to $74,999 | 147 (72.8%) | 37 (43.0%) |
| $75,000 to $99,999 | 0 (0.0%) | 21 (24.4%) |
| $100,000 to $149,999 | 29 (14.4%) | 0 (0.0%) |
| $150,000 or more | 21 (10.4%) | 0 (0.0%) |
| Total | 202 (100.0%) | 86 (100.0%) |
Monthly Housing Cost Tiers in Stony Ridge
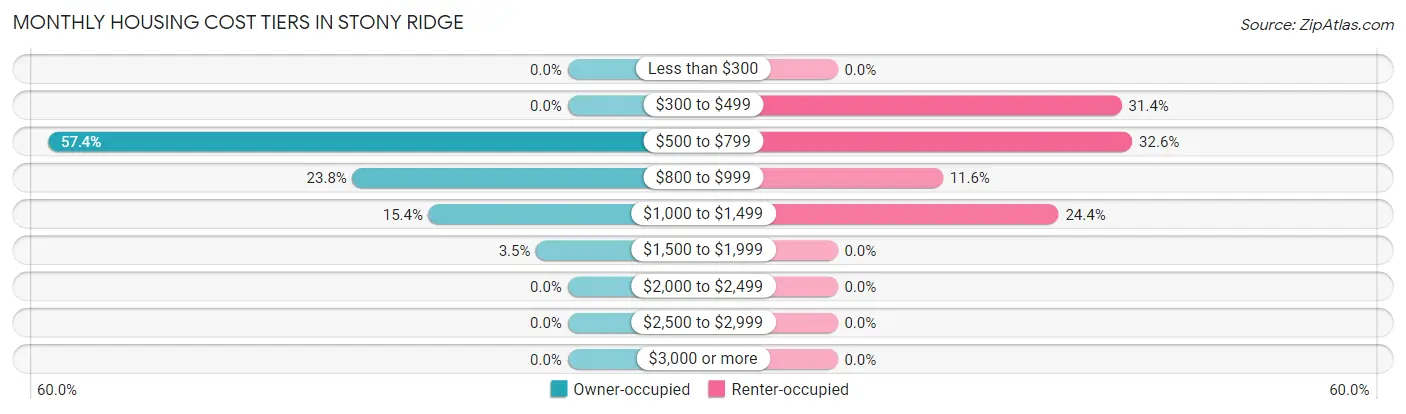
| Monthly Cost | Owner-occupied | Renter-occupied |
| Less than $300 | 0 (0.0%) | 0 (0.0%) |
| $300 to $499 | 0 (0.0%) | 27 (31.4%) |
| $500 to $799 | 116 (57.4%) | 28 (32.6%) |
| $800 to $999 | 48 (23.8%) | 10 (11.6%) |
| $1,000 to $1,499 | 31 (15.3%) | 21 (24.4%) |
| $1,500 to $1,999 | 7 (3.5%) | 0 (0.0%) |
| $2,000 to $2,499 | 0 (0.0%) | 0 (0.0%) |
| $2,500 to $2,999 | 0 (0.0%) | 0 (0.0%) |
| $3,000 or more | 0 (0.0%) | 0 (0.0%) |
| Total | 202 (100.0%) | 86 (100.0%) |
Physical Housing Characteristics in Stony Ridge
Housing Structures in Stony Ridge
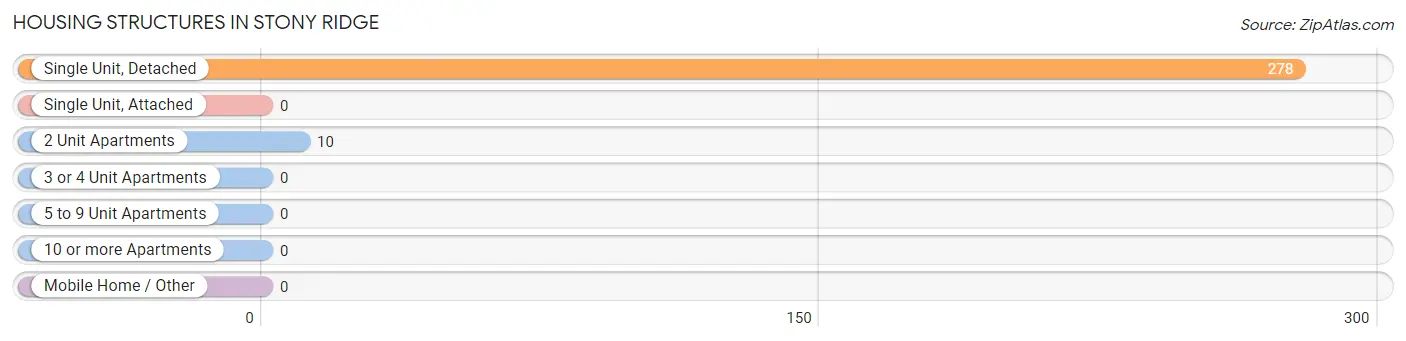
| Structure Type | # Housing Units | % Housing Units |
| Single Unit, Detached | 278 | 96.5% |
| Single Unit, Attached | 0 | 0.0% |
| 2 Unit Apartments | 10 | 3.5% |
| 3 or 4 Unit Apartments | 0 | 0.0% |
| 5 to 9 Unit Apartments | 0 | 0.0% |
| 10 or more Apartments | 0 | 0.0% |
| Mobile Home / Other | 0 | 0.0% |
| Total | 288 | 100.0% |
Housing Structures by Occupancy in Stony Ridge
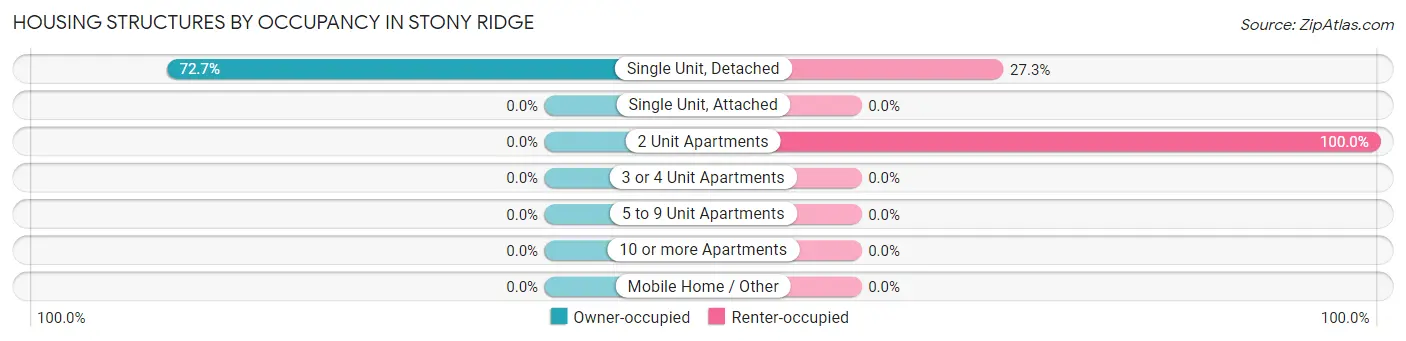
| Structure Type | Owner-occupied | Renter-occupied |
| Single Unit, Detached | 202 (72.7%) | 76 (27.3%) |
| Single Unit, Attached | 0 (0.0%) | 0 (0.0%) |
| 2 Unit Apartments | 0 (0.0%) | 10 (100.0%) |
| 3 or 4 Unit Apartments | 0 (0.0%) | 0 (0.0%) |
| 5 to 9 Unit Apartments | 0 (0.0%) | 0 (0.0%) |
| 10 or more Apartments | 0 (0.0%) | 0 (0.0%) |
| Mobile Home / Other | 0 (0.0%) | 0 (0.0%) |
| Total | 202 (70.1%) | 86 (29.9%) |
Housing Structures by Number of Rooms in Stony Ridge
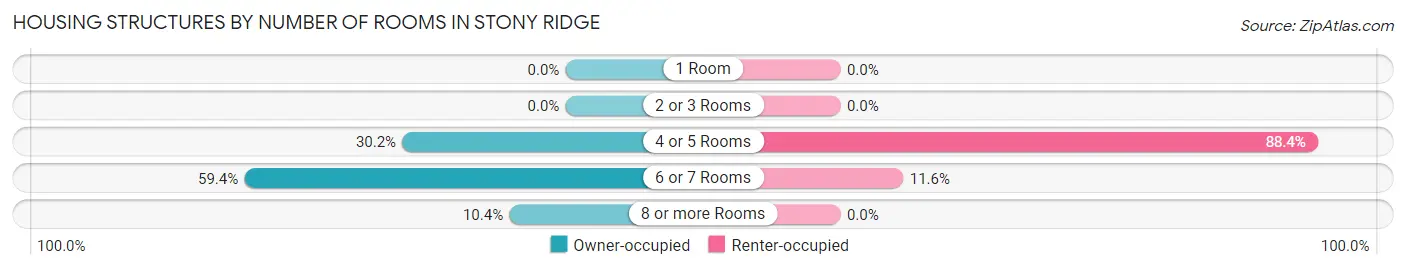
| Number of Rooms | Owner-occupied | Renter-occupied |
| 1 Room | 0 (0.0%) | 0 (0.0%) |
| 2 or 3 Rooms | 0 (0.0%) | 0 (0.0%) |
| 4 or 5 Rooms | 61 (30.2%) | 76 (88.4%) |
| 6 or 7 Rooms | 120 (59.4%) | 10 (11.6%) |
| 8 or more Rooms | 21 (10.4%) | 0 (0.0%) |
| Total | 202 (100.0%) | 86 (100.0%) |
Housing Structure by Heating Type in Stony Ridge
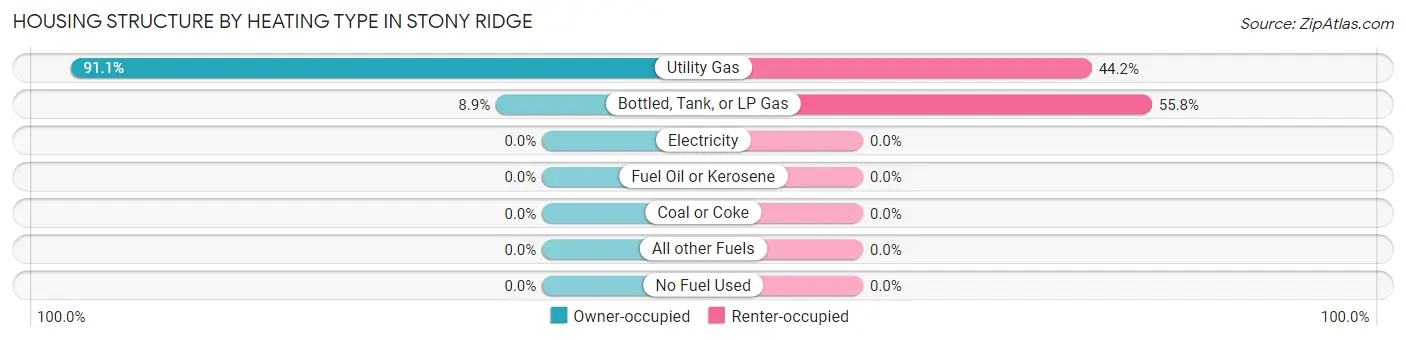
| Heating Type | Owner-occupied | Renter-occupied |
| Utility Gas | 184 (91.1%) | 38 (44.2%) |
| Bottled, Tank, or LP Gas | 18 (8.9%) | 48 (55.8%) |
| Electricity | 0 (0.0%) | 0 (0.0%) |
| Fuel Oil or Kerosene | 0 (0.0%) | 0 (0.0%) |
| Coal or Coke | 0 (0.0%) | 0 (0.0%) |
| All other Fuels | 0 (0.0%) | 0 (0.0%) |
| No Fuel Used | 0 (0.0%) | 0 (0.0%) |
| Total | 202 (100.0%) | 86 (100.0%) |
Household Vehicle Usage in Stony Ridge
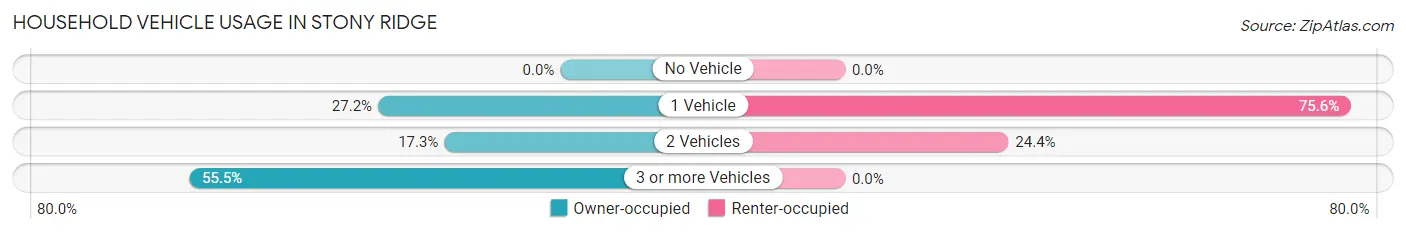
| Vehicles per Household | Owner-occupied | Renter-occupied |
| No Vehicle | 0 (0.0%) | 0 (0.0%) |
| 1 Vehicle | 55 (27.2%) | 65 (75.6%) |
| 2 Vehicles | 35 (17.3%) | 21 (24.4%) |
| 3 or more Vehicles | 112 (55.4%) | 0 (0.0%) |
| Total | 202 (100.0%) | 86 (100.0%) |
Real Estate & Mortgages in Stony Ridge
Real Estate and Mortgage Overview in Stony Ridge
| Characteristic | Without Mortgage | With Mortgage |
| Housing Units | 127 | 75 |
| Median Property Value | $81,600 | $97,500 |
| Median Household Income | $65,296 | $10 |
| Monthly Housing Costs | $642 | $0 |
| Real Estate Taxes | $1,334 | $0 |
Property Value by Mortgage Status in Stony Ridge
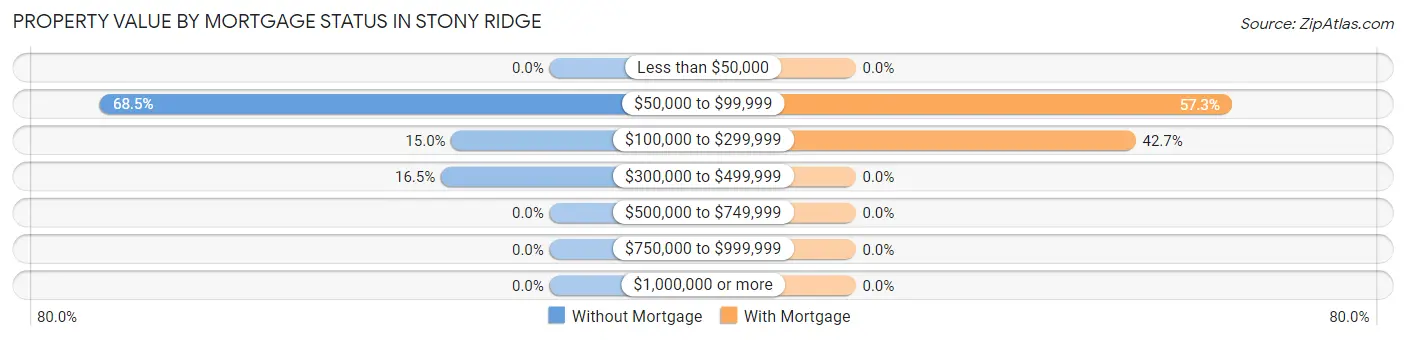
| Property Value | Without Mortgage | With Mortgage |
| Less than $50,000 | 0 (0.0%) | 0 (0.0%) |
| $50,000 to $99,999 | 87 (68.5%) | 43 (57.3%) |
| $100,000 to $299,999 | 19 (15.0%) | 32 (42.7%) |
| $300,000 to $499,999 | 21 (16.5%) | 0 (0.0%) |
| $500,000 to $749,999 | 0 (0.0%) | 0 (0.0%) |
| $750,000 to $999,999 | 0 (0.0%) | 0 (0.0%) |
| $1,000,000 or more | 0 (0.0%) | 0 (0.0%) |
| Total | 127 (100.0%) | 75 (100.0%) |
Household Income by Mortgage Status in Stony Ridge
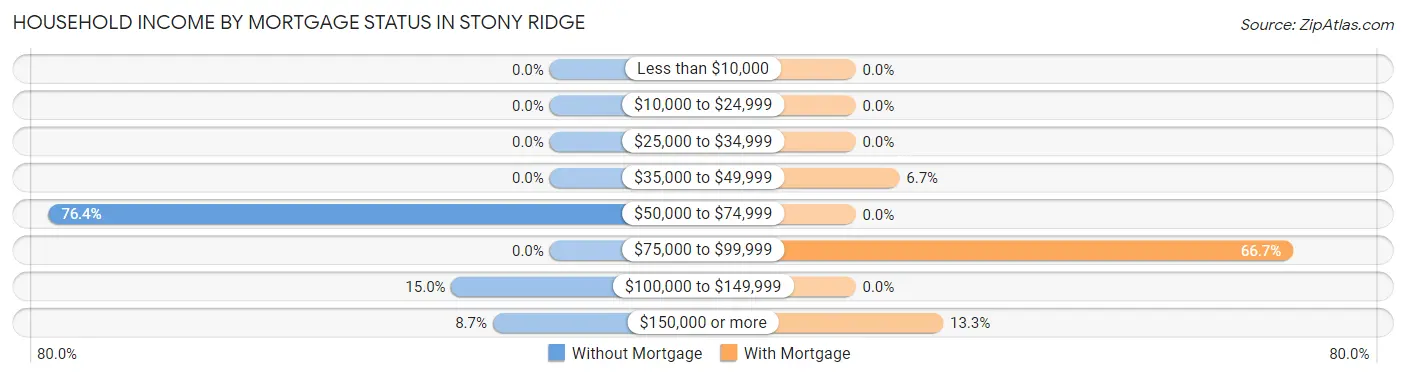
| Household Income | Without Mortgage | With Mortgage |
| Less than $10,000 | 0 (0.0%) | 0 (0.0%) |
| $10,000 to $24,999 | 0 (0.0%) | 0 (0.0%) |
| $25,000 to $34,999 | 0 (0.0%) | 0 (0.0%) |
| $35,000 to $49,999 | 0 (0.0%) | 5 (6.7%) |
| $50,000 to $74,999 | 97 (76.4%) | 0 (0.0%) |
| $75,000 to $99,999 | 0 (0.0%) | 50 (66.7%) |
| $100,000 to $149,999 | 19 (15.0%) | 0 (0.0%) |
| $150,000 or more | 11 (8.7%) | 10 (13.3%) |
| Total | 127 (100.0%) | 75 (100.0%) |
Property Value to Household Income Ratio in Stony Ridge
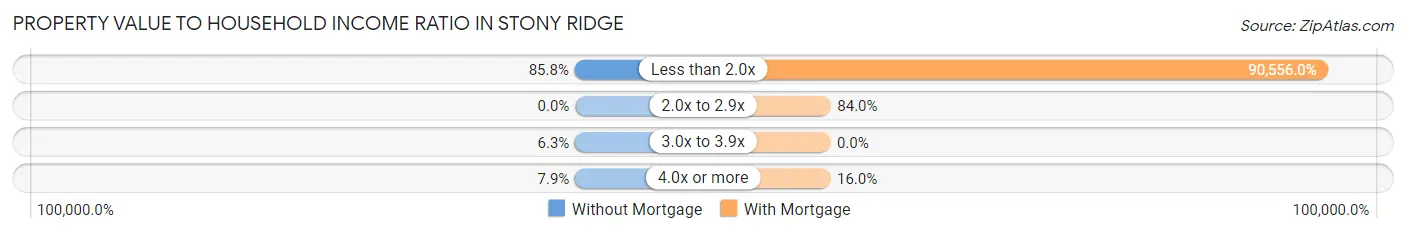
| Value-to-Income Ratio | Without Mortgage | With Mortgage |
| Less than 2.0x | 109 (85.8%) | 67,917 (90,556.0%) |
| 2.0x to 2.9x | 0 (0.0%) | 63 (84.0%) |
| 3.0x to 3.9x | 8 (6.3%) | 0 (0.0%) |
| 4.0x or more | 10 (7.9%) | 12 (16.0%) |
| Total | 127 (100.0%) | 75 (100.0%) |
Real Estate Taxes by Mortgage Status in Stony Ridge
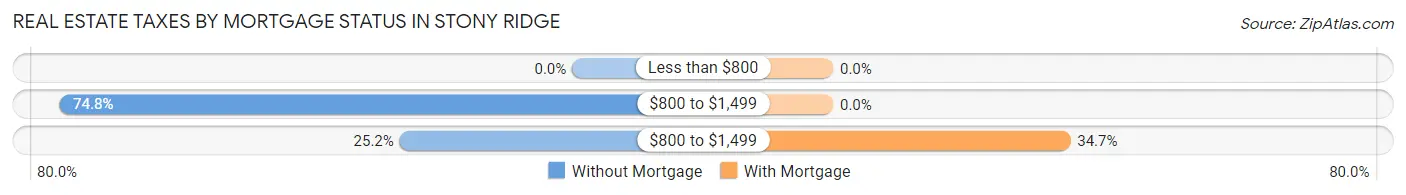
| Property Taxes | Without Mortgage | With Mortgage |
| Less than $800 | 0 (0.0%) | 0 (0.0%) |
| $800 to $1,499 | 95 (74.8%) | 0 (0.0%) |
| $800 to $1,499 | 32 (25.2%) | 26 (34.7%) |
| Total | 127 (100.0%) | 75 (100.0%) |
Health & Disability in Stony Ridge
Health Insurance Coverage by Age in Stony Ridge
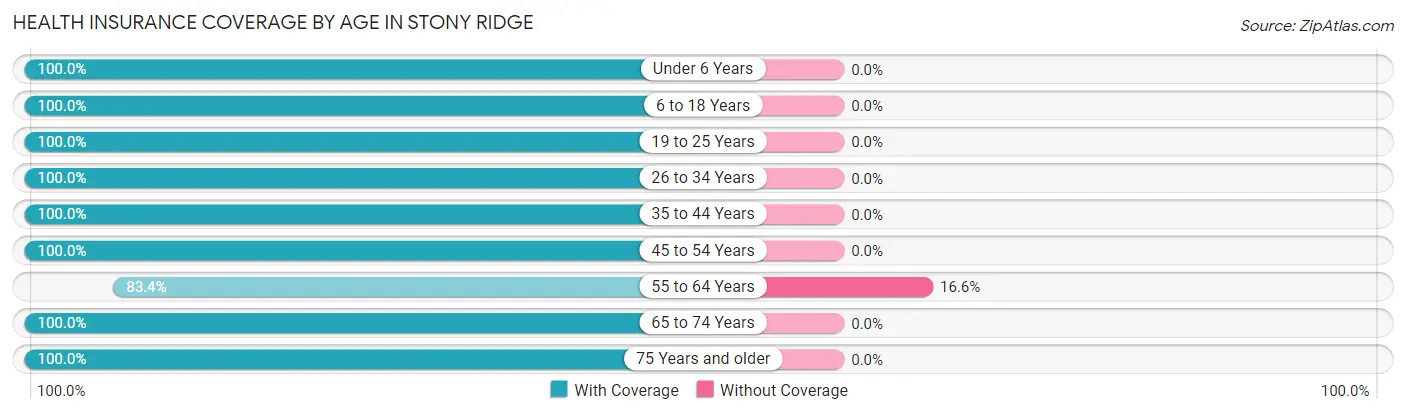
| Age Bracket | With Coverage | Without Coverage |
| Under 6 Years | 48 (100.0%) | 0 (0.0%) |
| 6 to 18 Years | 58 (100.0%) | 0 (0.0%) |
| 19 to 25 Years | 28 (100.0%) | 0 (0.0%) |
| 26 to 34 Years | 25 (100.0%) | 0 (0.0%) |
| 35 to 44 Years | 39 (100.0%) | 0 (0.0%) |
| 45 to 54 Years | 100 (100.0%) | 0 (0.0%) |
| 55 to 64 Years | 136 (83.4%) | 27 (16.6%) |
| 65 to 74 Years | 150 (100.0%) | 0 (0.0%) |
| 75 Years and older | 48 (100.0%) | 0 (0.0%) |
| Total | 632 (95.9%) | 27 (4.1%) |
Health Insurance Coverage by Citizenship Status in Stony Ridge
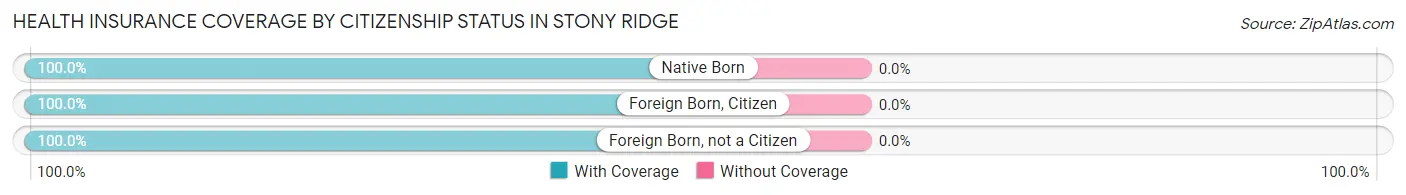
| Citizenship Status | With Coverage | Without Coverage |
| Native Born | 48 (100.0%) | 0 (0.0%) |
| Foreign Born, Citizen | 58 (100.0%) | 0 (0.0%) |
| Foreign Born, not a Citizen | 28 (100.0%) | 0 (0.0%) |
Health Insurance Coverage by Household Income in Stony Ridge
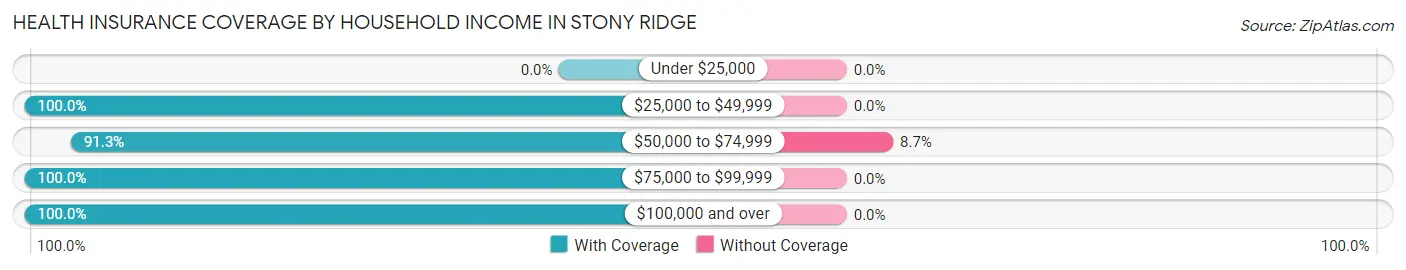
| Household Income | With Coverage | Without Coverage |
| Under $25,000 | 0 (0.0%) | 0 (0.0%) |
| $25,000 to $49,999 | 52 (100.0%) | 0 (0.0%) |
| $50,000 to $74,999 | 284 (91.3%) | 27 (8.7%) |
| $75,000 to $99,999 | 125 (100.0%) | 0 (0.0%) |
| $100,000 and over | 171 (100.0%) | 0 (0.0%) |
Public vs Private Health Insurance Coverage by Age in Stony Ridge
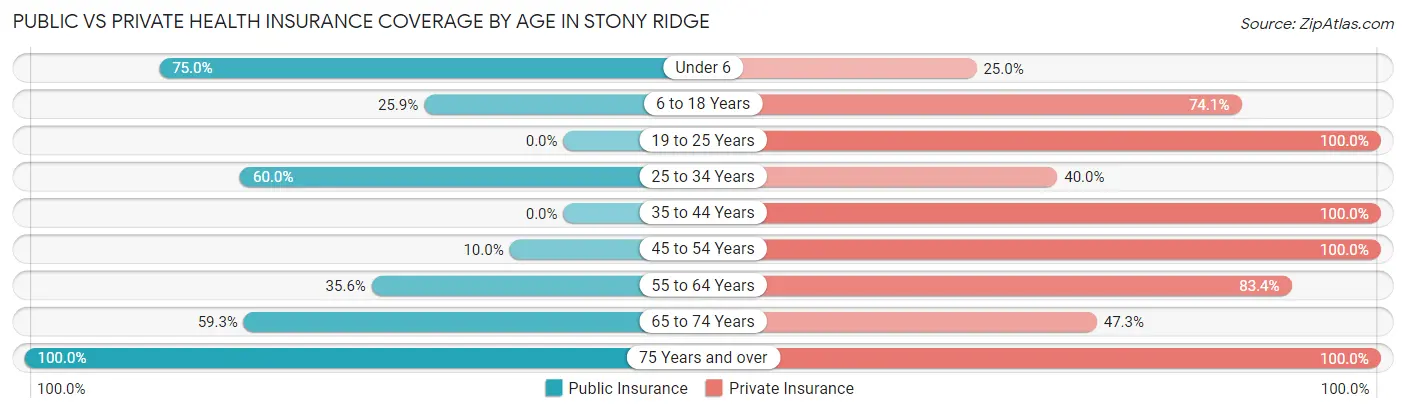
| Age Bracket | Public Insurance | Private Insurance |
| Under 6 | 36 (75.0%) | 12 (25.0%) |
| 6 to 18 Years | 15 (25.9%) | 43 (74.1%) |
| 19 to 25 Years | 0 (0.0%) | 28 (100.0%) |
| 25 to 34 Years | 15 (60.0%) | 10 (40.0%) |
| 35 to 44 Years | 0 (0.0%) | 39 (100.0%) |
| 45 to 54 Years | 10 (10.0%) | 100 (100.0%) |
| 55 to 64 Years | 58 (35.6%) | 136 (83.4%) |
| 65 to 74 Years | 89 (59.3%) | 71 (47.3%) |
| 75 Years and over | 48 (100.0%) | 48 (100.0%) |
| Total | 271 (41.1%) | 487 (73.9%) |
Disability Status by Sex by Age in Stony Ridge
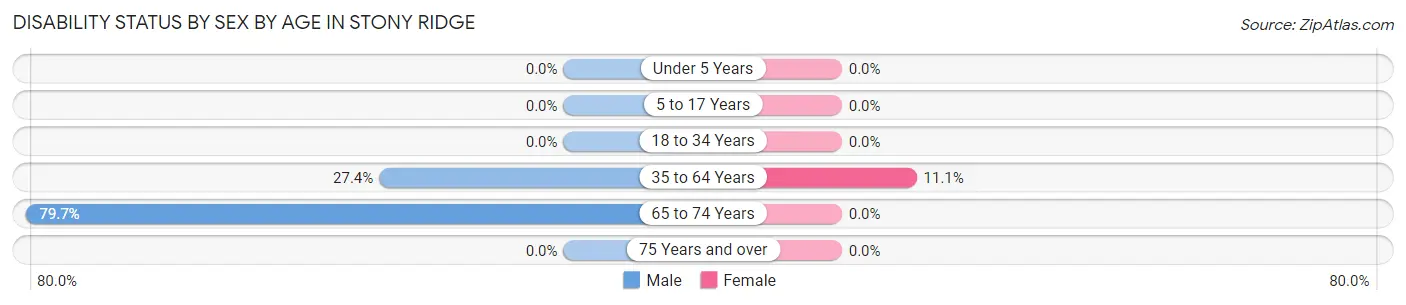
| Age Bracket | Male | Female |
| Under 5 Years | 0 (0.0%) | 0 (0.0%) |
| 5 to 17 Years | 0 (0.0%) | 0 (0.0%) |
| 18 to 34 Years | 0 (0.0%) | 0 (0.0%) |
| 35 to 64 Years | 58 (27.4%) | 10 (11.1%) |
| 65 to 74 Years | 59 (79.7%) | 0 (0.0%) |
| 75 Years and over | 0 (0.0%) | 0 (0.0%) |
Disability Class by Sex by Age in Stony Ridge
Disability Class: Hearing Difficulty
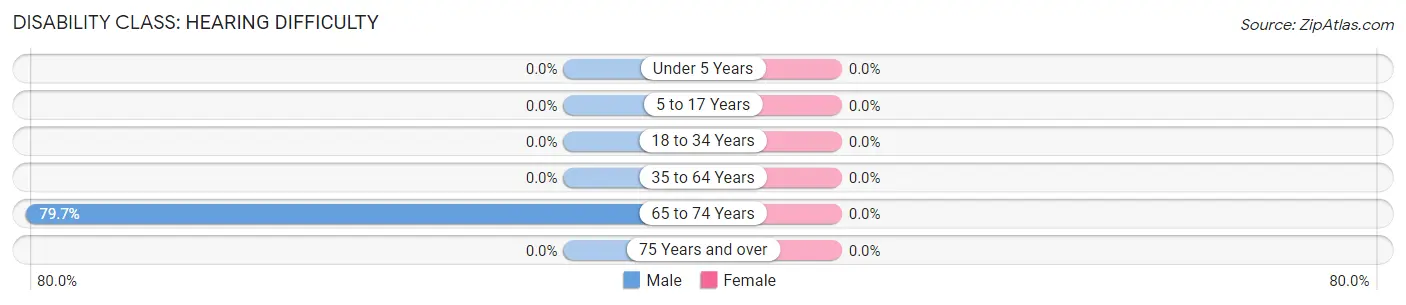
| Age Bracket | Male | Female |
| Under 5 Years | 0 (0.0%) | 0 (0.0%) |
| 5 to 17 Years | 0 (0.0%) | 0 (0.0%) |
| 18 to 34 Years | 0 (0.0%) | 0 (0.0%) |
| 35 to 64 Years | 0 (0.0%) | 0 (0.0%) |
| 65 to 74 Years | 59 (79.7%) | 0 (0.0%) |
| 75 Years and over | 0 (0.0%) | 0 (0.0%) |
Disability Class: Vision Difficulty
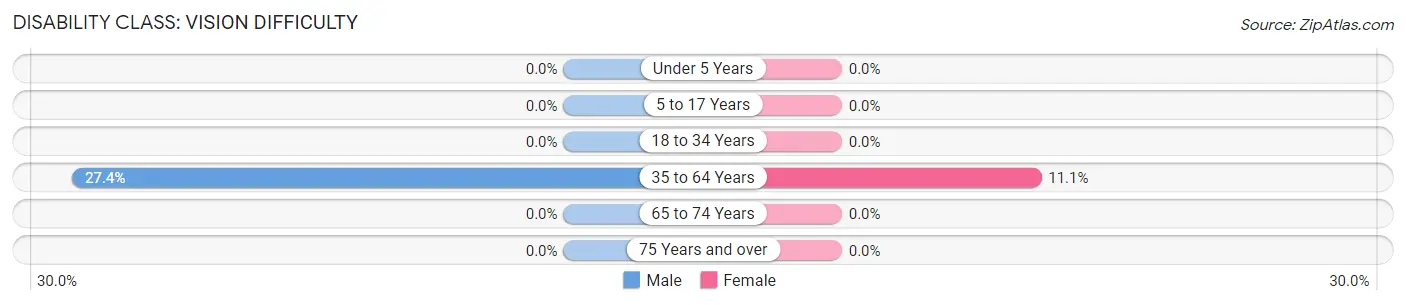
| Age Bracket | Male | Female |
| Under 5 Years | 0 (0.0%) | 0 (0.0%) |
| 5 to 17 Years | 0 (0.0%) | 0 (0.0%) |
| 18 to 34 Years | 0 (0.0%) | 0 (0.0%) |
| 35 to 64 Years | 58 (27.4%) | 10 (11.1%) |
| 65 to 74 Years | 0 (0.0%) | 0 (0.0%) |
| 75 Years and over | 0 (0.0%) | 0 (0.0%) |
Disability Class: Cognitive Difficulty
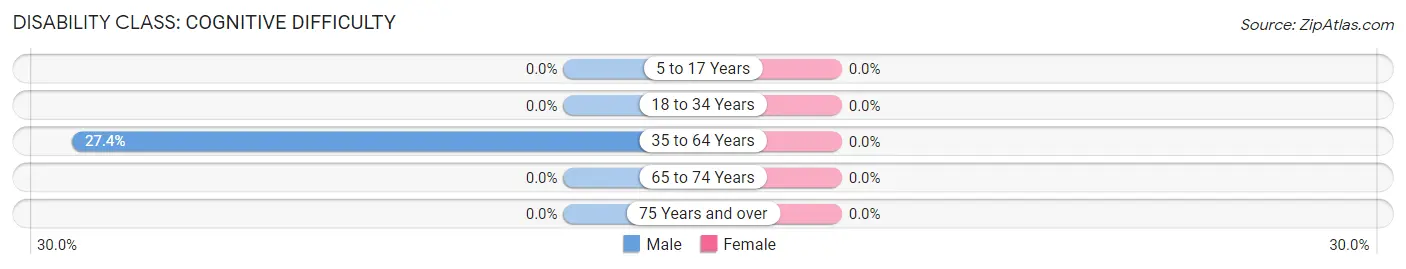
| Age Bracket | Male | Female |
| 5 to 17 Years | 0 (0.0%) | 0 (0.0%) |
| 18 to 34 Years | 0 (0.0%) | 0 (0.0%) |
| 35 to 64 Years | 58 (27.4%) | 0 (0.0%) |
| 65 to 74 Years | 0 (0.0%) | 0 (0.0%) |
| 75 Years and over | 0 (0.0%) | 0 (0.0%) |
Disability Class: Ambulatory Difficulty
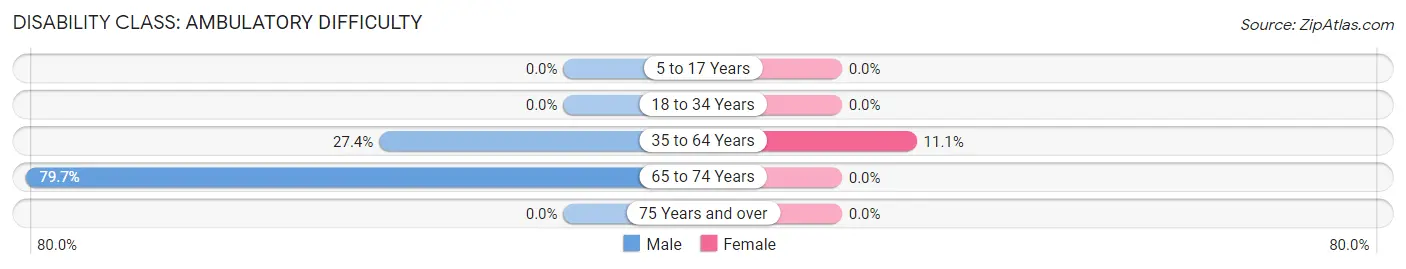
| Age Bracket | Male | Female |
| 5 to 17 Years | 0 (0.0%) | 0 (0.0%) |
| 18 to 34 Years | 0 (0.0%) | 0 (0.0%) |
| 35 to 64 Years | 58 (27.4%) | 10 (11.1%) |
| 65 to 74 Years | 59 (79.7%) | 0 (0.0%) |
| 75 Years and over | 0 (0.0%) | 0 (0.0%) |
Disability Class: Self-Care Difficulty
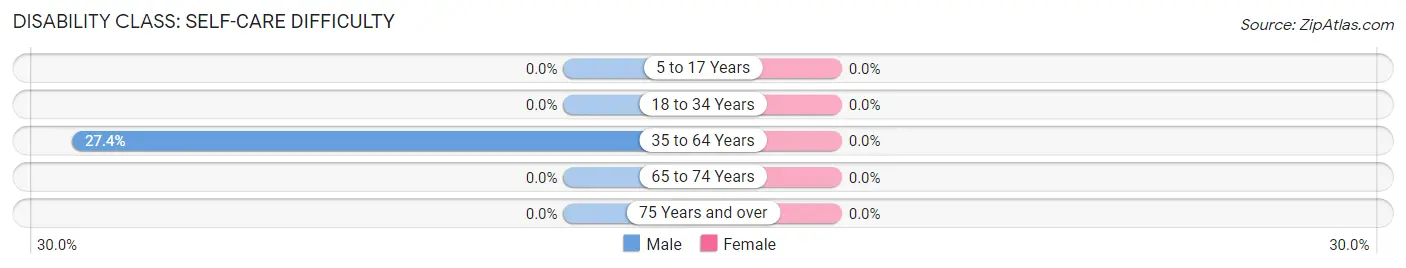
| Age Bracket | Male | Female |
| 5 to 17 Years | 0 (0.0%) | 0 (0.0%) |
| 18 to 34 Years | 0 (0.0%) | 0 (0.0%) |
| 35 to 64 Years | 58 (27.4%) | 0 (0.0%) |
| 65 to 74 Years | 0 (0.0%) | 0 (0.0%) |
| 75 Years and over | 0 (0.0%) | 0 (0.0%) |
Technology Access in Stony Ridge
Computing Device Access in Stony Ridge
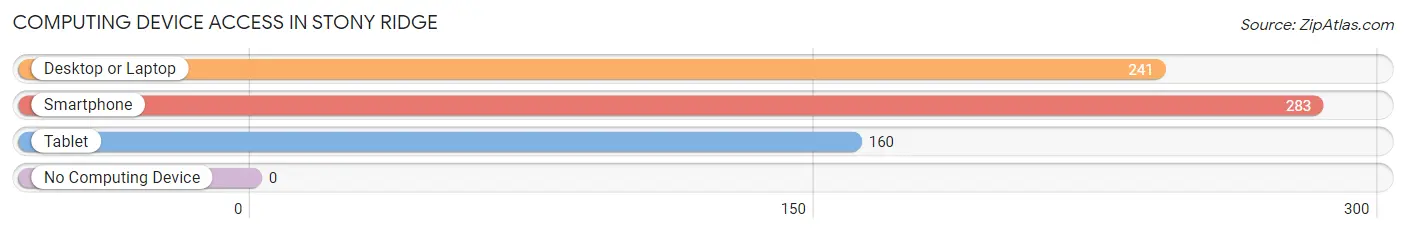
| Device Type | # Households | % Households |
| Desktop or Laptop | 241 | 83.7% |
| Smartphone | 283 | 98.3% |
| Tablet | 160 | 55.6% |
| No Computing Device | 0 | 0.0% |
| Total | 288 | 100.0% |
Internet Access in Stony Ridge
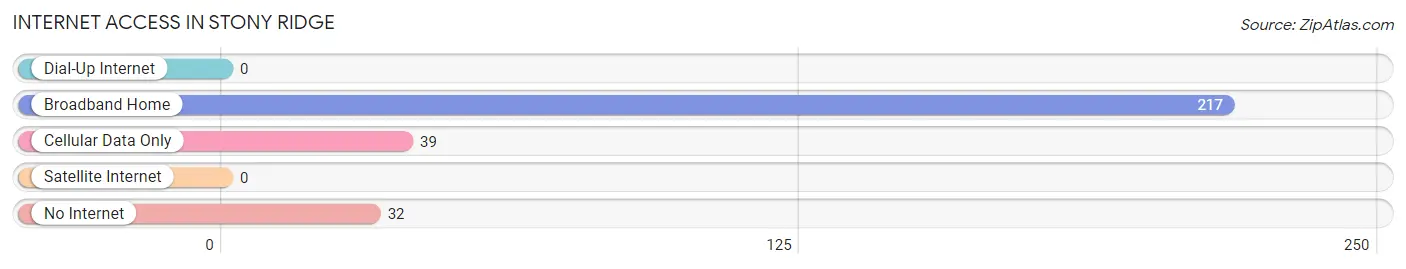
| Internet Type | # Households | % Households |
| Dial-Up Internet | 0 | 0.0% |
| Broadband Home | 217 | 75.3% |
| Cellular Data Only | 39 | 13.5% |
| Satellite Internet | 0 | 0.0% |
| No Internet | 32 | 11.1% |
| Total | 288 | 100.0% |
Stony Ridge Summary
Stony Ridge is a small unincorporated community located in Wood County, Ohio, United States. It is situated along the Maumee River, approximately 8 miles (13 km) east of Bowling Green. The population of Stony Ridge was estimated to be around 500 in 2020.
History
Stony Ridge was first settled in 1835 by a group of German immigrants. The community was originally known as “New Germany” and was later renamed Stony Ridge in 1845. The name was derived from the rocky terrain of the area.
The first post office in Stony Ridge was established in 1846. The community was incorporated as a village in 1867.
In the late 19th century, Stony Ridge was a thriving agricultural community. The area was known for its production of wheat, corn, and other grains. The community also had several mills, including a flour mill, a saw mill, and a grist mill.
In the early 20th century, Stony Ridge began to decline as the population shifted to larger cities. The village was disincorporated in 1921.
Geography
Stony Ridge is located in Wood County, Ohio, approximately 8 miles (13 km) east of Bowling Green. The community is situated along the Maumee River.
The terrain of Stony Ridge is mostly flat, with some rolling hills. The area is heavily forested, with a mix of deciduous and coniferous trees.
Economy
Stony Ridge is a primarily residential community. The area is home to several small businesses, including a grocery store, a hardware store, and a few restaurants.
The local economy is largely supported by agriculture. The area is known for its production of wheat, corn, and other grains.
Demographics
The population of Stony Ridge was estimated to be around 500 in 2020. The racial makeup of the community is predominantly white (95.2%), with a small percentage of African Americans (2.2%) and Hispanics (2.6%).
The median household income in Stony Ridge is $45,000, and the median home value is $150,000. The unemployment rate is 4.2%.
Conclusion
Stony Ridge is a small unincorporated community located in Wood County, Ohio. The area was first settled in 1835 and was originally known as “New Germany.” The community was incorporated as a village in 1867, but was disincorporated in 1921.
Today, Stony Ridge is a primarily residential community. The local economy is largely supported by agriculture, and the area is known for its production of wheat, corn, and other grains. The population of Stony Ridge was estimated to be around 500 in 2020. The racial makeup of the community is predominantly white, with a small percentage of African Americans and Hispanics. The median household income in Stony Ridge is $45,000, and the median home value is $150,000.
Common Questions
What is Per Capita Income in Stony Ridge?
Per Capita income in Stony Ridge is $35,160.
What is the Median Family Income in Stony Ridge?
Median Family Income in Stony Ridge is $64,915.
What is the Median Household income in Stony Ridge?
Median Household Income in Stony Ridge is $65,885.
What is Inequality or Gini Index in Stony Ridge?
Inequality or Gini Index in Stony Ridge is 0.17.
What is the Total Population of Stony Ridge?
Total Population of Stony Ridge is 659.
What is the Total Male Population of Stony Ridge?
Total Male Population of Stony Ridge is 361.
What is the Total Female Population of Stony Ridge?
Total Female Population of Stony Ridge is 298.
What is the Ratio of Males per 100 Females in Stony Ridge?
There are 121.14 Males per 100 Females in Stony Ridge.
What is the Ratio of Females per 100 Males in Stony Ridge?
There are 82.55 Females per 100 Males in Stony Ridge.
What is the Median Population Age in Stony Ridge?
Median Population Age in Stony Ridge is 57.5 Years.
What is the Average Family Size in Stony Ridge
Average Family Size in Stony Ridge is 3.0 People.
What is the Average Household Size in Stony Ridge
Average Household Size in Stony Ridge is 2.3 People.
How Large is the Labor Force in Stony Ridge?
There are 331 People in the Labor Forcein in Stony Ridge.
What is the Percentage of People in the Labor Force in Stony Ridge?
57.3% of People are in the Labor Force in Stony Ridge.