Zip Codes with the Highest Percentage of Population with a Degree in Computers and Mathematics in Akron, OH
RELATED REPORTS & OPTIONS
Computers and Mathematics
Akron
Compare Zip Codes
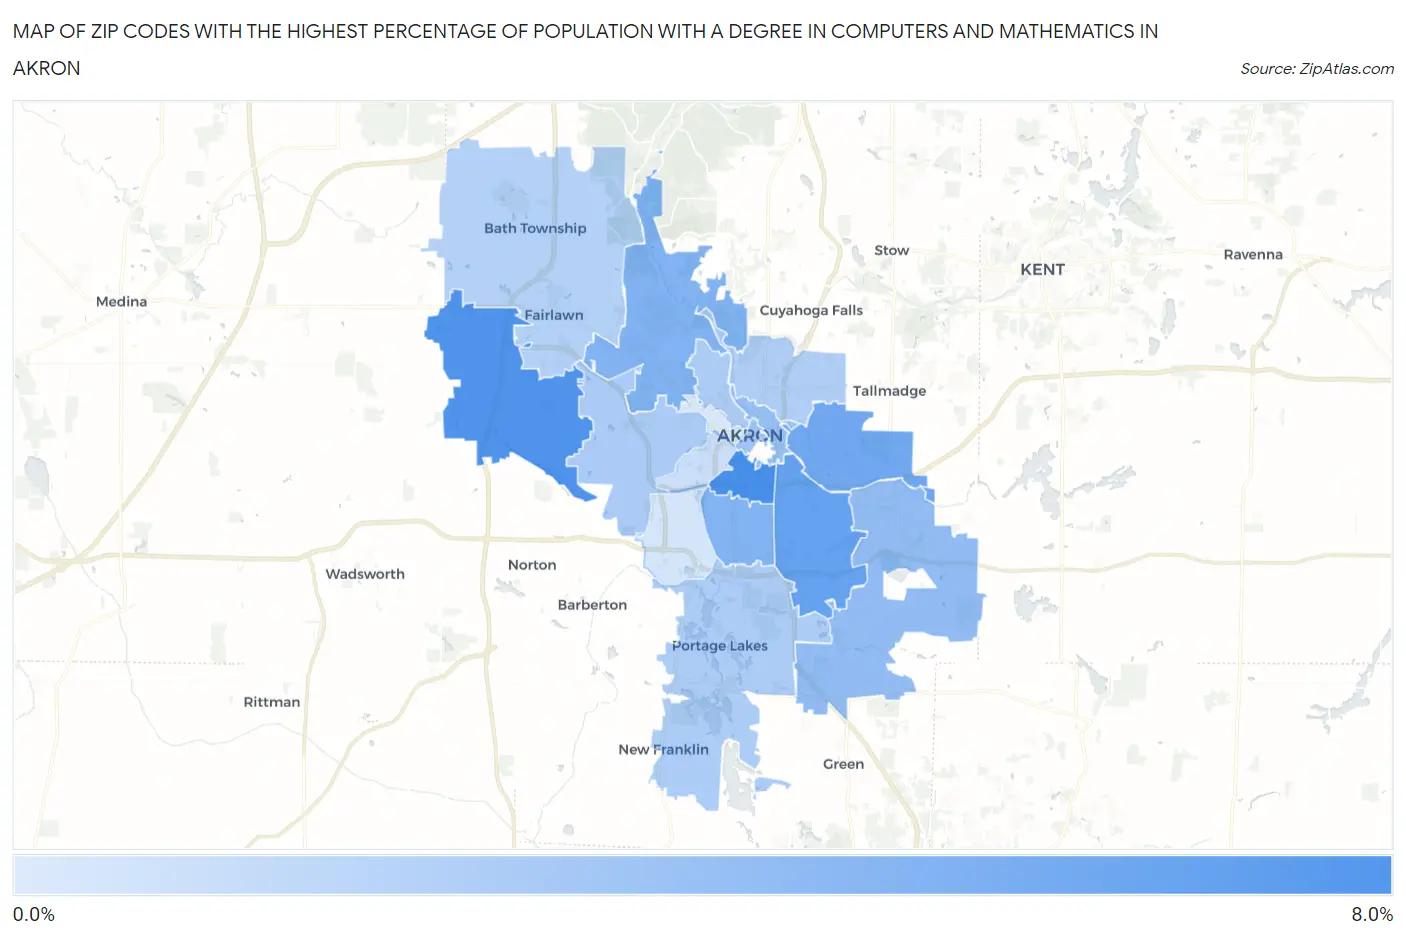
Map of Zip Codes with the Highest Percentage of Population with a Degree in Computers and Mathematics in Akron
0.33%
6.5%
Zip Codes with the Highest Percentage of Population with a Degree in Computers and Mathematics in Akron, OH
| Zip Code | % Graduates | vs State | vs National | |
| 1. | 44311 | 6.5% | 4.1%(+2.37)#130 | 4.9%(+1.61)#4,457 |
| 2. | 44321 | 6.2% | 4.1%(+2.07)#150 | 4.9%(+1.31)#4,929 |
| 3. | 44306 | 5.3% | 4.1%(+1.13)#216 | 4.9%(+0.373)#6,833 |
| 4. | 44305 | 4.8% | 4.1%(+0.662)#260 | 4.9%(-0.098)#7,999 |
| 5. | 44313 | 4.1% | 4.1%(-0.020)#335 | 4.9%(-0.780)#10,097 |
| 6. | 44301 | 4.0% | 4.1%(-0.093)#343 | 4.9%(-0.853)#10,331 |
| 7. | 44312 | 3.5% | 4.1%(-0.677)#421 | 4.9%(-1.44)#12,456 |
| 8. | 44304 | 3.2% | 4.1%(-0.957)#458 | 4.9%(-1.72)#13,465 |
| 9. | 44308 | 2.7% | 4.1%(-1.42)#513 | 4.9%(-2.18)#15,114 |
| 10. | 44320 | 2.3% | 4.1%(-1.80)#571 | 4.9%(-2.56)#16,482 |
| 11. | 44303 | 2.3% | 4.1%(-1.83)#577 | 4.9%(-2.59)#16,586 |
| 12. | 44319 | 2.3% | 4.1%(-1.87)#582 | 4.9%(-2.63)#16,721 |
| 13. | 44310 | 2.2% | 4.1%(-1.92)#593 | 4.9%(-2.68)#16,902 |
| 14. | 44333 | 2.0% | 4.1%(-2.16)#629 | 4.9%(-2.92)#17,703 |
| 15. | 44307 | 1.0% | 4.1%(-3.09)#742 | 4.9%(-3.85)#20,412 |
| 16. | 44314 | 0.71% | 4.1%(-3.43)#777 | 4.9%(-4.19)#21,129 |
| 17. | 44302 | 0.33% | 4.1%(-3.81)#808 | 4.9%(-4.57)#21,681 |
1
Common Questions
What are the Top 10 Zip Codes with the Highest Percentage of Population with a Degree in Computers and Mathematics in Akron, OH?
Top 10 Zip Codes with the Highest Percentage of Population with a Degree in Computers and Mathematics in Akron, OH are:
What zip code has the Highest Percentage of Population with a Degree in Computers and Mathematics in Akron, OH?
44311 has the Highest Percentage of Population with a Degree in Computers and Mathematics in Akron, OH with 6.5%.
What is the Percentage of Population with a Degree in Computers and Mathematics in Akron, OH?
Percentage of Population with a Degree in Computers and Mathematics in Akron is 3.4%.
What is the Percentage of Population with a Degree in Computers and Mathematics in Ohio?
Percentage of Population with a Degree in Computers and Mathematics in Ohio is 4.1%.
What is the Percentage of Population with a Degree in Computers and Mathematics in the United States?
Percentage of Population with a Degree in Computers and Mathematics in the United States is 4.9%.