Zip Codes with the Highest Percentage of Population with a Degree in Computers and Mathematics in Ohio
RELATED REPORTS & OPTIONS
Computers and Mathematics
Ohio
Compare Zip Codes
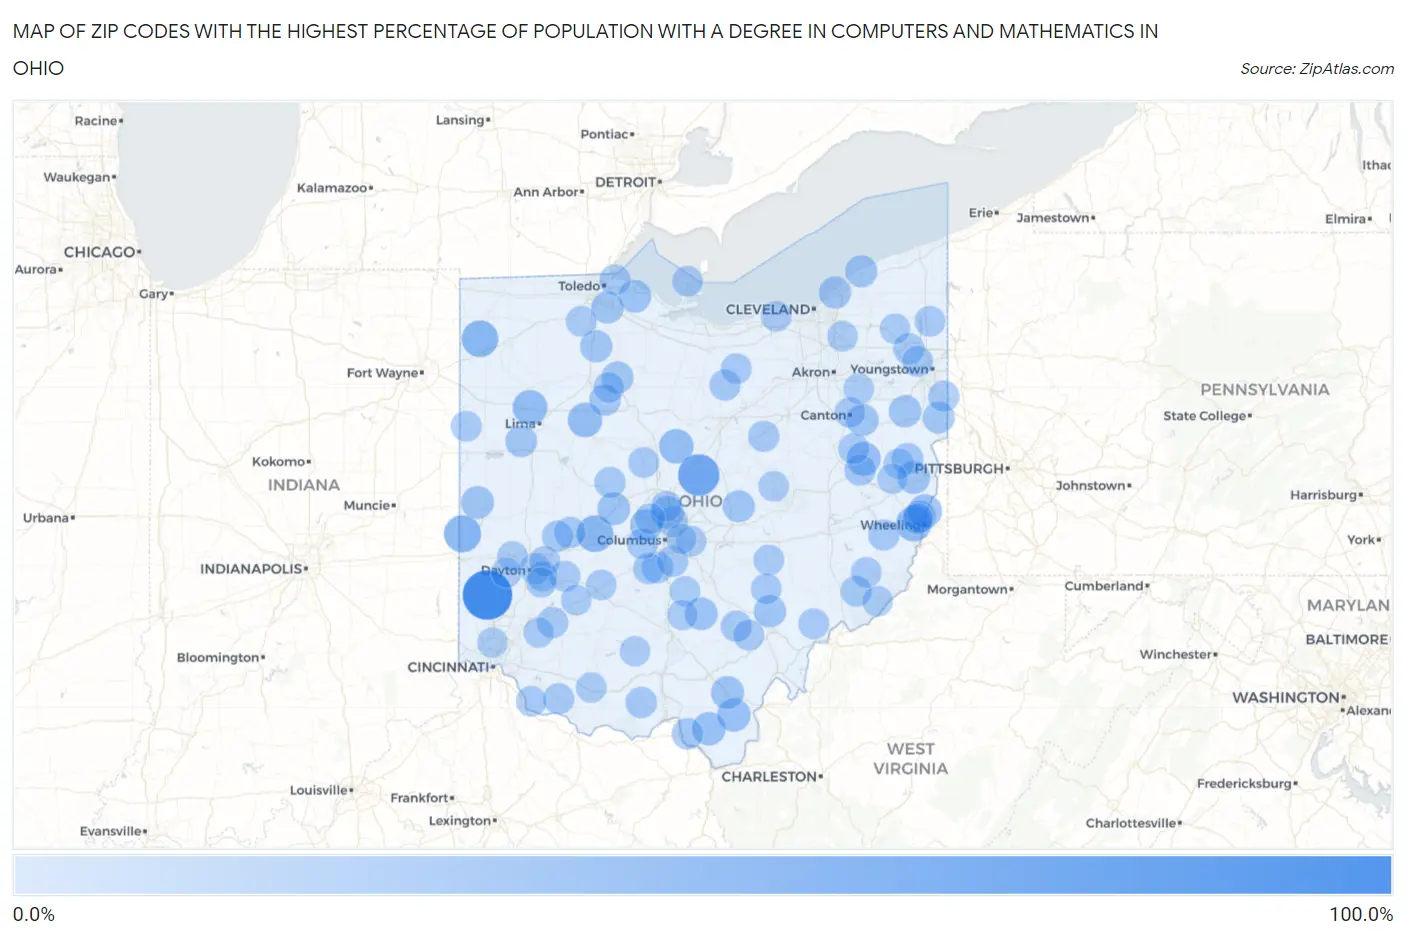
Map of Zip Codes with the Highest Percentage of Population with a Degree in Computers and Mathematics in Ohio
0.0%
100.0%
Zip Codes with the Highest Percentage of Population with a Degree in Computers and Mathematics in Ohio
| Zip Code | % Graduates | vs State | vs National | |
| 1. | 45070 | 100.0% | 4.1%(+95.9)#1 | 4.9%(+95.1)#12 |
| 2. | 43350 | 60.0% | 4.1%(+55.9)#2 | 4.9%(+55.1)#49 |
| 3. | 45332 | 39.3% | 4.1%(+35.2)#3 | 4.9%(+34.4)#140 |
| 4. | 43010 | 37.5% | 4.1%(+33.4)#4 | 4.9%(+32.6)#148 |
| 5. | 43536 | 36.8% | 4.1%(+32.7)#5 | 4.9%(+31.9)#153 |
| 6. | 43909 | 31.4% | 4.1%(+27.3)#6 | 4.9%(+26.5)#206 |
| 7. | 45809 | 28.6% | 4.1%(+24.4)#7 | 4.9%(+23.7)#248 |
| 8. | 43320 | 26.7% | 4.1%(+22.6)#8 | 4.9%(+21.9)#271 |
| 9. | 45835 | 26.6% | 4.1%(+22.4)#9 | 4.9%(+21.7)#275 |
| 10. | 43971 | 24.4% | 4.1%(+20.3)#10 | 4.9%(+19.5)#314 |
| 11. | 44675 | 23.9% | 4.1%(+19.8)#11 | 4.9%(+19.0)#334 |
| 12. | 45659 | 21.8% | 4.1%(+17.7)#12 | 4.9%(+16.9)#397 |
| 13. | 45658 | 21.8% | 4.1%(+17.6)#13 | 4.9%(+16.9)#400 |
| 14. | 45685 | 19.6% | 4.1%(+15.4)#14 | 4.9%(+14.7)#480 |
| 15. | 43240 | 19.5% | 4.1%(+15.4)#15 | 4.9%(+14.6)#483 |
| 16. | 45303 | 19.4% | 4.1%(+15.3)#16 | 4.9%(+14.5)#490 |
| 17. | 43135 | 18.9% | 4.1%(+14.8)#17 | 4.9%(+14.0)#510 |
| 18. | 43445 | 18.9% | 4.1%(+14.8)#18 | 4.9%(+14.0)#512 |
| 19. | 43910 | 18.9% | 4.1%(+14.7)#19 | 4.9%(+14.0)#515 |
| 20. | 43045 | 18.9% | 4.1%(+14.7)#20 | 4.9%(+14.0)#516 |
| 21. | 43002 | 17.4% | 4.1%(+13.3)#21 | 4.9%(+12.5)#599 |
| 22. | 44493 | 17.1% | 4.1%(+13.0)#22 | 4.9%(+12.2)#623 |
| 23. | 43463 | 16.9% | 4.1%(+12.8)#23 | 4.9%(+12.1)#631 |
| 24. | 44730 | 16.7% | 4.1%(+12.6)#24 | 4.9%(+11.9)#637 |
| 25. | 43437 | 16.2% | 4.1%(+12.1)#25 | 4.9%(+11.3)#685 |
| 26. | 45740 | 16.1% | 4.1%(+12.0)#26 | 4.9%(+11.2)#692 |
| 27. | 43071 | 16.1% | 4.1%(+12.0)#27 | 4.9%(+11.2)#693 |
| 28. | 44132 | 16.0% | 4.1%(+11.8)#28 | 4.9%(+11.1)#704 |
| 29. | 43935 | 15.8% | 4.1%(+11.7)#29 | 4.9%(+10.9)#718 |
| 30. | 44045 | 15.7% | 4.1%(+11.6)#30 | 4.9%(+10.8)#727 |
| 31. | 44802 | 15.2% | 4.1%(+11.0)#31 | 4.9%(+10.3)#773 |
| 32. | 44455 | 14.5% | 4.1%(+10.4)#32 | 4.9%(+9.61)#844 |
| 33. | 45819 | 14.3% | 4.1%(+10.2)#33 | 4.9%(+9.39)#877 |
| 34. | 43908 | 13.8% | 4.1%(+9.66)#34 | 4.9%(+8.90)#929 |
| 35. | 45867 | 13.6% | 4.1%(+9.48)#35 | 4.9%(+8.72)#958 |
| 36. | 43116 | 13.1% | 4.1%(+8.96)#36 | 4.9%(+8.20)#1,038 |
| 37. | 45629 | 12.5% | 4.1%(+8.39)#37 | 4.9%(+7.63)#1,122 |
| 38. | 45372 | 12.5% | 4.1%(+8.37)#38 | 4.9%(+7.61)#1,140 |
| 39. | 44621 | 12.3% | 4.1%(+8.19)#39 | 4.9%(+7.43)#1,163 |
| 40. | 43146 | 12.3% | 4.1%(+8.16)#40 | 4.9%(+7.40)#1,167 |
| 41. | 44481 | 12.0% | 4.1%(+7.88)#41 | 4.9%(+7.12)#1,211 |
| 42. | 43217 | 12.0% | 4.1%(+7.87)#42 | 4.9%(+7.11)#1,214 |
| 43. | 44837 | 11.9% | 4.1%(+7.80)#43 | 4.9%(+7.04)#1,230 |
| 44. | 45657 | 11.8% | 4.1%(+7.63)#44 | 4.9%(+6.87)#1,261 |
| 45. | 43067 | 11.7% | 4.1%(+7.60)#45 | 4.9%(+6.84)#1,278 |
| 46. | 45113 | 11.7% | 4.1%(+7.59)#46 | 4.9%(+6.83)#1,279 |
| 47. | 44638 | 11.6% | 4.1%(+7.49)#47 | 4.9%(+6.73)#1,300 |
| 48. | 45349 | 11.6% | 4.1%(+7.49)#48 | 4.9%(+6.73)#1,303 |
| 49. | 44454 | 11.6% | 4.1%(+7.46)#49 | 4.9%(+6.70)#1,311 |
| 50. | 43119 | 11.2% | 4.1%(+7.10)#50 | 4.9%(+6.34)#1,393 |
| 51. | 43719 | 11.1% | 4.1%(+7.00)#51 | 4.9%(+6.24)#1,415 |
| 52. | 43434 | 11.1% | 4.1%(+6.98)#52 | 4.9%(+6.22)#1,432 |
| 53. | 45121 | 11.0% | 4.1%(+6.88)#53 | 4.9%(+6.12)#1,453 |
| 54. | 45654 | 10.9% | 4.1%(+6.80)#54 | 4.9%(+6.03)#1,473 |
| 55. | 44440 | 10.6% | 4.1%(+6.50)#55 | 4.9%(+5.74)#1,544 |
| 56. | 43912 | 10.4% | 4.1%(+6.24)#56 | 4.9%(+5.48)#1,622 |
| 57. | 45745 | 10.3% | 4.1%(+6.21)#57 | 4.9%(+5.45)#1,631 |
| 58. | 45766 | 10.3% | 4.1%(+6.12)#58 | 4.9%(+5.36)#1,666 |
| 59. | 45403 | 10.2% | 4.1%(+6.03)#59 | 4.9%(+5.27)#1,703 |
| 60. | 44851 | 10.0% | 4.1%(+5.87)#60 | 4.9%(+5.11)#1,747 |
| 61. | 43231 | 9.9% | 4.1%(+5.75)#61 | 4.9%(+4.99)#1,799 |
| 62. | 44656 | 9.9% | 4.1%(+5.73)#62 | 4.9%(+4.97)#1,808 |
| 63. | 45898 | 9.8% | 4.1%(+5.67)#63 | 4.9%(+4.91)#1,836 |
| 64. | 45784 | 9.7% | 4.1%(+5.61)#64 | 4.9%(+4.85)#1,863 |
| 65. | 45384 | 9.6% | 4.1%(+5.43)#65 | 4.9%(+4.67)#1,934 |
| 66. | 43565 | 9.5% | 4.1%(+5.39)#66 | 4.9%(+4.63)#1,952 |
| 67. | 43035 | 9.4% | 4.1%(+5.28)#67 | 4.9%(+4.52)#2,010 |
| 68. | 43342 | 9.4% | 4.1%(+5.26)#68 | 4.9%(+4.50)#2,020 |
| 69. | 45153 | 9.3% | 4.1%(+5.13)#69 | 4.9%(+4.37)#2,087 |
| 70. | 45890 | 9.2% | 4.1%(+5.03)#70 | 4.9%(+4.27)#2,139 |
| 71. | 43777 | 9.2% | 4.1%(+5.03)#71 | 4.9%(+4.27)#2,141 |
| 72. | 43730 | 9.2% | 4.1%(+5.03)#72 | 4.9%(+4.27)#2,143 |
| 73. | 43446 | 9.1% | 4.1%(+4.96)#73 | 4.9%(+4.20)#2,209 |
| 74. | 43128 | 9.0% | 4.1%(+4.89)#74 | 4.9%(+4.13)#2,234 |
| 75. | 44417 | 9.0% | 4.1%(+4.89)#75 | 4.9%(+4.13)#2,235 |
| 76. | 43754 | 8.9% | 4.1%(+4.78)#76 | 4.9%(+4.02)#2,309 |
| 77. | 44703 | 8.9% | 4.1%(+4.77)#77 | 4.9%(+4.01)#2,314 |
| 78. | 43068 | 8.8% | 4.1%(+4.67)#78 | 4.9%(+3.91)#2,370 |
| 79. | 45697 | 8.7% | 4.1%(+4.61)#79 | 4.9%(+3.85)#2,398 |
| 80. | 44632 | 8.7% | 4.1%(+4.56)#80 | 4.9%(+3.80)#2,429 |
| 81. | 44087 | 8.7% | 4.1%(+4.53)#81 | 4.9%(+3.77)#2,445 |
| 82. | 44011 | 8.6% | 4.1%(+4.46)#82 | 4.9%(+3.70)#2,481 |
| 83. | 45152 | 8.5% | 4.1%(+4.39)#83 | 4.9%(+3.63)#2,524 |
| 84. | 45430 | 8.4% | 4.1%(+4.28)#84 | 4.9%(+3.52)#2,593 |
| 85. | 43844 | 8.4% | 4.1%(+4.24)#85 | 4.9%(+3.48)#2,608 |
| 86. | 44491 | 8.4% | 4.1%(+4.23)#86 | 4.9%(+3.47)#2,610 |
| 87. | 45767 | 8.3% | 4.1%(+4.20)#87 | 4.9%(+3.44)#2,633 |
| 88. | 43903 | 8.3% | 4.1%(+4.20)#88 | 4.9%(+3.44)#2,634 |
| 89. | 45164 | 8.3% | 4.1%(+4.20)#89 | 4.9%(+3.44)#2,643 |
| 90. | 45315 | 8.2% | 4.1%(+4.09)#90 | 4.9%(+3.33)#2,731 |
| 91. | 43016 | 8.2% | 4.1%(+4.02)#91 | 4.9%(+3.26)#2,783 |
| 92. | 45612 | 8.1% | 4.1%(+3.98)#92 | 4.9%(+3.22)#2,806 |
| 93. | 45433 | 8.1% | 4.1%(+3.93)#93 | 4.9%(+3.17)#2,851 |
| 94. | 45218 | 7.9% | 4.1%(+3.72)#94 | 4.9%(+2.96)#3,024 |
| 95. | 43154 | 7.8% | 4.1%(+3.67)#95 | 4.9%(+2.91)#3,059 |
| 96. | 45345 | 7.8% | 4.1%(+3.63)#96 | 4.9%(+2.87)#3,094 |
| 97. | 45644 | 7.7% | 4.1%(+3.56)#97 | 4.9%(+2.80)#3,144 |
| 98. | 43986 | 7.6% | 4.1%(+3.49)#98 | 4.9%(+2.73)#3,224 |
| 99. | 45440 | 7.6% | 4.1%(+3.45)#99 | 4.9%(+2.69)#3,262 |
| 100. | 43213 | 7.6% | 4.1%(+3.43)#100 | 4.9%(+2.67)#3,282 |
Common Questions
What are the Top 10 Zip Codes with the Highest Percentage of Population with a Degree in Computers and Mathematics in Ohio?
Top 10 Zip Codes with the Highest Percentage of Population with a Degree in Computers and Mathematics in Ohio are:
What zip code has the Highest Percentage of Population with a Degree in Computers and Mathematics in Ohio?
45070 has the Highest Percentage of Population with a Degree in Computers and Mathematics in Ohio with 100.0%.
What is the Percentage of Population with a Degree in Computers and Mathematics in the State of Ohio?
Percentage of Population with a Degree in Computers and Mathematics in Ohio is 4.1%.
What is the Percentage of Population with a Degree in Computers and Mathematics in the United States?
Percentage of Population with a Degree in Computers and Mathematics in the United States is 4.9%.