Lancaster, OH Map & Demographics
Lancaster Map
Lancaster Overview
$30,252
PER CAPITA INCOME
$72,500
AVG FAMILY INCOME
$52,716
AVG HOUSEHOLD INCOME
22.1%
WAGE / INCOME GAP [ % ]
77.9¢/ $1
WAGE / INCOME GAP [ $ ]
$11,167
FAMILY INCOME DEFICIT
0.43
INEQUALITY / GINI INDEX
40,616
TOTAL POPULATION
19,864
MALE POPULATION
20,752
FEMALE POPULATION
95.72
MALES / 100 FEMALES
104.47
FEMALES / 100 MALES
38.4
MEDIAN AGE
3.0
AVG FAMILY SIZE
2.4
AVG HOUSEHOLD SIZE
19,502
LABOR FORCE [ PEOPLE ]
59.9%
PERCENT IN LABOR FORCE
4.6%
UNEMPLOYMENT RATE
Lancaster Zip Codes
Lancaster Area Codes
Income in Lancaster
Income Overview in Lancaster
Per Capita Income in Lancaster is $30,252, while median incomes of families and households are $72,500 and $52,716 respectively.
| Characteristic | Number | Measure |
| Per Capita Income | 40,616 | $30,252 |
| Median Family Income | 9,886 | $72,500 |
| Mean Family Income | 9,886 | $85,695 |
| Median Household Income | 16,794 | $52,716 |
| Mean Household Income | 16,794 | $71,154 |
| Income Deficit | 9,886 | $11,167 |
| Wage / Income Gap (%) | 40,616 | 22.14% |
| Wage / Income Gap ($) | 40,616 | 77.86¢ per $1 |
| Gini / Inequality Index | 40,616 | 0.43 |
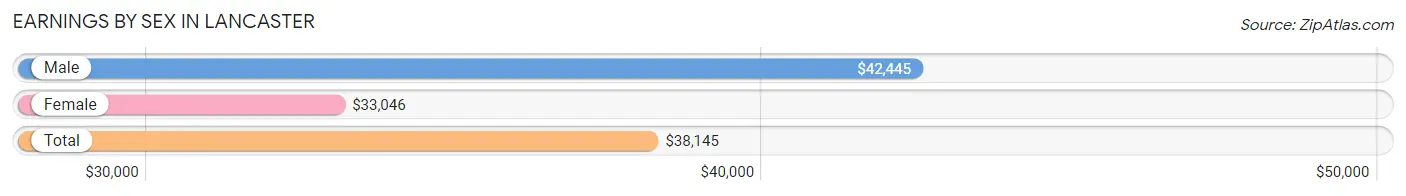
Earnings by Sex in Lancaster
Average Earnings in Lancaster are $38,145, $42,445 for men and $33,046 for women, a difference of 22.1%.
| Sex | Number | Average Earnings |
| Male | 10,526 (52.5%) | $42,445 |
| Female | 9,504 (47.4%) | $33,046 |
| Total | 20,030 (100.0%) | $38,145 |
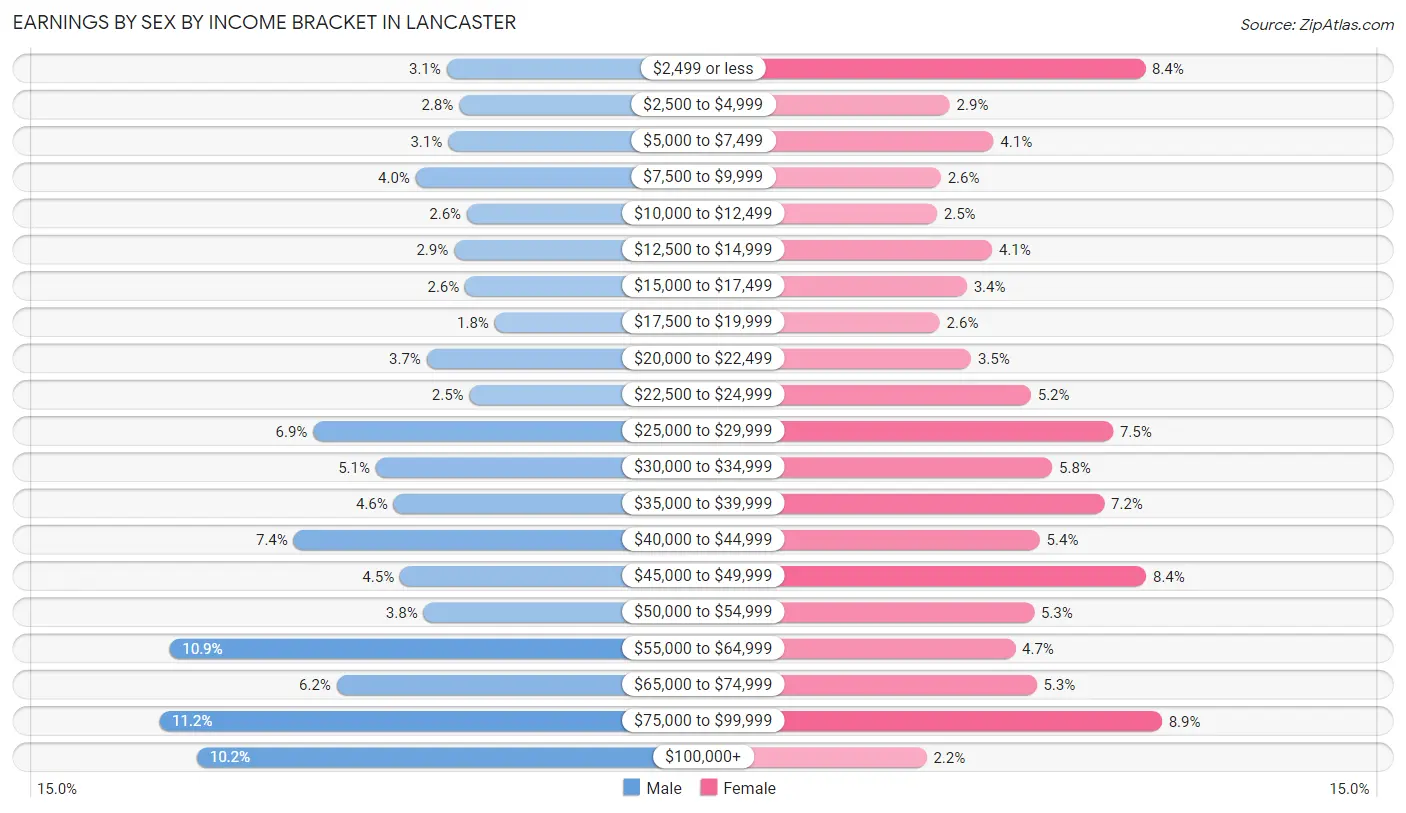
Earnings by Sex by Income Bracket in Lancaster
The most common earnings brackets in Lancaster are $75,000 to $99,999 for men (1,181 | 11.2%) and $75,000 to $99,999 for women (841 | 8.8%).
| Income | Male | Female |
| $2,499 or less | 331 (3.1%) | 796 (8.4%) |
| $2,500 to $4,999 | 294 (2.8%) | 275 (2.9%) |
| $5,000 to $7,499 | 326 (3.1%) | 392 (4.1%) |
| $7,500 to $9,999 | 422 (4.0%) | 251 (2.6%) |
| $10,000 to $12,499 | 270 (2.6%) | 240 (2.5%) |
| $12,500 to $14,999 | 308 (2.9%) | 388 (4.1%) |
| $15,000 to $17,499 | 276 (2.6%) | 320 (3.4%) |
| $17,500 to $19,999 | 188 (1.8%) | 248 (2.6%) |
| $20,000 to $22,499 | 389 (3.7%) | 332 (3.5%) |
| $22,500 to $24,999 | 263 (2.5%) | 491 (5.2%) |
| $25,000 to $29,999 | 725 (6.9%) | 711 (7.5%) |
| $30,000 to $34,999 | 540 (5.1%) | 548 (5.8%) |
| $35,000 to $39,999 | 487 (4.6%) | 687 (7.2%) |
| $40,000 to $44,999 | 783 (7.4%) | 515 (5.4%) |
| $45,000 to $49,999 | 468 (4.4%) | 799 (8.4%) |
| $50,000 to $54,999 | 399 (3.8%) | 500 (5.3%) |
| $55,000 to $64,999 | 1,151 (10.9%) | 450 (4.7%) |
| $65,000 to $74,999 | 656 (6.2%) | 507 (5.3%) |
| $75,000 to $99,999 | 1,181 (11.2%) | 841 (8.8%) |
| $100,000+ | 1,069 (10.2%) | 213 (2.2%) |
| Total | 10,526 (100.0%) | 9,504 (100.0%) |
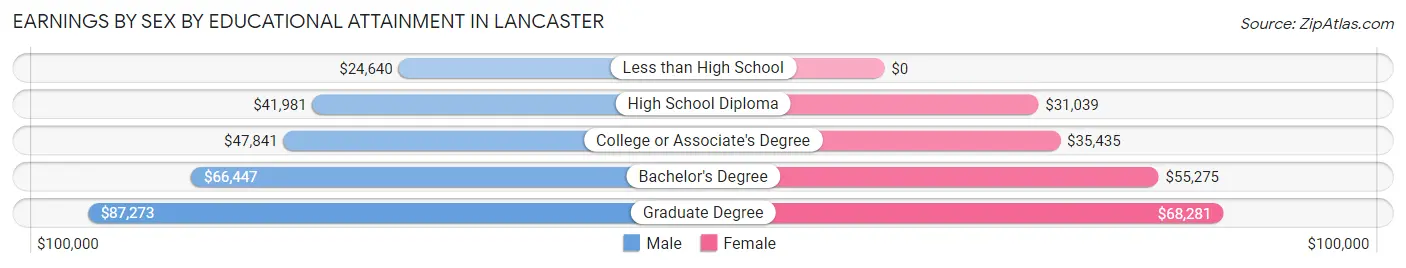
Earnings by Sex by Educational Attainment in Lancaster
Average earnings in Lancaster are $46,912 for men and $38,903 for women, a difference of 17.1%. Men with an educational attainment of graduate degree enjoy the highest average annual earnings of $87,273, while those with less than high school education earn the least with $24,640. Women with an educational attainment of graduate degree earn the most with the average annual earnings of $68,281, while those with high school diploma education have the smallest earnings of $31,039.
| Educational Attainment | Male Income | Female Income |
| Less than High School | $24,640 | $0 |
| High School Diploma | $41,981 | $31,039 |
| College or Associate's Degree | $47,841 | $35,435 |
| Bachelor's Degree | $66,447 | $55,275 |
| Graduate Degree | $87,273 | $68,281 |
| Total | $46,912 | $38,903 |
Family Income in Lancaster
Family Income Brackets in Lancaster
According to the Lancaster family income data, there are 2,195 families falling into the $100,000 to $149,999 income range, which is the most common income bracket and makes up 22.2% of all families. Conversely, the $10,000 to $14,999 income bracket is the least frequent group with only 306 families (3.1%) belonging to this category.
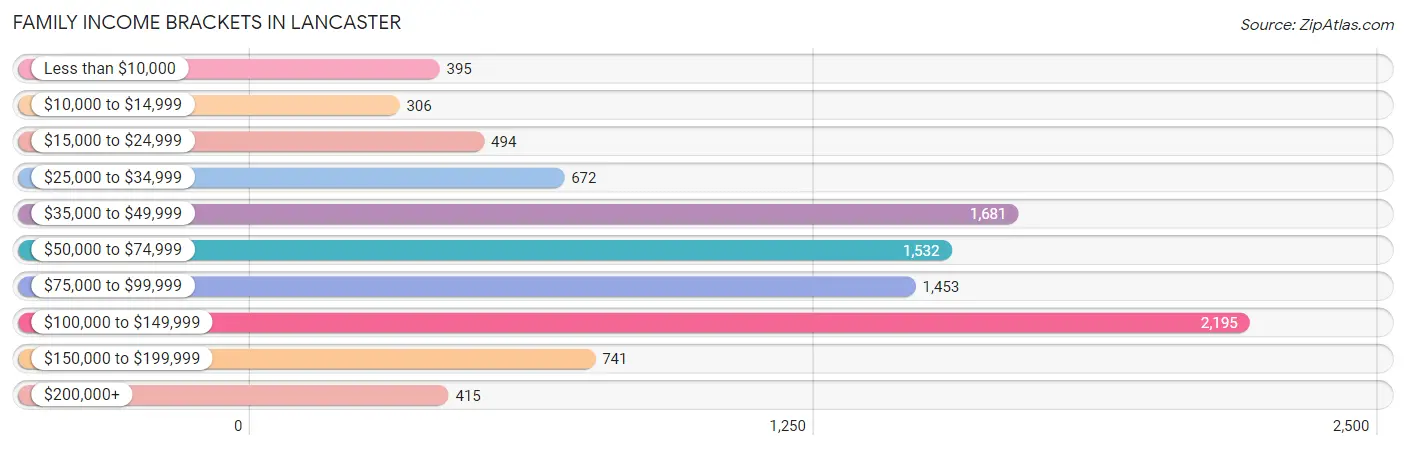
| Income Bracket | # Families | % Families |
| Less than $10,000 | 395 | 4.0% |
| $10,000 to $14,999 | 306 | 3.1% |
| $15,000 to $24,999 | 494 | 5.0% |
| $25,000 to $34,999 | 672 | 6.8% |
| $35,000 to $49,999 | 1,681 | 17.0% |
| $50,000 to $74,999 | 1,532 | 15.5% |
| $75,000 to $99,999 | 1,453 | 14.7% |
| $100,000 to $149,999 | 2,195 | 22.2% |
| $150,000 to $199,999 | 741 | 7.5% |
| $200,000+ | 415 | 4.2% |
Family Income by Famaliy Size in Lancaster
7+ person families (257 | 2.6%) account for the highest median family income in Lancaster with $103,394 per family, while 2-person families (4,896 | 49.5%) have the highest median income of $28,611 per family member.
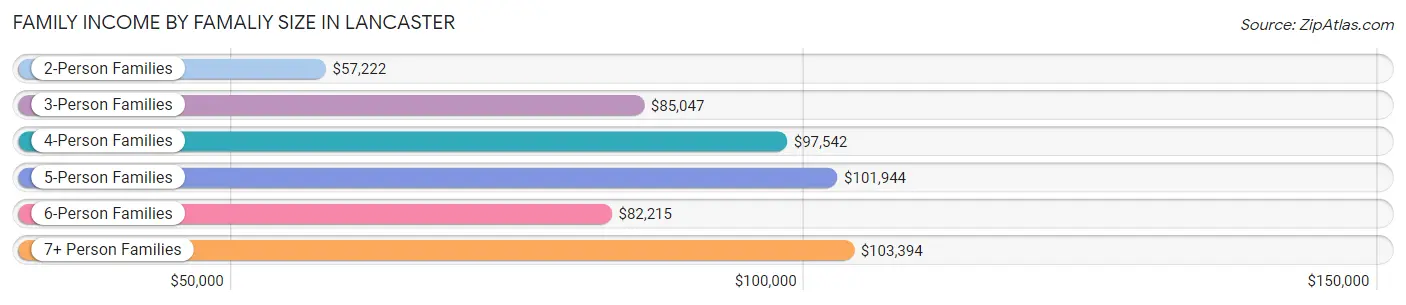
| Income Bracket | # Families | Median Income |
| 2-Person Families | 4,896 (49.5%) | $57,222 |
| 3-Person Families | 2,230 (22.6%) | $85,047 |
| 4-Person Families | 1,558 (15.8%) | $97,542 |
| 5-Person Families | 618 (6.2%) | $101,944 |
| 6-Person Families | 327 (3.3%) | $82,215 |
| 7+ Person Families | 257 (2.6%) | $103,394 |
| Total | 9,886 (100.0%) | $72,500 |
Family Income by Number of Earners in Lancaster
The median family income in Lancaster is $72,500, with families comprising 3+ earners (658) having the highest median family income of $115,405, while families with no earners (1,823) have the lowest median family income of $38,799, accounting for 6.7% and 18.4% of families, respectively.
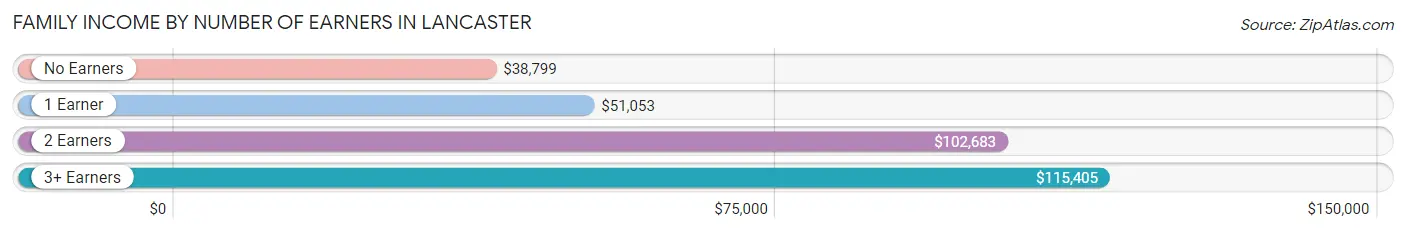
| Number of Earners | # Families | Median Income |
| No Earners | 1,823 (18.4%) | $38,799 |
| 1 Earner | 3,060 (30.9%) | $51,053 |
| 2 Earners | 4,345 (44.0%) | $102,683 |
| 3+ Earners | 658 (6.7%) | $115,405 |
| Total | 9,886 (100.0%) | $72,500 |
Household Income in Lancaster
Household Income Brackets in Lancaster
With 2,956 households falling in the category, the $50,000 to $74,999 income range is the most frequent in Lancaster, accounting for 17.6% of all households. In contrast, only 487 households (2.9%) fall into the $200,000+ income bracket, making it the least populous group.
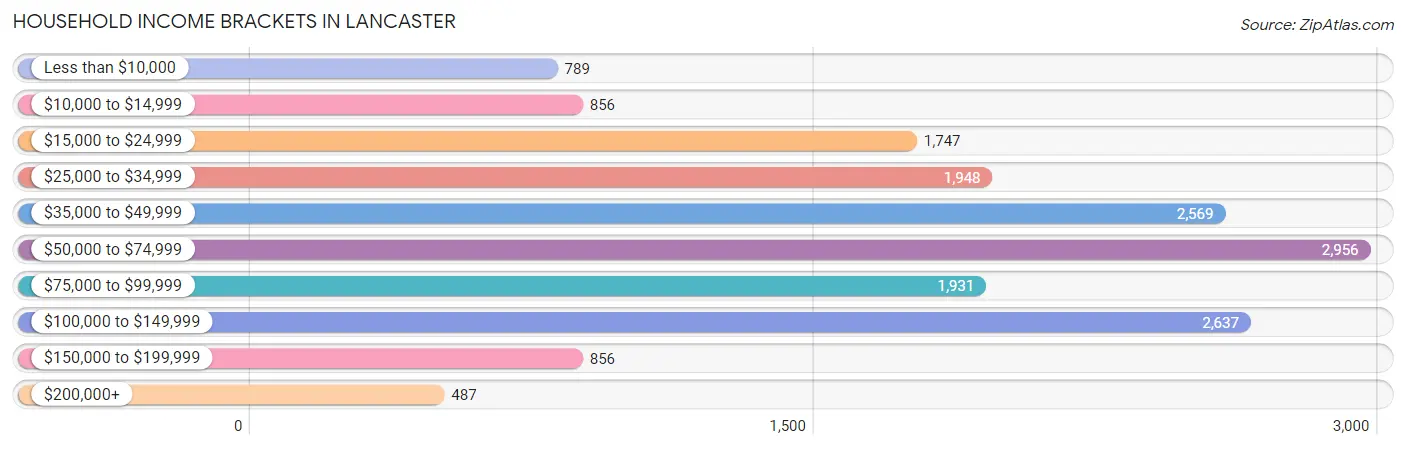
| Income Bracket | # Households | % Households |
| Less than $10,000 | 789 | 4.7% |
| $10,000 to $14,999 | 856 | 5.1% |
| $15,000 to $24,999 | 1,747 | 10.4% |
| $25,000 to $34,999 | 1,948 | 11.6% |
| $35,000 to $49,999 | 2,569 | 15.3% |
| $50,000 to $74,999 | 2,956 | 17.6% |
| $75,000 to $99,999 | 1,931 | 11.5% |
| $100,000 to $149,999 | 2,637 | 15.7% |
| $150,000 to $199,999 | 856 | 5.1% |
| $200,000+ | 487 | 2.9% |
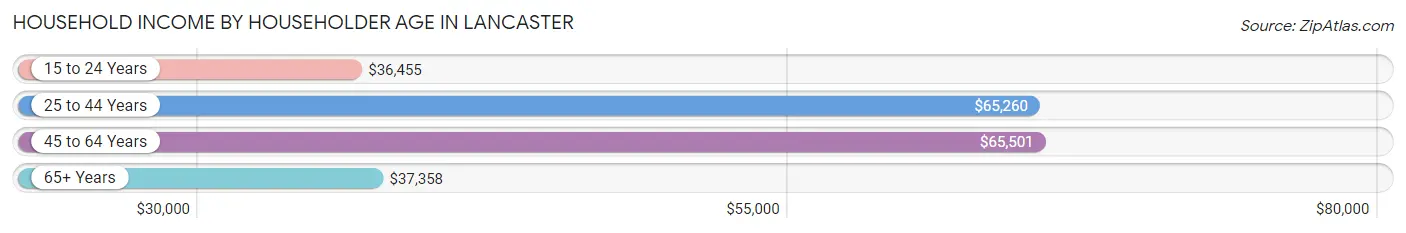
Household Income by Householder Age in Lancaster
The median household income in Lancaster is $52,716, with the highest median household income of $65,501 found in the 45 to 64 years age bracket for the primary householder. A total of 5,789 households (34.5%) fall into this category. Meanwhile, the 15 to 24 years age bracket for the primary householder has the lowest median household income of $36,455, with 868 households (5.2%) in this group.
| Income Bracket | # Households | Median Income |
| 15 to 24 Years | 868 (5.2%) | $36,455 |
| 25 to 44 Years | 5,205 (31.0%) | $65,260 |
| 45 to 64 Years | 5,789 (34.5%) | $65,501 |
| 65+ Years | 4,932 (29.4%) | $37,358 |
| Total | 16,794 (100.0%) | $52,716 |
Poverty in Lancaster
Income Below Poverty by Sex and Age in Lancaster
With 13.8% poverty level for males and 17.0% for females among the residents of Lancaster, 16 and 17 year old males and 16 and 17 year old females are the most vulnerable to poverty, with 160 males (38.5%) and 238 females (42.3%) in their respective age groups living below the poverty level.
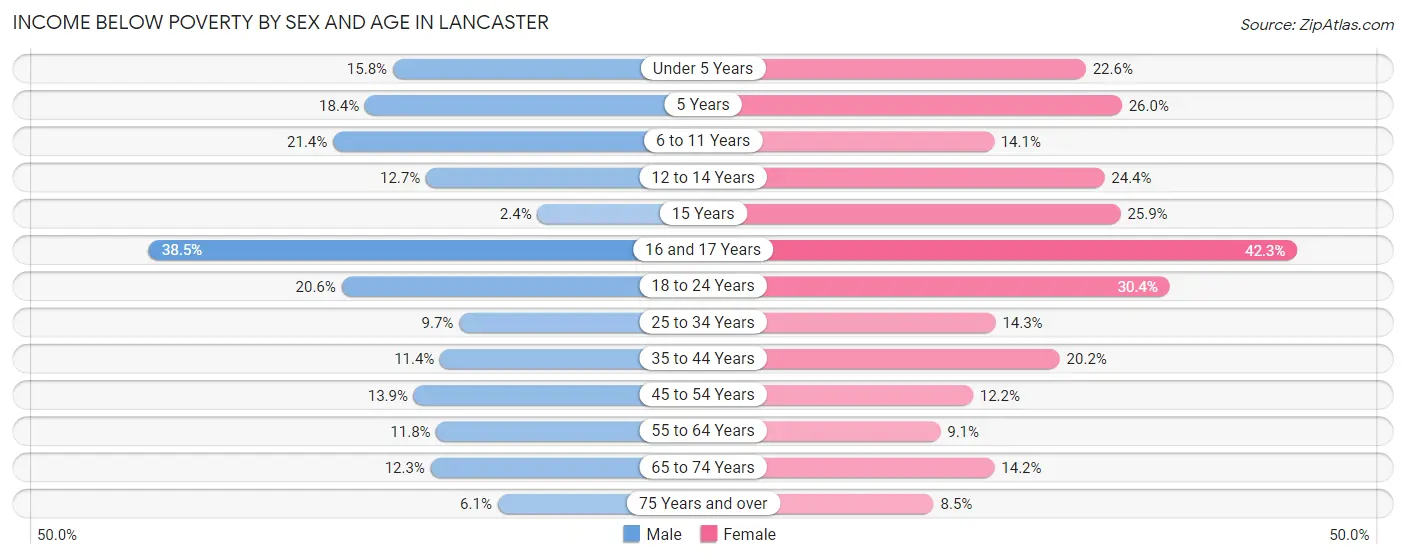
| Age Bracket | Male | Female |
| Under 5 Years | 166 (15.8%) | 300 (22.6%) |
| 5 Years | 46 (18.4%) | 106 (26.0%) |
| 6 to 11 Years | 322 (21.4%) | 192 (14.1%) |
| 12 to 14 Years | 81 (12.7%) | 146 (24.4%) |
| 15 Years | 7 (2.4%) | 60 (25.9%) |
| 16 and 17 Years | 160 (38.5%) | 238 (42.3%) |
| 18 to 24 Years | 390 (20.6%) | 548 (30.4%) |
| 25 to 34 Years | 268 (9.7%) | 401 (14.3%) |
| 35 to 44 Years | 275 (11.4%) | 492 (20.2%) |
| 45 to 54 Years | 367 (13.9%) | 261 (12.2%) |
| 55 to 64 Years | 288 (11.8%) | 214 (9.1%) |
| 65 to 74 Years | 202 (12.3%) | 288 (14.2%) |
| 75 Years and over | 75 (6.1%) | 175 (8.5%) |
| Total | 2,647 (13.8%) | 3,421 (17.0%) |
Income Above Poverty by Sex and Age in Lancaster
According to the poverty statistics in Lancaster, males aged 15 years and females aged 75 years and over are the age groups that are most secure financially, with 97.6% of males and 91.5% of females in these age groups living above the poverty line.
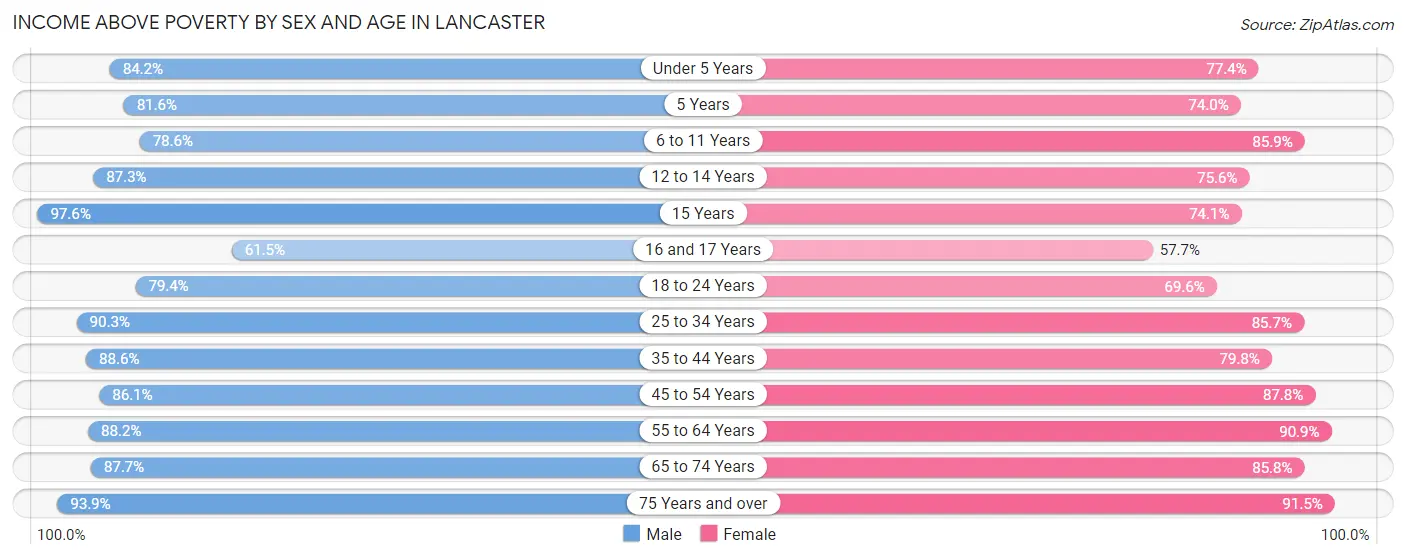
| Age Bracket | Male | Female |
| Under 5 Years | 883 (84.2%) | 1,025 (77.4%) |
| 5 Years | 204 (81.6%) | 302 (74.0%) |
| 6 to 11 Years | 1,185 (78.6%) | 1,170 (85.9%) |
| 12 to 14 Years | 555 (87.3%) | 453 (75.6%) |
| 15 Years | 285 (97.6%) | 172 (74.1%) |
| 16 and 17 Years | 256 (61.5%) | 325 (57.7%) |
| 18 to 24 Years | 1,505 (79.4%) | 1,253 (69.6%) |
| 25 to 34 Years | 2,504 (90.3%) | 2,411 (85.7%) |
| 35 to 44 Years | 2,132 (88.6%) | 1,941 (79.8%) |
| 45 to 54 Years | 2,277 (86.1%) | 1,886 (87.8%) |
| 55 to 64 Years | 2,156 (88.2%) | 2,128 (90.9%) |
| 65 to 74 Years | 1,439 (87.7%) | 1,746 (85.8%) |
| 75 Years and over | 1,156 (93.9%) | 1,878 (91.5%) |
| Total | 16,537 (86.2%) | 16,690 (83.0%) |
Income Below Poverty Among Married-Couple Families in Lancaster
The poverty statistics for married-couple families in Lancaster show that 3.0% or 206 of the total 6,927 families live below the poverty line. Families with 5 or more children have the highest poverty rate of 12.4%, comprising of 32 families. On the other hand, families with 1 or 2 children have the lowest poverty rate of 1.4%, which includes 28 families.
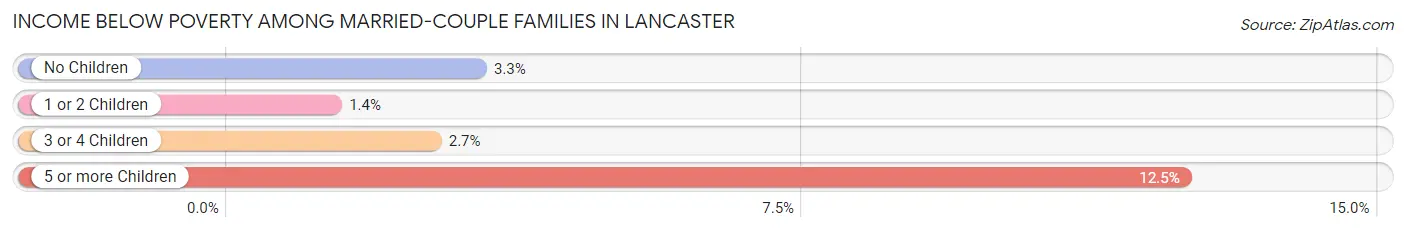
| Children | Above Poverty | Below Poverty |
| No Children | 3,872 (96.8%) | 130 (3.3%) |
| 1 or 2 Children | 2,038 (98.6%) | 28 (1.4%) |
| 3 or 4 Children | 586 (97.3%) | 16 (2.7%) |
| 5 or more Children | 225 (87.5%) | 32 (12.4%) |
| Total | 6,721 (97.0%) | 206 (3.0%) |
Income Below Poverty Among Single-Parent Households in Lancaster
According to the poverty data in Lancaster, 20.8% or 175 single-father households and 32.3% or 684 single-mother households are living below the poverty line. Among single-father households, those with 1 or 2 children have the highest poverty rate, with 175 households (34.5%) experiencing poverty. Likewise, among single-mother households, those with 3 or 4 children have the highest poverty rate, with 157 households (65.1%) falling below the poverty line.
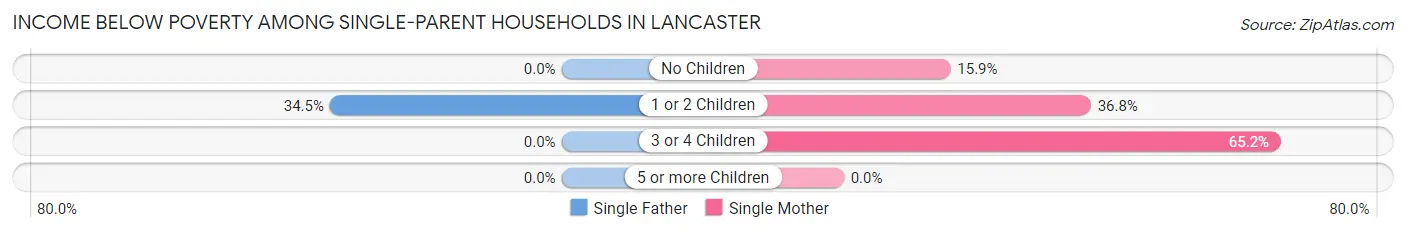
| Children | Single Father | Single Mother |
| No Children | 0 (0.0%) | 125 (15.9%) |
| 1 or 2 Children | 175 (34.5%) | 402 (36.8%) |
| 3 or 4 Children | 0 (0.0%) | 157 (65.1%) |
| 5 or more Children | 0 (0.0%) | 0 (0.0%) |
| Total | 175 (20.8%) | 684 (32.3%) |
Income Below Poverty Among Married-Couple vs Single-Parent Households in Lancaster
The poverty data for Lancaster shows that 206 of the married-couple family households (3.0%) and 859 of the single-parent households (29.0%) are living below the poverty level. Within the married-couple family households, those with 5 or more children have the highest poverty rate, with 32 households (12.4%) falling below the poverty line. Among the single-parent households, those with 3 or 4 children have the highest poverty rate, with 157 household (61.8%) living below poverty.
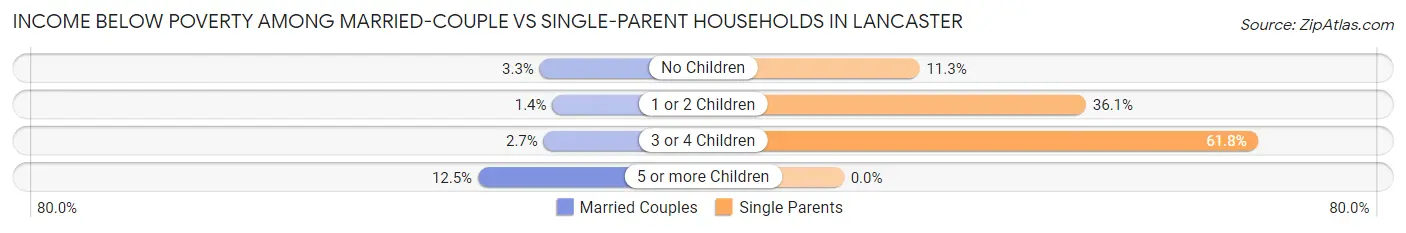
| Children | Married-Couple Families | Single-Parent Households |
| No Children | 130 (3.3%) | 125 (11.3%) |
| 1 or 2 Children | 28 (1.4%) | 577 (36.1%) |
| 3 or 4 Children | 16 (2.7%) | 157 (61.8%) |
| 5 or more Children | 32 (12.4%) | 0 (0.0%) |
| Total | 206 (3.0%) | 859 (29.0%) |
Race in Lancaster
The most populous races in Lancaster are White / Caucasian (37,682 | 92.8%), Two or more Races (1,755 | 4.3%), and Hispanic or Latino (973 | 2.4%).
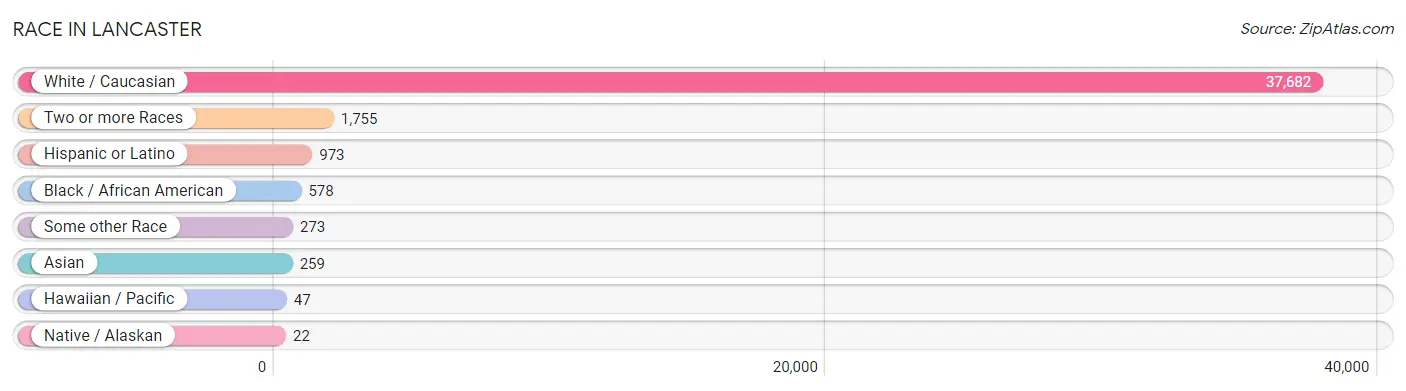
| Race | # Population | % Population |
| Asian | 259 | 0.6% |
| Black / African American | 578 | 1.4% |
| Hawaiian / Pacific | 47 | 0.1% |
| Hispanic or Latino | 973 | 2.4% |
| Native / Alaskan | 22 | 0.1% |
| White / Caucasian | 37,682 | 92.8% |
| Two or more Races | 1,755 | 4.3% |
| Some other Race | 273 | 0.7% |
| Total | 40,616 | 100.0% |
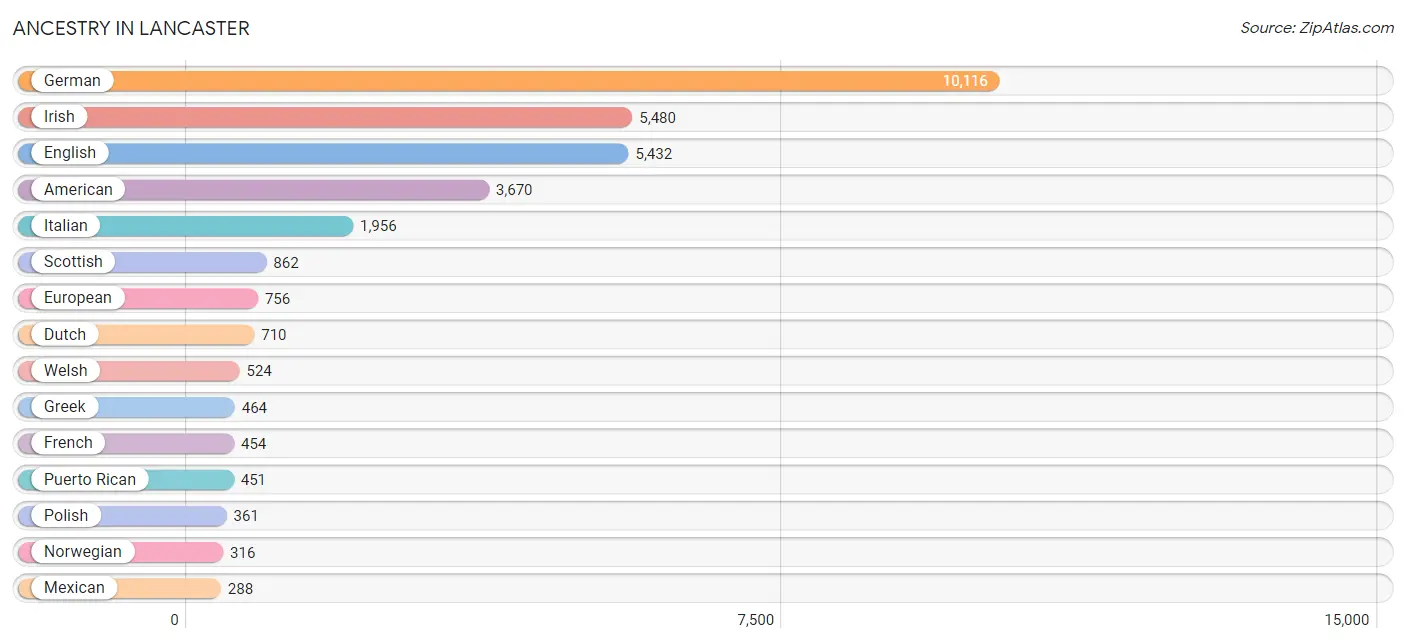
Ancestry in Lancaster
The most populous ancestries reported in Lancaster are German (10,116 | 24.9%), Irish (5,480 | 13.5%), English (5,432 | 13.4%), American (3,670 | 9.0%), and Italian (1,956 | 4.8%), together accounting for 65.6% of all Lancaster residents.
| Ancestry | # Population | % Population |
| African | 19 | 0.1% |
| Alsatian | 5 | 0.0% |
| American | 3,670 | 9.0% |
| Arab | 113 | 0.3% |
| Belgian | 12 | 0.0% |
| Bhutanese | 49 | 0.1% |
| Blackfeet | 71 | 0.2% |
| British | 196 | 0.5% |
| Burmese | 52 | 0.1% |
| Canadian | 16 | 0.0% |
| Cherokee | 200 | 0.5% |
| Croatian | 46 | 0.1% |
| Cuban | 168 | 0.4% |
| Czech | 52 | 0.1% |
| Czechoslovakian | 44 | 0.1% |
| Danish | 59 | 0.2% |
| Dominican | 11 | 0.0% |
| Dutch | 710 | 1.8% |
| Eastern European | 198 | 0.5% |
| English | 5,432 | 13.4% |
| European | 756 | 1.9% |
| Finnish | 14 | 0.0% |
| French | 454 | 1.1% |
| French Canadian | 49 | 0.1% |
| German | 10,116 | 24.9% |
| Greek | 464 | 1.1% |
| Guamanian / Chamorro | 3 | 0.0% |
| Haitian | 3 | 0.0% |
| Hungarian | 213 | 0.5% |
| Indian (Asian) | 162 | 0.4% |
| Irish | 5,480 | 13.5% |
| Iroquois | 9 | 0.0% |
| Italian | 1,956 | 4.8% |
| Korean | 146 | 0.4% |
| Laotian | 17 | 0.0% |
| Lebanese | 36 | 0.1% |
| Lithuanian | 9 | 0.0% |
| Mexican | 288 | 0.7% |
| Moroccan | 49 | 0.1% |
| Native Hawaiian | 50 | 0.1% |
| Nigerian | 45 | 0.1% |
| Norwegian | 316 | 0.8% |
| Pakistani | 45 | 0.1% |
| Pennsylvania German | 28 | 0.1% |
| Polish | 361 | 0.9% |
| Puerto Rican | 451 | 1.1% |
| Romanian | 28 | 0.1% |
| Russian | 187 | 0.5% |
| Samoan | 3 | 0.0% |
| Scandinavian | 157 | 0.4% |
| Scotch-Irish | 275 | 0.7% |
| Scottish | 862 | 2.1% |
| Slavic | 10 | 0.0% |
| Slovak | 27 | 0.1% |
| Slovene | 10 | 0.0% |
| Spaniard | 17 | 0.0% |
| Sri Lankan | 29 | 0.1% |
| Subsaharan African | 70 | 0.2% |
| Swedish | 89 | 0.2% |
| Swiss | 229 | 0.6% |
| Thai | 42 | 0.1% |
| Ukrainian | 65 | 0.2% |
| Welsh | 524 | 1.3% |
| Yugoslavian | 9 | 0.0% | View All 64 Rows |
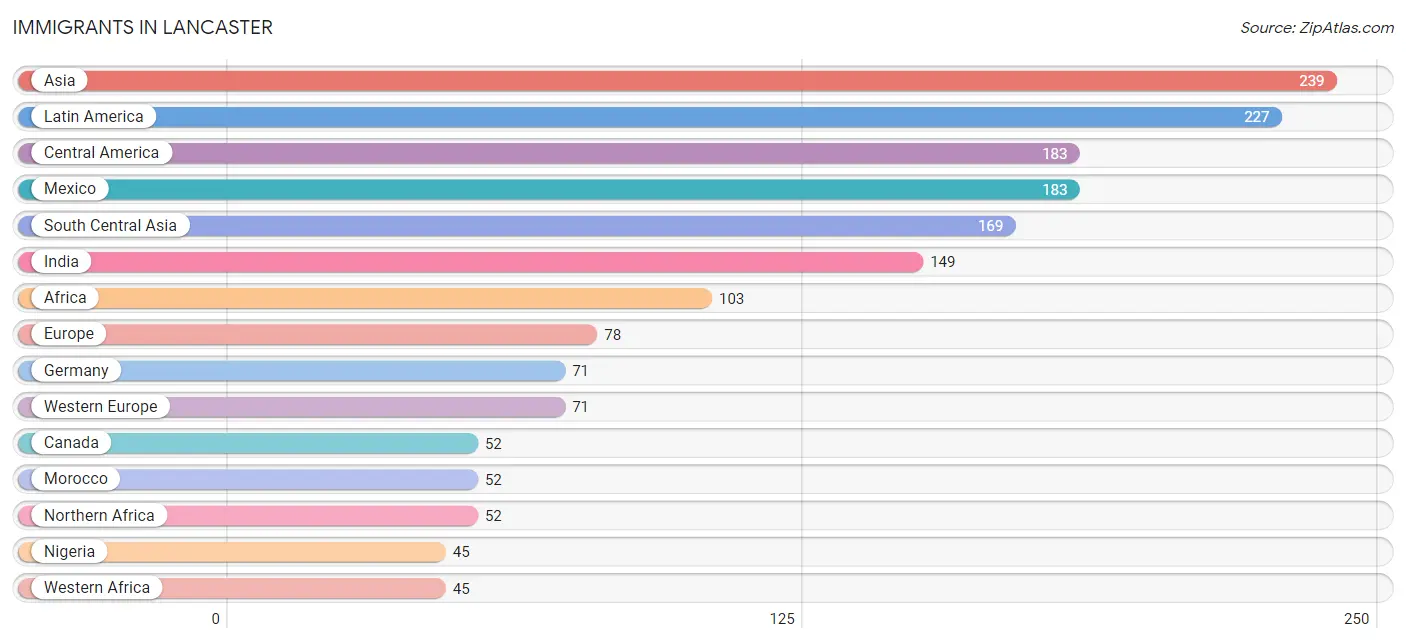
Immigrants in Lancaster
The most numerous immigrant groups reported in Lancaster came from Asia (239 | 0.6%), Latin America (227 | 0.6%), Central America (183 | 0.4%), Mexico (183 | 0.4%), and South Central Asia (169 | 0.4%), together accounting for 2.5% of all Lancaster residents.
| Immigration Origin | # Population | % Population |
| Africa | 103 | 0.3% |
| Asia | 239 | 0.6% |
| Canada | 52 | 0.1% |
| Caribbean | 23 | 0.1% |
| Central America | 183 | 0.4% |
| China | 26 | 0.1% |
| Cuba | 23 | 0.1% |
| Eastern Asia | 39 | 0.1% |
| Europe | 78 | 0.2% |
| Germany | 71 | 0.2% |
| India | 149 | 0.4% |
| Indonesia | 17 | 0.0% |
| Korea | 13 | 0.0% |
| Latin America | 227 | 0.6% |
| Mexico | 183 | 0.4% |
| Middle Africa | 6 | 0.0% |
| Morocco | 52 | 0.1% |
| Nigeria | 45 | 0.1% |
| Northern Africa | 52 | 0.1% |
| Northern Europe | 7 | 0.0% |
| Peru | 21 | 0.1% |
| Philippines | 6 | 0.0% |
| South America | 21 | 0.1% |
| South Central Asia | 169 | 0.4% |
| South Eastern Asia | 31 | 0.1% |
| Sri Lanka | 20 | 0.1% |
| Vietnam | 8 | 0.0% |
| Western Africa | 45 | 0.1% |
| Western Europe | 71 | 0.2% | View All 29 Rows |
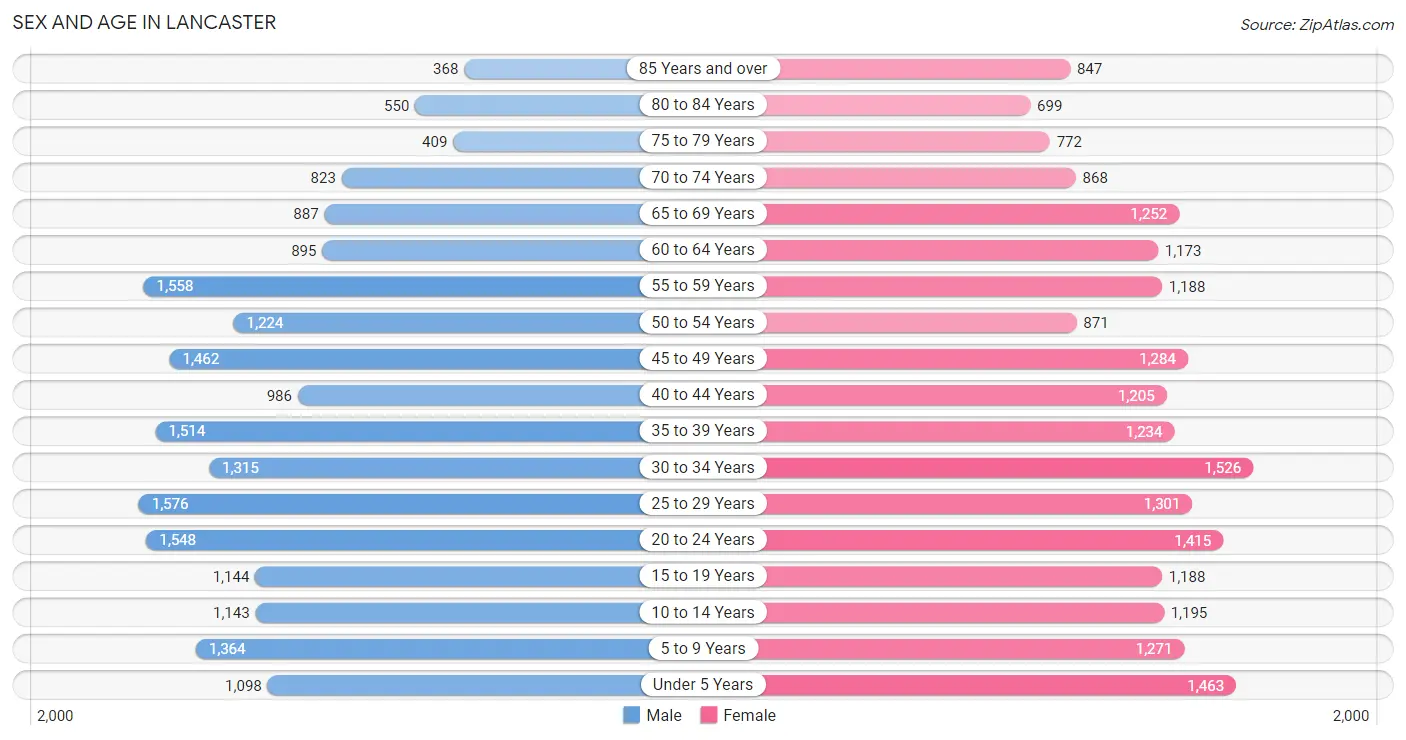
Sex and Age in Lancaster
Sex and Age in Lancaster
The most populous age groups in Lancaster are 25 to 29 Years (1,576 | 7.9%) for men and 30 to 34 Years (1,526 | 7.3%) for women.
| Age Bracket | Male | Female |
| Under 5 Years | 1,098 (5.5%) | 1,463 (7.0%) |
| 5 to 9 Years | 1,364 (6.9%) | 1,271 (6.1%) |
| 10 to 14 Years | 1,143 (5.8%) | 1,195 (5.8%) |
| 15 to 19 Years | 1,144 (5.8%) | 1,188 (5.7%) |
| 20 to 24 Years | 1,548 (7.8%) | 1,415 (6.8%) |
| 25 to 29 Years | 1,576 (7.9%) | 1,301 (6.3%) |
| 30 to 34 Years | 1,315 (6.6%) | 1,526 (7.3%) |
| 35 to 39 Years | 1,514 (7.6%) | 1,234 (5.9%) |
| 40 to 44 Years | 986 (5.0%) | 1,205 (5.8%) |
| 45 to 49 Years | 1,462 (7.4%) | 1,284 (6.2%) |
| 50 to 54 Years | 1,224 (6.2%) | 871 (4.2%) |
| 55 to 59 Years | 1,558 (7.8%) | 1,188 (5.7%) |
| 60 to 64 Years | 895 (4.5%) | 1,173 (5.7%) |
| 65 to 69 Years | 887 (4.5%) | 1,252 (6.0%) |
| 70 to 74 Years | 823 (4.1%) | 868 (4.2%) |
| 75 to 79 Years | 409 (2.1%) | 772 (3.7%) |
| 80 to 84 Years | 550 (2.8%) | 699 (3.4%) |
| 85 Years and over | 368 (1.8%) | 847 (4.1%) |
| Total | 19,864 (100.0%) | 20,752 (100.0%) |
Families and Households in Lancaster
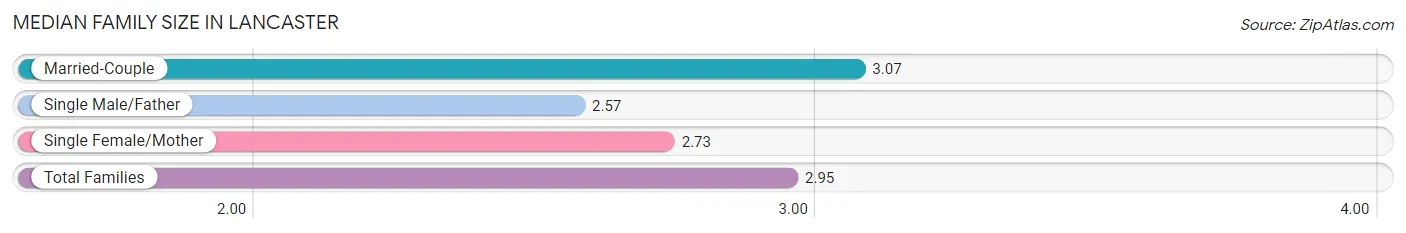
Median Family Size in Lancaster
The median family size in Lancaster is 2.95 persons per family, with married-couple families (6,927 | 70.1%) accounting for the largest median family size of 3.07 persons per family. On the other hand, single male/father families (840 | 8.5%) represent the smallest median family size with 2.57 persons per family.
| Family Type | # Families | Family Size |
| Married-Couple | 6,927 (70.1%) | 3.07 |
| Single Male/Father | 840 (8.5%) | 2.57 |
| Single Female/Mother | 2,119 (21.4%) | 2.73 |
| Total Families | 9,886 (100.0%) | 2.95 |
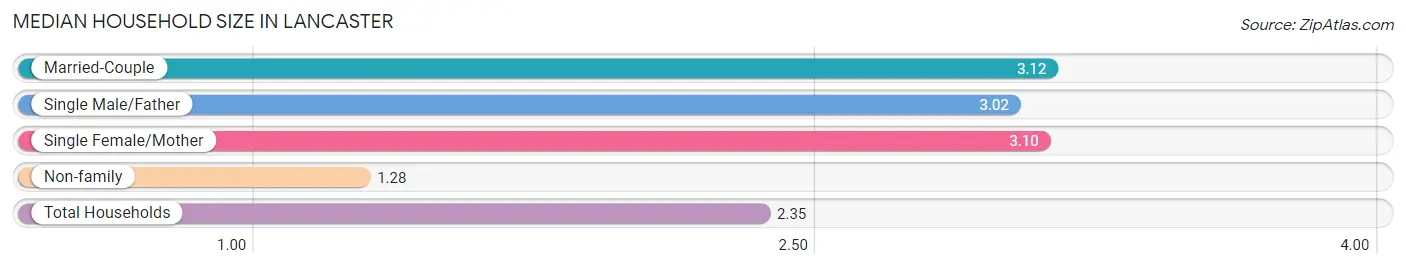
Median Household Size in Lancaster
The median household size in Lancaster is 2.35 persons per household, with married-couple households (6,927 | 41.2%) accounting for the largest median household size of 3.12 persons per household. non-family households (6,908 | 41.1%) represent the smallest median household size with 1.28 persons per household.
| Household Type | # Households | Household Size |
| Married-Couple | 6,927 (41.2%) | 3.12 |
| Single Male/Father | 840 (5.0%) | 3.02 |
| Single Female/Mother | 2,119 (12.6%) | 3.10 |
| Non-family | 6,908 (41.1%) | 1.28 |
| Total Households | 16,794 (100.0%) | 2.35 |
Household Size by Marriage Status in Lancaster
Out of a total of 16,794 households in Lancaster, 9,886 (58.9%) are family households, while 6,908 (41.1%) are nonfamily households. The most numerous type of family households are 2-person households, comprising 4,171, and the most common type of nonfamily households are 1-person households, comprising 5,521.
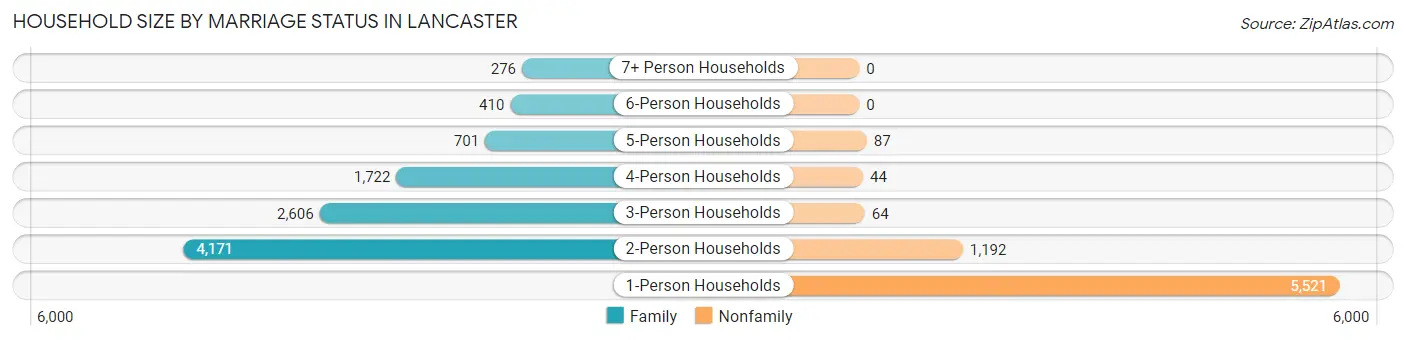
| Household Size | Family Households | Nonfamily Households |
| 1-Person Households | - | 5,521 (32.9%) |
| 2-Person Households | 4,171 (24.8%) | 1,192 (7.1%) |
| 3-Person Households | 2,606 (15.5%) | 64 (0.4%) |
| 4-Person Households | 1,722 (10.2%) | 44 (0.3%) |
| 5-Person Households | 701 (4.2%) | 87 (0.5%) |
| 6-Person Households | 410 (2.4%) | 0 (0.0%) |
| 7+ Person Households | 276 (1.6%) | 0 (0.0%) |
| Total | 9,886 (58.9%) | 6,908 (41.1%) |
Female Fertility in Lancaster
Fertility by Age in Lancaster
Average fertility rate in Lancaster is 80.0 births per 1,000 women. Women in the age bracket of 20 to 34 years have the highest fertility rate with 140.0 births per 1,000 women. Women in the age bracket of 20 to 34 years acount for 79.3% of all women with births.
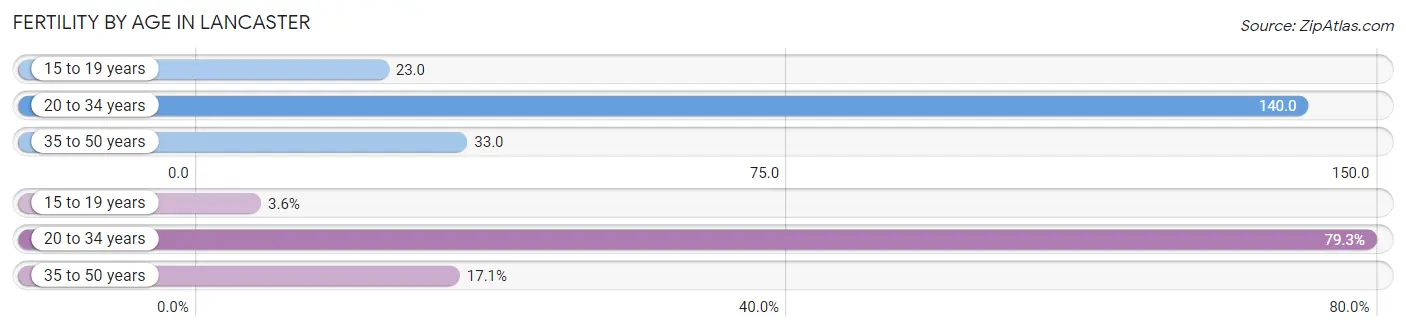
| Age Bracket | Women with Births | Births / 1,000 Women |
| 15 to 19 years | 27 (3.6%) | 23.0 |
| 20 to 34 years | 594 (79.3%) | 140.0 |
| 35 to 50 years | 128 (17.1%) | 33.0 |
| Total | 749 (100.0%) | 80.0 |
Fertility by Age by Marriage Status in Lancaster
61.3% of women with births (749) in Lancaster are married. The highest percentage of unmarried women with births falls into 15 to 19 years age bracket with 100.0% of them unmarried at the time of birth, while the lowest percentage of unmarried women with births belong to 20 to 34 years age bracket with 33.5% of them unmarried.
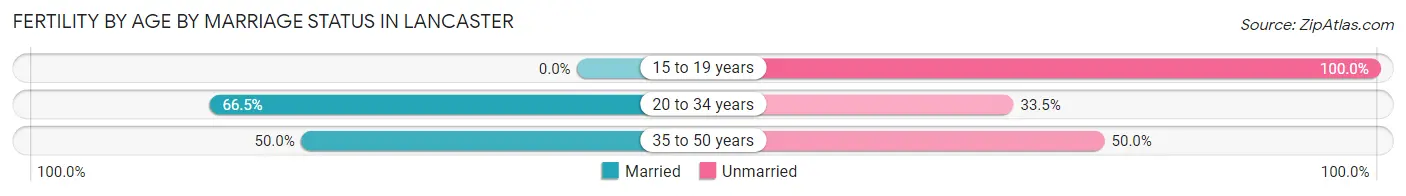
| Age Bracket | Married | Unmarried |
| 15 to 19 years | 0 (0.0%) | 27 (100.0%) |
| 20 to 34 years | 395 (66.5%) | 199 (33.5%) |
| 35 to 50 years | 64 (50.0%) | 64 (50.0%) |
| Total | 459 (61.3%) | 290 (38.7%) |
Fertility by Education in Lancaster
Average fertility rate in Lancaster is 80.0 births per 1,000 women. Women with the education attainment of college or associate's degree have the highest fertility rate of 107.0 births per 1,000 women, while women with the education attainment of graduate degree have the lowest fertility at 15.0 births per 1,000 women. Women with the education attainment of college or associate's degree represent 42.2% of all women with births.
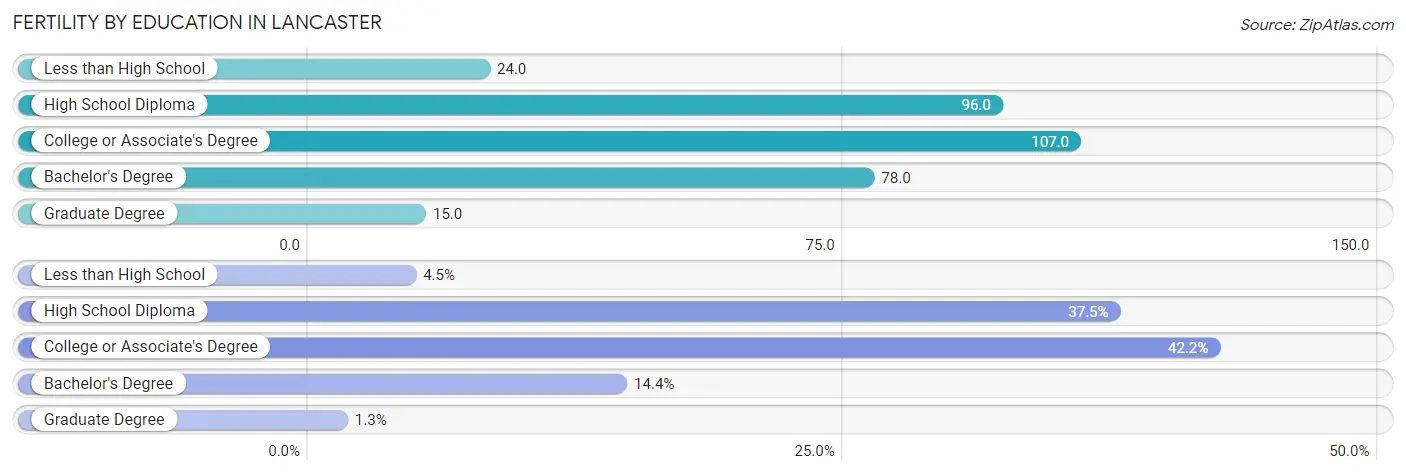
| Educational Attainment | Women with Births | Births / 1,000 Women |
| Less than High School | 34 (4.5%) | 24.0 |
| High School Diploma | 281 (37.5%) | 96.0 |
| College or Associate's Degree | 316 (42.2%) | 107.0 |
| Bachelor's Degree | 108 (14.4%) | 78.0 |
| Graduate Degree | 10 (1.3%) | 15.0 |
| Total | 749 (100.0%) | 80.0 |
Fertility by Education by Marriage Status in Lancaster
38.7% of women with births in Lancaster are unmarried. Women with the educational attainment of bachelor's degree are most likely to be married with 100.0% of them married at childbirth, while women with the educational attainment of less than high school are least likely to be married with 100.0% of them unmarried at childbirth.
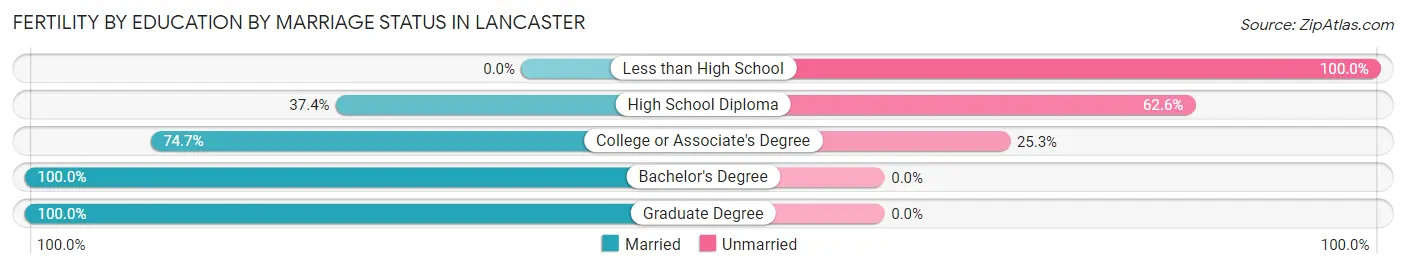
| Educational Attainment | Married | Unmarried |
| Less than High School | 0 (0.0%) | 34 (100.0%) |
| High School Diploma | 105 (37.4%) | 176 (62.6%) |
| College or Associate's Degree | 236 (74.7%) | 80 (25.3%) |
| Bachelor's Degree | 108 (100.0%) | 0 (0.0%) |
| Graduate Degree | 10 (100.0%) | 0 (0.0%) |
| Total | 459 (61.3%) | 290 (38.7%) |
Employment Characteristics in Lancaster
Employment by Class of Employer in Lancaster
Among the 18,175 employed individuals in Lancaster, private company employees (13,478 | 74.2%), local government employees (1,428 | 7.9%), and not-for-profit organizations (1,340 | 7.4%) make up the most common classes of employment.
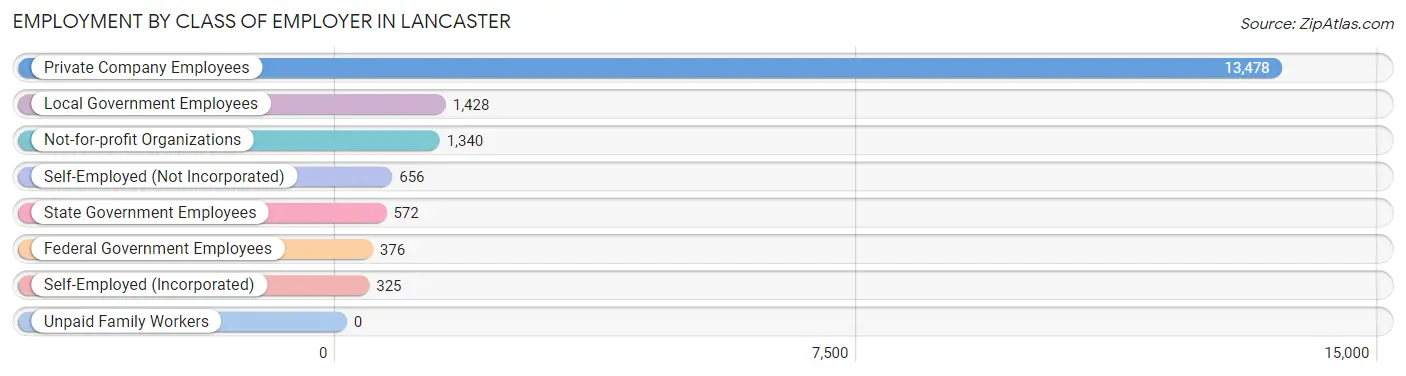
| Employer Class | # Employees | % Employees |
| Private Company Employees | 13,478 | 74.2% |
| Self-Employed (Incorporated) | 325 | 1.8% |
| Self-Employed (Not Incorporated) | 656 | 3.6% |
| Not-for-profit Organizations | 1,340 | 7.4% |
| Local Government Employees | 1,428 | 7.9% |
| State Government Employees | 572 | 3.2% |
| Federal Government Employees | 376 | 2.1% |
| Unpaid Family Workers | 0 | 0.0% |
| Total | 18,175 | 100.0% |
Employment Status by Age in Lancaster
According to the labor force statistics for Lancaster, out of the total population over 16 years of age (32,558), 59.9% or 19,502 individuals are in the labor force, with 4.6% or 897 of them unemployed. The age group with the highest labor force participation rate is 25 to 29 years, with 86.8% or 2,497 individuals in the labor force. Within the labor force, the 16 to 19 years age range has the highest percentage of unemployed individuals, with 19.6% or 182 of them being unemployed.
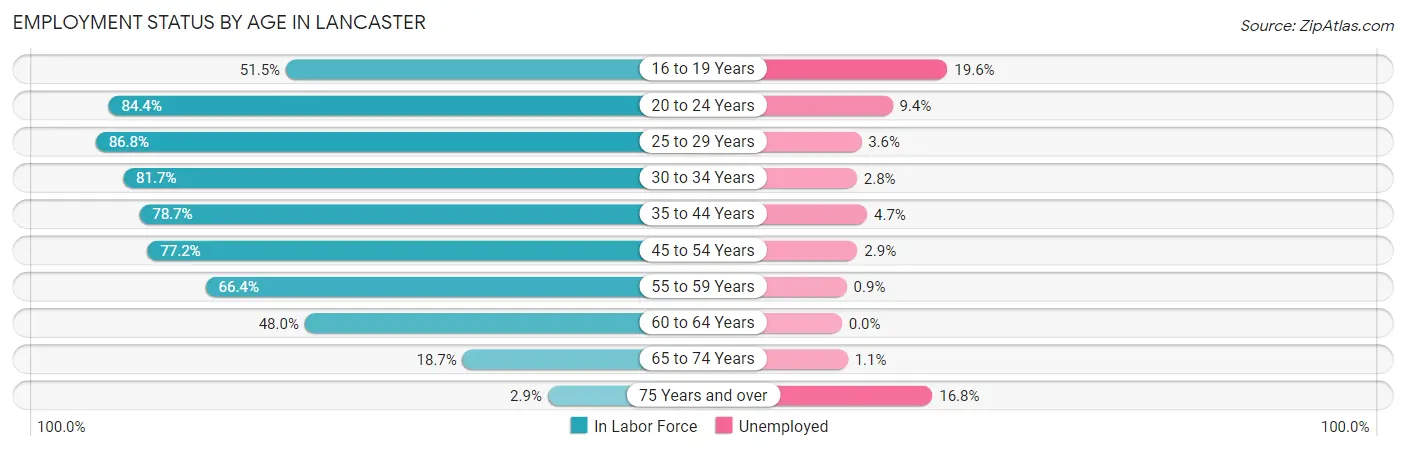
| Age Bracket | In Labor Force | Unemployed |
| 16 to 19 Years | 931 (51.5%) | 182 (19.6%) |
| 20 to 24 Years | 2,501 (84.4%) | 235 (9.4%) |
| 25 to 29 Years | 2,497 (86.8%) | 90 (3.6%) |
| 30 to 34 Years | 2,321 (81.7%) | 65 (2.8%) |
| 35 to 44 Years | 3,887 (78.7%) | 183 (4.7%) |
| 45 to 54 Years | 3,737 (77.2%) | 108 (2.9%) |
| 55 to 59 Years | 1,823 (66.4%) | 16 (0.9%) |
| 60 to 64 Years | 993 (48.0%) | 0 (0.0%) |
| 65 to 74 Years | 716 (18.7%) | 8 (1.1%) |
| 75 Years and over | 106 (2.9%) | 18 (16.8%) |
| Total | 19,502 (59.9%) | 897 (4.6%) |
Employment Status by Educational Attainment in Lancaster
According to labor force statistics for Lancaster, 75.1% of individuals (15,254) out of the total population between 25 and 64 years of age (20,312) are in the labor force, with 3.0% or 458 of them being unemployed. The group with the highest labor force participation rate are those with the educational attainment of bachelor's degree or higher, with 89.4% or 4,155 individuals in the labor force. Within the labor force, individuals with college / associate degree education have the highest percentage of unemployment, with 4.3% or 203 of them being unemployed.
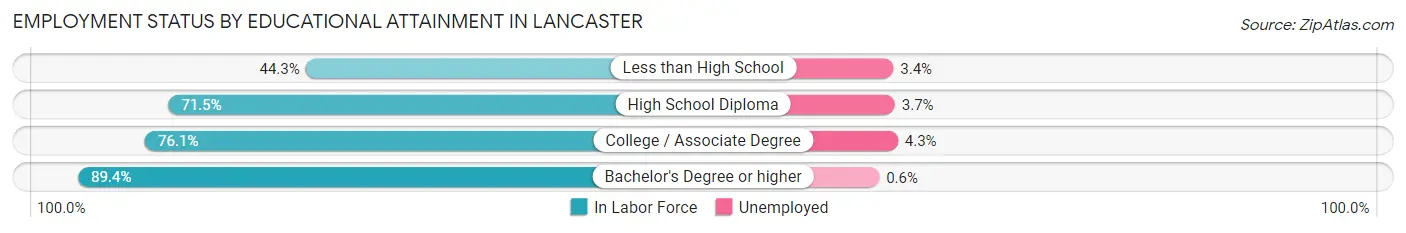
| Educational Attainment | In Labor Force | Unemployed |
| Less than High School | 615 (44.3%) | 47 (3.4%) |
| High School Diploma | 5,778 (71.5%) | 299 (3.7%) |
| College / Associate Degree | 4,714 (76.1%) | 266 (4.3%) |
| Bachelor's Degree or higher | 4,155 (89.4%) | 28 (0.6%) |
| Total | 15,254 (75.1%) | 609 (3.0%) |
Employment Occupations by Sex in Lancaster
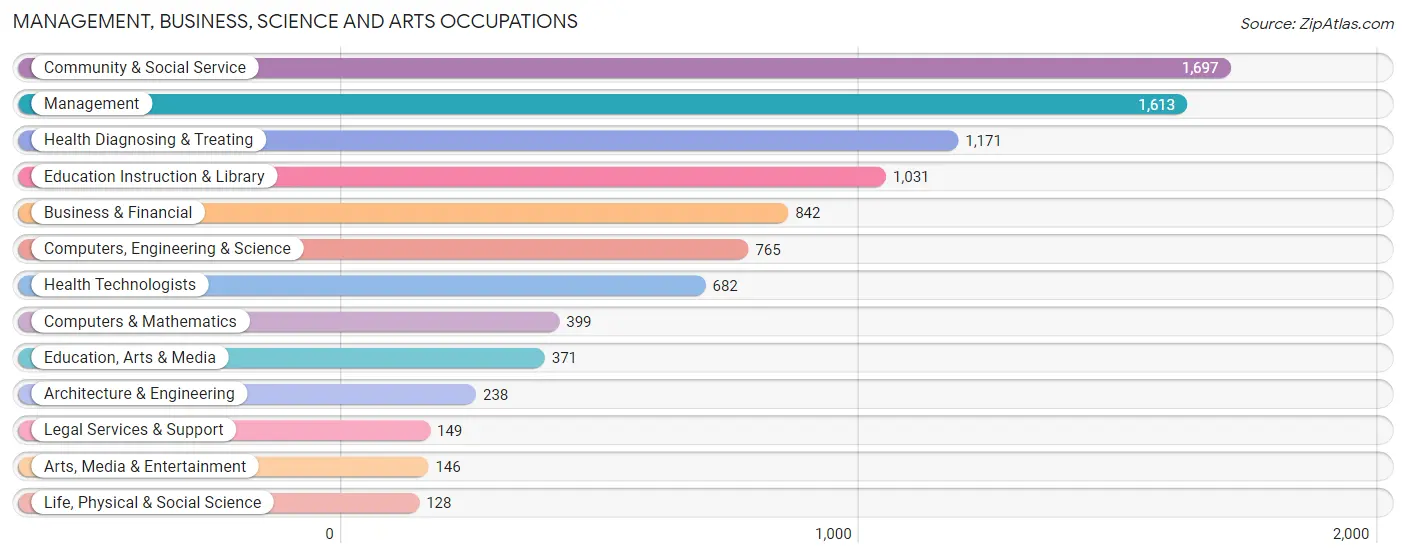
Management, Business, Science and Arts Occupations
The most common Management, Business, Science and Arts occupations in Lancaster are Community & Social Service (1,697 | 9.1%), Management (1,613 | 8.7%), Health Diagnosing & Treating (1,171 | 6.3%), Education Instruction & Library (1,031 | 5.6%), and Business & Financial (842 | 4.5%).
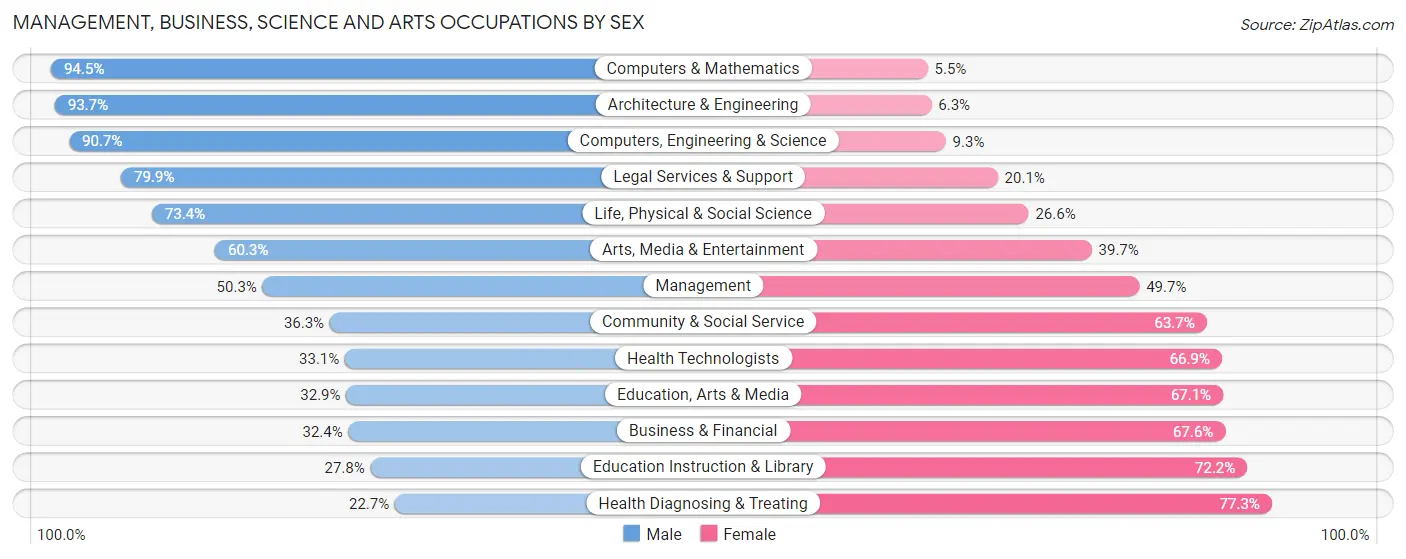
Management, Business, Science and Arts Occupations by Sex
Within the Management, Business, Science and Arts occupations in Lancaster, the most male-oriented occupations are Computers & Mathematics (94.5%), Architecture & Engineering (93.7%), and Computers, Engineering & Science (90.7%), while the most female-oriented occupations are Health Diagnosing & Treating (77.3%), Education Instruction & Library (72.2%), and Business & Financial (67.6%).
| Occupation | Male | Female |
| Management | 812 (50.3%) | 801 (49.7%) |
| Business & Financial | 273 (32.4%) | 569 (67.6%) |
| Computers, Engineering & Science | 694 (90.7%) | 71 (9.3%) |
| Computers & Mathematics | 377 (94.5%) | 22 (5.5%) |
| Architecture & Engineering | 223 (93.7%) | 15 (6.3%) |
| Life, Physical & Social Science | 94 (73.4%) | 34 (26.6%) |
| Community & Social Service | 616 (36.3%) | 1,081 (63.7%) |
| Education, Arts & Media | 122 (32.9%) | 249 (67.1%) |
| Legal Services & Support | 119 (79.9%) | 30 (20.1%) |
| Education Instruction & Library | 287 (27.8%) | 744 (72.2%) |
| Arts, Media & Entertainment | 88 (60.3%) | 58 (39.7%) |
| Health Diagnosing & Treating | 266 (22.7%) | 905 (77.3%) |
| Health Technologists | 226 (33.1%) | 456 (66.9%) |
| Total (Category) | 2,661 (43.7%) | 3,427 (56.3%) |
| Total (Overall) | 9,764 (52.6%) | 8,794 (47.4%) |
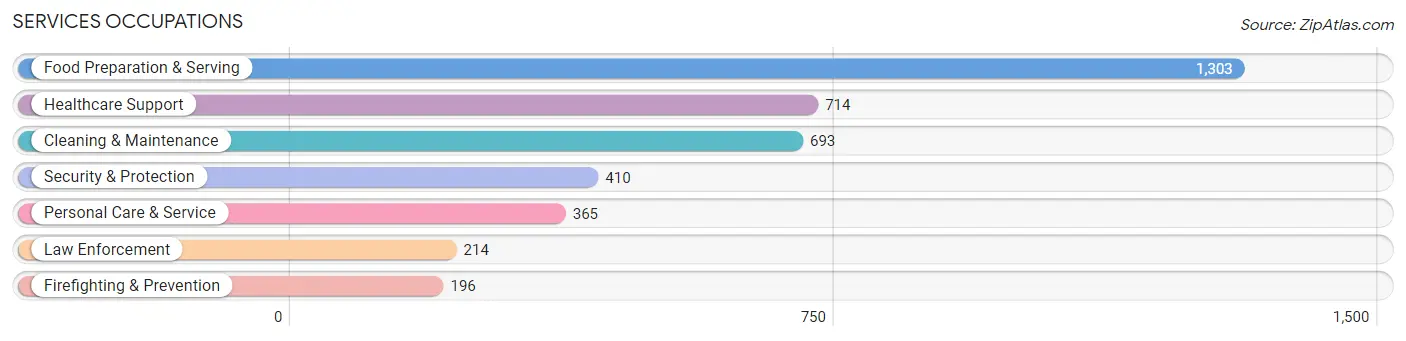
Services Occupations
The most common Services occupations in Lancaster are Food Preparation & Serving (1,303 | 7.0%), Healthcare Support (714 | 3.8%), Cleaning & Maintenance (693 | 3.7%), Security & Protection (410 | 2.2%), and Personal Care & Service (365 | 2.0%).
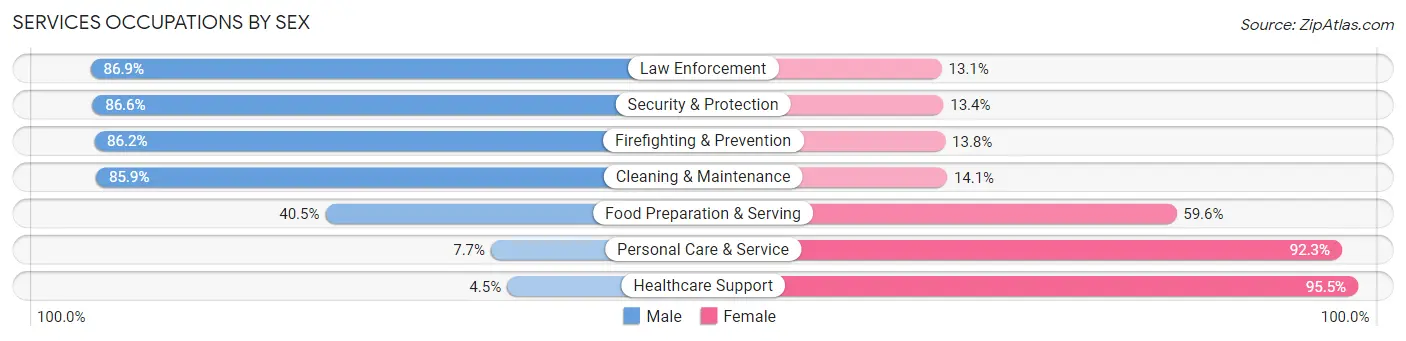
Services Occupations by Sex
Within the Services occupations in Lancaster, the most male-oriented occupations are Law Enforcement (86.9%), Security & Protection (86.6%), and Firefighting & Prevention (86.2%), while the most female-oriented occupations are Healthcare Support (95.5%), Personal Care & Service (92.3%), and Food Preparation & Serving (59.6%).
| Occupation | Male | Female |
| Healthcare Support | 32 (4.5%) | 682 (95.5%) |
| Security & Protection | 355 (86.6%) | 55 (13.4%) |
| Firefighting & Prevention | 169 (86.2%) | 27 (13.8%) |
| Law Enforcement | 186 (86.9%) | 28 (13.1%) |
| Food Preparation & Serving | 527 (40.5%) | 776 (59.6%) |
| Cleaning & Maintenance | 595 (85.9%) | 98 (14.1%) |
| Personal Care & Service | 28 (7.7%) | 337 (92.3%) |
| Total (Category) | 1,537 (44.1%) | 1,948 (55.9%) |
| Total (Overall) | 9,764 (52.6%) | 8,794 (47.4%) |
Sales and Office Occupations
The most common Sales and Office occupations in Lancaster are Office & Administration (1,978 | 10.7%), and Sales & Related (1,674 | 9.0%).
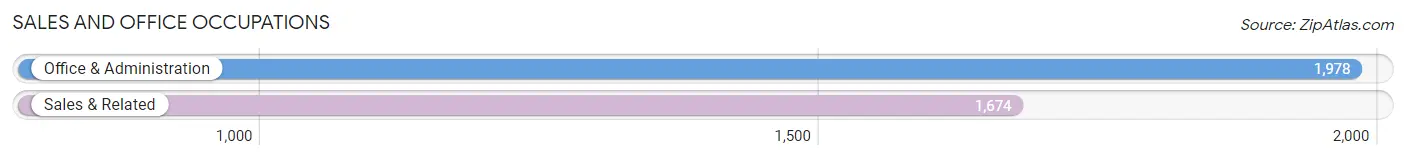
Sales and Office Occupations by Sex
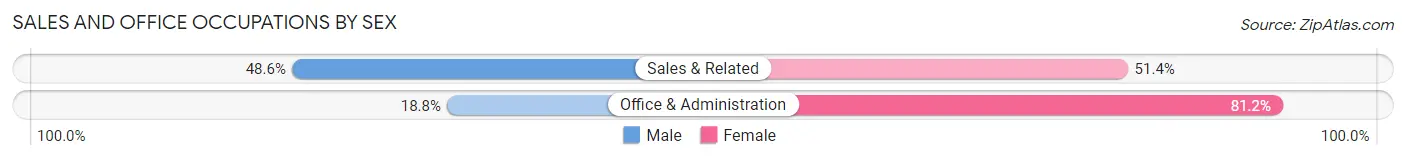
| Occupation | Male | Female |
| Sales & Related | 814 (48.6%) | 860 (51.4%) |
| Office & Administration | 372 (18.8%) | 1,606 (81.2%) |
| Total (Category) | 1,186 (32.5%) | 2,466 (67.5%) |
| Total (Overall) | 9,764 (52.6%) | 8,794 (47.4%) |
Natural Resources, Construction and Maintenance Occupations
The most common Natural Resources, Construction and Maintenance occupations in Lancaster are Construction & Extraction (1,215 | 6.6%), and Installation, Maintenance & Repair (729 | 3.9%).
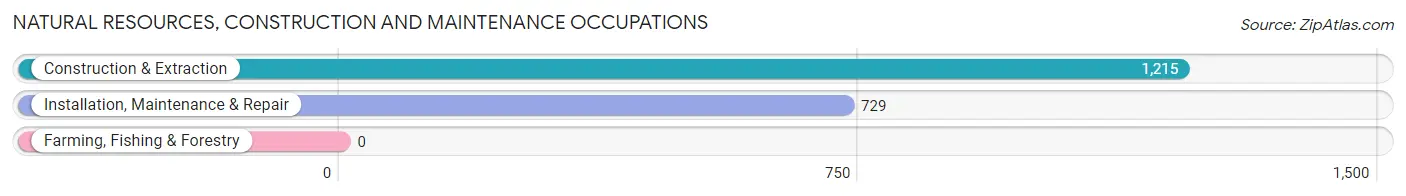
Natural Resources, Construction and Maintenance Occupations by Sex
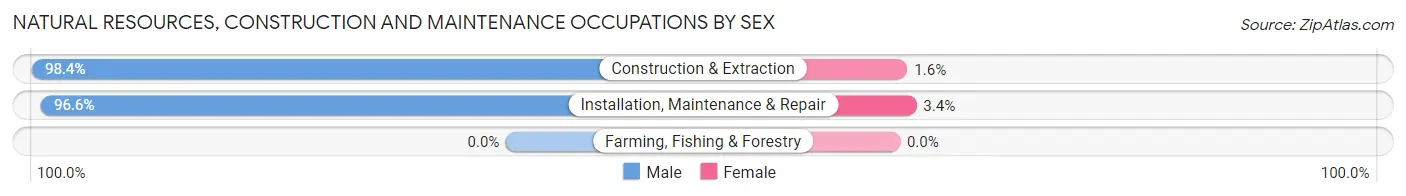
| Occupation | Male | Female |
| Farming, Fishing & Forestry | 0 (0.0%) | 0 (0.0%) |
| Construction & Extraction | 1,196 (98.4%) | 19 (1.6%) |
| Installation, Maintenance & Repair | 704 (96.6%) | 25 (3.4%) |
| Total (Category) | 1,900 (97.7%) | 44 (2.3%) |
| Total (Overall) | 9,764 (52.6%) | 8,794 (47.4%) |
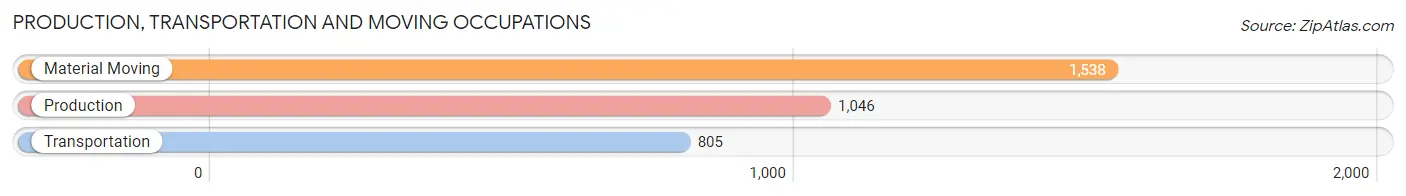
Production, Transportation and Moving Occupations
The most common Production, Transportation and Moving occupations in Lancaster are Material Moving (1,538 | 8.3%), Production (1,046 | 5.6%), and Transportation (805 | 4.3%).
Production, Transportation and Moving Occupations by Sex
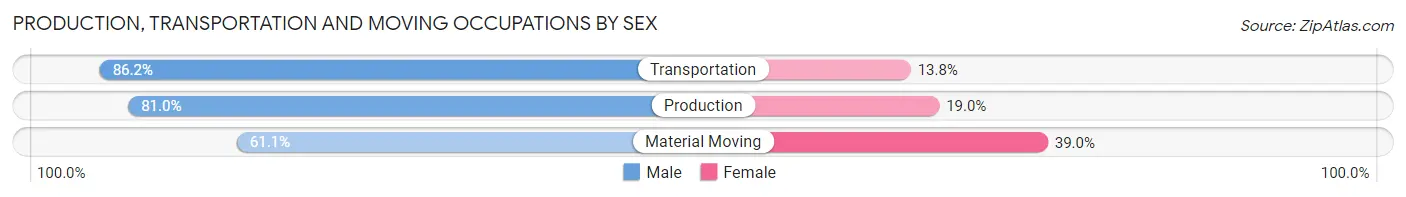
| Occupation | Male | Female |
| Production | 847 (81.0%) | 199 (19.0%) |
| Transportation | 694 (86.2%) | 111 (13.8%) |
| Material Moving | 939 (61.1%) | 599 (39.0%) |
| Total (Category) | 2,480 (73.2%) | 909 (26.8%) |
| Total (Overall) | 9,764 (52.6%) | 8,794 (47.4%) |
Employment Industries by Sex in Lancaster
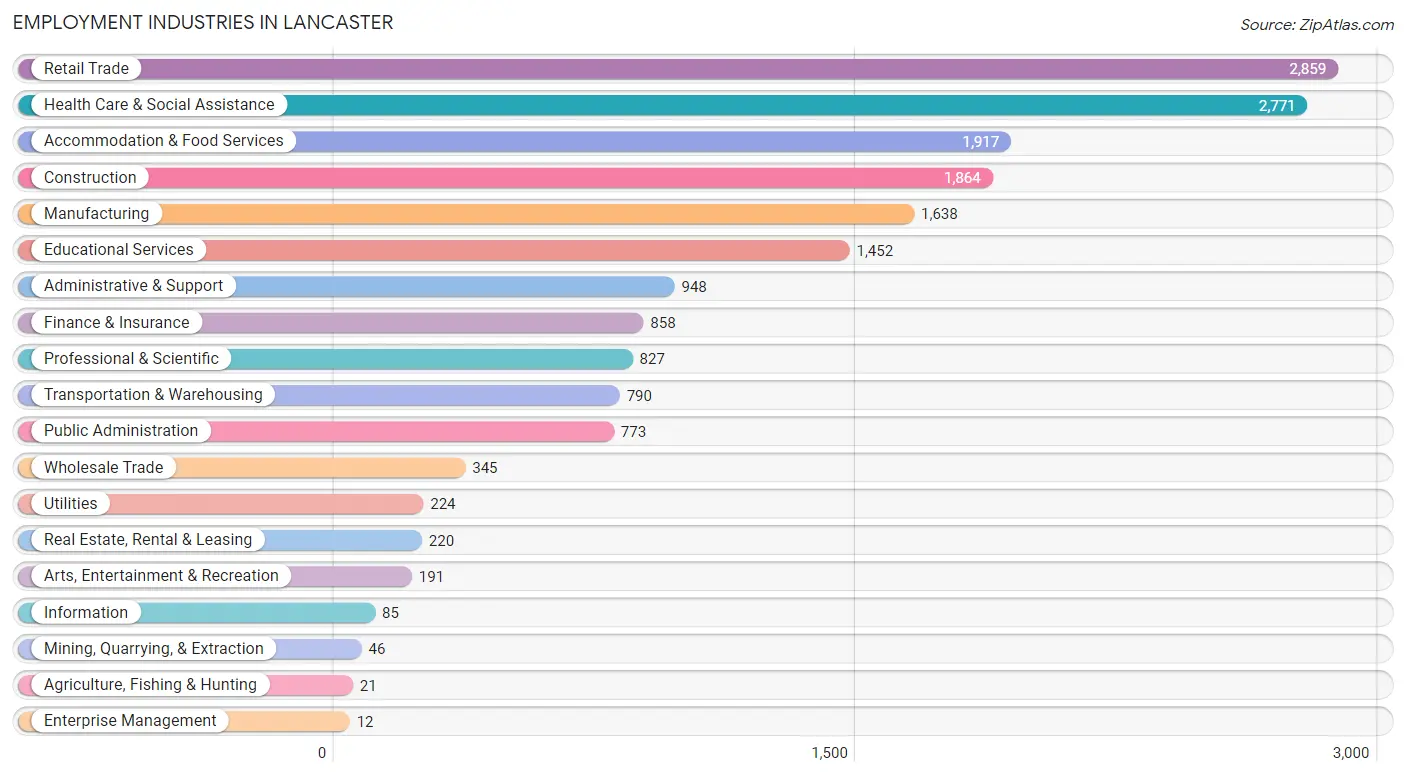
Employment Industries in Lancaster
The major employment industries in Lancaster include Retail Trade (2,859 | 15.4%), Health Care & Social Assistance (2,771 | 14.9%), Accommodation & Food Services (1,917 | 10.3%), Construction (1,864 | 10.0%), and Manufacturing (1,638 | 8.8%).
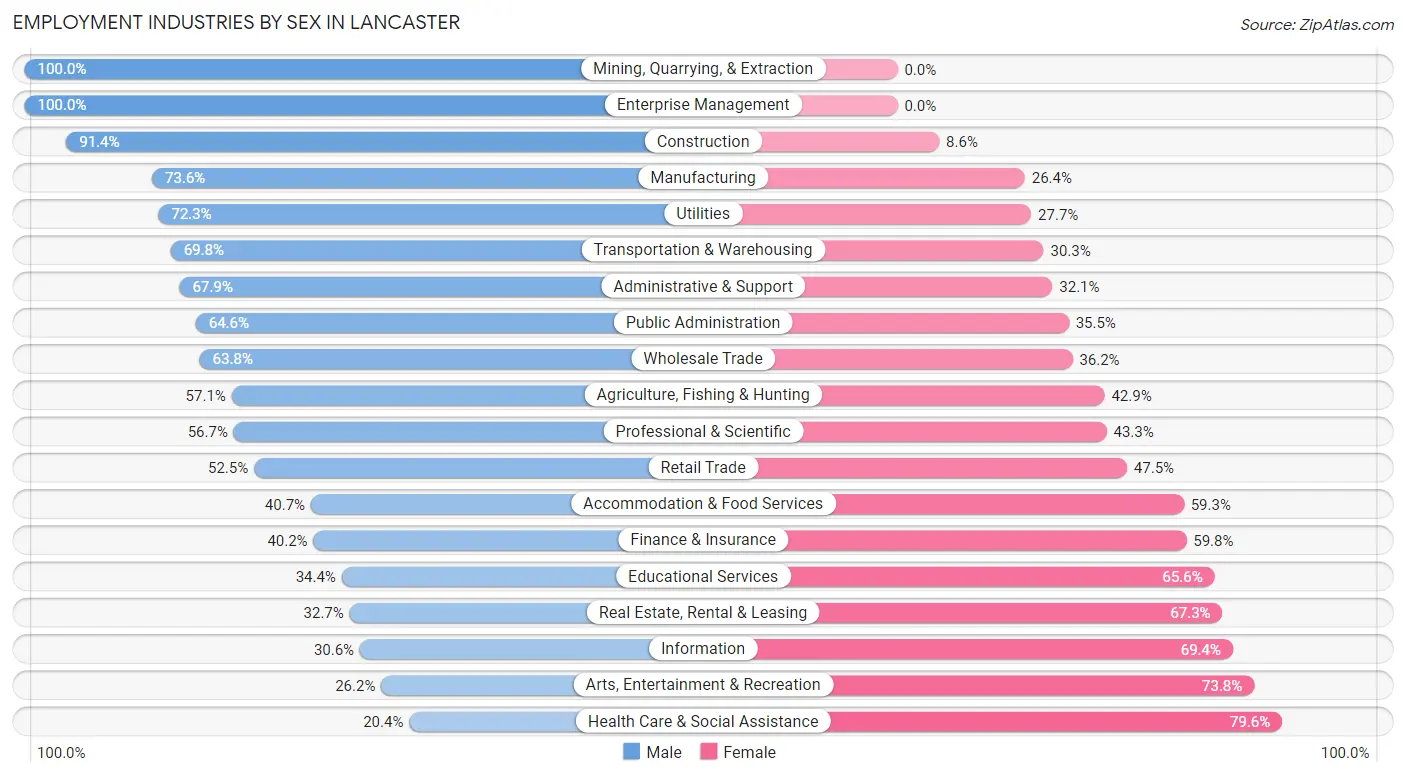
Employment Industries by Sex in Lancaster
The Lancaster industries that see more men than women are Mining, Quarrying, & Extraction (100.0%), Enterprise Management (100.0%), and Construction (91.4%), whereas the industries that tend to have a higher number of women are Health Care & Social Assistance (79.6%), Arts, Entertainment & Recreation (73.8%), and Information (69.4%).
| Industry | Male | Female |
| Agriculture, Fishing & Hunting | 12 (57.1%) | 9 (42.9%) |
| Mining, Quarrying, & Extraction | 46 (100.0%) | 0 (0.0%) |
| Construction | 1,703 (91.4%) | 161 (8.6%) |
| Manufacturing | 1,206 (73.6%) | 432 (26.4%) |
| Wholesale Trade | 220 (63.8%) | 125 (36.2%) |
| Retail Trade | 1,501 (52.5%) | 1,358 (47.5%) |
| Transportation & Warehousing | 551 (69.8%) | 239 (30.2%) |
| Utilities | 162 (72.3%) | 62 (27.7%) |
| Information | 26 (30.6%) | 59 (69.4%) |
| Finance & Insurance | 345 (40.2%) | 513 (59.8%) |
| Real Estate, Rental & Leasing | 72 (32.7%) | 148 (67.3%) |
| Professional & Scientific | 469 (56.7%) | 358 (43.3%) |
| Enterprise Management | 12 (100.0%) | 0 (0.0%) |
| Administrative & Support | 644 (67.9%) | 304 (32.1%) |
| Educational Services | 499 (34.4%) | 953 (65.6%) |
| Health Care & Social Assistance | 565 (20.4%) | 2,206 (79.6%) |
| Arts, Entertainment & Recreation | 50 (26.2%) | 141 (73.8%) |
| Accommodation & Food Services | 781 (40.7%) | 1,136 (59.3%) |
| Public Administration | 499 (64.5%) | 274 (35.4%) |
| Total | 9,764 (52.6%) | 8,794 (47.4%) |
Education in Lancaster
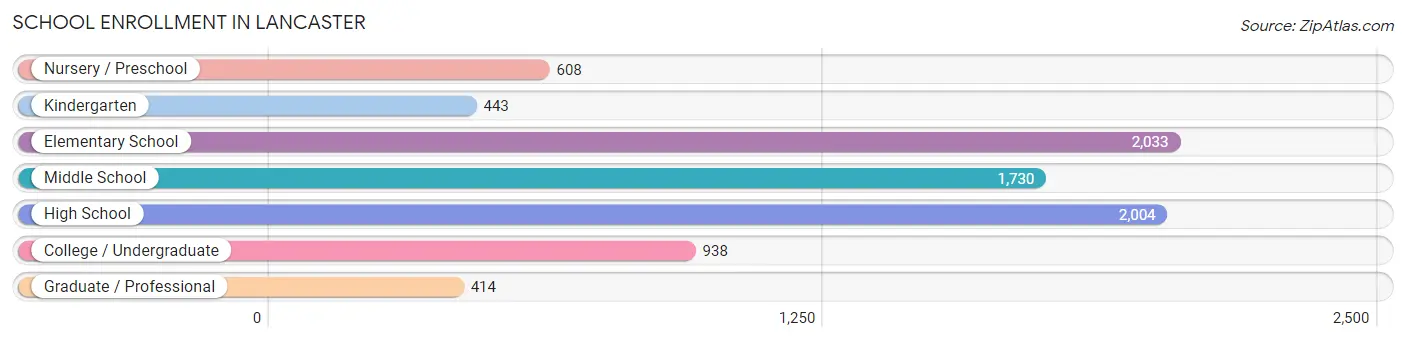
School Enrollment in Lancaster
The most common levels of schooling among the 8,170 students in Lancaster are elementary school (2,033 | 24.9%), high school (2,004 | 24.5%), and middle school (1,730 | 21.2%).
| School Level | # Students | % Students |
| Nursery / Preschool | 608 | 7.4% |
| Kindergarten | 443 | 5.4% |
| Elementary School | 2,033 | 24.9% |
| Middle School | 1,730 | 21.2% |
| High School | 2,004 | 24.5% |
| College / Undergraduate | 938 | 11.5% |
| Graduate / Professional | 414 | 5.1% |
| Total | 8,170 | 100.0% |
School Enrollment by Age by Funding Source in Lancaster
Out of a total of 8,170 students who are enrolled in schools in Lancaster, 1,356 (16.6%) attend a private institution, while the remaining 6,814 (83.4%) are enrolled in public schools. The age group of 3 to 4 year olds has the highest likelihood of being enrolled in private schools, with 161 (49.1% in the age bracket) enrolled. Conversely, the age group of 18 to 19 year olds has the lowest likelihood of being enrolled in a private school, with 410 (92.3% in the age bracket) attending a public institution.
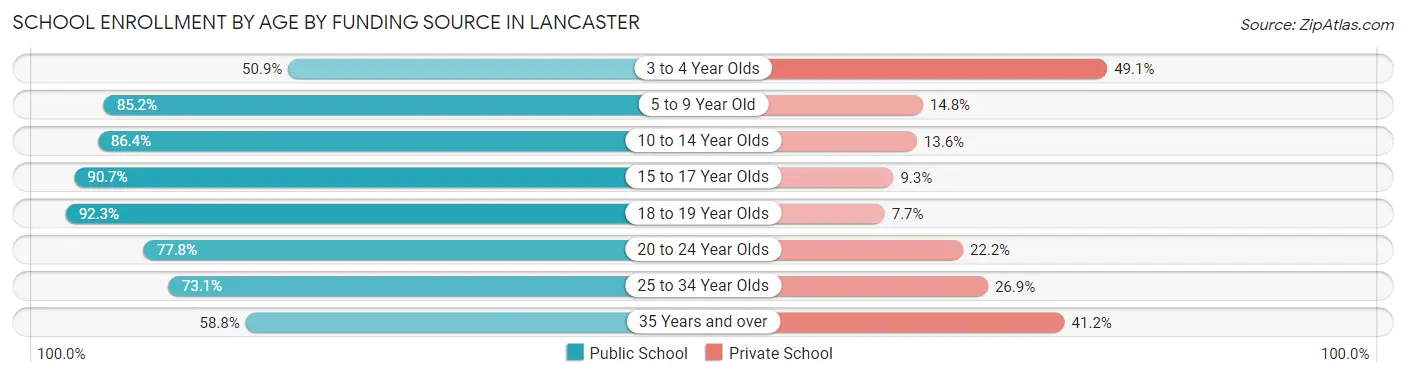
| Age Bracket | Public School | Private School |
| 3 to 4 Year Olds | 167 (50.9%) | 161 (49.1%) |
| 5 to 9 Year Old | 2,085 (85.2%) | 361 (14.8%) |
| 10 to 14 Year Olds | 1,957 (86.4%) | 309 (13.6%) |
| 15 to 17 Year Olds | 1,331 (90.7%) | 136 (9.3%) |
| 18 to 19 Year Olds | 410 (92.3%) | 34 (7.7%) |
| 20 to 24 Year Olds | 357 (77.8%) | 102 (22.2%) |
| 25 to 34 Year Olds | 291 (73.1%) | 107 (26.9%) |
| 35 Years and over | 213 (58.8%) | 149 (41.2%) |
| Total | 6,814 (83.4%) | 1,356 (16.6%) |
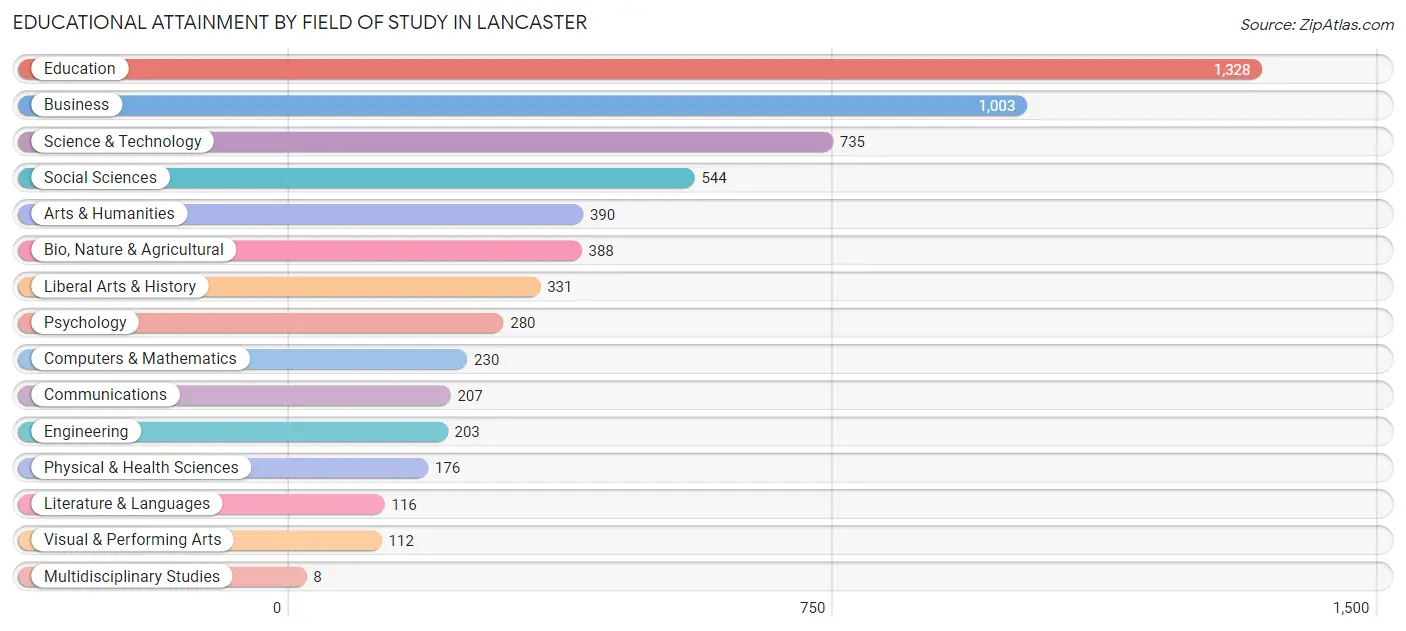
Educational Attainment by Field of Study in Lancaster
Education (1,328 | 22.0%), business (1,003 | 16.6%), science & technology (735 | 12.1%), social sciences (544 | 9.0%), and arts & humanities (390 | 6.5%) are the most common fields of study among 6,051 individuals in Lancaster who have obtained a bachelor's degree or higher.
| Field of Study | # Graduates | % Graduates |
| Computers & Mathematics | 230 | 3.8% |
| Bio, Nature & Agricultural | 388 | 6.4% |
| Physical & Health Sciences | 176 | 2.9% |
| Psychology | 280 | 4.6% |
| Social Sciences | 544 | 9.0% |
| Engineering | 203 | 3.4% |
| Multidisciplinary Studies | 8 | 0.1% |
| Science & Technology | 735 | 12.1% |
| Business | 1,003 | 16.6% |
| Education | 1,328 | 22.0% |
| Literature & Languages | 116 | 1.9% |
| Liberal Arts & History | 331 | 5.5% |
| Visual & Performing Arts | 112 | 1.8% |
| Communications | 207 | 3.4% |
| Arts & Humanities | 390 | 6.5% |
| Total | 6,051 | 100.0% |
Transportation & Commute in Lancaster
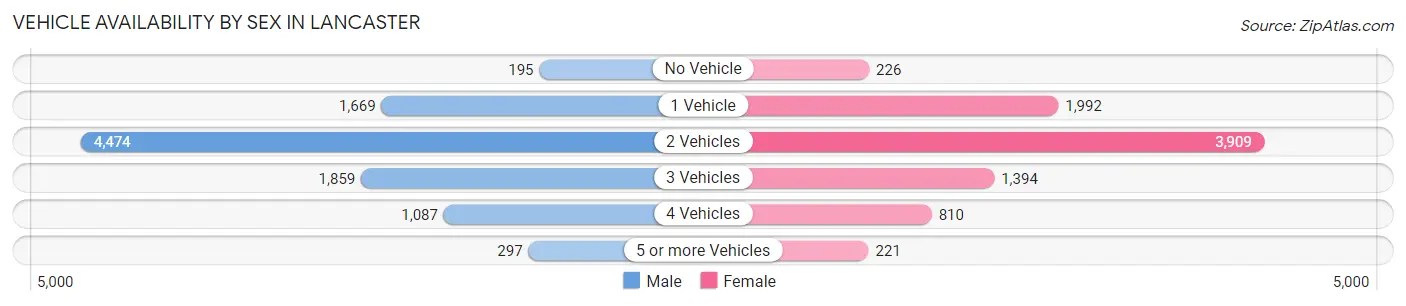
Vehicle Availability by Sex in Lancaster
The most prevalent vehicle ownership categories in Lancaster are males with 2 vehicles (4,474, accounting for 46.7%) and females with 2 vehicles (3,909, making up 52.3%).
| Vehicles Available | Male | Female |
| No Vehicle | 195 (2.0%) | 226 (2.6%) |
| 1 Vehicle | 1,669 (17.4%) | 1,992 (23.3%) |
| 2 Vehicles | 4,474 (46.7%) | 3,909 (45.7%) |
| 3 Vehicles | 1,859 (19.4%) | 1,394 (16.3%) |
| 4 Vehicles | 1,087 (11.4%) | 810 (9.5%) |
| 5 or more Vehicles | 297 (3.1%) | 221 (2.6%) |
| Total | 9,581 (100.0%) | 8,552 (100.0%) |
Commute Time in Lancaster
The most frequently occuring commute durations in Lancaster are 5 to 9 minutes (2,771 commuters, 16.3%), 10 to 14 minutes (2,368 commuters, 13.9%), and 45 to 59 minutes (1,904 commuters, 11.2%).
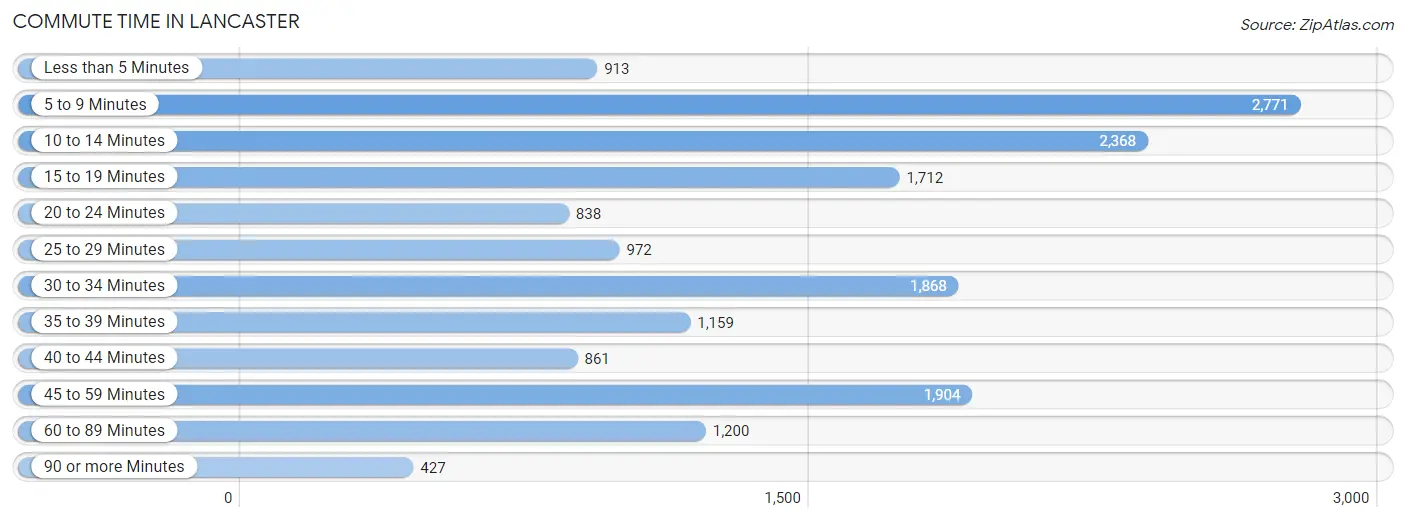
| Commute Time | # Commuters | % Commuters |
| Less than 5 Minutes | 913 | 5.4% |
| 5 to 9 Minutes | 2,771 | 16.3% |
| 10 to 14 Minutes | 2,368 | 13.9% |
| 15 to 19 Minutes | 1,712 | 10.1% |
| 20 to 24 Minutes | 838 | 4.9% |
| 25 to 29 Minutes | 972 | 5.7% |
| 30 to 34 Minutes | 1,868 | 11.0% |
| 35 to 39 Minutes | 1,159 | 6.8% |
| 40 to 44 Minutes | 861 | 5.1% |
| 45 to 59 Minutes | 1,904 | 11.2% |
| 60 to 89 Minutes | 1,200 | 7.1% |
| 90 or more Minutes | 427 | 2.5% |
Commute Time by Sex in Lancaster
The most common commute times in Lancaster are 5 to 9 minutes (1,341 commuters, 14.7%) for males and 5 to 9 minutes (1,430 commuters, 18.1%) for females.
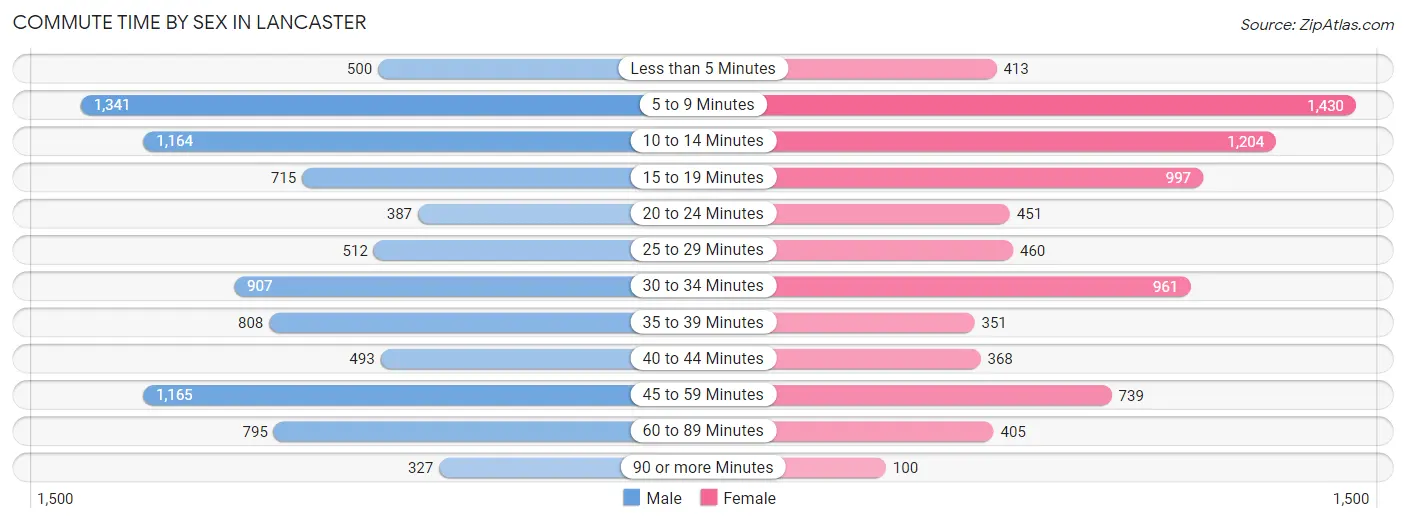
| Commute Time | Male | Female |
| Less than 5 Minutes | 500 (5.5%) | 413 (5.2%) |
| 5 to 9 Minutes | 1,341 (14.7%) | 1,430 (18.1%) |
| 10 to 14 Minutes | 1,164 (12.8%) | 1,204 (15.3%) |
| 15 to 19 Minutes | 715 (7.9%) | 997 (12.7%) |
| 20 to 24 Minutes | 387 (4.3%) | 451 (5.7%) |
| 25 to 29 Minutes | 512 (5.6%) | 460 (5.8%) |
| 30 to 34 Minutes | 907 (10.0%) | 961 (12.2%) |
| 35 to 39 Minutes | 808 (8.9%) | 351 (4.4%) |
| 40 to 44 Minutes | 493 (5.4%) | 368 (4.7%) |
| 45 to 59 Minutes | 1,165 (12.8%) | 739 (9.4%) |
| 60 to 89 Minutes | 795 (8.7%) | 405 (5.1%) |
| 90 or more Minutes | 327 (3.6%) | 100 (1.3%) |
Time of Departure to Work by Sex in Lancaster
The most frequent times of departure to work in Lancaster are 6:30 AM to 6:59 AM (1,113, 12.2%) for males and 7:00 AM to 7:29 AM (1,180, 15.0%) for females.
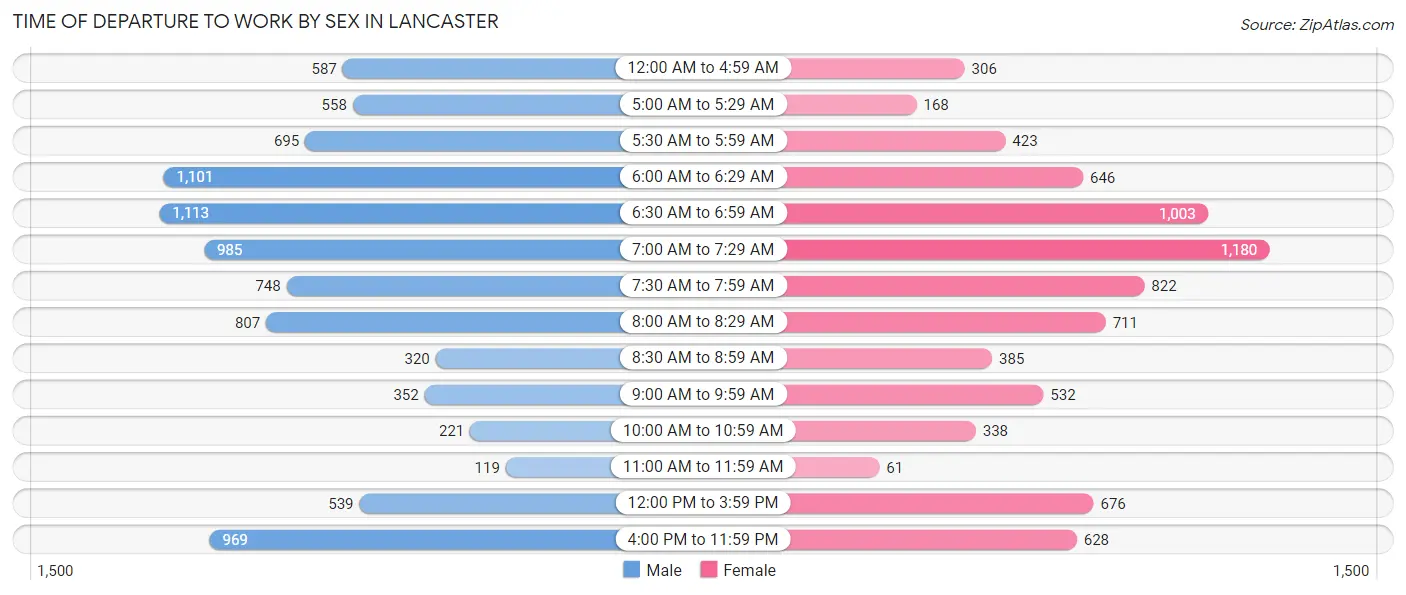
| Time of Departure | Male | Female |
| 12:00 AM to 4:59 AM | 587 (6.4%) | 306 (3.9%) |
| 5:00 AM to 5:29 AM | 558 (6.1%) | 168 (2.1%) |
| 5:30 AM to 5:59 AM | 695 (7.6%) | 423 (5.4%) |
| 6:00 AM to 6:29 AM | 1,101 (12.1%) | 646 (8.2%) |
| 6:30 AM to 6:59 AM | 1,113 (12.2%) | 1,003 (12.7%) |
| 7:00 AM to 7:29 AM | 985 (10.8%) | 1,180 (15.0%) |
| 7:30 AM to 7:59 AM | 748 (8.2%) | 822 (10.4%) |
| 8:00 AM to 8:29 AM | 807 (8.8%) | 711 (9.0%) |
| 8:30 AM to 8:59 AM | 320 (3.5%) | 385 (4.9%) |
| 9:00 AM to 9:59 AM | 352 (3.9%) | 532 (6.8%) |
| 10:00 AM to 10:59 AM | 221 (2.4%) | 338 (4.3%) |
| 11:00 AM to 11:59 AM | 119 (1.3%) | 61 (0.8%) |
| 12:00 PM to 3:59 PM | 539 (5.9%) | 676 (8.6%) |
| 4:00 PM to 11:59 PM | 969 (10.6%) | 628 (8.0%) |
| Total | 9,114 (100.0%) | 7,879 (100.0%) |
Housing Occupancy in Lancaster
Occupancy by Ownership in Lancaster
Of the total 16,794 dwellings in Lancaster, owner-occupied units account for 9,644 (57.4%), while renter-occupied units make up 7,150 (42.6%).
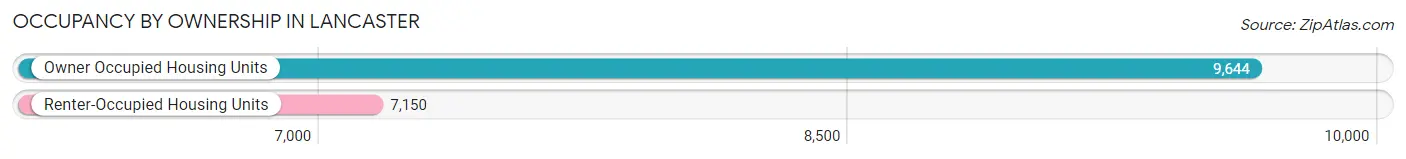
| Occupancy | # Housing Units | % Housing Units |
| Owner Occupied Housing Units | 9,644 | 57.4% |
| Renter-Occupied Housing Units | 7,150 | 42.6% |
| Total Occupied Housing Units | 16,794 | 100.0% |
Occupancy by Household Size in Lancaster
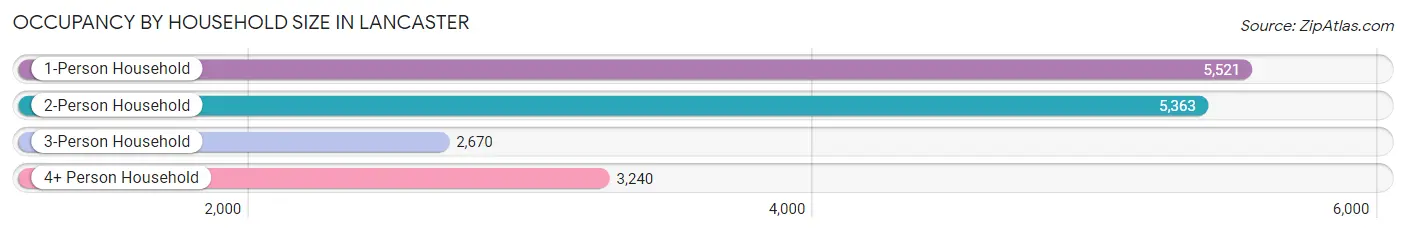
| Household Size | # Housing Units | % Housing Units |
| 1-Person Household | 5,521 | 32.9% |
| 2-Person Household | 5,363 | 31.9% |
| 3-Person Household | 2,670 | 15.9% |
| 4+ Person Household | 3,240 | 19.3% |
| Total Housing Units | 16,794 | 100.0% |
Occupancy by Ownership by Household Size in Lancaster
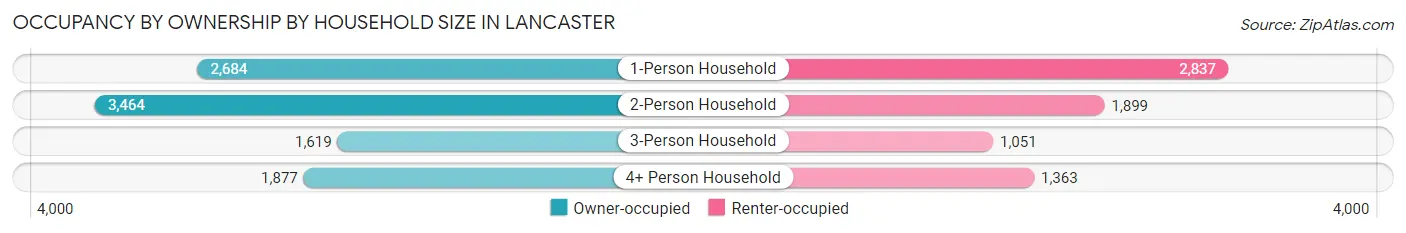
| Household Size | Owner-occupied | Renter-occupied |
| 1-Person Household | 2,684 (48.6%) | 2,837 (51.4%) |
| 2-Person Household | 3,464 (64.6%) | 1,899 (35.4%) |
| 3-Person Household | 1,619 (60.6%) | 1,051 (39.4%) |
| 4+ Person Household | 1,877 (57.9%) | 1,363 (42.1%) |
| Total Housing Units | 9,644 (57.4%) | 7,150 (42.6%) |
Occupancy by Educational Attainment in Lancaster
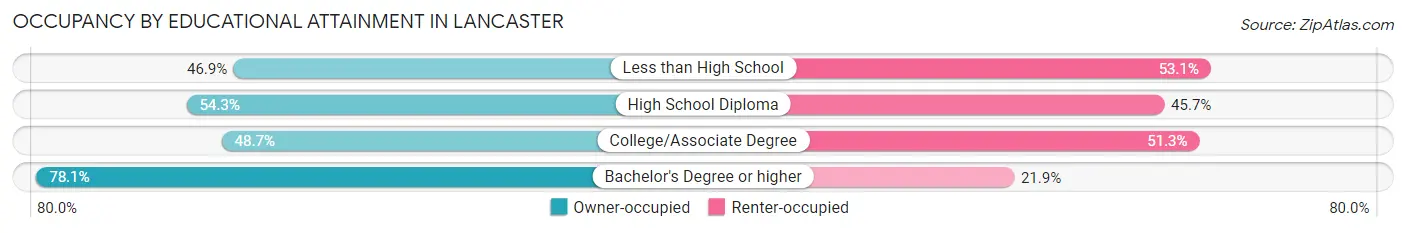
| Household Size | Owner-occupied | Renter-occupied |
| Less than High School | 605 (46.9%) | 684 (53.1%) |
| High School Diploma | 3,727 (54.3%) | 3,134 (45.7%) |
| College/Associate Degree | 2,391 (48.7%) | 2,515 (51.3%) |
| Bachelor's Degree or higher | 2,921 (78.1%) | 817 (21.9%) |
Occupancy by Age of Householder in Lancaster
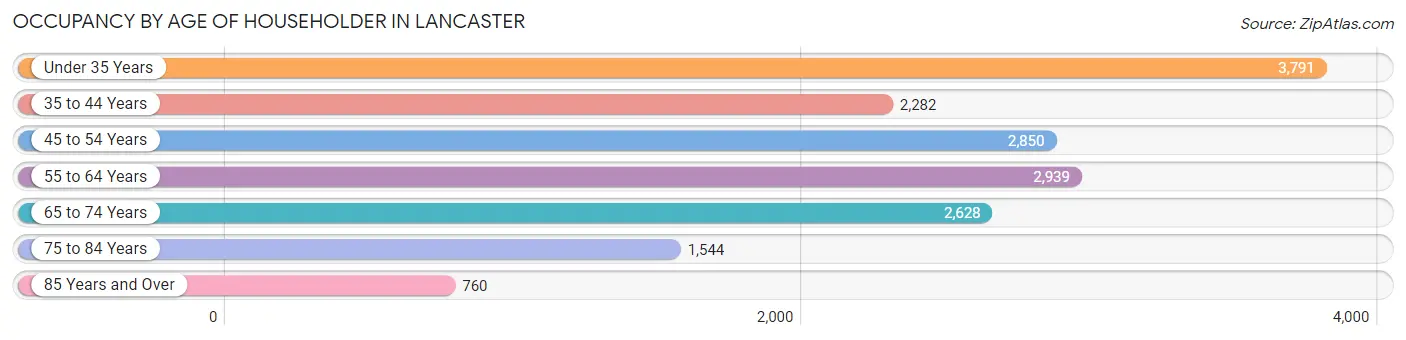
| Age Bracket | # Households | % Households |
| Under 35 Years | 3,791 | 22.6% |
| 35 to 44 Years | 2,282 | 13.6% |
| 45 to 54 Years | 2,850 | 17.0% |
| 55 to 64 Years | 2,939 | 17.5% |
| 65 to 74 Years | 2,628 | 15.7% |
| 75 to 84 Years | 1,544 | 9.2% |
| 85 Years and Over | 760 | 4.5% |
| Total | 16,794 | 100.0% |
Housing Finances in Lancaster
Median Income by Occupancy in Lancaster
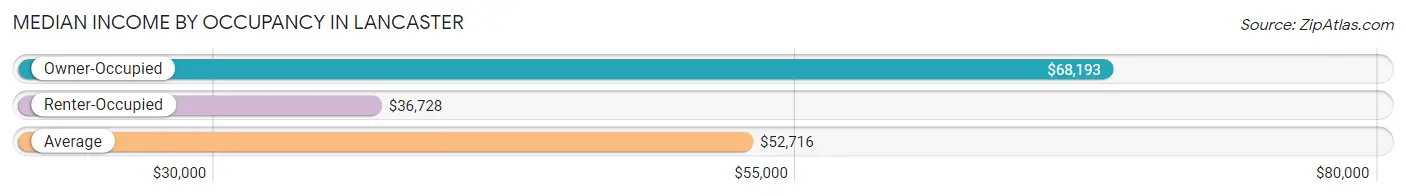
| Occupancy Type | # Households | Median Income |
| Owner-Occupied | 9,644 (57.4%) | $68,193 |
| Renter-Occupied | 7,150 (42.6%) | $36,728 |
| Average | 16,794 (100.0%) | $52,716 |
Occupancy by Householder Income Bracket in Lancaster
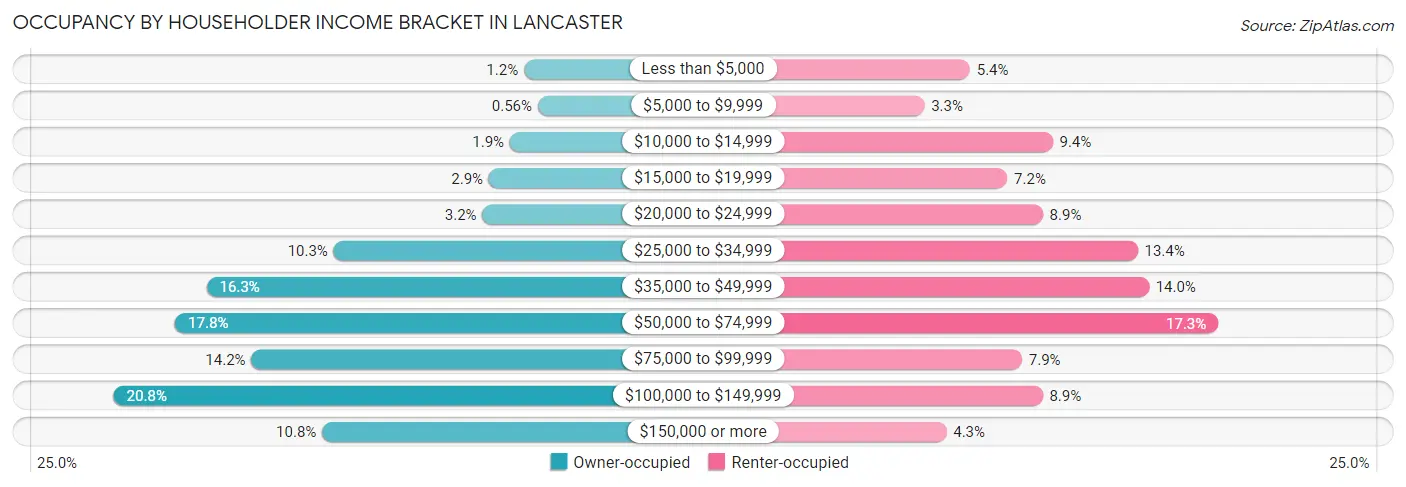
| Income Bracket | Owner-occupied | Renter-occupied |
| Less than $5,000 | 118 (1.2%) | 389 (5.4%) |
| $5,000 to $9,999 | 54 (0.6%) | 234 (3.3%) |
| $10,000 to $14,999 | 182 (1.9%) | 671 (9.4%) |
| $15,000 to $19,999 | 279 (2.9%) | 516 (7.2%) |
| $20,000 to $24,999 | 309 (3.2%) | 637 (8.9%) |
| $25,000 to $34,999 | 991 (10.3%) | 960 (13.4%) |
| $35,000 to $49,999 | 1,576 (16.3%) | 998 (14.0%) |
| $50,000 to $74,999 | 1,720 (17.8%) | 1,234 (17.3%) |
| $75,000 to $99,999 | 1,369 (14.2%) | 566 (7.9%) |
| $100,000 to $149,999 | 2,002 (20.8%) | 636 (8.9%) |
| $150,000 or more | 1,044 (10.8%) | 309 (4.3%) |
| Total | 9,644 (100.0%) | 7,150 (100.0%) |
Monthly Housing Cost Tiers in Lancaster
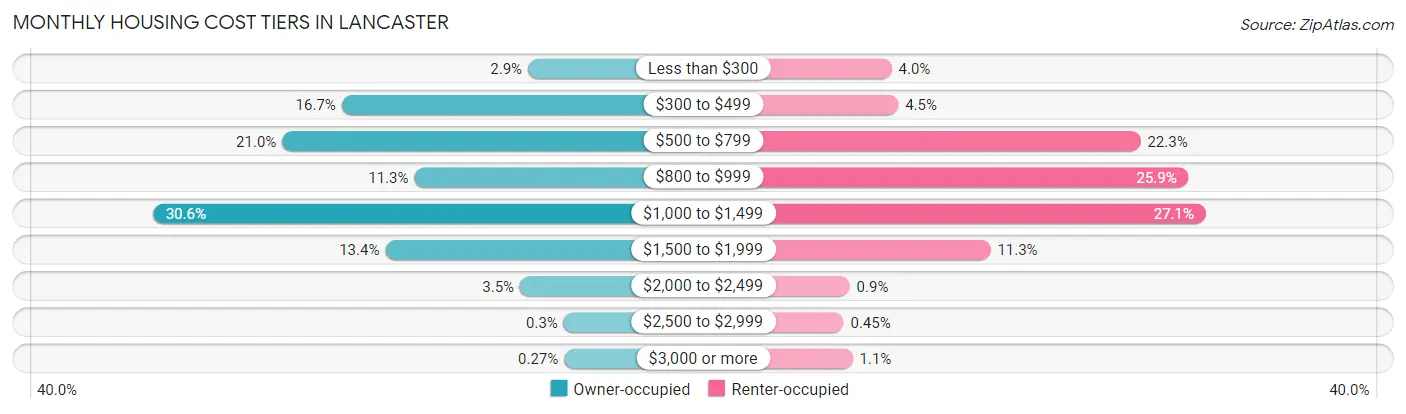
| Monthly Cost | Owner-occupied | Renter-occupied |
| Less than $300 | 283 (2.9%) | 285 (4.0%) |
| $300 to $499 | 1,606 (16.7%) | 320 (4.5%) |
| $500 to $799 | 2,028 (21.0%) | 1,596 (22.3%) |
| $800 to $999 | 1,090 (11.3%) | 1,849 (25.9%) |
| $1,000 to $1,499 | 2,947 (30.6%) | 1,940 (27.1%) |
| $1,500 to $1,999 | 1,296 (13.4%) | 806 (11.3%) |
| $2,000 to $2,499 | 339 (3.5%) | 64 (0.9%) |
| $2,500 to $2,999 | 29 (0.3%) | 32 (0.4%) |
| $3,000 or more | 26 (0.3%) | 80 (1.1%) |
| Total | 9,644 (100.0%) | 7,150 (100.0%) |
Physical Housing Characteristics in Lancaster
Housing Structures in Lancaster
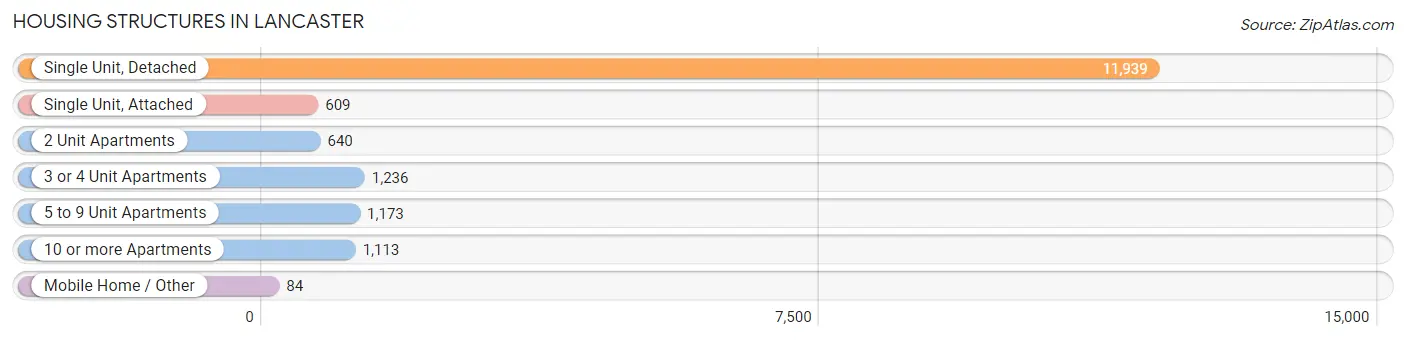
| Structure Type | # Housing Units | % Housing Units |
| Single Unit, Detached | 11,939 | 71.1% |
| Single Unit, Attached | 609 | 3.6% |
| 2 Unit Apartments | 640 | 3.8% |
| 3 or 4 Unit Apartments | 1,236 | 7.4% |
| 5 to 9 Unit Apartments | 1,173 | 7.0% |
| 10 or more Apartments | 1,113 | 6.6% |
| Mobile Home / Other | 84 | 0.5% |
| Total | 16,794 | 100.0% |
Housing Structures by Occupancy in Lancaster
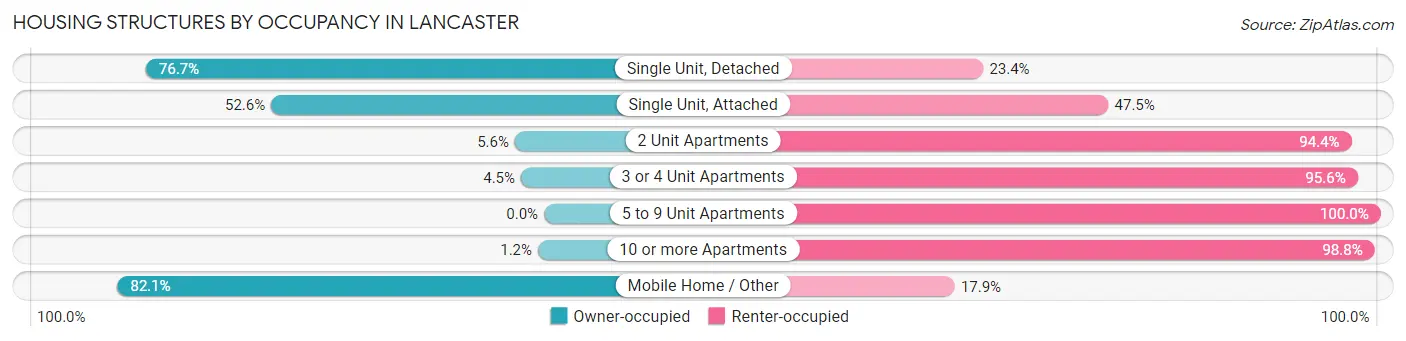
| Structure Type | Owner-occupied | Renter-occupied |
| Single Unit, Detached | 9,151 (76.6%) | 2,788 (23.4%) |
| Single Unit, Attached | 320 (52.5%) | 289 (47.4%) |
| 2 Unit Apartments | 36 (5.6%) | 604 (94.4%) |
| 3 or 4 Unit Apartments | 55 (4.4%) | 1,181 (95.6%) |
| 5 to 9 Unit Apartments | 0 (0.0%) | 1,173 (100.0%) |
| 10 or more Apartments | 13 (1.2%) | 1,100 (98.8%) |
| Mobile Home / Other | 69 (82.1%) | 15 (17.9%) |
| Total | 9,644 (57.4%) | 7,150 (42.6%) |
Housing Structures by Number of Rooms in Lancaster
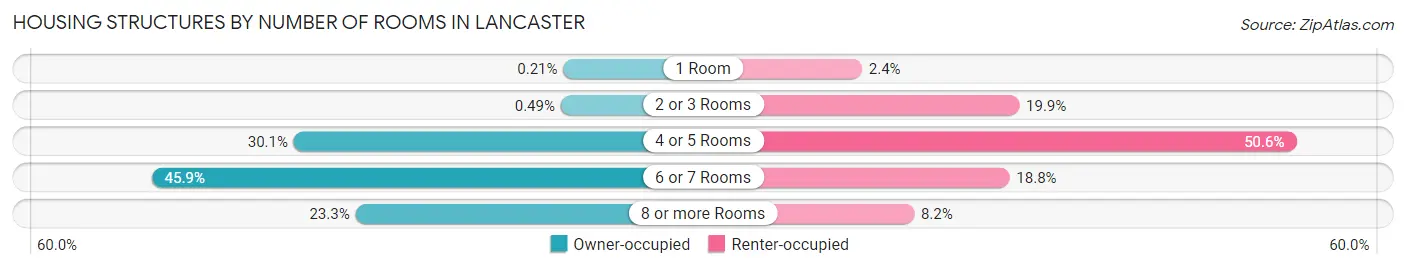
| Number of Rooms | Owner-occupied | Renter-occupied |
| 1 Room | 20 (0.2%) | 174 (2.4%) |
| 2 or 3 Rooms | 47 (0.5%) | 1,422 (19.9%) |
| 4 or 5 Rooms | 2,905 (30.1%) | 3,621 (50.6%) |
| 6 or 7 Rooms | 4,427 (45.9%) | 1,345 (18.8%) |
| 8 or more Rooms | 2,245 (23.3%) | 588 (8.2%) |
| Total | 9,644 (100.0%) | 7,150 (100.0%) |
Housing Structure by Heating Type in Lancaster
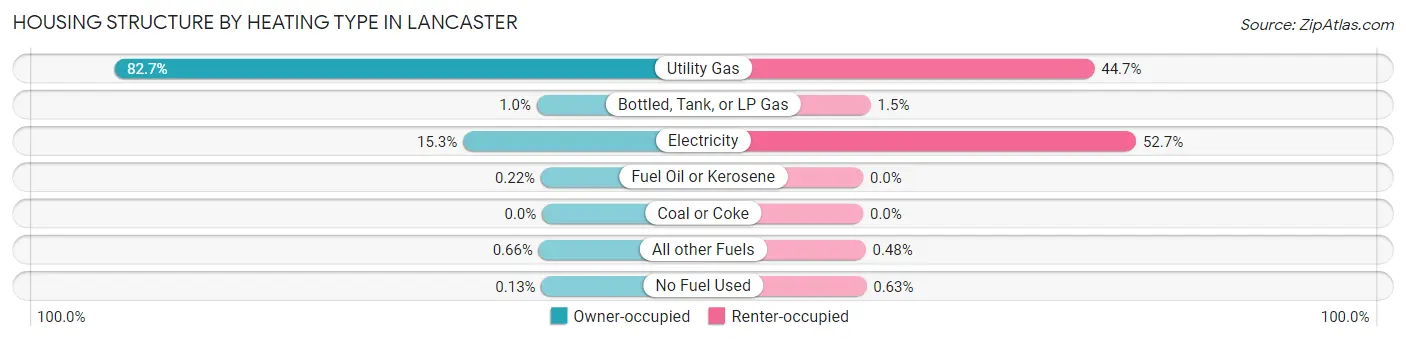
| Heating Type | Owner-occupied | Renter-occupied |
| Utility Gas | 7,975 (82.7%) | 3,195 (44.7%) |
| Bottled, Tank, or LP Gas | 98 (1.0%) | 105 (1.5%) |
| Electricity | 1,473 (15.3%) | 3,771 (52.7%) |
| Fuel Oil or Kerosene | 21 (0.2%) | 0 (0.0%) |
| Coal or Coke | 0 (0.0%) | 0 (0.0%) |
| All other Fuels | 64 (0.7%) | 34 (0.5%) |
| No Fuel Used | 13 (0.1%) | 45 (0.6%) |
| Total | 9,644 (100.0%) | 7,150 (100.0%) |
Household Vehicle Usage in Lancaster
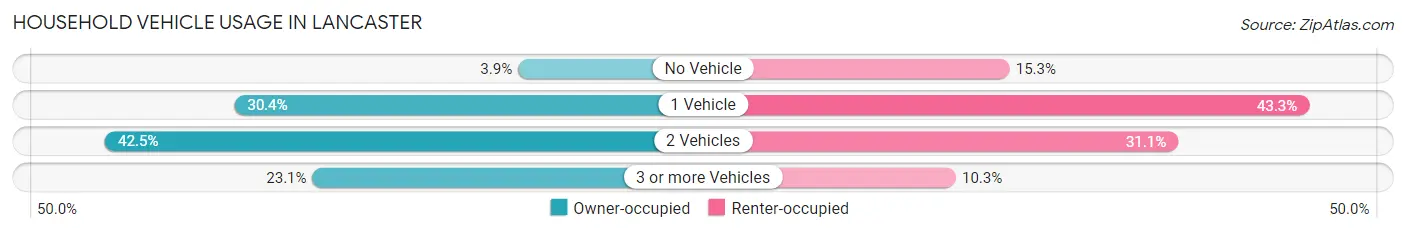
| Vehicles per Household | Owner-occupied | Renter-occupied |
| No Vehicle | 380 (3.9%) | 1,094 (15.3%) |
| 1 Vehicle | 2,934 (30.4%) | 3,098 (43.3%) |
| 2 Vehicles | 4,098 (42.5%) | 2,223 (31.1%) |
| 3 or more Vehicles | 2,232 (23.1%) | 735 (10.3%) |
| Total | 9,644 (100.0%) | 7,150 (100.0%) |
Real Estate & Mortgages in Lancaster
Real Estate and Mortgage Overview in Lancaster
| Characteristic | Without Mortgage | With Mortgage |
| Housing Units | 3,380 | 6,264 |
| Median Property Value | $148,300 | $169,400 |
| Median Household Income | $52,885 | $847 |
| Monthly Housing Costs | $487 | $26 |
| Real Estate Taxes | $1,503 | $58 |
Property Value by Mortgage Status in Lancaster
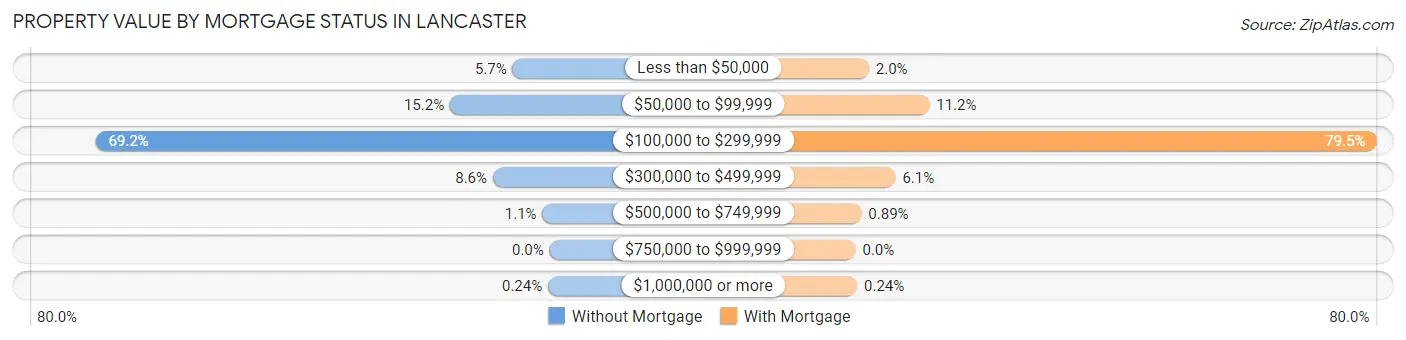
| Property Value | Without Mortgage | With Mortgage |
| Less than $50,000 | 191 (5.7%) | 127 (2.0%) |
| $50,000 to $99,999 | 513 (15.2%) | 704 (11.2%) |
| $100,000 to $299,999 | 2,339 (69.2%) | 4,981 (79.5%) |
| $300,000 to $499,999 | 292 (8.6%) | 381 (6.1%) |
| $500,000 to $749,999 | 37 (1.1%) | 56 (0.9%) |
| $750,000 to $999,999 | 0 (0.0%) | 0 (0.0%) |
| $1,000,000 or more | 8 (0.2%) | 15 (0.2%) |
| Total | 3,380 (100.0%) | 6,264 (100.0%) |
Household Income by Mortgage Status in Lancaster
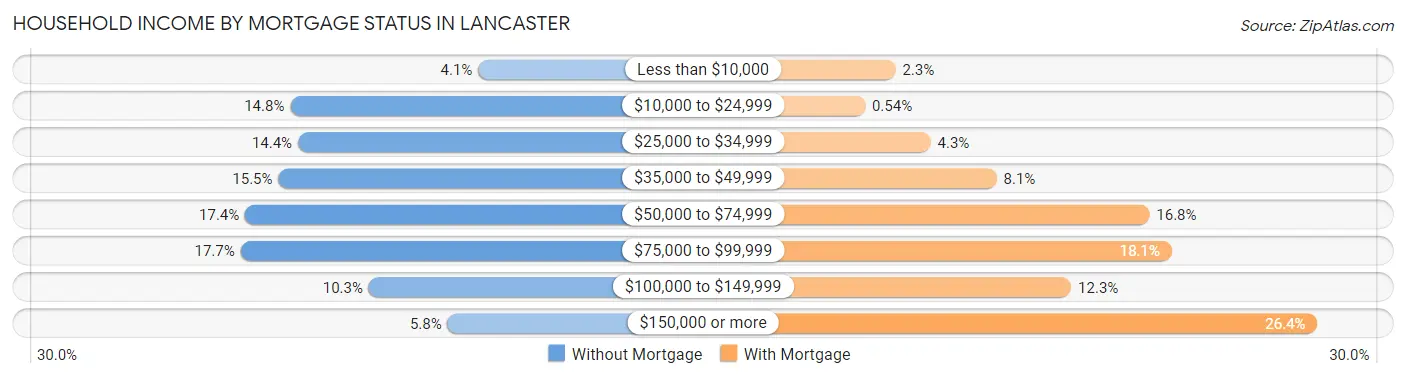
| Household Income | Without Mortgage | With Mortgage |
| Less than $10,000 | 138 (4.1%) | 143 (2.3%) |
| $10,000 to $24,999 | 501 (14.8%) | 34 (0.5%) |
| $25,000 to $34,999 | 486 (14.4%) | 269 (4.3%) |
| $35,000 to $49,999 | 524 (15.5%) | 505 (8.1%) |
| $50,000 to $74,999 | 588 (17.4%) | 1,052 (16.8%) |
| $75,000 to $99,999 | 597 (17.7%) | 1,132 (18.1%) |
| $100,000 to $149,999 | 349 (10.3%) | 772 (12.3%) |
| $150,000 or more | 197 (5.8%) | 1,653 (26.4%) |
| Total | 3,380 (100.0%) | 6,264 (100.0%) |
Property Value to Household Income Ratio in Lancaster
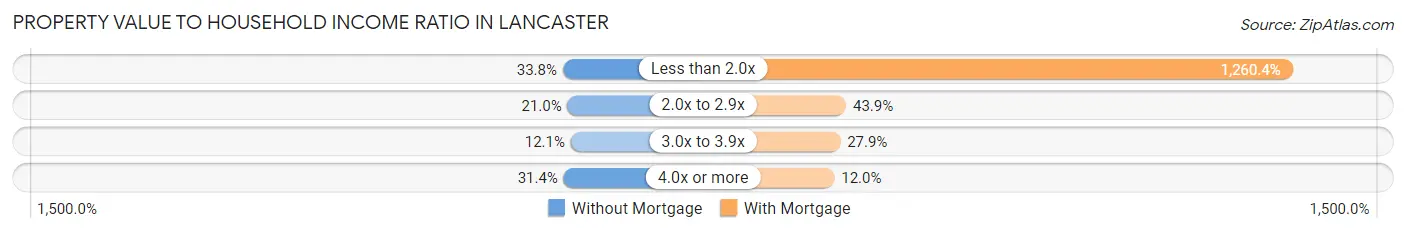
| Value-to-Income Ratio | Without Mortgage | With Mortgage |
| Less than 2.0x | 1,143 (33.8%) | 78,953 (1,260.4%) |
| 2.0x to 2.9x | 708 (20.9%) | 2,750 (43.9%) |
| 3.0x to 3.9x | 410 (12.1%) | 1,750 (27.9%) |
| 4.0x or more | 1,060 (31.4%) | 750 (12.0%) |
| Total | 3,380 (100.0%) | 6,264 (100.0%) |
Real Estate Taxes by Mortgage Status in Lancaster
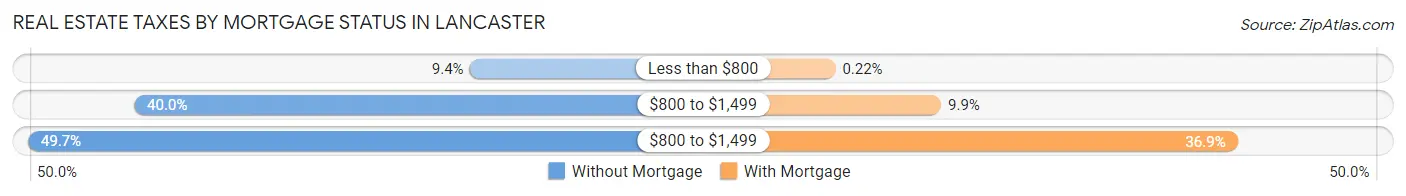
| Property Taxes | Without Mortgage | With Mortgage |
| Less than $800 | 317 (9.4%) | 14 (0.2%) |
| $800 to $1,499 | 1,352 (40.0%) | 618 (9.9%) |
| $800 to $1,499 | 1,680 (49.7%) | 2,313 (36.9%) |
| Total | 3,380 (100.0%) | 6,264 (100.0%) |
Health & Disability in Lancaster
Health Insurance Coverage by Age in Lancaster
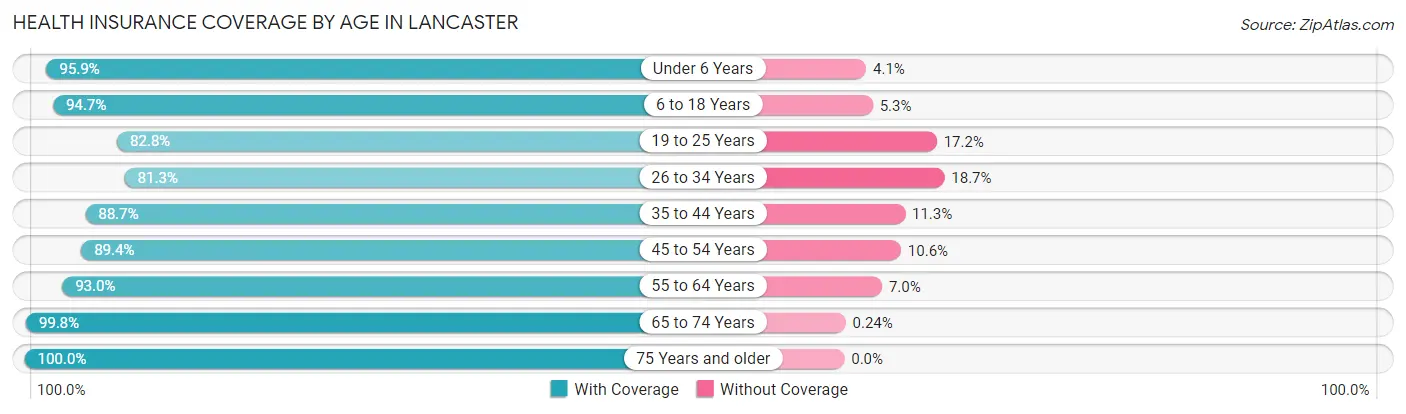
| Age Bracket | With Coverage | Without Coverage |
| Under 6 Years | 3,108 (95.9%) | 132 (4.1%) |
| 6 to 18 Years | 5,880 (94.7%) | 329 (5.3%) |
| 19 to 25 Years | 3,219 (82.8%) | 670 (17.2%) |
| 26 to 34 Years | 4,011 (81.3%) | 920 (18.7%) |
| 35 to 44 Years | 4,281 (88.7%) | 547 (11.3%) |
| 45 to 54 Years | 4,285 (89.4%) | 506 (10.6%) |
| 55 to 64 Years | 4,450 (93.0%) | 336 (7.0%) |
| 65 to 74 Years | 3,666 (99.8%) | 9 (0.2%) |
| 75 Years and older | 3,284 (100.0%) | 0 (0.0%) |
| Total | 36,184 (91.3%) | 3,449 (8.7%) |
Health Insurance Coverage by Citizenship Status in Lancaster
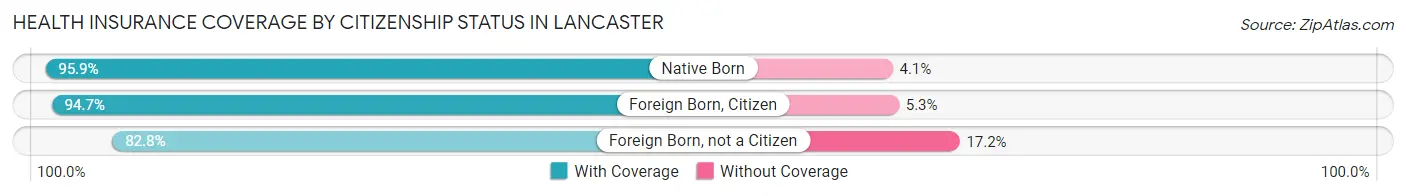
| Citizenship Status | With Coverage | Without Coverage |
| Native Born | 3,108 (95.9%) | 132 (4.1%) |
| Foreign Born, Citizen | 5,880 (94.7%) | 329 (5.3%) |
| Foreign Born, not a Citizen | 3,219 (82.8%) | 670 (17.2%) |
Health Insurance Coverage by Household Income in Lancaster
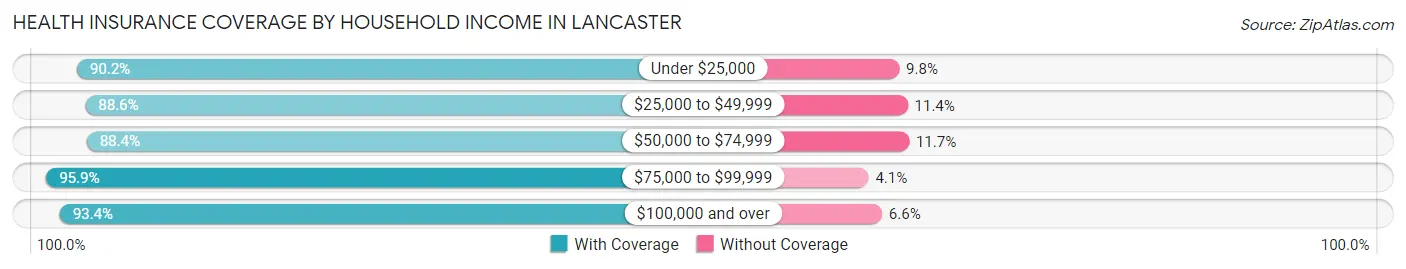
| Household Income | With Coverage | Without Coverage |
| Under $25,000 | 5,036 (90.2%) | 548 (9.8%) |
| $25,000 to $49,999 | 8,290 (88.6%) | 1,066 (11.4%) |
| $50,000 to $74,999 | 5,786 (88.3%) | 763 (11.7%) |
| $75,000 to $99,999 | 5,243 (95.9%) | 222 (4.1%) |
| $100,000 and over | 11,712 (93.4%) | 825 (6.6%) |
Public vs Private Health Insurance Coverage by Age in Lancaster
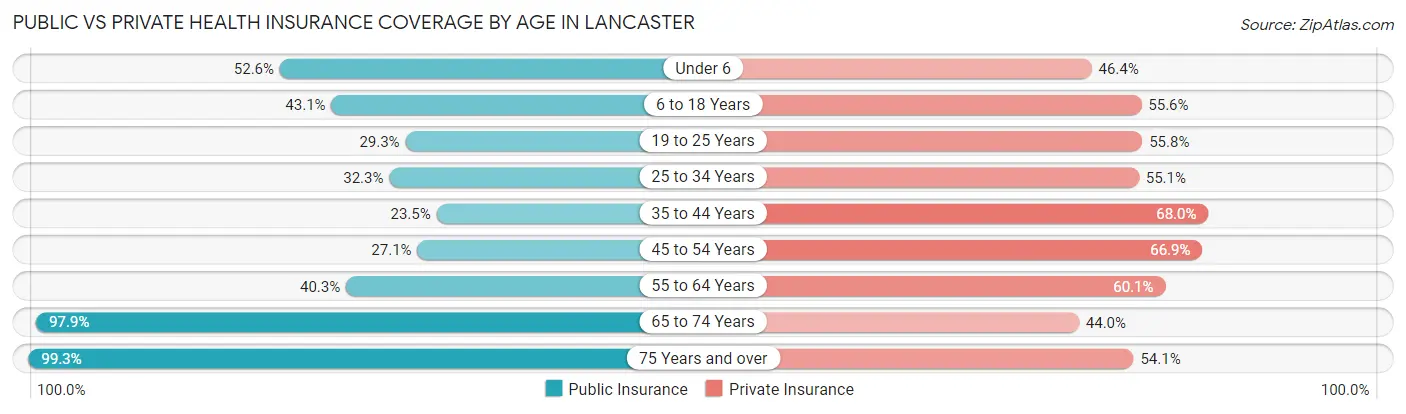
| Age Bracket | Public Insurance | Private Insurance |
| Under 6 | 1,705 (52.6%) | 1,502 (46.4%) |
| 6 to 18 Years | 2,673 (43.0%) | 3,452 (55.6%) |
| 19 to 25 Years | 1,140 (29.3%) | 2,169 (55.8%) |
| 25 to 34 Years | 1,593 (32.3%) | 2,718 (55.1%) |
| 35 to 44 Years | 1,136 (23.5%) | 3,284 (68.0%) |
| 45 to 54 Years | 1,298 (27.1%) | 3,206 (66.9%) |
| 55 to 64 Years | 1,930 (40.3%) | 2,874 (60.1%) |
| 65 to 74 Years | 3,597 (97.9%) | 1,617 (44.0%) |
| 75 Years and over | 3,261 (99.3%) | 1,778 (54.1%) |
| Total | 18,333 (46.3%) | 22,600 (57.0%) |
Disability Status by Sex by Age in Lancaster
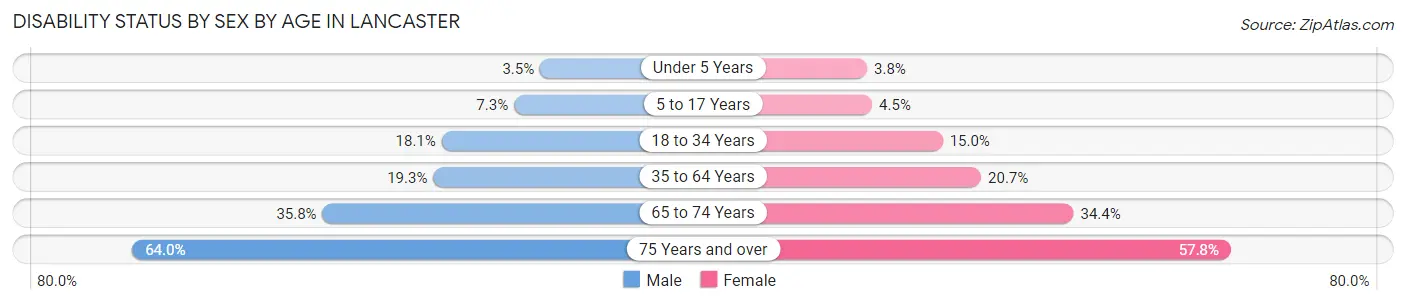
| Age Bracket | Male | Female |
| Under 5 Years | 38 (3.5%) | 55 (3.8%) |
| 5 to 17 Years | 235 (7.3%) | 147 (4.5%) |
| 18 to 34 Years | 838 (18.1%) | 690 (15.0%) |
| 35 to 64 Years | 1,446 (19.3%) | 1,432 (20.7%) |
| 65 to 74 Years | 587 (35.8%) | 700 (34.4%) |
| 75 Years and over | 788 (64.0%) | 1,186 (57.8%) |
Disability Class by Sex by Age in Lancaster
Disability Class: Hearing Difficulty
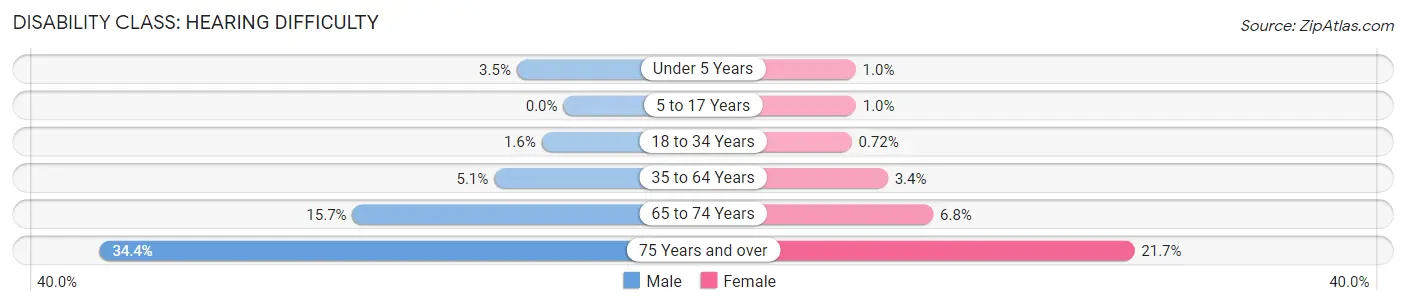
| Age Bracket | Male | Female |
| Under 5 Years | 38 (3.5%) | 15 (1.0%) |
| 5 to 17 Years | 0 (0.0%) | 34 (1.0%) |
| 18 to 34 Years | 75 (1.6%) | 33 (0.7%) |
| 35 to 64 Years | 385 (5.1%) | 236 (3.4%) |
| 65 to 74 Years | 257 (15.7%) | 138 (6.8%) |
| 75 Years and over | 424 (34.4%) | 446 (21.7%) |
Disability Class: Vision Difficulty
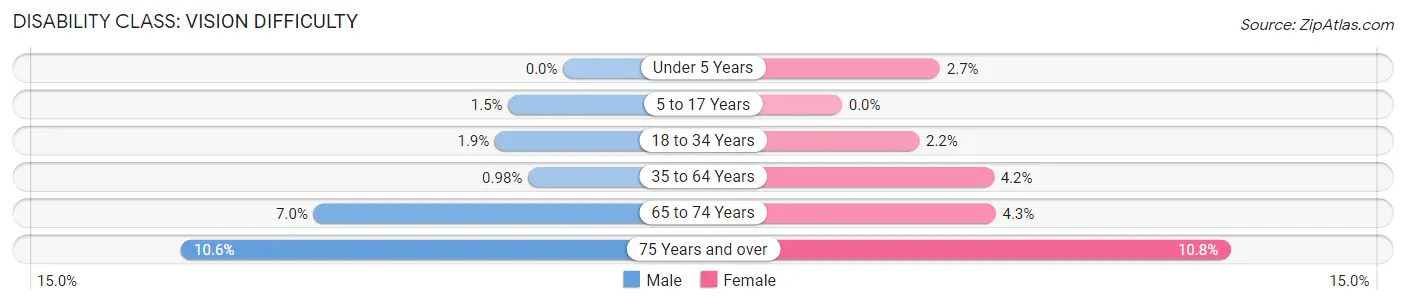
| Age Bracket | Male | Female |
| Under 5 Years | 0 (0.0%) | 40 (2.7%) |
| 5 to 17 Years | 49 (1.5%) | 0 (0.0%) |
| 18 to 34 Years | 88 (1.9%) | 99 (2.1%) |
| 35 to 64 Years | 73 (1.0%) | 293 (4.2%) |
| 65 to 74 Years | 114 (7.0%) | 87 (4.3%) |
| 75 Years and over | 131 (10.6%) | 222 (10.8%) |
Disability Class: Cognitive Difficulty
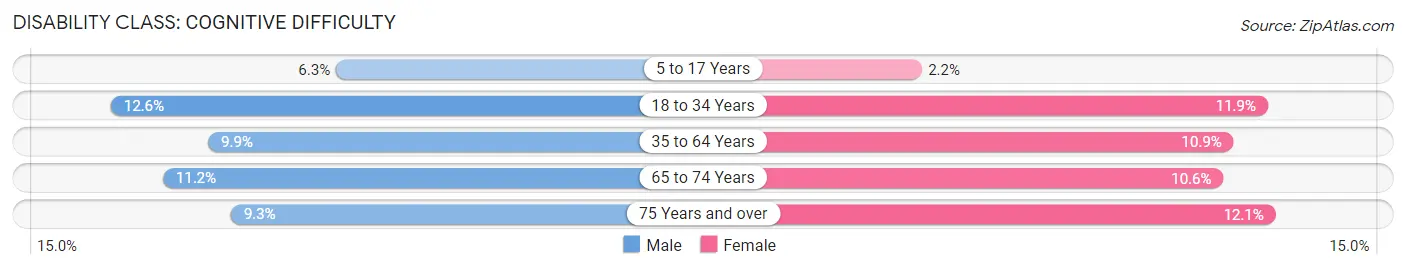
| Age Bracket | Male | Female |
| 5 to 17 Years | 203 (6.3%) | 72 (2.2%) |
| 18 to 34 Years | 584 (12.6%) | 546 (11.9%) |
| 35 to 64 Years | 740 (9.9%) | 755 (10.9%) |
| 65 to 74 Years | 183 (11.2%) | 216 (10.6%) |
| 75 Years and over | 114 (9.3%) | 248 (12.1%) |
Disability Class: Ambulatory Difficulty
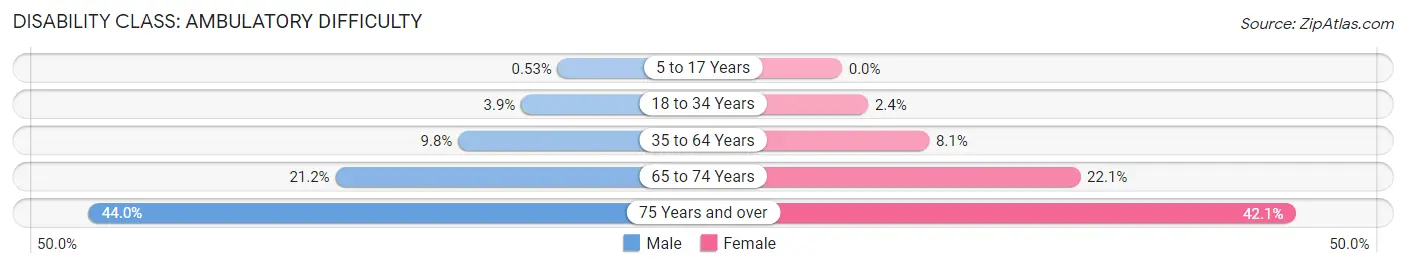
| Age Bracket | Male | Female |
| 5 to 17 Years | 17 (0.5%) | 0 (0.0%) |
| 18 to 34 Years | 181 (3.9%) | 112 (2.4%) |
| 35 to 64 Years | 730 (9.8%) | 560 (8.1%) |
| 65 to 74 Years | 347 (21.1%) | 450 (22.1%) |
| 75 Years and over | 542 (44.0%) | 864 (42.1%) |
Disability Class: Self-Care Difficulty
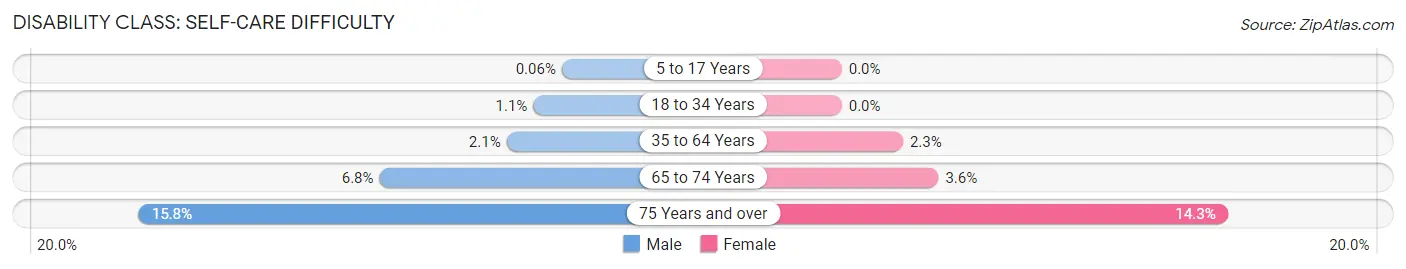
| Age Bracket | Male | Female |
| 5 to 17 Years | 2 (0.1%) | 0 (0.0%) |
| 18 to 34 Years | 52 (1.1%) | 0 (0.0%) |
| 35 to 64 Years | 158 (2.1%) | 157 (2.3%) |
| 65 to 74 Years | 112 (6.8%) | 73 (3.6%) |
| 75 Years and over | 194 (15.8%) | 294 (14.3%) |
Technology Access in Lancaster
Computing Device Access in Lancaster
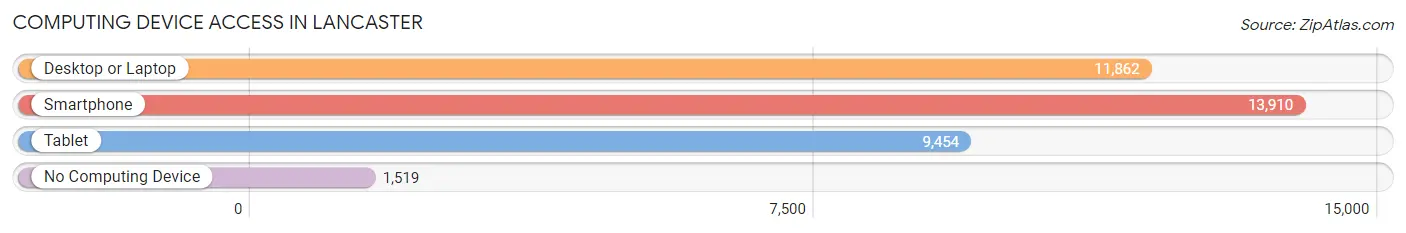
| Device Type | # Households | % Households |
| Desktop or Laptop | 11,862 | 70.6% |
| Smartphone | 13,910 | 82.8% |
| Tablet | 9,454 | 56.3% |
| No Computing Device | 1,519 | 9.0% |
| Total | 16,794 | 100.0% |
Internet Access in Lancaster
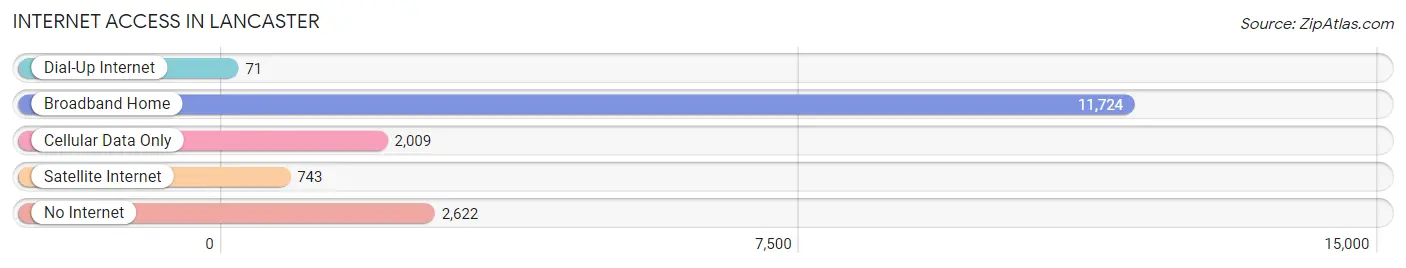
| Internet Type | # Households | % Households |
| Dial-Up Internet | 71 | 0.4% |
| Broadband Home | 11,724 | 69.8% |
| Cellular Data Only | 2,009 | 12.0% |
| Satellite Internet | 743 | 4.4% |
| No Internet | 2,622 | 15.6% |
| Total | 16,794 | 100.0% |
Lancaster Summary
Lancaster, Ohio is a city located in Fairfield County, Ohio, United States. It is the county seat of Fairfield County and is located in the southeastern part of the state. The population was 38,780 at the 2010 census. Lancaster is located approximately 33 miles southeast of Columbus, the state capital.
History
Lancaster was founded in 1810 by Colonel Ebenezer Zane, who had previously founded Zanesville, Ohio. The city was named after Lancaster, Pennsylvania, the hometown of Zane's wife. The city was incorporated in 1831 and became the county seat of Fairfield County in 1833.
In the early 19th century, Lancaster was a major stop on the Underground Railroad, with many fugitive slaves passing through the city on their way to freedom in Canada. The city was also home to the first free public library in the United States, which was established in 1853.
Geography
Lancaster is located at 39°45′N 82°37′W (39.75, -82.62). According to the United States Census Bureau, the city has a total area of 11.2 square miles (29.0 km2), of which 11.1 square miles (28.7 km2) is land and 0.1 square miles (0.3 km2) is water.
Economy
Lancaster is home to several major employers, including Fairfield Medical Center, Lancaster-Fairfield County Chamber of Commerce, and the Ohio University Lancaster Campus. The city is also home to several small businesses, including restaurants, retail stores, and professional services.
Demographics
As of the 2010 census, there were 38,780 people, 15,845 households, and 9,945 families residing in the city. The population density was 3,491.3 people per square mile (1,349.7/km2). There were 17,541 housing units at an average density of 1,578.3 per square mile (608.2/km2). The racial makeup of the city was 87.2% White, 8.3% African American, 0.3% Native American, 1.2% Asian, 0.1% Pacific Islander, 0.7% from other races, and 2.3% from two or more races. Hispanic or Latino of any race were 2.3% of the population.
The median income for a household in the city was $41,945, and the median income for a family was $51,945. Males had a median income of $37,945 versus $27,945 for females. The per capita income for the city was $20,945. About 8.3% of families and 11.2% of the population were below the poverty line, including 15.2% of those under age 18 and 8.3% of those age 65 or over.
Common Questions
What is Per Capita Income in Lancaster?
Per Capita income in Lancaster is $30,252.
What is the Median Family Income in Lancaster?
Median Family Income in Lancaster is $72,500.
What is the Median Household income in Lancaster?
Median Household Income in Lancaster is $52,716.
What is Income or Wage Gap in Lancaster?
Income or Wage Gap in Lancaster is 22.1%.
Women in Lancaster earn 77.9 cents for every dollar earned by a man.
What is Family Income Deficit in Lancaster?
Family Income Deficit in Lancaster is $11,167.
Families that are below poverty line in Lancaster earn $11,167 less on average than the poverty threshold level.
What is Inequality or Gini Index in Lancaster?
Inequality or Gini Index in Lancaster is 0.43.
What is the Total Population of Lancaster?
Total Population of Lancaster is 40,616.
What is the Total Male Population of Lancaster?
Total Male Population of Lancaster is 19,864.
What is the Total Female Population of Lancaster?
Total Female Population of Lancaster is 20,752.
What is the Ratio of Males per 100 Females in Lancaster?
There are 95.72 Males per 100 Females in Lancaster.
What is the Ratio of Females per 100 Males in Lancaster?
There are 104.47 Females per 100 Males in Lancaster.
What is the Median Population Age in Lancaster?
Median Population Age in Lancaster is 38.4 Years.
What is the Average Family Size in Lancaster
Average Family Size in Lancaster is 3.0 People.
What is the Average Household Size in Lancaster
Average Household Size in Lancaster is 2.4 People.
How Large is the Labor Force in Lancaster?
There are 19,502 People in the Labor Forcein in Lancaster.
What is the Percentage of People in the Labor Force in Lancaster?
59.9% of People are in the Labor Force in Lancaster.
What is the Unemployment Rate in Lancaster?
Unemployment Rate in Lancaster is 4.6%.