Fairview Park, OH Map & Demographics
Fairview Park Map
Fairview Park Overview
$44,373
PER CAPITA INCOME
$102,326
AVG FAMILY INCOME
$76,027
AVG HOUSEHOLD INCOME
27.4%
WAGE / INCOME GAP [ % ]
72.6¢/ $1
WAGE / INCOME GAP [ $ ]
$4,876
FAMILY INCOME DEFICIT
0.42
INEQUALITY / GINI INDEX
17,137
TOTAL POPULATION
8,415
MALE POPULATION
8,722
FEMALE POPULATION
96.48
MALES / 100 FEMALES
103.65
FEMALES / 100 MALES
39.1
MEDIAN AGE
2.9
AVG FAMILY SIZE
2.2
AVG HOUSEHOLD SIZE
10,216
LABOR FORCE [ PEOPLE ]
73.0%
PERCENT IN LABOR FORCE
3.3%
UNEMPLOYMENT RATE
Income in Fairview Park
Income Overview in Fairview Park
Per Capita Income in Fairview Park is $44,373, while median incomes of families and households are $102,326 and $76,027 respectively.
| Characteristic | Number | Measure |
| Per Capita Income | 17,137 | $44,373 |
| Median Family Income | 4,397 | $102,326 |
| Mean Family Income | 4,397 | $118,945 |
| Median Household Income | 7,727 | $76,027 |
| Mean Household Income | 7,727 | $97,708 |
| Income Deficit | 4,397 | $4,876 |
| Wage / Income Gap (%) | 17,137 | 27.35% |
| Wage / Income Gap ($) | 17,137 | 72.65¢ per $1 |
| Gini / Inequality Index | 17,137 | 0.42 |
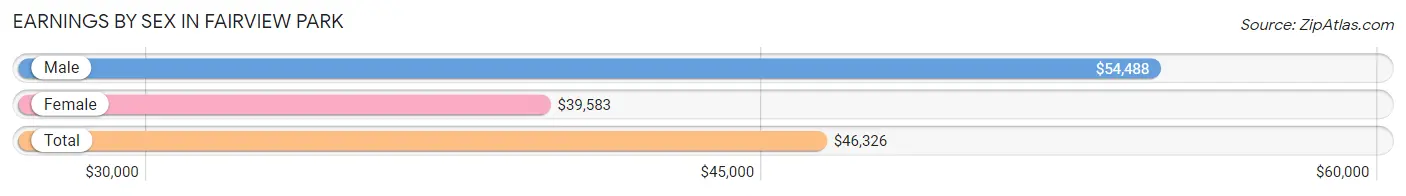
Earnings by Sex in Fairview Park
Average Earnings in Fairview Park are $46,326, $54,488 for men and $39,583 for women, a difference of 27.4%.
| Sex | Number | Average Earnings |
| Male | 5,236 (49.5%) | $54,488 |
| Female | 5,333 (50.5%) | $39,583 |
| Total | 10,569 (100.0%) | $46,326 |
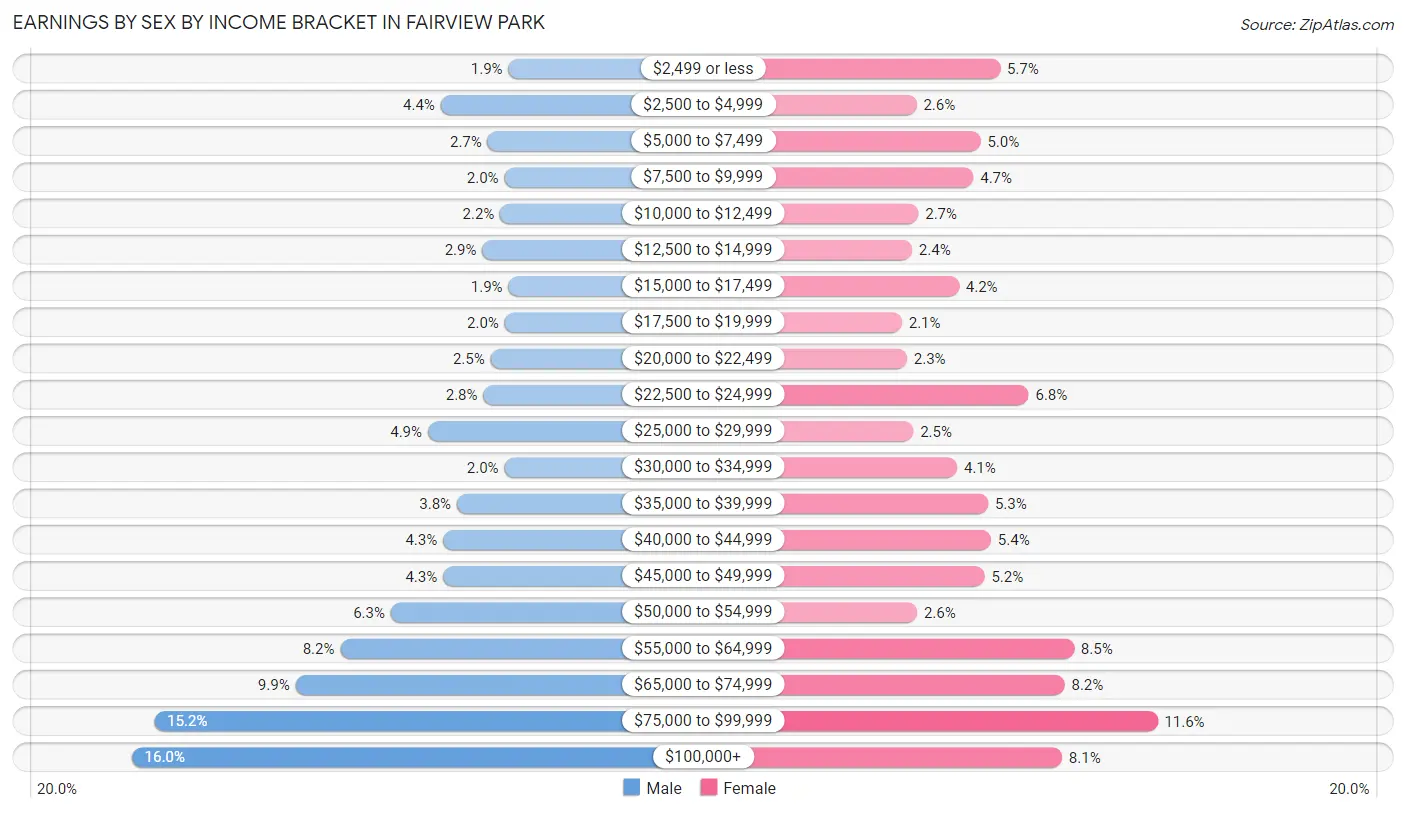
Earnings by Sex by Income Bracket in Fairview Park
The most common earnings brackets in Fairview Park are $100,000+ for men (837 | 16.0%) and $75,000 to $99,999 for women (621 | 11.6%).
| Income | Male | Female |
| $2,499 or less | 98 (1.9%) | 306 (5.7%) |
| $2,500 to $4,999 | 231 (4.4%) | 139 (2.6%) |
| $5,000 to $7,499 | 139 (2.6%) | 267 (5.0%) |
| $7,500 to $9,999 | 106 (2.0%) | 253 (4.7%) |
| $10,000 to $12,499 | 114 (2.2%) | 143 (2.7%) |
| $12,500 to $14,999 | 149 (2.9%) | 130 (2.4%) |
| $15,000 to $17,499 | 98 (1.9%) | 224 (4.2%) |
| $17,500 to $19,999 | 105 (2.0%) | 110 (2.1%) |
| $20,000 to $22,499 | 133 (2.5%) | 120 (2.2%) |
| $22,500 to $24,999 | 147 (2.8%) | 363 (6.8%) |
| $25,000 to $29,999 | 256 (4.9%) | 133 (2.5%) |
| $30,000 to $34,999 | 106 (2.0%) | 220 (4.1%) |
| $35,000 to $39,999 | 199 (3.8%) | 282 (5.3%) |
| $40,000 to $44,999 | 226 (4.3%) | 288 (5.4%) |
| $45,000 to $49,999 | 226 (4.3%) | 275 (5.2%) |
| $50,000 to $54,999 | 329 (6.3%) | 140 (2.6%) |
| $55,000 to $64,999 | 428 (8.2%) | 454 (8.5%) |
| $65,000 to $74,999 | 516 (9.9%) | 435 (8.2%) |
| $75,000 to $99,999 | 793 (15.1%) | 621 (11.6%) |
| $100,000+ | 837 (16.0%) | 430 (8.1%) |
| Total | 5,236 (100.0%) | 5,333 (100.0%) |
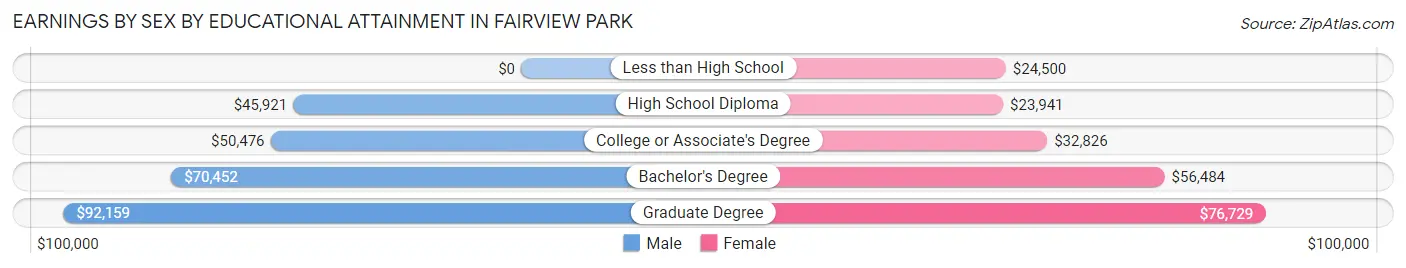
Earnings by Sex by Educational Attainment in Fairview Park
Average earnings in Fairview Park are $59,363 for men and $43,942 for women, a difference of 26.0%. Men with an educational attainment of graduate degree enjoy the highest average annual earnings of $92,159, while those with high school diploma education earn the least with $45,921. Women with an educational attainment of graduate degree earn the most with the average annual earnings of $76,729, while those with high school diploma education have the smallest earnings of $23,941.
| Educational Attainment | Male Income | Female Income |
| Less than High School | - | - |
| High School Diploma | $45,921 | $23,941 |
| College or Associate's Degree | $50,476 | $32,826 |
| Bachelor's Degree | $70,452 | $56,484 |
| Graduate Degree | $92,159 | $76,729 |
| Total | $59,363 | $43,942 |
Family Income in Fairview Park
Family Income Brackets in Fairview Park
According to the Fairview Park family income data, there are 1,192 families falling into the $100,000 to $149,999 income range, which is the most common income bracket and makes up 27.1% of all families.
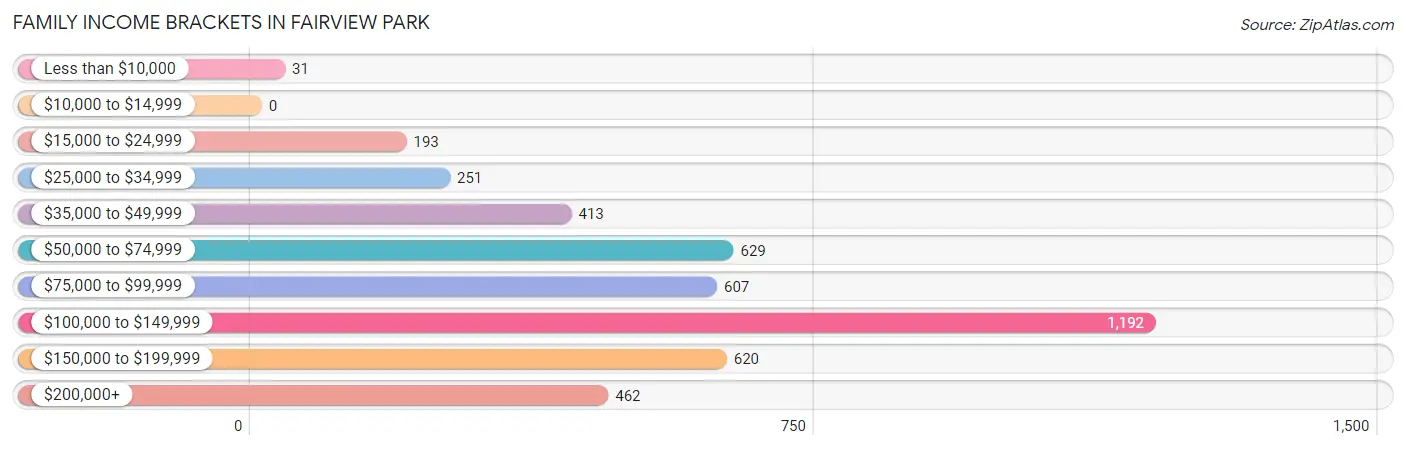
| Income Bracket | # Families | % Families |
| Less than $10,000 | 31 | 0.7% |
| $10,000 to $14,999 | 0 | 0.0% |
| $15,000 to $24,999 | 193 | 4.4% |
| $25,000 to $34,999 | 251 | 5.7% |
| $35,000 to $49,999 | 413 | 9.4% |
| $50,000 to $74,999 | 629 | 14.3% |
| $75,000 to $99,999 | 607 | 13.8% |
| $100,000 to $149,999 | 1,192 | 27.1% |
| $150,000 to $199,999 | 620 | 14.1% |
| $200,000+ | 462 | 10.5% |
Family Income by Famaliy Size in Fairview Park
4-person families (916 | 20.8%) account for the highest median family income in Fairview Park with $138,229 per family, while 2-person families (2,318 | 52.7%) have the highest median income of $42,159 per family member.
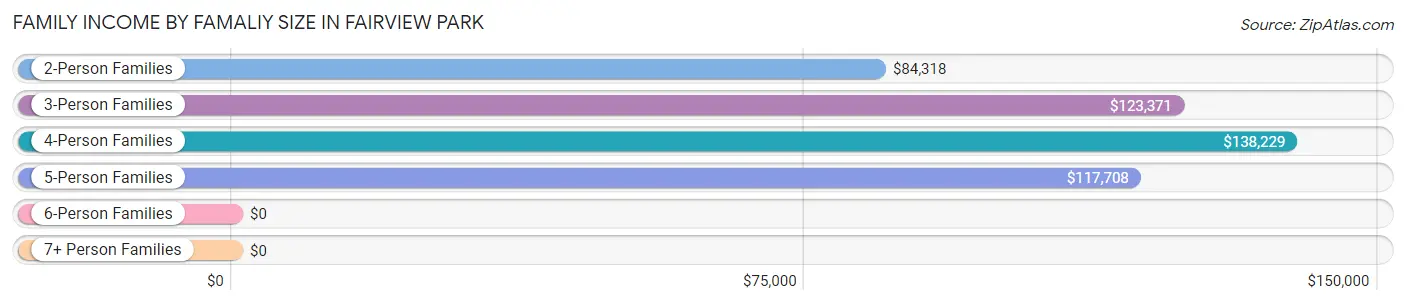
| Income Bracket | # Families | Median Income |
| 2-Person Families | 2,318 (52.7%) | $84,318 |
| 3-Person Families | 751 (17.1%) | $123,371 |
| 4-Person Families | 916 (20.8%) | $138,229 |
| 5-Person Families | 304 (6.9%) | $117,708 |
| 6-Person Families | 90 (2.1%) | $0 |
| 7+ Person Families | 18 (0.4%) | $0 |
| Total | 4,397 (100.0%) | $102,326 |
Family Income by Number of Earners in Fairview Park
The median family income in Fairview Park is $102,326, with families comprising 3+ earners (607) having the highest median family income of $139,375, while families with no earners (503) have the lowest median family income of $53,413, accounting for 13.8% and 11.4% of families, respectively.
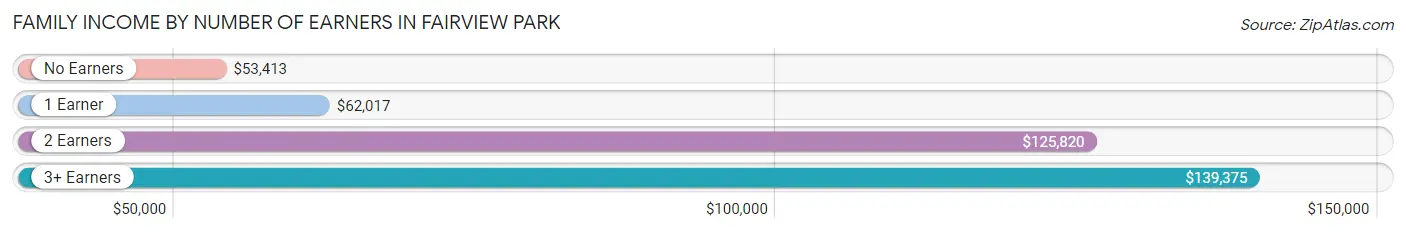
| Number of Earners | # Families | Median Income |
| No Earners | 503 (11.4%) | $53,413 |
| 1 Earner | 1,161 (26.4%) | $62,017 |
| 2 Earners | 2,126 (48.3%) | $125,820 |
| 3+ Earners | 607 (13.8%) | $139,375 |
| Total | 4,397 (100.0%) | $102,326 |
Household Income in Fairview Park
Household Income Brackets in Fairview Park
With 1,545 households falling in the category, the $100,000 to $149,999 income range is the most frequent in Fairview Park, accounting for 20.0% of all households. In contrast, only 178 households (2.3%) fall into the less than $10,000 income bracket, making it the least populous group.
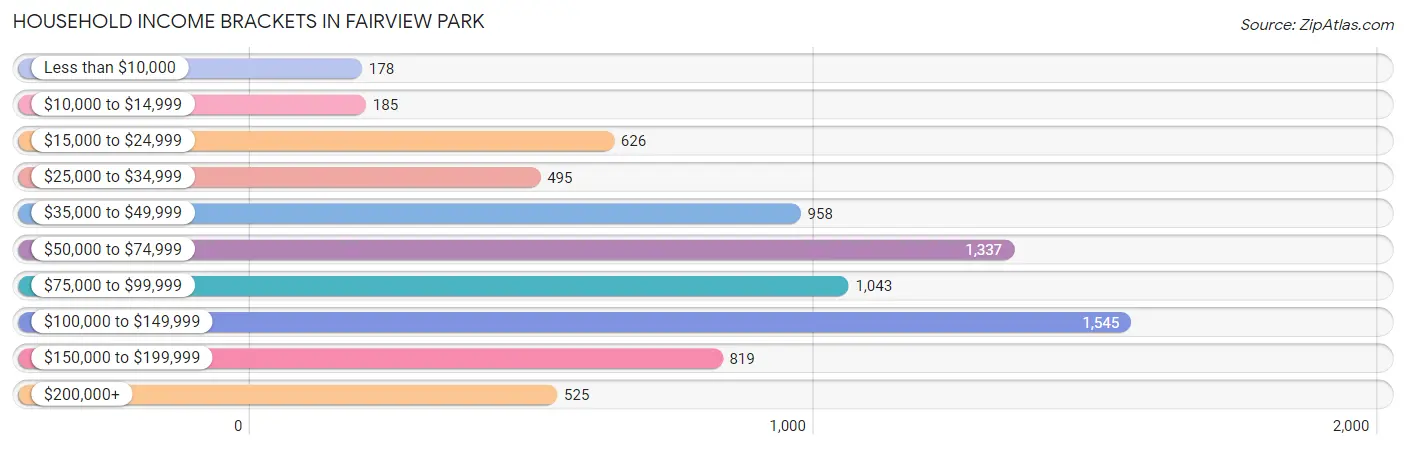
| Income Bracket | # Households | % Households |
| Less than $10,000 | 178 | 2.3% |
| $10,000 to $14,999 | 185 | 2.4% |
| $15,000 to $24,999 | 626 | 8.1% |
| $25,000 to $34,999 | 495 | 6.4% |
| $35,000 to $49,999 | 958 | 12.4% |
| $50,000 to $74,999 | 1,337 | 17.3% |
| $75,000 to $99,999 | 1,043 | 13.5% |
| $100,000 to $149,999 | 1,545 | 20.0% |
| $150,000 to $199,999 | 819 | 10.6% |
| $200,000+ | 525 | 6.8% |
Household Income by Householder Age in Fairview Park
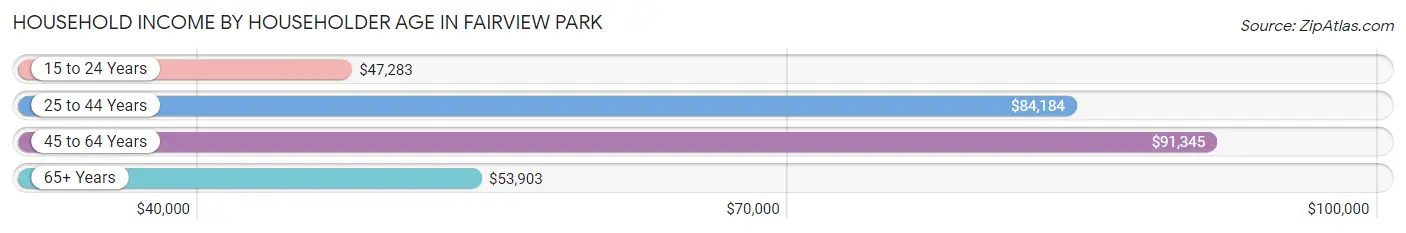
The median household income in Fairview Park is $76,027, with the highest median household income of $91,345 found in the 45 to 64 years age bracket for the primary householder. A total of 2,735 households (35.4%) fall into this category. Meanwhile, the 15 to 24 years age bracket for the primary householder has the lowest median household income of $47,283, with 144 households (1.9%) in this group.
| Income Bracket | # Households | Median Income |
| 15 to 24 Years | 144 (1.9%) | $47,283 |
| 25 to 44 Years | 2,617 (33.9%) | $84,184 |
| 45 to 64 Years | 2,735 (35.4%) | $91,345 |
| 65+ Years | 2,231 (28.9%) | $53,903 |
| Total | 7,727 (100.0%) | $76,027 |
Poverty in Fairview Park
Income Below Poverty by Sex and Age in Fairview Park
With 9.2% poverty level for males and 11.2% for females among the residents of Fairview Park, 6 to 11 year old males and 18 to 24 year old females are the most vulnerable to poverty, with 272 males (38.8%) and 183 females (26.1%) in their respective age groups living below the poverty level.
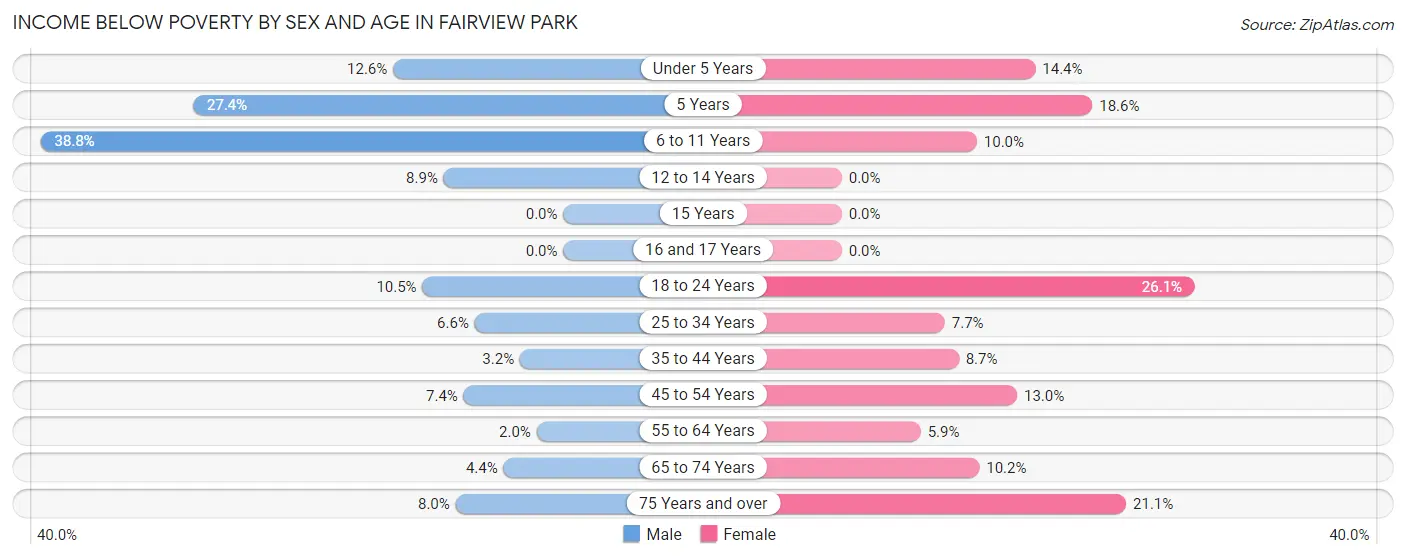
| Age Bracket | Male | Female |
| Under 5 Years | 57 (12.6%) | 49 (14.4%) |
| 5 Years | 48 (27.4%) | 16 (18.6%) |
| 6 to 11 Years | 272 (38.8%) | 64 (10.0%) |
| 12 to 14 Years | 30 (8.9%) | 0 (0.0%) |
| 15 Years | 0 (0.0%) | 0 (0.0%) |
| 16 and 17 Years | 0 (0.0%) | 0 (0.0%) |
| 18 to 24 Years | 61 (10.5%) | 183 (26.1%) |
| 25 to 34 Years | 109 (6.6%) | 102 (7.6%) |
| 35 to 44 Years | 30 (3.2%) | 81 (8.7%) |
| 45 to 54 Years | 65 (7.4%) | 134 (13.0%) |
| 55 to 64 Years | 21 (2.0%) | 80 (5.9%) |
| 65 to 74 Years | 40 (4.4%) | 100 (10.2%) |
| 75 Years and over | 44 (8.0%) | 160 (21.1%) |
| Total | 777 (9.2%) | 969 (11.2%) |
Income Above Poverty by Sex and Age in Fairview Park
According to the poverty statistics in Fairview Park, males aged 15 years and females aged 12 to 14 years are the age groups that are most secure financially, with 100.0% of males and 100.0% of females in these age groups living above the poverty line.
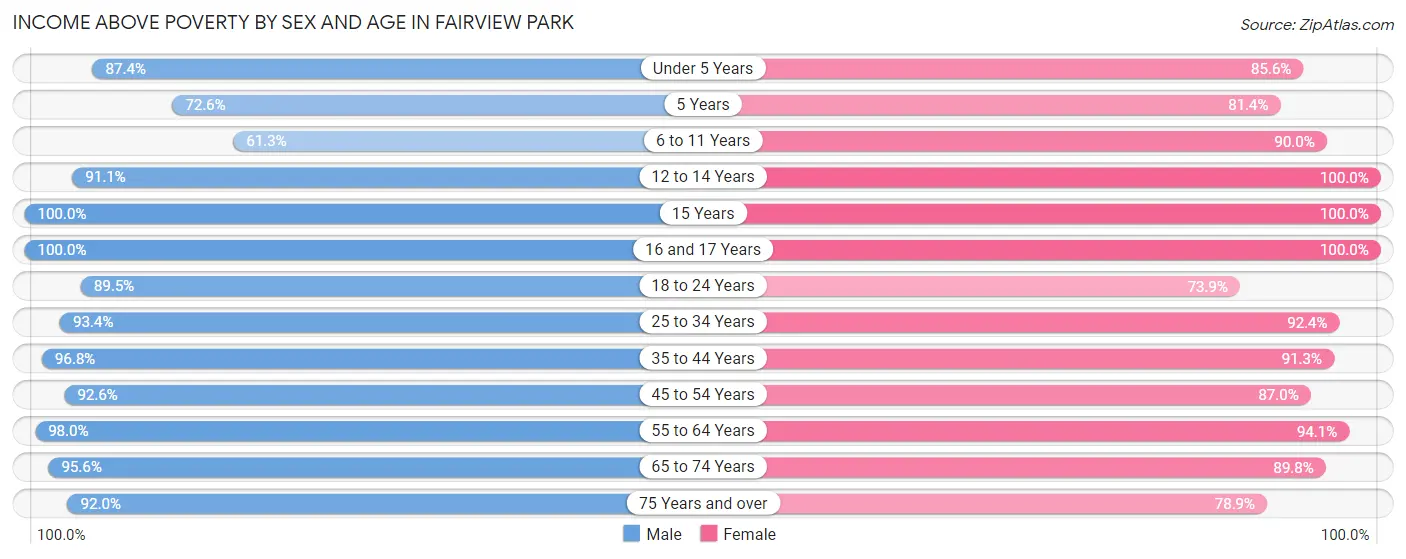
| Age Bracket | Male | Female |
| Under 5 Years | 394 (87.4%) | 292 (85.6%) |
| 5 Years | 127 (72.6%) | 70 (81.4%) |
| 6 to 11 Years | 430 (61.3%) | 574 (90.0%) |
| 12 to 14 Years | 308 (91.1%) | 260 (100.0%) |
| 15 Years | 49 (100.0%) | 55 (100.0%) |
| 16 and 17 Years | 139 (100.0%) | 180 (100.0%) |
| 18 to 24 Years | 522 (89.5%) | 517 (73.9%) |
| 25 to 34 Years | 1,548 (93.4%) | 1,232 (92.3%) |
| 35 to 44 Years | 902 (96.8%) | 852 (91.3%) |
| 45 to 54 Years | 813 (92.6%) | 896 (87.0%) |
| 55 to 64 Years | 1,039 (98.0%) | 1,286 (94.1%) |
| 65 to 74 Years | 861 (95.6%) | 879 (89.8%) |
| 75 Years and over | 506 (92.0%) | 598 (78.9%) |
| Total | 7,638 (90.8%) | 7,691 (88.8%) |
Income Below Poverty Among Married-Couple Families in Fairview Park
The poverty statistics for married-couple families in Fairview Park show that 3.6% or 118 of the total 3,234 families live below the poverty line. Families with 3 or 4 children have the highest poverty rate of 15.2%, comprising of 43 families. On the other hand, families with 5 or more children have the lowest poverty rate of 0.0%, which includes 0 families.
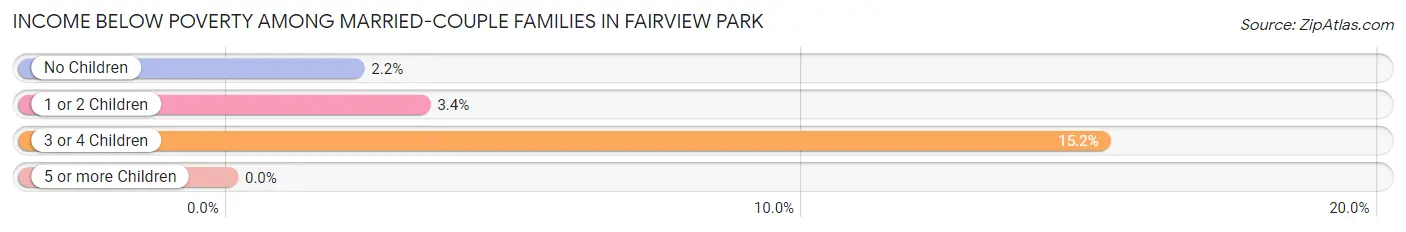
| Children | Above Poverty | Below Poverty |
| No Children | 2,002 (97.8%) | 45 (2.2%) |
| 1 or 2 Children | 866 (96.7%) | 30 (3.4%) |
| 3 or 4 Children | 240 (84.8%) | 43 (15.2%) |
| 5 or more Children | 8 (100.0%) | 0 (0.0%) |
| Total | 3,116 (96.4%) | 118 (3.6%) |
Income Below Poverty Among Single-Parent Households in Fairview Park
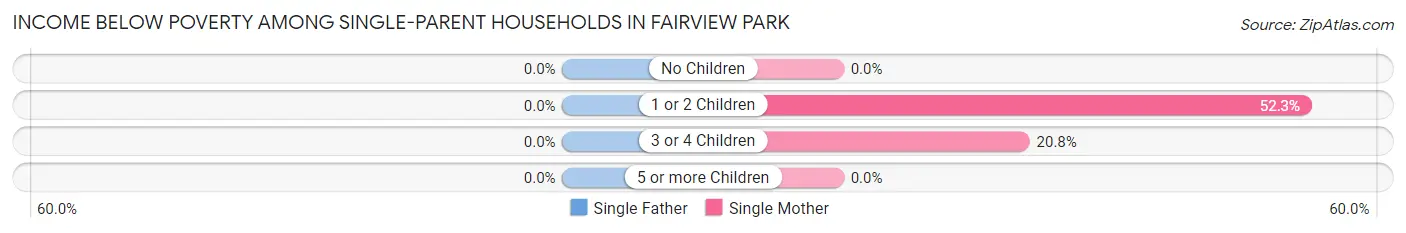
| Children | Single Father | Single Mother |
| No Children | 0 (0.0%) | 0 (0.0%) |
| 1 or 2 Children | 0 (0.0%) | 169 (52.3%) |
| 3 or 4 Children | 0 (0.0%) | 16 (20.8%) |
| 5 or more Children | 0 (0.0%) | 0 (0.0%) |
| Total | 0 (0.0%) | 185 (25.4%) |
Income Below Poverty Among Married-Couple vs Single-Parent Households in Fairview Park
The poverty data for Fairview Park shows that 118 of the married-couple family households (3.6%) and 185 of the single-parent households (15.9%) are living below the poverty level. Within the married-couple family households, those with 3 or 4 children have the highest poverty rate, with 43 households (15.2%) falling below the poverty line. Among the single-parent households, those with 1 or 2 children have the highest poverty rate, with 169 household (31.8%) living below poverty.
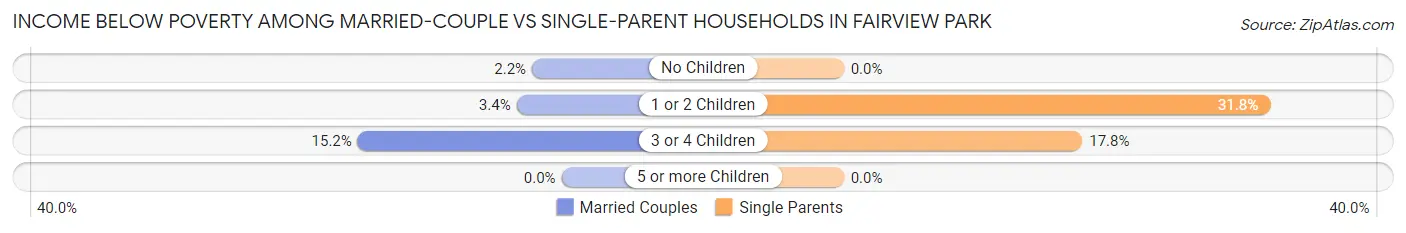
| Children | Married-Couple Families | Single-Parent Households |
| No Children | 45 (2.2%) | 0 (0.0%) |
| 1 or 2 Children | 30 (3.4%) | 169 (31.8%) |
| 3 or 4 Children | 43 (15.2%) | 16 (17.8%) |
| 5 or more Children | 0 (0.0%) | 0 (0.0%) |
| Total | 118 (3.6%) | 185 (15.9%) |
Race in Fairview Park
The most populous races in Fairview Park are White / Caucasian (14,959 | 87.3%), Two or more Races (1,182 | 6.9%), and Hispanic or Latino (859 | 5.0%).
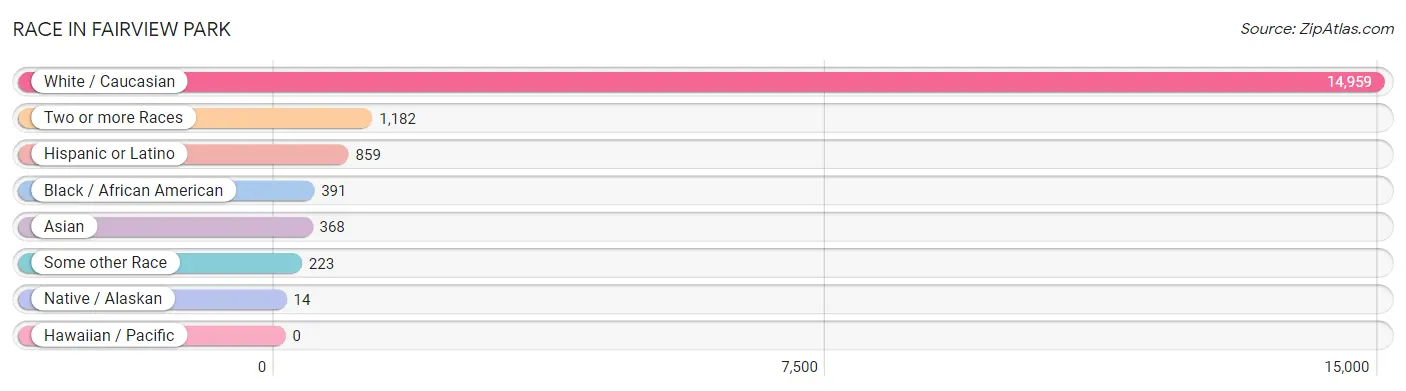
| Race | # Population | % Population |
| Asian | 368 | 2.1% |
| Black / African American | 391 | 2.3% |
| Hawaiian / Pacific | 0 | 0.0% |
| Hispanic or Latino | 859 | 5.0% |
| Native / Alaskan | 14 | 0.1% |
| White / Caucasian | 14,959 | 87.3% |
| Two or more Races | 1,182 | 6.9% |
| Some other Race | 223 | 1.3% |
| Total | 17,137 | 100.0% |
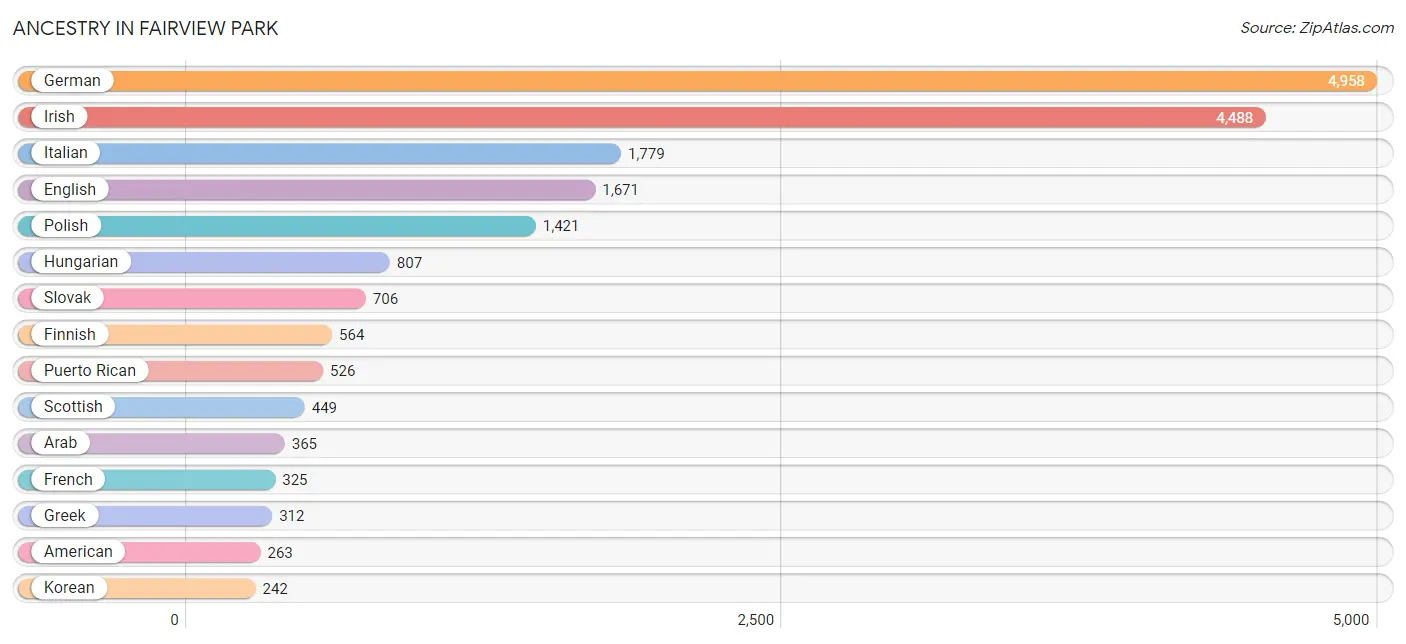
Ancestry in Fairview Park
The most populous ancestries reported in Fairview Park are German (4,958 | 28.9%), Irish (4,488 | 26.2%), Italian (1,779 | 10.4%), English (1,671 | 9.8%), and Polish (1,421 | 8.3%), together accounting for 83.5% of all Fairview Park residents.
| Ancestry | # Population | % Population |
| Albanian | 180 | 1.1% |
| American | 263 | 1.5% |
| Arab | 365 | 2.1% |
| Armenian | 4 | 0.0% |
| Austrian | 29 | 0.2% |
| Belgian | 21 | 0.1% |
| Bhutanese | 14 | 0.1% |
| Brazilian | 6 | 0.0% |
| British | 69 | 0.4% |
| Bulgarian | 30 | 0.2% |
| Burmese | 29 | 0.2% |
| Canadian | 23 | 0.1% |
| Celtic | 25 | 0.2% |
| Central American | 9 | 0.1% |
| Central American Indian | 41 | 0.2% |
| Croatian | 129 | 0.7% |
| Cuban | 54 | 0.3% |
| Czech | 171 | 1.0% |
| Czechoslovakian | 46 | 0.3% |
| Danish | 51 | 0.3% |
| Dominican | 13 | 0.1% |
| Dutch | 139 | 0.8% |
| Eastern European | 130 | 0.8% |
| Egyptian | 11 | 0.1% |
| English | 1,671 | 9.8% |
| European | 167 | 1.0% |
| Finnish | 564 | 3.3% |
| French | 325 | 1.9% |
| French Canadian | 48 | 0.3% |
| German | 4,958 | 28.9% |
| Greek | 312 | 1.8% |
| Haitian | 15 | 0.1% |
| Hungarian | 807 | 4.7% |
| Indian (Asian) | 210 | 1.2% |
| Iranian | 61 | 0.4% |
| Irish | 4,488 | 26.2% |
| Italian | 1,779 | 10.4% |
| Jamaican | 27 | 0.2% |
| Jordanian | 71 | 0.4% |
| Korean | 242 | 1.4% |
| Latvian | 15 | 0.1% |
| Lebanese | 56 | 0.3% |
| Lithuanian | 62 | 0.4% |
| Mexican | 211 | 1.2% |
| Norwegian | 100 | 0.6% |
| Pakistani | 10 | 0.1% |
| Palestinian | 222 | 1.3% |
| Panamanian | 9 | 0.1% |
| Paraguayan | 9 | 0.1% |
| Pennsylvania German | 13 | 0.1% |
| Peruvian | 4 | 0.0% |
| Polish | 1,421 | 8.3% |
| Portuguese | 1 | 0.0% |
| Puerto Rican | 526 | 3.1% |
| Romanian | 27 | 0.2% |
| Russian | 225 | 1.3% |
| Scandinavian | 19 | 0.1% |
| Scotch-Irish | 107 | 0.6% |
| Scottish | 449 | 2.6% |
| Serbian | 46 | 0.3% |
| Slavic | 7 | 0.0% |
| Slovak | 706 | 4.1% |
| Slovene | 165 | 1.0% |
| Somali | 11 | 0.1% |
| South American | 13 | 0.1% |
| Spaniard | 24 | 0.1% |
| Spanish | 9 | 0.1% |
| Sri Lankan | 26 | 0.2% |
| Subsaharan African | 11 | 0.1% |
| Swedish | 60 | 0.4% |
| Swiss | 96 | 0.6% |
| Syrian | 5 | 0.0% |
| Thai | 64 | 0.4% |
| Ukrainian | 105 | 0.6% |
| Welsh | 100 | 0.6% |
| West Indian | 10 | 0.1% | View All 76 Rows |
Immigrants in Fairview Park
The most numerous immigrant groups reported in Fairview Park came from Asia (541 | 3.2%), Europe (266 | 1.5%), Eastern Europe (213 | 1.2%), Western Asia (163 | 0.9%), and Albania (150 | 0.9%), together accounting for 7.8% of all Fairview Park residents.
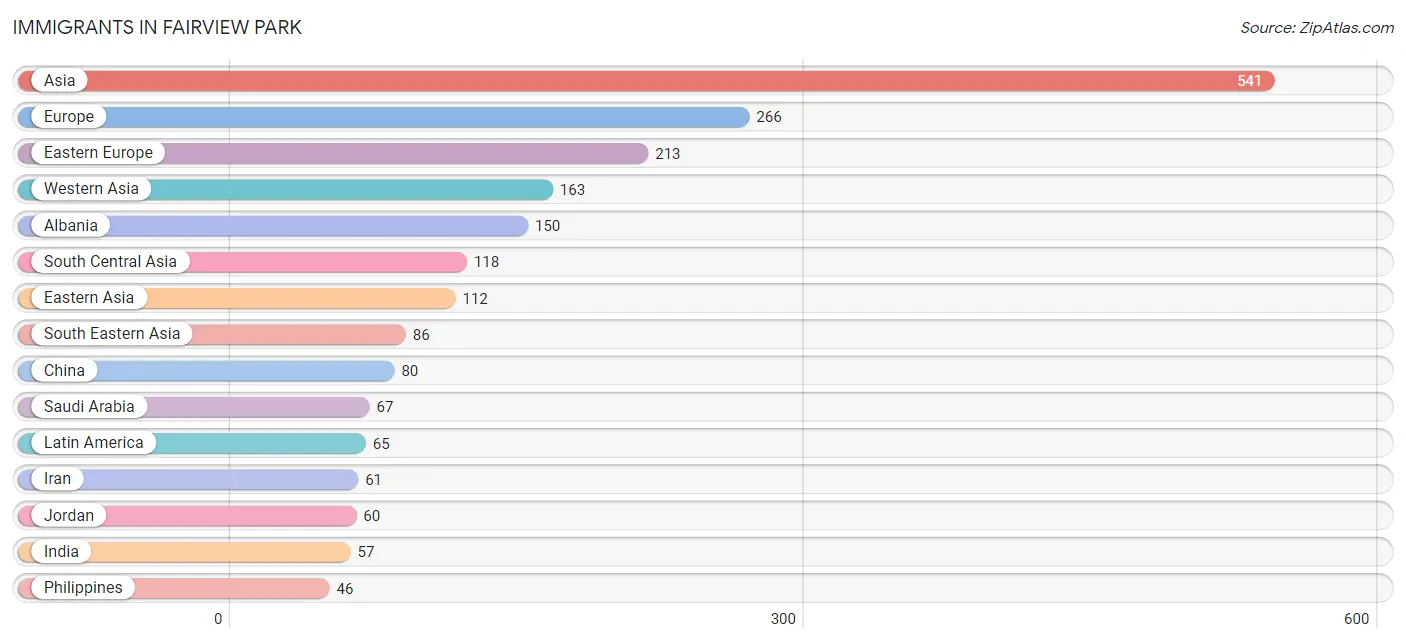
| Immigration Origin | # Population | % Population |
| Albania | 150 | 0.9% |
| Asia | 541 | 3.2% |
| Austria | 22 | 0.1% |
| Canada | 12 | 0.1% |
| Caribbean | 22 | 0.1% |
| Central America | 39 | 0.2% |
| China | 80 | 0.5% |
| Czechoslovakia | 8 | 0.1% |
| Dominican Republic | 13 | 0.1% |
| Eastern Asia | 112 | 0.6% |
| Eastern Europe | 213 | 1.2% |
| Europe | 266 | 1.5% |
| Haiti | 9 | 0.1% |
| Hong Kong | 45 | 0.3% |
| India | 57 | 0.3% |
| Iran | 61 | 0.4% |
| Ireland | 10 | 0.1% |
| Italy | 7 | 0.0% |
| Jordan | 60 | 0.4% |
| Korea | 32 | 0.2% |
| Latin America | 65 | 0.4% |
| Lebanon | 13 | 0.1% |
| Mexico | 30 | 0.2% |
| Northern Europe | 24 | 0.1% |
| Panama | 9 | 0.1% |
| Peru | 4 | 0.0% |
| Philippines | 46 | 0.3% |
| Poland | 25 | 0.2% |
| Romania | 22 | 0.1% |
| Saudi Arabia | 67 | 0.4% |
| Scotland | 14 | 0.1% |
| Serbia | 8 | 0.1% |
| South America | 4 | 0.0% |
| South Central Asia | 118 | 0.7% |
| South Eastern Asia | 86 | 0.5% |
| Southern Europe | 7 | 0.0% |
| Syria | 12 | 0.1% |
| Thailand | 10 | 0.1% |
| Vietnam | 30 | 0.2% |
| Western Asia | 163 | 0.9% |
| Western Europe | 22 | 0.1% | View All 41 Rows |
Sex and Age in Fairview Park
Sex and Age in Fairview Park
The most populous age groups in Fairview Park are 25 to 29 Years (928 | 11.0%) for men and 60 to 64 Years (727 | 8.3%) for women.
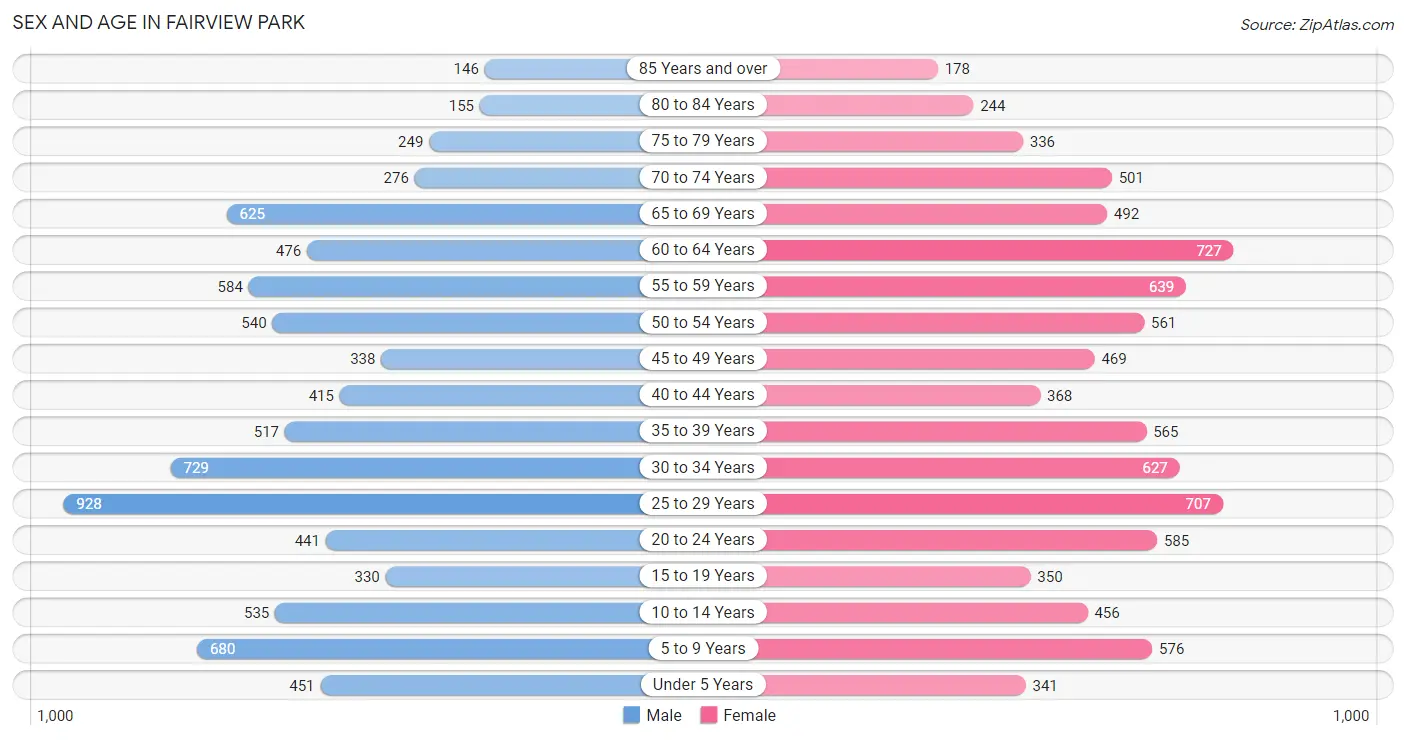
| Age Bracket | Male | Female |
| Under 5 Years | 451 (5.4%) | 341 (3.9%) |
| 5 to 9 Years | 680 (8.1%) | 576 (6.6%) |
| 10 to 14 Years | 535 (6.4%) | 456 (5.2%) |
| 15 to 19 Years | 330 (3.9%) | 350 (4.0%) |
| 20 to 24 Years | 441 (5.2%) | 585 (6.7%) |
| 25 to 29 Years | 928 (11.0%) | 707 (8.1%) |
| 30 to 34 Years | 729 (8.7%) | 627 (7.2%) |
| 35 to 39 Years | 517 (6.1%) | 565 (6.5%) |
| 40 to 44 Years | 415 (4.9%) | 368 (4.2%) |
| 45 to 49 Years | 338 (4.0%) | 469 (5.4%) |
| 50 to 54 Years | 540 (6.4%) | 561 (6.4%) |
| 55 to 59 Years | 584 (6.9%) | 639 (7.3%) |
| 60 to 64 Years | 476 (5.7%) | 727 (8.3%) |
| 65 to 69 Years | 625 (7.4%) | 492 (5.6%) |
| 70 to 74 Years | 276 (3.3%) | 501 (5.7%) |
| 75 to 79 Years | 249 (3.0%) | 336 (3.8%) |
| 80 to 84 Years | 155 (1.8%) | 244 (2.8%) |
| 85 Years and over | 146 (1.7%) | 178 (2.0%) |
| Total | 8,415 (100.0%) | 8,722 (100.0%) |
Families and Households in Fairview Park
Median Family Size in Fairview Park
The median family size in Fairview Park is 2.94 persons per family, with married-couple families (3,234 | 73.6%) accounting for the largest median family size of 3 persons per family. On the other hand, single male/father families (434 | 9.9%) represent the smallest median family size with 2.46 persons per family.
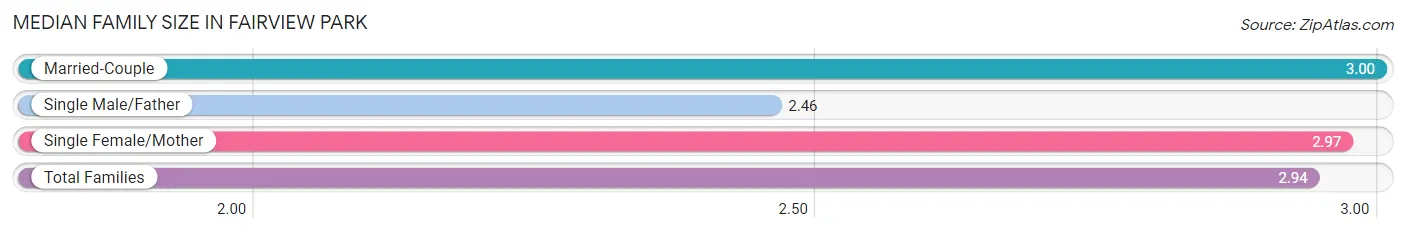
| Family Type | # Families | Family Size |
| Married-Couple | 3,234 (73.6%) | 3.00 |
| Single Male/Father | 434 (9.9%) | 2.46 |
| Single Female/Mother | 729 (16.6%) | 2.97 |
| Total Families | 4,397 (100.0%) | 2.94 |
Median Household Size in Fairview Park
The median household size in Fairview Park is 2.21 persons per household, with single female/mother households (729 | 9.4%) accounting for the largest median household size of 3.11 persons per household. non-family households (3,330 | 43.1%) represent the smallest median household size with 1.19 persons per household.
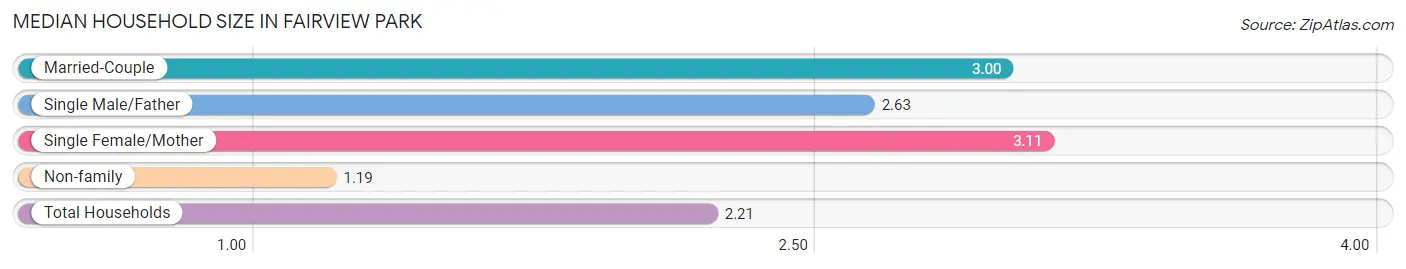
| Household Type | # Households | Household Size |
| Married-Couple | 3,234 (41.8%) | 3.00 |
| Single Male/Father | 434 (5.6%) | 2.63 |
| Single Female/Mother | 729 (9.4%) | 3.11 |
| Non-family | 3,330 (43.1%) | 1.19 |
| Total Households | 7,727 (100.0%) | 2.21 |
Household Size by Marriage Status in Fairview Park
Out of a total of 7,727 households in Fairview Park, 4,397 (56.9%) are family households, while 3,330 (43.1%) are nonfamily households. The most numerous type of family households are 2-person households, comprising 2,201, and the most common type of nonfamily households are 1-person households, comprising 2,772.
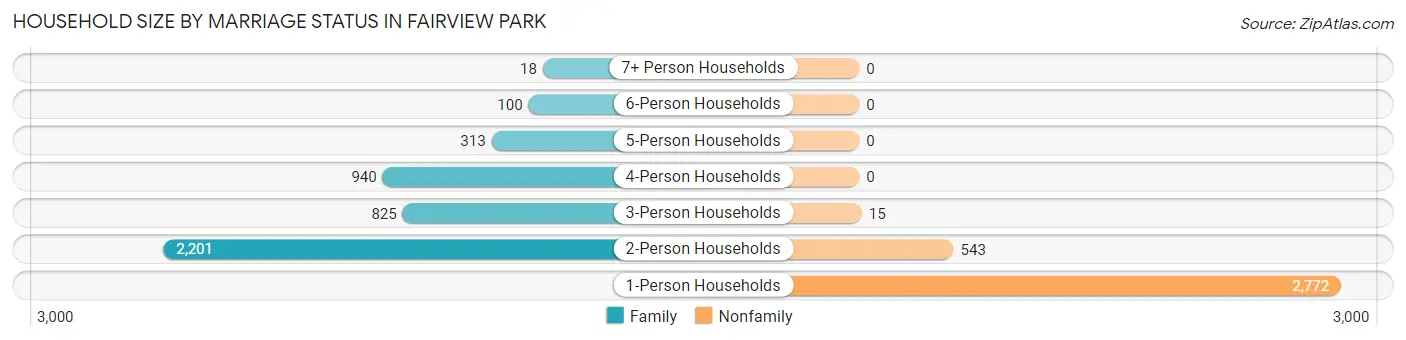
| Household Size | Family Households | Nonfamily Households |
| 1-Person Households | - | 2,772 (35.9%) |
| 2-Person Households | 2,201 (28.5%) | 543 (7.0%) |
| 3-Person Households | 825 (10.7%) | 15 (0.2%) |
| 4-Person Households | 940 (12.2%) | 0 (0.0%) |
| 5-Person Households | 313 (4.1%) | 0 (0.0%) |
| 6-Person Households | 100 (1.3%) | 0 (0.0%) |
| 7+ Person Households | 18 (0.2%) | 0 (0.0%) |
| Total | 4,397 (56.9%) | 3,330 (43.1%) |
Female Fertility in Fairview Park
Fertility by Age in Fairview Park
Average fertility rate in Fairview Park is 70.0 births per 1,000 women. Women in the age bracket of 20 to 34 years have the highest fertility rate with 111.0 births per 1,000 women. Women in the age bracket of 20 to 34 years acount for 79.8% of all women with births.
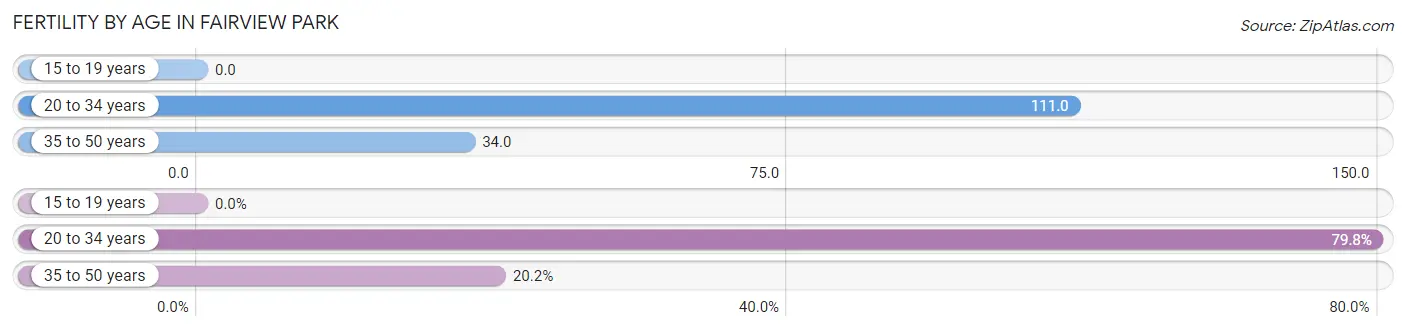
| Age Bracket | Women with Births | Births / 1,000 Women |
| 15 to 19 years | 0 (0.0%) | 0.0 |
| 20 to 34 years | 213 (79.8%) | 111.0 |
| 35 to 50 years | 54 (20.2%) | 34.0 |
| Total | 267 (100.0%) | 70.0 |
Fertility by Age by Marriage Status in Fairview Park
97.4% of women with births (267) in Fairview Park are married. The highest percentage of unmarried women with births falls into 20 to 34 years age bracket with 3.3% of them unmarried at the time of birth, while the lowest percentage of unmarried women with births belong to 35 to 50 years age bracket with 0.0% of them unmarried.
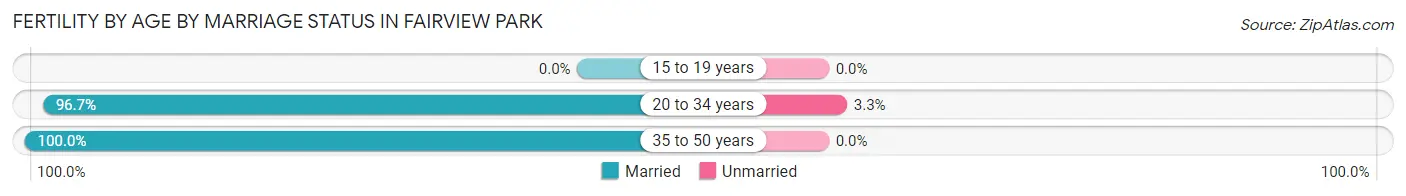
| Age Bracket | Married | Unmarried |
| 15 to 19 years | 0 (0.0%) | 0 (0.0%) |
| 20 to 34 years | 206 (96.7%) | 7 (3.3%) |
| 35 to 50 years | 54 (100.0%) | 0 (0.0%) |
| Total | 260 (97.4%) | 7 (2.6%) |
Fertility by Education in Fairview Park
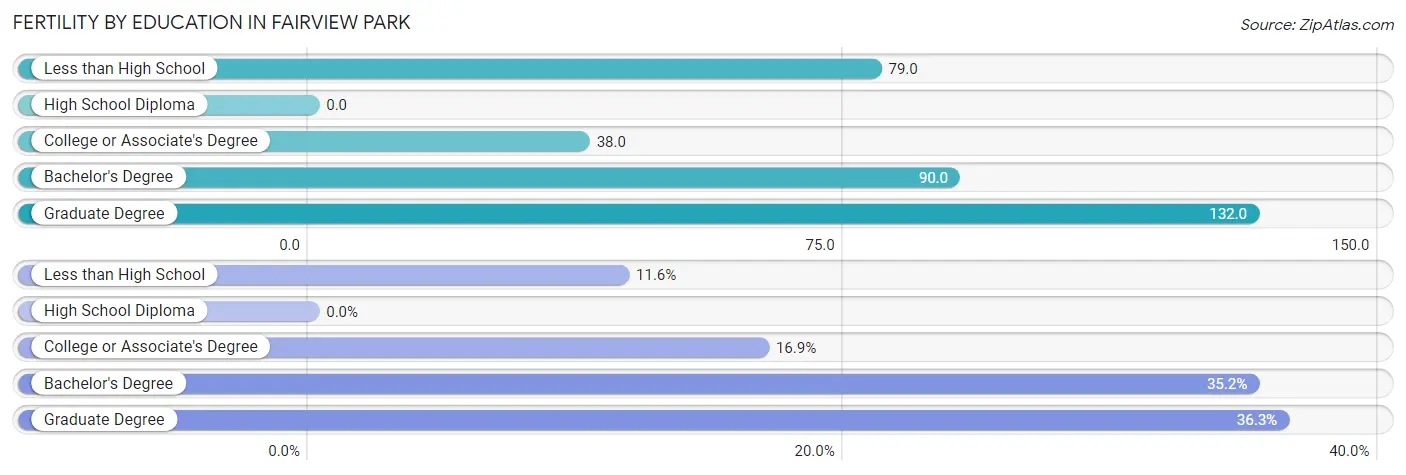
| Educational Attainment | Women with Births | Births / 1,000 Women |
| Less than High School | 31 (11.6%) | 79.0 |
| High School Diploma | 0 (0.0%) | 0.0 |
| College or Associate's Degree | 45 (16.9%) | 38.0 |
| Bachelor's Degree | 94 (35.2%) | 90.0 |
| Graduate Degree | 97 (36.3%) | 132.0 |
| Total | 267 (100.0%) | 70.0 |
Fertility by Education by Marriage Status in Fairview Park
2.6% of women with births in Fairview Park are unmarried. Women with the educational attainment of less than high school are most likely to be married with 100.0% of them married at childbirth, while women with the educational attainment of bachelor's degree are least likely to be married with 7.4% of them unmarried at childbirth.
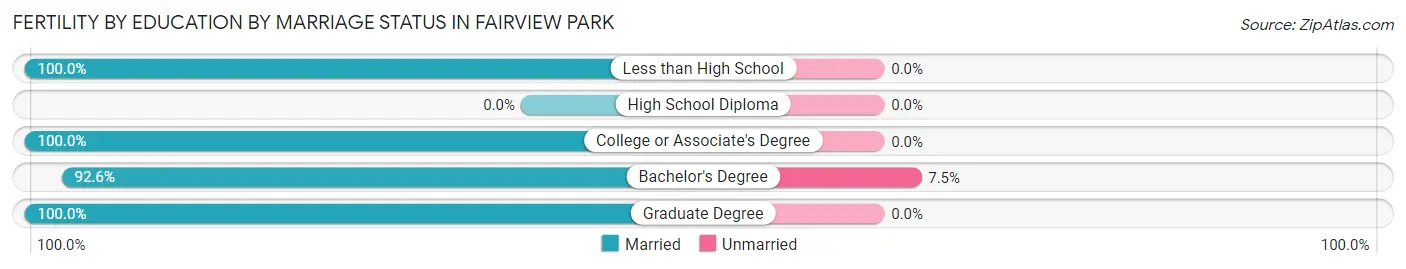
| Educational Attainment | Married | Unmarried |
| Less than High School | 31 (100.0%) | 0 (0.0%) |
| High School Diploma | 0 (0.0%) | 0 (0.0%) |
| College or Associate's Degree | 45 (100.0%) | 0 (0.0%) |
| Bachelor's Degree | 87 (92.5%) | 7 (7.4%) |
| Graduate Degree | 97 (100.0%) | 0 (0.0%) |
| Total | 260 (97.4%) | 7 (2.6%) |
Employment Characteristics in Fairview Park
Employment by Class of Employer in Fairview Park
Among the 9,814 employed individuals in Fairview Park, private company employees (6,332 | 64.5%), not-for-profit organizations (1,347 | 13.7%), and local government employees (887 | 9.0%) make up the most common classes of employment.
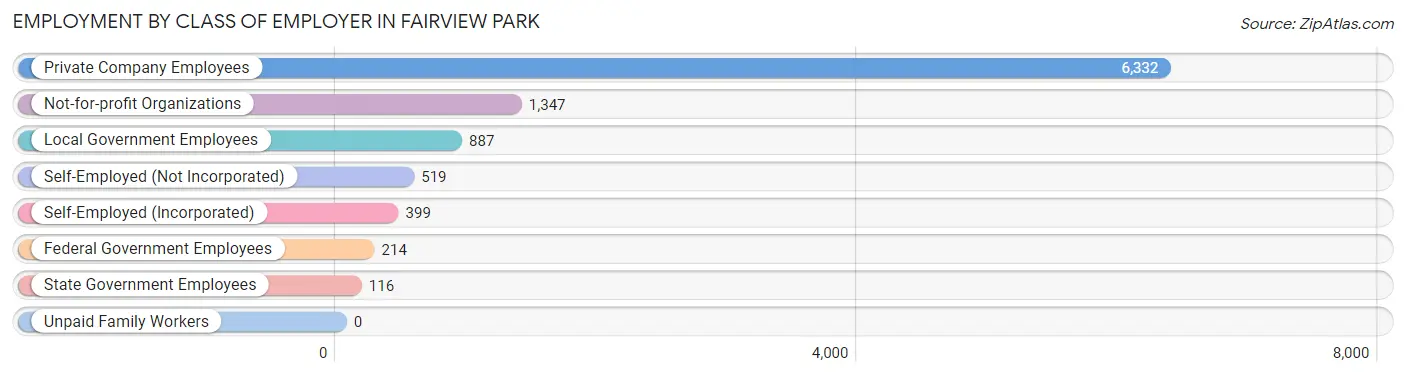
| Employer Class | # Employees | % Employees |
| Private Company Employees | 6,332 | 64.5% |
| Self-Employed (Incorporated) | 399 | 4.1% |
| Self-Employed (Not Incorporated) | 519 | 5.3% |
| Not-for-profit Organizations | 1,347 | 13.7% |
| Local Government Employees | 887 | 9.0% |
| State Government Employees | 116 | 1.2% |
| Federal Government Employees | 214 | 2.2% |
| Unpaid Family Workers | 0 | 0.0% |
| Total | 9,814 | 100.0% |
Employment Status by Age in Fairview Park
According to the labor force statistics for Fairview Park, out of the total population over 16 years of age (13,994), 73.0% or 10,216 individuals are in the labor force, with 3.3% or 337 of them unemployed. The age group with the highest labor force participation rate is 30 to 34 years, with 97.0% or 1,315 individuals in the labor force. Within the labor force, the 16 to 19 years age range has the highest percentage of unemployed individuals, with 9.5% or 24 of them being unemployed.
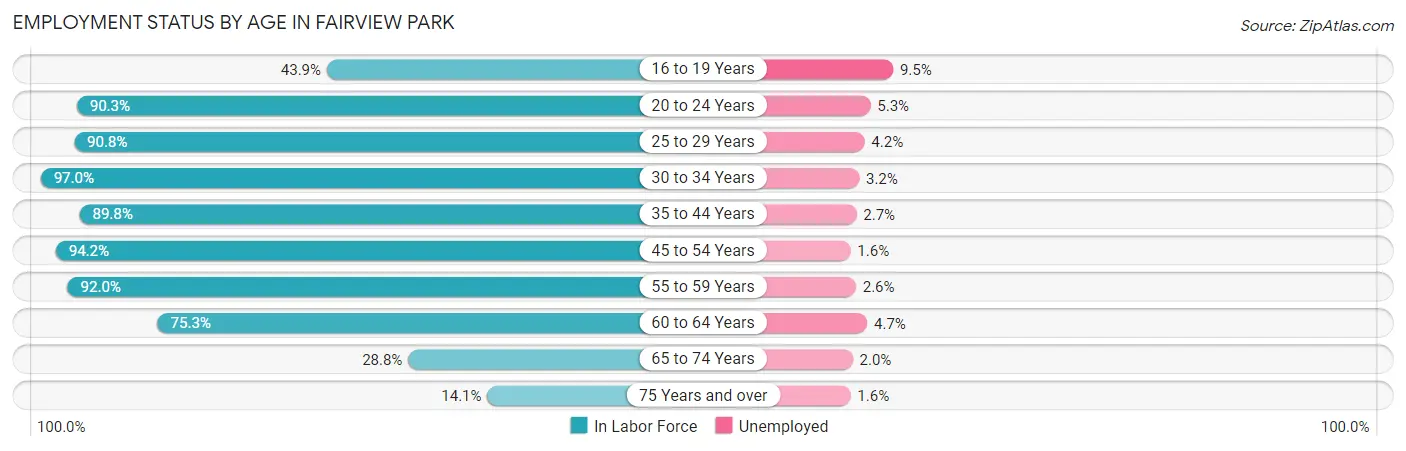
| Age Bracket | In Labor Force | Unemployed |
| 16 to 19 Years | 253 (43.9%) | 24 (9.5%) |
| 20 to 24 Years | 926 (90.3%) | 49 (5.3%) |
| 25 to 29 Years | 1,485 (90.8%) | 62 (4.2%) |
| 30 to 34 Years | 1,315 (97.0%) | 42 (3.2%) |
| 35 to 44 Years | 1,675 (89.8%) | 45 (2.7%) |
| 45 to 54 Years | 1,797 (94.2%) | 29 (1.6%) |
| 55 to 59 Years | 1,125 (92.0%) | 29 (2.6%) |
| 60 to 64 Years | 906 (75.3%) | 43 (4.7%) |
| 65 to 74 Years | 545 (28.8%) | 11 (2.0%) |
| 75 Years and over | 184 (14.1%) | 3 (1.6%) |
| Total | 10,216 (73.0%) | 337 (3.3%) |
Employment Status by Educational Attainment in Fairview Park
According to labor force statistics for Fairview Park, 90.3% of individuals (8,299) out of the total population between 25 and 64 years of age (9,190) are in the labor force, with 3.0% or 249 of them being unemployed. The group with the highest labor force participation rate are those with the educational attainment of bachelor's degree or higher, with 93.8% or 4,389 individuals in the labor force. Within the labor force, individuals with less than high school education have the highest percentage of unemployment, with 11.7% or 25 of them being unemployed.
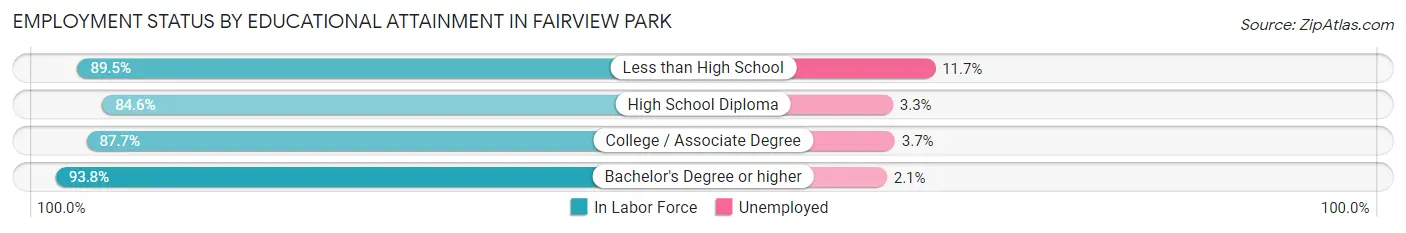
| Educational Attainment | In Labor Force | Unemployed |
| Less than High School | 214 (89.5%) | 28 (11.7%) |
| High School Diploma | 1,315 (84.6%) | 51 (3.3%) |
| College / Associate Degree | 2,384 (87.7%) | 101 (3.7%) |
| Bachelor's Degree or higher | 4,389 (93.8%) | 98 (2.1%) |
| Total | 8,299 (90.3%) | 276 (3.0%) |
Employment Occupations by Sex in Fairview Park
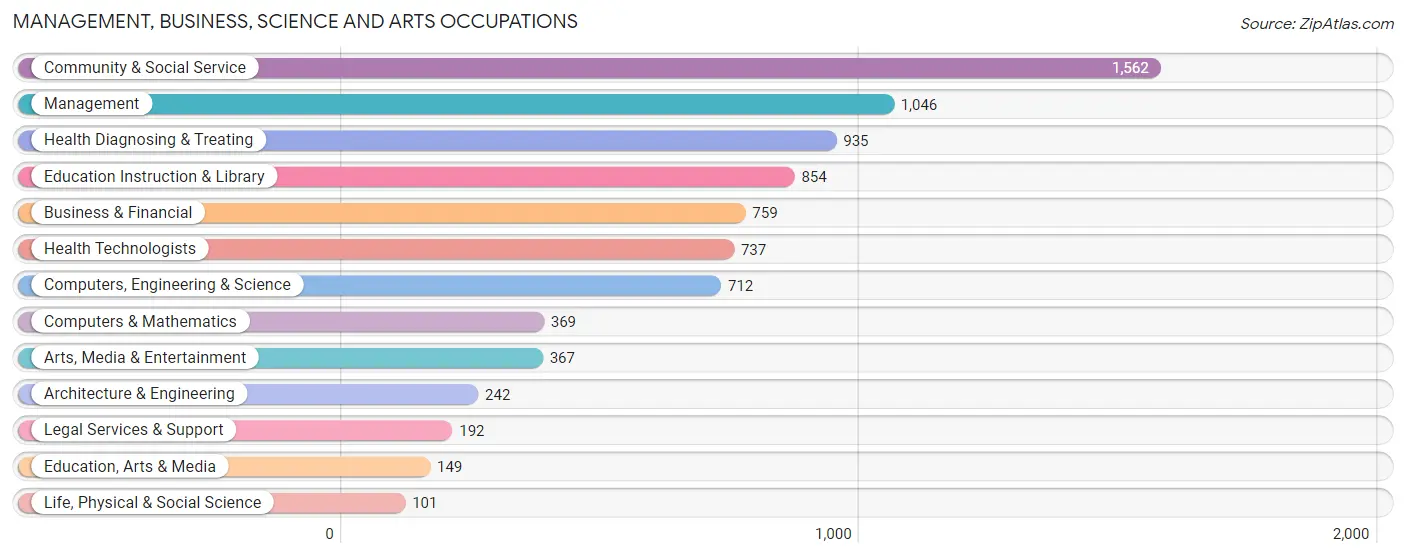
Management, Business, Science and Arts Occupations
The most common Management, Business, Science and Arts occupations in Fairview Park are Community & Social Service (1,562 | 15.8%), Management (1,046 | 10.6%), Health Diagnosing & Treating (935 | 9.5%), Education Instruction & Library (854 | 8.6%), and Business & Financial (759 | 7.7%).
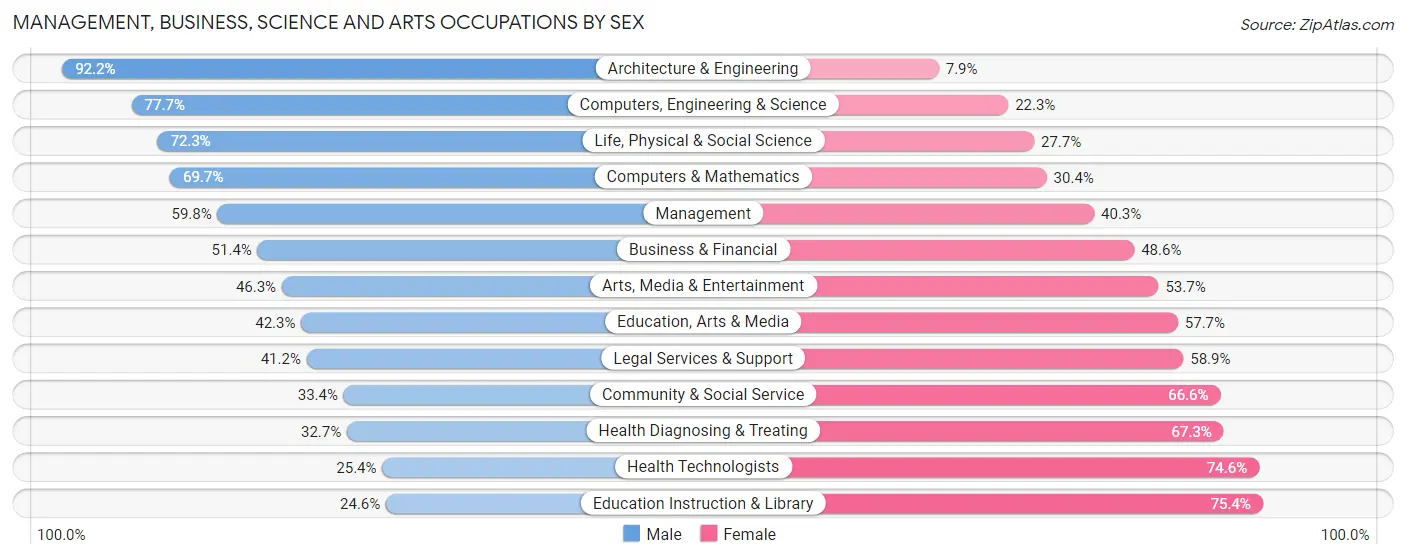
Management, Business, Science and Arts Occupations by Sex
Within the Management, Business, Science and Arts occupations in Fairview Park, the most male-oriented occupations are Architecture & Engineering (92.1%), Computers, Engineering & Science (77.7%), and Life, Physical & Social Science (72.3%), while the most female-oriented occupations are Education Instruction & Library (75.4%), Health Technologists (74.6%), and Health Diagnosing & Treating (67.3%).
| Occupation | Male | Female |
| Management | 625 (59.8%) | 421 (40.3%) |
| Business & Financial | 390 (51.4%) | 369 (48.6%) |
| Computers, Engineering & Science | 553 (77.7%) | 159 (22.3%) |
| Computers & Mathematics | 257 (69.7%) | 112 (30.3%) |
| Architecture & Engineering | 223 (92.1%) | 19 (7.9%) |
| Life, Physical & Social Science | 73 (72.3%) | 28 (27.7%) |
| Community & Social Service | 522 (33.4%) | 1,040 (66.6%) |
| Education, Arts & Media | 63 (42.3%) | 86 (57.7%) |
| Legal Services & Support | 79 (41.1%) | 113 (58.9%) |
| Education Instruction & Library | 210 (24.6%) | 644 (75.4%) |
| Arts, Media & Entertainment | 170 (46.3%) | 197 (53.7%) |
| Health Diagnosing & Treating | 306 (32.7%) | 629 (67.3%) |
| Health Technologists | 187 (25.4%) | 550 (74.6%) |
| Total (Category) | 2,396 (47.8%) | 2,618 (52.2%) |
| Total (Overall) | 4,896 (49.6%) | 4,978 (50.4%) |
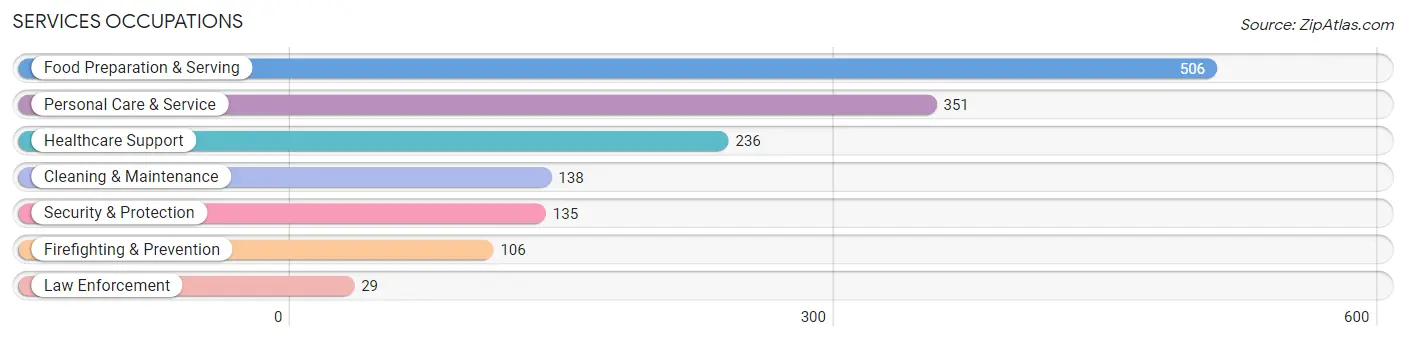
Services Occupations
The most common Services occupations in Fairview Park are Food Preparation & Serving (506 | 5.1%), Personal Care & Service (351 | 3.5%), Healthcare Support (236 | 2.4%), Cleaning & Maintenance (138 | 1.4%), and Security & Protection (135 | 1.4%).
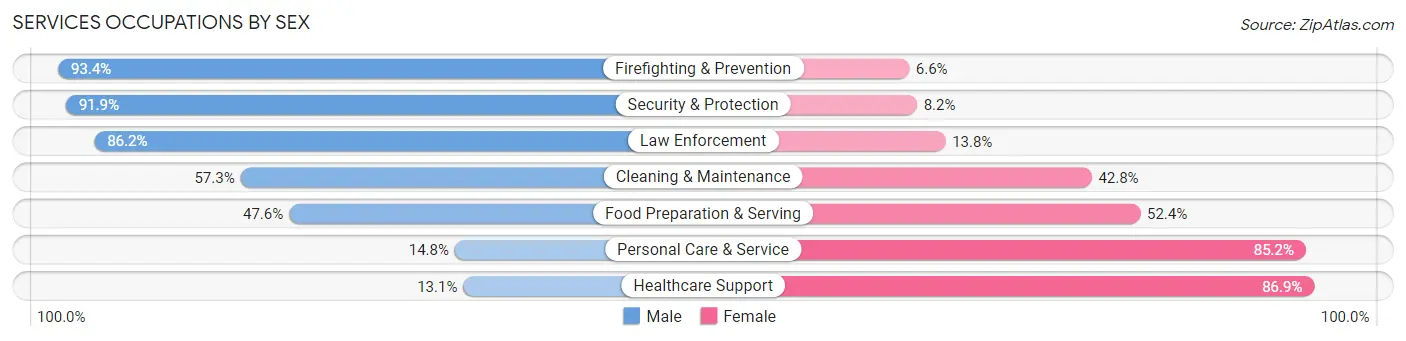
Services Occupations by Sex
Within the Services occupations in Fairview Park, the most male-oriented occupations are Firefighting & Prevention (93.4%), Security & Protection (91.8%), and Law Enforcement (86.2%), while the most female-oriented occupations are Healthcare Support (86.9%), Personal Care & Service (85.2%), and Food Preparation & Serving (52.4%).
| Occupation | Male | Female |
| Healthcare Support | 31 (13.1%) | 205 (86.9%) |
| Security & Protection | 124 (91.8%) | 11 (8.2%) |
| Firefighting & Prevention | 99 (93.4%) | 7 (6.6%) |
| Law Enforcement | 25 (86.2%) | 4 (13.8%) |
| Food Preparation & Serving | 241 (47.6%) | 265 (52.4%) |
| Cleaning & Maintenance | 79 (57.3%) | 59 (42.7%) |
| Personal Care & Service | 52 (14.8%) | 299 (85.2%) |
| Total (Category) | 527 (38.6%) | 839 (61.4%) |
| Total (Overall) | 4,896 (49.6%) | 4,978 (50.4%) |
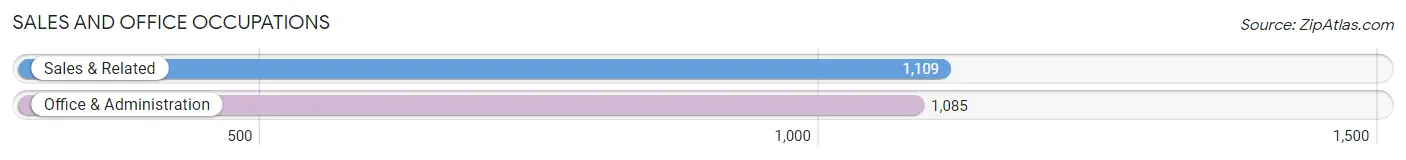
Sales and Office Occupations
The most common Sales and Office occupations in Fairview Park are Sales & Related (1,109 | 11.2%), and Office & Administration (1,085 | 11.0%).
Sales and Office Occupations by Sex
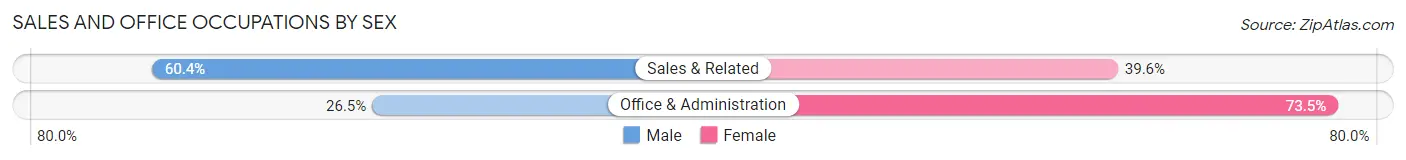
| Occupation | Male | Female |
| Sales & Related | 670 (60.4%) | 439 (39.6%) |
| Office & Administration | 288 (26.5%) | 797 (73.5%) |
| Total (Category) | 958 (43.7%) | 1,236 (56.3%) |
| Total (Overall) | 4,896 (49.6%) | 4,978 (50.4%) |
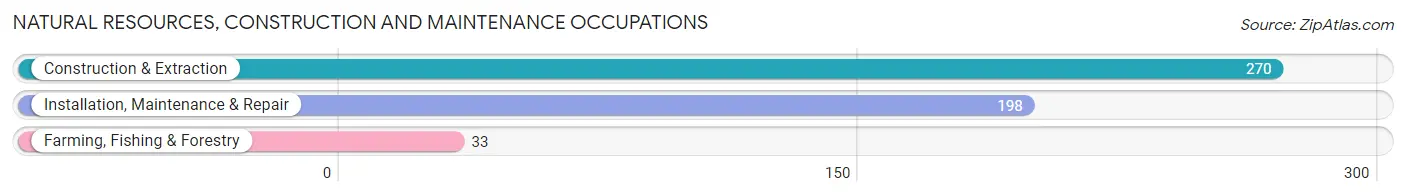
Natural Resources, Construction and Maintenance Occupations
The most common Natural Resources, Construction and Maintenance occupations in Fairview Park are Construction & Extraction (270 | 2.7%), Installation, Maintenance & Repair (198 | 2.0%), and Farming, Fishing & Forestry (33 | 0.3%).
Natural Resources, Construction and Maintenance Occupations by Sex
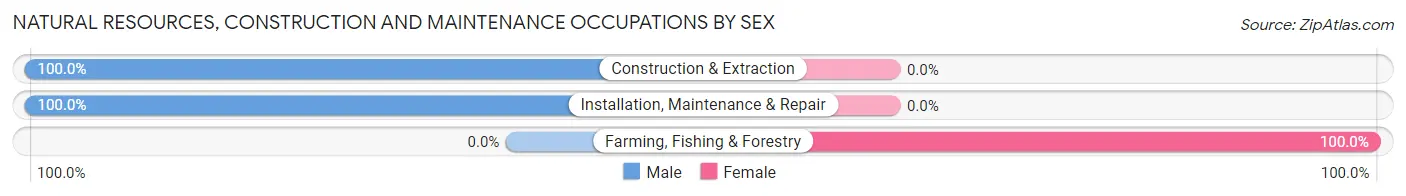
| Occupation | Male | Female |
| Farming, Fishing & Forestry | 0 (0.0%) | 33 (100.0%) |
| Construction & Extraction | 270 (100.0%) | 0 (0.0%) |
| Installation, Maintenance & Repair | 198 (100.0%) | 0 (0.0%) |
| Total (Category) | 468 (93.4%) | 33 (6.6%) |
| Total (Overall) | 4,896 (49.6%) | 4,978 (50.4%) |
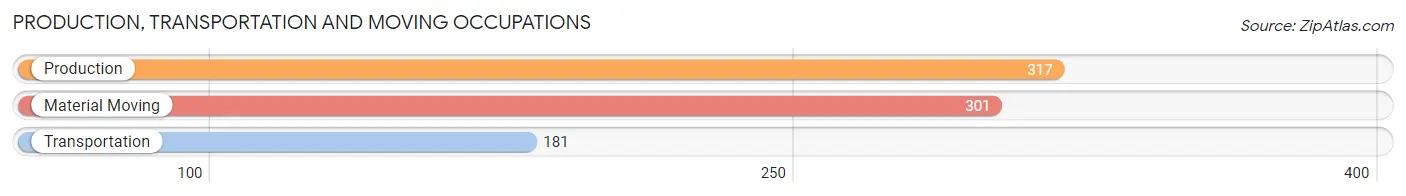
Production, Transportation and Moving Occupations
The most common Production, Transportation and Moving occupations in Fairview Park are Production (317 | 3.2%), Material Moving (301 | 3.0%), and Transportation (181 | 1.8%).
Production, Transportation and Moving Occupations by Sex
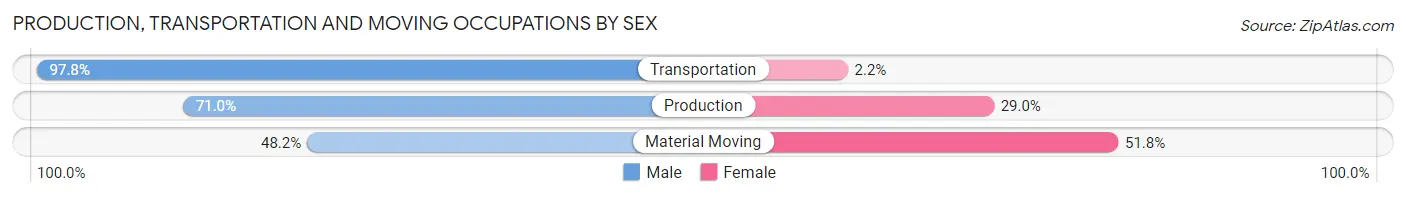
| Occupation | Male | Female |
| Production | 225 (71.0%) | 92 (29.0%) |
| Transportation | 177 (97.8%) | 4 (2.2%) |
| Material Moving | 145 (48.2%) | 156 (51.8%) |
| Total (Category) | 547 (68.5%) | 252 (31.5%) |
| Total (Overall) | 4,896 (49.6%) | 4,978 (50.4%) |
Employment Industries by Sex in Fairview Park
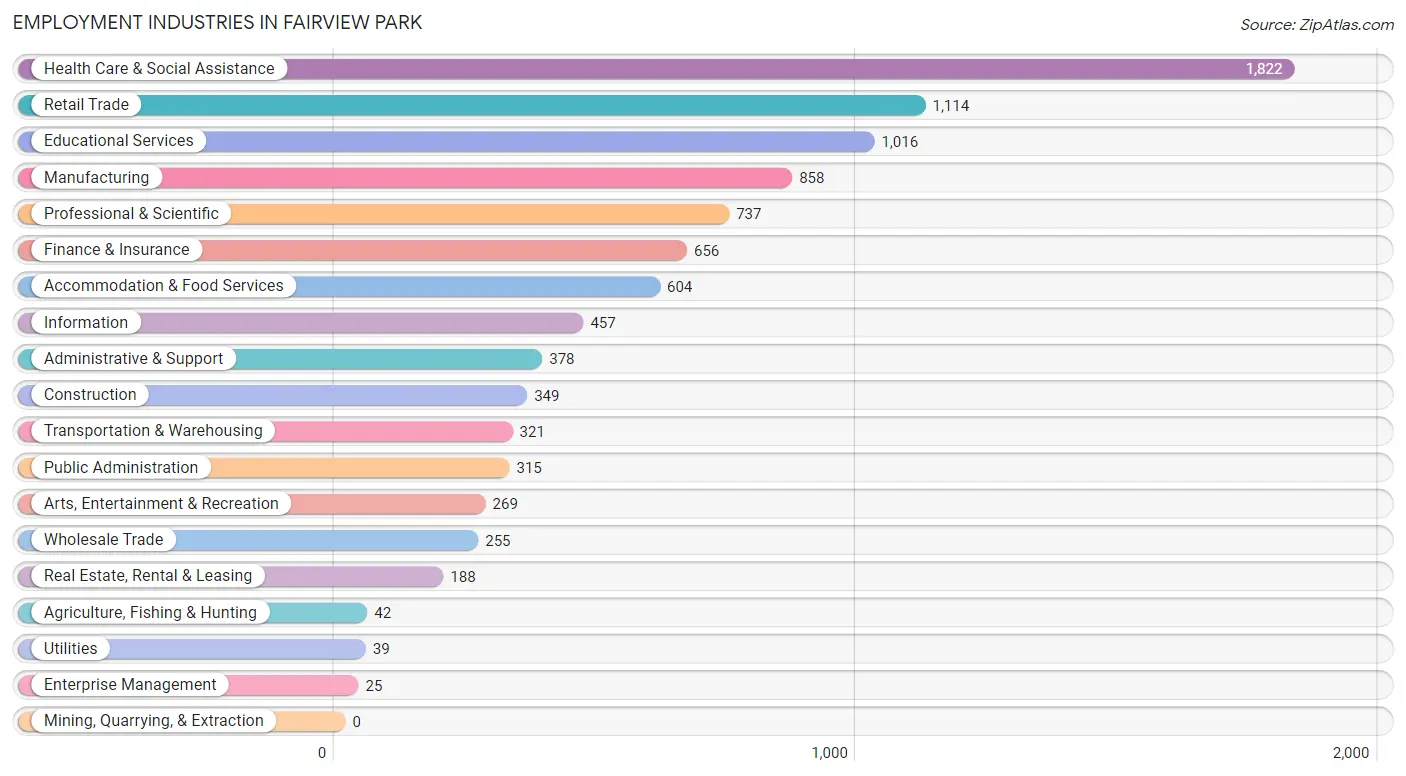
Employment Industries in Fairview Park
The major employment industries in Fairview Park include Health Care & Social Assistance (1,822 | 18.4%), Retail Trade (1,114 | 11.3%), Educational Services (1,016 | 10.3%), Manufacturing (858 | 8.7%), and Professional & Scientific (737 | 7.5%).
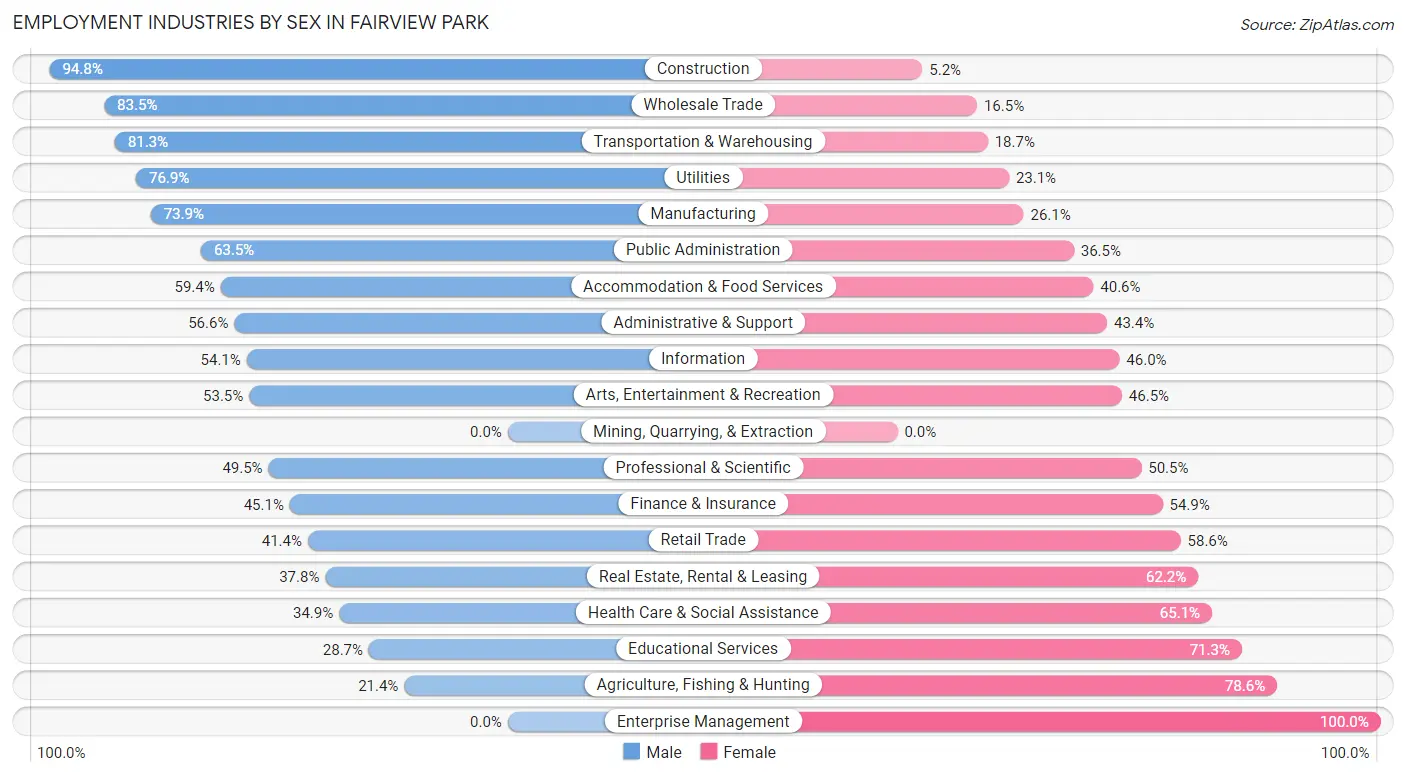
Employment Industries by Sex in Fairview Park
The Fairview Park industries that see more men than women are Construction (94.8%), Wholesale Trade (83.5%), and Transportation & Warehousing (81.3%), whereas the industries that tend to have a higher number of women are Enterprise Management (100.0%), Agriculture, Fishing & Hunting (78.6%), and Educational Services (71.3%).
| Industry | Male | Female |
| Agriculture, Fishing & Hunting | 9 (21.4%) | 33 (78.6%) |
| Mining, Quarrying, & Extraction | 0 (0.0%) | 0 (0.0%) |
| Construction | 331 (94.8%) | 18 (5.2%) |
| Manufacturing | 634 (73.9%) | 224 (26.1%) |
| Wholesale Trade | 213 (83.5%) | 42 (16.5%) |
| Retail Trade | 461 (41.4%) | 653 (58.6%) |
| Transportation & Warehousing | 261 (81.3%) | 60 (18.7%) |
| Utilities | 30 (76.9%) | 9 (23.1%) |
| Information | 247 (54.0%) | 210 (46.0%) |
| Finance & Insurance | 296 (45.1%) | 360 (54.9%) |
| Real Estate, Rental & Leasing | 71 (37.8%) | 117 (62.2%) |
| Professional & Scientific | 365 (49.5%) | 372 (50.5%) |
| Enterprise Management | 0 (0.0%) | 25 (100.0%) |
| Administrative & Support | 214 (56.6%) | 164 (43.4%) |
| Educational Services | 292 (28.7%) | 724 (71.3%) |
| Health Care & Social Assistance | 636 (34.9%) | 1,186 (65.1%) |
| Arts, Entertainment & Recreation | 144 (53.5%) | 125 (46.5%) |
| Accommodation & Food Services | 359 (59.4%) | 245 (40.6%) |
| Public Administration | 200 (63.5%) | 115 (36.5%) |
| Total | 4,896 (49.6%) | 4,978 (50.4%) |
Education in Fairview Park
School Enrollment in Fairview Park
The most common levels of schooling among the 3,657 students in Fairview Park are elementary school (868 | 23.7%), college / undergraduate (778 | 21.3%), and middle school (763 | 20.9%).
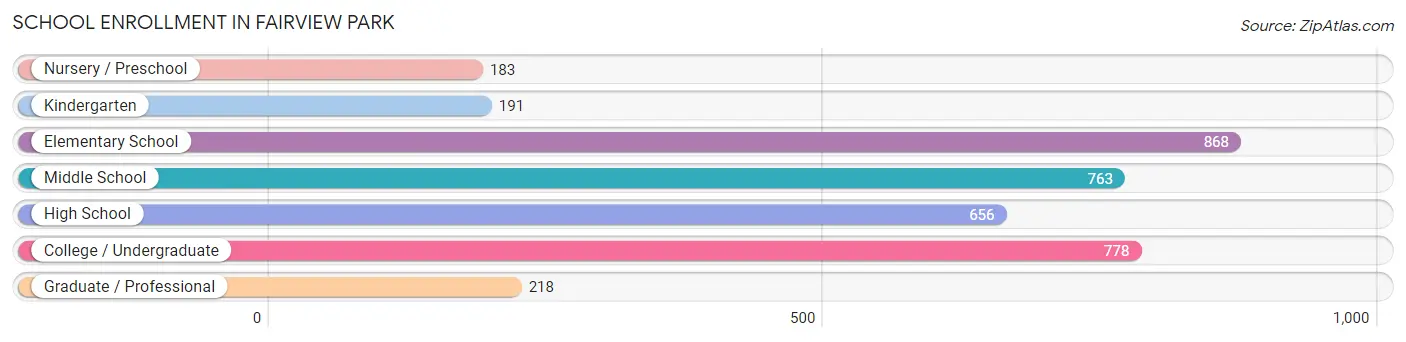
| School Level | # Students | % Students |
| Nursery / Preschool | 183 | 5.0% |
| Kindergarten | 191 | 5.2% |
| Elementary School | 868 | 23.7% |
| Middle School | 763 | 20.9% |
| High School | 656 | 17.9% |
| College / Undergraduate | 778 | 21.3% |
| Graduate / Professional | 218 | 6.0% |
| Total | 3,657 | 100.0% |
School Enrollment by Age by Funding Source in Fairview Park
Out of a total of 3,657 students who are enrolled in schools in Fairview Park, 731 (20.0%) attend a private institution, while the remaining 2,926 (80.0%) are enrolled in public schools. The age group of 25 to 34 year olds has the highest likelihood of being enrolled in private schools, with 104 (35.7% in the age bracket) enrolled. Conversely, the age group of 35 years and over has the lowest likelihood of being enrolled in a private school, with 160 (100.0% in the age bracket) attending a public institution.
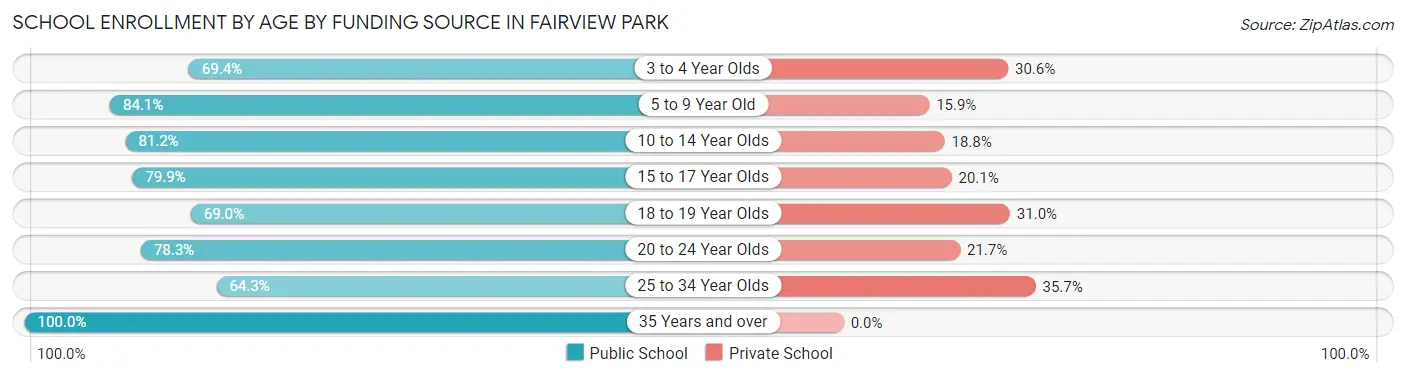
| Age Bracket | Public School | Private School |
| 3 to 4 Year Olds | 68 (69.4%) | 30 (30.6%) |
| 5 to 9 Year Old | 929 (84.1%) | 176 (15.9%) |
| 10 to 14 Year Olds | 726 (81.2%) | 168 (18.8%) |
| 15 to 17 Year Olds | 338 (79.9%) | 85 (20.1%) |
| 18 to 19 Year Olds | 136 (69.0%) | 61 (31.0%) |
| 20 to 24 Year Olds | 383 (78.3%) | 106 (21.7%) |
| 25 to 34 Year Olds | 187 (64.3%) | 104 (35.7%) |
| 35 Years and over | 160 (100.0%) | 0 (0.0%) |
| Total | 2,926 (80.0%) | 731 (20.0%) |
Educational Attainment by Field of Study in Fairview Park
Business (1,305 | 21.3%), education (808 | 13.2%), science & technology (802 | 13.1%), engineering (421 | 6.9%), and social sciences (394 | 6.5%) are the most common fields of study among 6,112 individuals in Fairview Park who have obtained a bachelor's degree or higher.
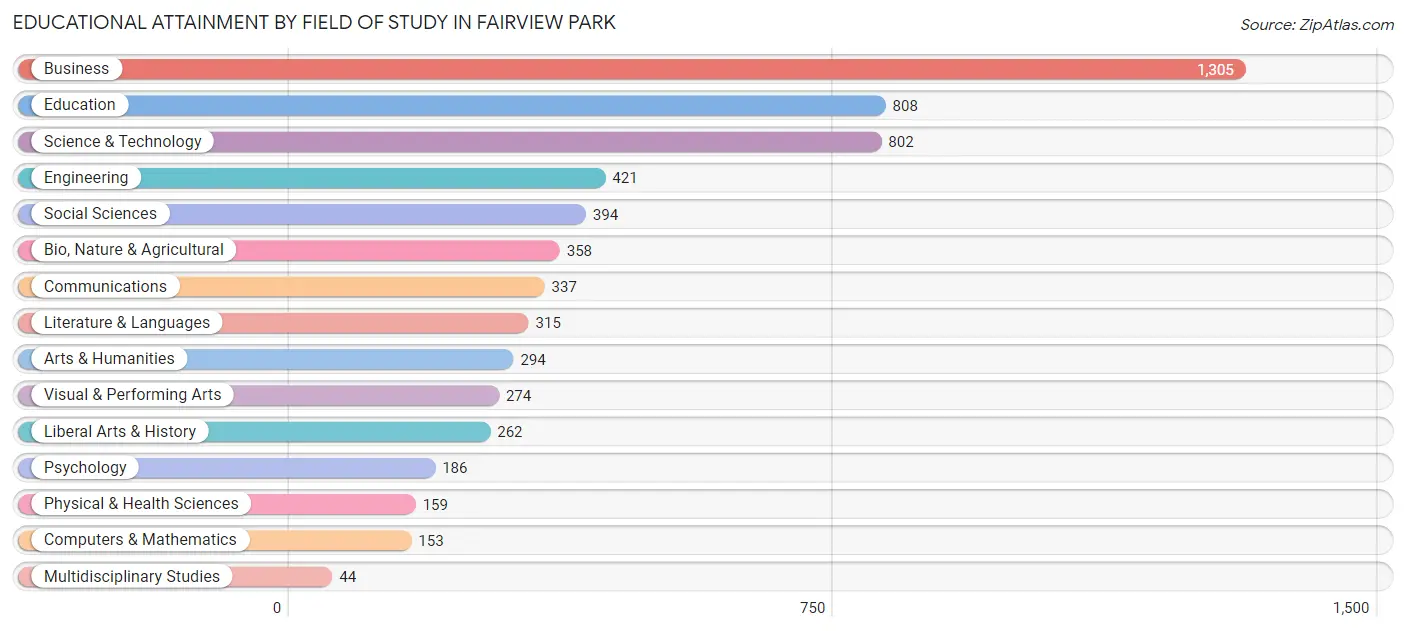
| Field of Study | # Graduates | % Graduates |
| Computers & Mathematics | 153 | 2.5% |
| Bio, Nature & Agricultural | 358 | 5.9% |
| Physical & Health Sciences | 159 | 2.6% |
| Psychology | 186 | 3.0% |
| Social Sciences | 394 | 6.5% |
| Engineering | 421 | 6.9% |
| Multidisciplinary Studies | 44 | 0.7% |
| Science & Technology | 802 | 13.1% |
| Business | 1,305 | 21.3% |
| Education | 808 | 13.2% |
| Literature & Languages | 315 | 5.1% |
| Liberal Arts & History | 262 | 4.3% |
| Visual & Performing Arts | 274 | 4.5% |
| Communications | 337 | 5.5% |
| Arts & Humanities | 294 | 4.8% |
| Total | 6,112 | 100.0% |
Transportation & Commute in Fairview Park
Vehicle Availability by Sex in Fairview Park
The most prevalent vehicle ownership categories in Fairview Park are males with 2 vehicles (2,287, accounting for 47.0%) and females with 2 vehicles (2,227, making up 46.3%).
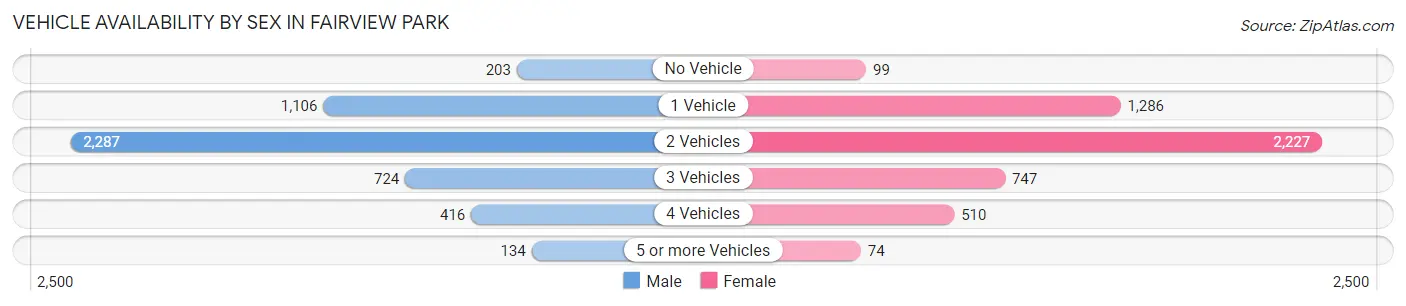
| Vehicles Available | Male | Female |
| No Vehicle | 203 (4.2%) | 99 (2.0%) |
| 1 Vehicle | 1,106 (22.7%) | 1,286 (26.0%) |
| 2 Vehicles | 2,287 (47.0%) | 2,227 (45.1%) |
| 3 Vehicles | 724 (14.9%) | 747 (15.1%) |
| 4 Vehicles | 416 (8.5%) | 510 (10.3%) |
| 5 or more Vehicles | 134 (2.8%) | 74 (1.5%) |
| Total | 4,870 (100.0%) | 4,943 (100.0%) |
Commute Time in Fairview Park
The most frequently occuring commute durations in Fairview Park are 15 to 19 minutes (1,809 commuters, 21.2%), 20 to 24 minutes (1,486 commuters, 17.5%), and 30 to 34 minutes (1,255 commuters, 14.7%).
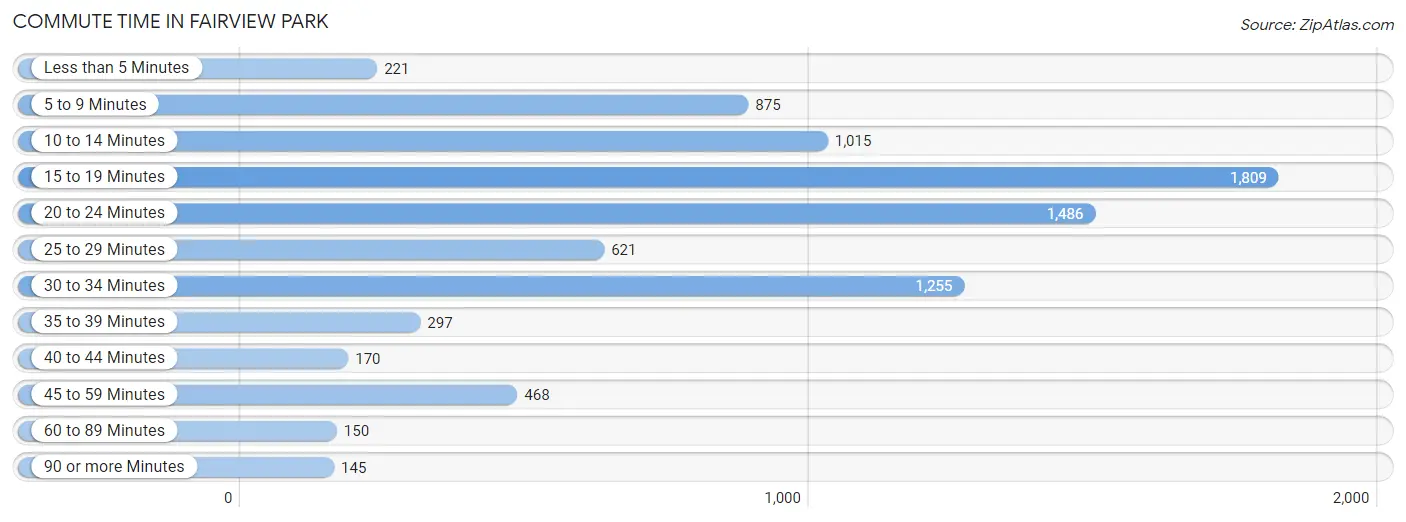
| Commute Time | # Commuters | % Commuters |
| Less than 5 Minutes | 221 | 2.6% |
| 5 to 9 Minutes | 875 | 10.3% |
| 10 to 14 Minutes | 1,015 | 11.9% |
| 15 to 19 Minutes | 1,809 | 21.2% |
| 20 to 24 Minutes | 1,486 | 17.5% |
| 25 to 29 Minutes | 621 | 7.3% |
| 30 to 34 Minutes | 1,255 | 14.7% |
| 35 to 39 Minutes | 297 | 3.5% |
| 40 to 44 Minutes | 170 | 2.0% |
| 45 to 59 Minutes | 468 | 5.5% |
| 60 to 89 Minutes | 150 | 1.8% |
| 90 or more Minutes | 145 | 1.7% |
Commute Time by Sex in Fairview Park
The most common commute times in Fairview Park are 15 to 19 minutes (851 commuters, 20.1%) for males and 15 to 19 minutes (958 commuters, 22.4%) for females.
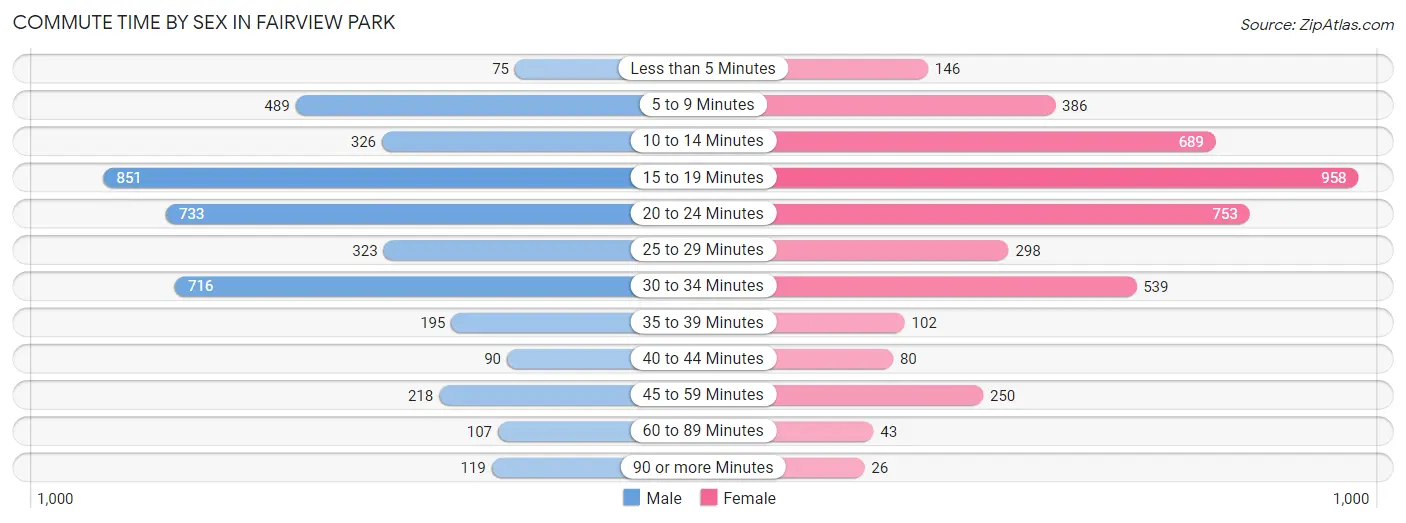
| Commute Time | Male | Female |
| Less than 5 Minutes | 75 (1.8%) | 146 (3.4%) |
| 5 to 9 Minutes | 489 (11.5%) | 386 (9.0%) |
| 10 to 14 Minutes | 326 (7.7%) | 689 (16.1%) |
| 15 to 19 Minutes | 851 (20.1%) | 958 (22.4%) |
| 20 to 24 Minutes | 733 (17.3%) | 753 (17.6%) |
| 25 to 29 Minutes | 323 (7.6%) | 298 (7.0%) |
| 30 to 34 Minutes | 716 (16.9%) | 539 (12.6%) |
| 35 to 39 Minutes | 195 (4.6%) | 102 (2.4%) |
| 40 to 44 Minutes | 90 (2.1%) | 80 (1.9%) |
| 45 to 59 Minutes | 218 (5.1%) | 250 (5.9%) |
| 60 to 89 Minutes | 107 (2.5%) | 43 (1.0%) |
| 90 or more Minutes | 119 (2.8%) | 26 (0.6%) |
Time of Departure to Work by Sex in Fairview Park
The most frequent times of departure to work in Fairview Park are 7:30 AM to 7:59 AM (586, 13.8%) for males and 7:00 AM to 7:29 AM (816, 19.1%) for females.
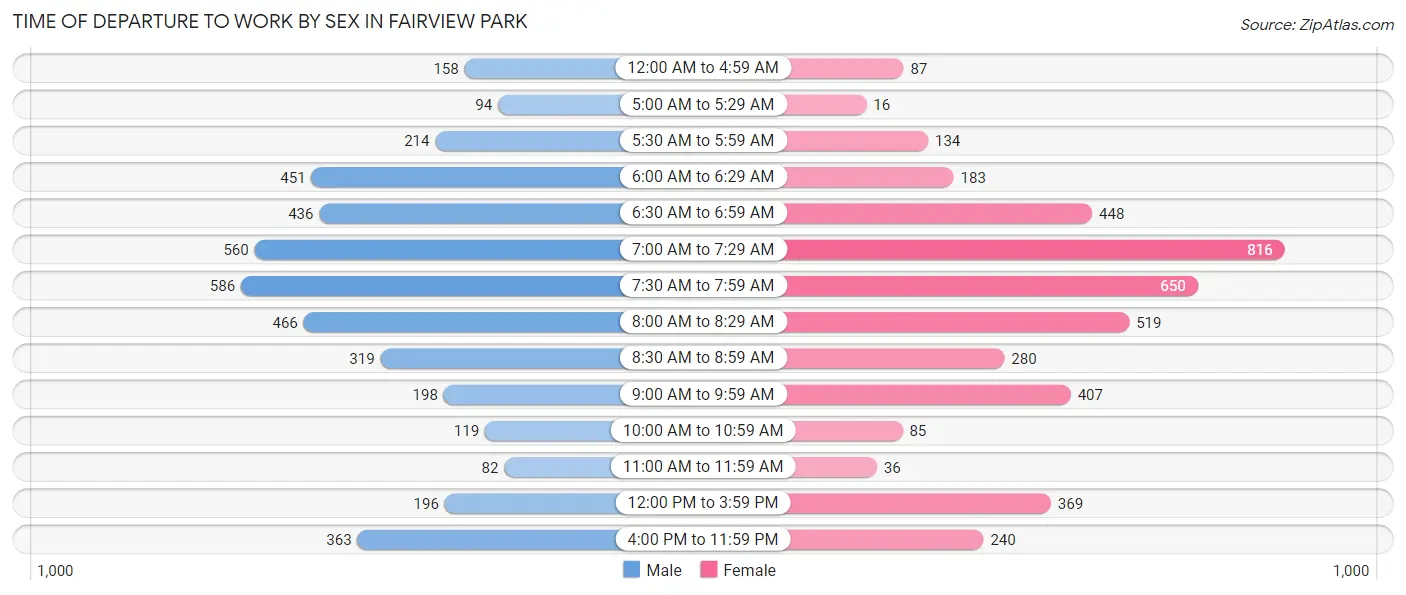
| Time of Departure | Male | Female |
| 12:00 AM to 4:59 AM | 158 (3.7%) | 87 (2.0%) |
| 5:00 AM to 5:29 AM | 94 (2.2%) | 16 (0.4%) |
| 5:30 AM to 5:59 AM | 214 (5.0%) | 134 (3.1%) |
| 6:00 AM to 6:29 AM | 451 (10.6%) | 183 (4.3%) |
| 6:30 AM to 6:59 AM | 436 (10.3%) | 448 (10.5%) |
| 7:00 AM to 7:29 AM | 560 (13.2%) | 816 (19.1%) |
| 7:30 AM to 7:59 AM | 586 (13.8%) | 650 (15.2%) |
| 8:00 AM to 8:29 AM | 466 (11.0%) | 519 (12.1%) |
| 8:30 AM to 8:59 AM | 319 (7.5%) | 280 (6.6%) |
| 9:00 AM to 9:59 AM | 198 (4.7%) | 407 (9.5%) |
| 10:00 AM to 10:59 AM | 119 (2.8%) | 85 (2.0%) |
| 11:00 AM to 11:59 AM | 82 (1.9%) | 36 (0.8%) |
| 12:00 PM to 3:59 PM | 196 (4.6%) | 369 (8.6%) |
| 4:00 PM to 11:59 PM | 363 (8.6%) | 240 (5.6%) |
| Total | 4,242 (100.0%) | 4,270 (100.0%) |
Housing Occupancy in Fairview Park
Occupancy by Ownership in Fairview Park
Of the total 7,727 dwellings in Fairview Park, owner-occupied units account for 5,377 (69.6%), while renter-occupied units make up 2,350 (30.4%).
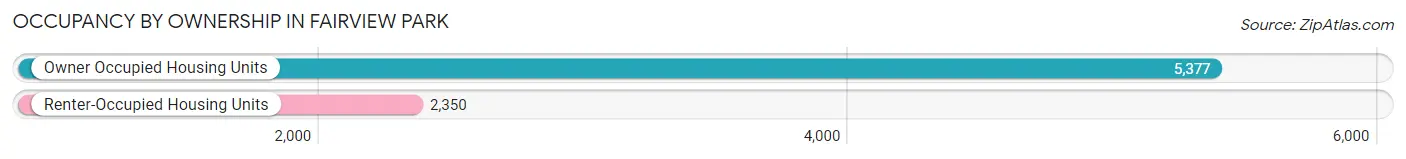
| Occupancy | # Housing Units | % Housing Units |
| Owner Occupied Housing Units | 5,377 | 69.6% |
| Renter-Occupied Housing Units | 2,350 | 30.4% |
| Total Occupied Housing Units | 7,727 | 100.0% |
Occupancy by Household Size in Fairview Park
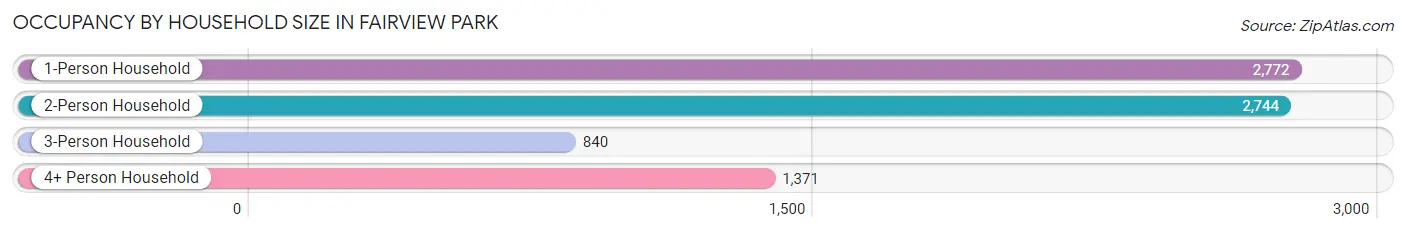
| Household Size | # Housing Units | % Housing Units |
| 1-Person Household | 2,772 | 35.9% |
| 2-Person Household | 2,744 | 35.5% |
| 3-Person Household | 840 | 10.9% |
| 4+ Person Household | 1,371 | 17.7% |
| Total Housing Units | 7,727 | 100.0% |
Occupancy by Ownership by Household Size in Fairview Park
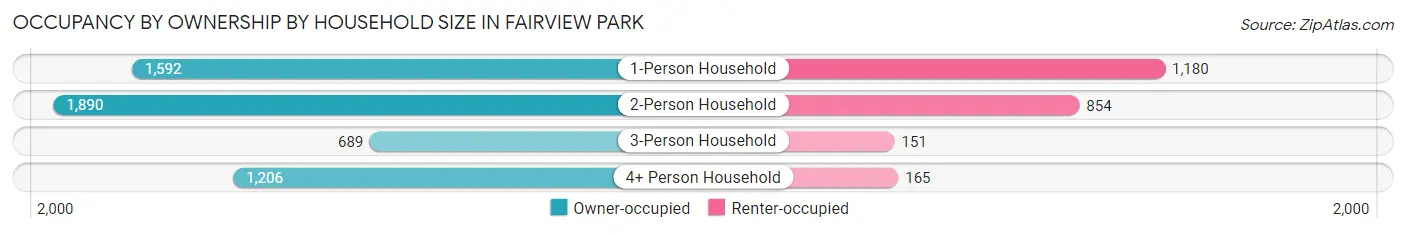
| Household Size | Owner-occupied | Renter-occupied |
| 1-Person Household | 1,592 (57.4%) | 1,180 (42.6%) |
| 2-Person Household | 1,890 (68.9%) | 854 (31.1%) |
| 3-Person Household | 689 (82.0%) | 151 (18.0%) |
| 4+ Person Household | 1,206 (88.0%) | 165 (12.0%) |
| Total Housing Units | 5,377 (69.6%) | 2,350 (30.4%) |
Occupancy by Educational Attainment in Fairview Park
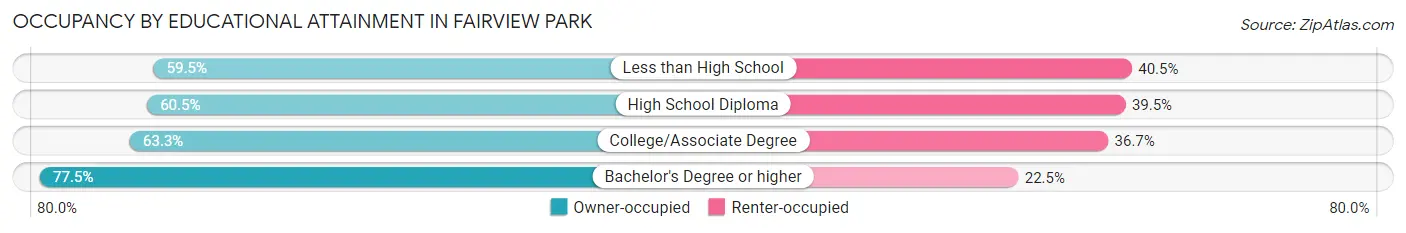
| Household Size | Owner-occupied | Renter-occupied |
| Less than High School | 128 (59.5%) | 87 (40.5%) |
| High School Diploma | 873 (60.5%) | 569 (39.5%) |
| College/Associate Degree | 1,469 (63.3%) | 852 (36.7%) |
| Bachelor's Degree or higher | 2,907 (77.5%) | 842 (22.5%) |
Occupancy by Age of Householder in Fairview Park
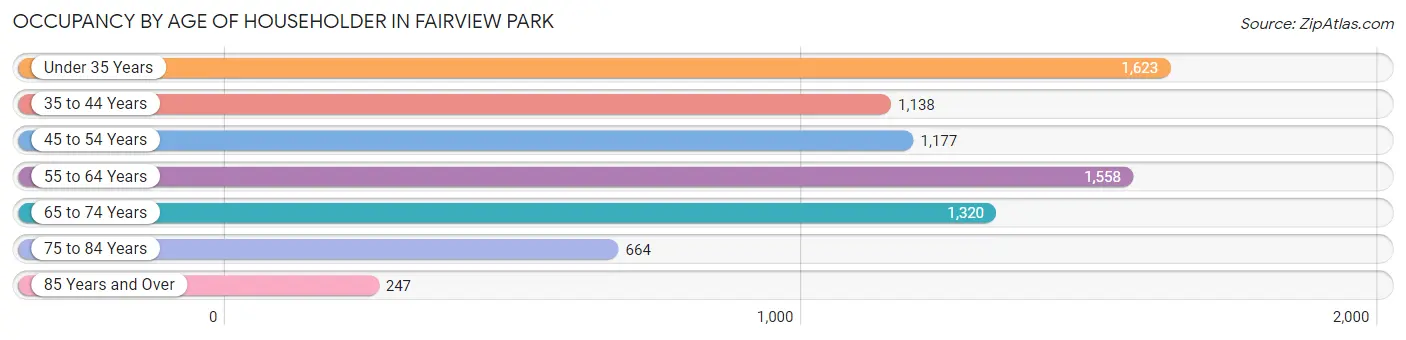
| Age Bracket | # Households | % Households |
| Under 35 Years | 1,623 | 21.0% |
| 35 to 44 Years | 1,138 | 14.7% |
| 45 to 54 Years | 1,177 | 15.2% |
| 55 to 64 Years | 1,558 | 20.2% |
| 65 to 74 Years | 1,320 | 17.1% |
| 75 to 84 Years | 664 | 8.6% |
| 85 Years and Over | 247 | 3.2% |
| Total | 7,727 | 100.0% |
Housing Finances in Fairview Park
Median Income by Occupancy in Fairview Park
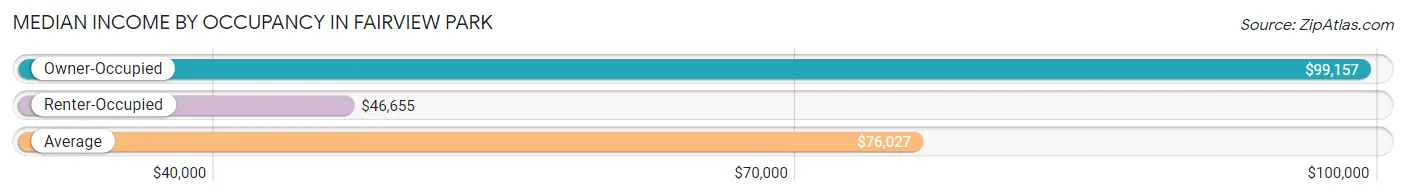
| Occupancy Type | # Households | Median Income |
| Owner-Occupied | 5,377 (69.6%) | $99,157 |
| Renter-Occupied | 2,350 (30.4%) | $46,655 |
| Average | 7,727 (100.0%) | $76,027 |
Occupancy by Householder Income Bracket in Fairview Park
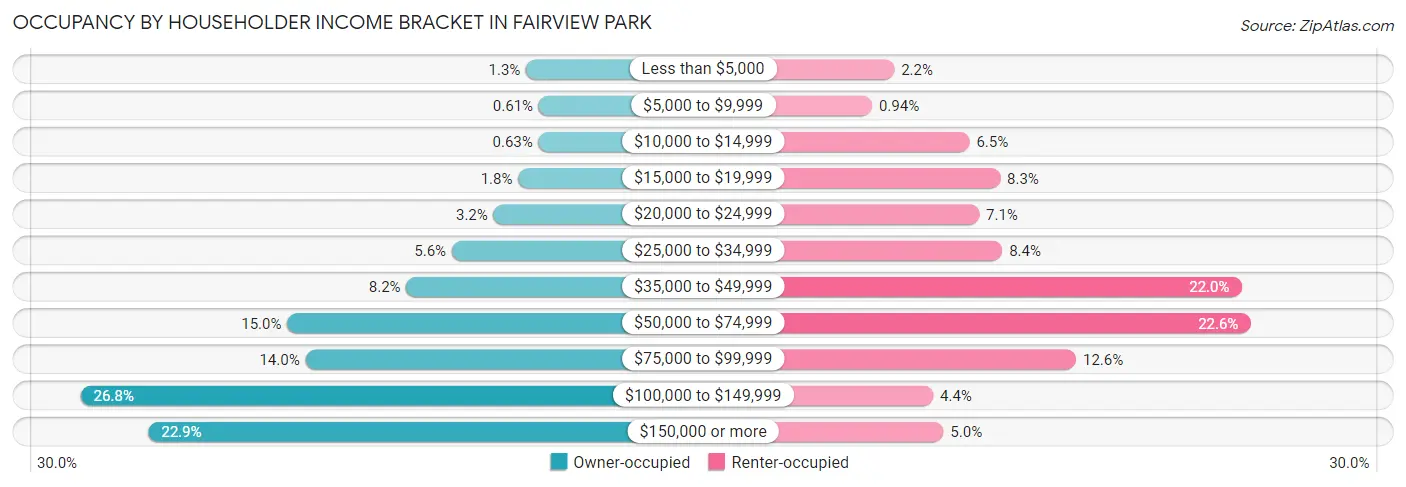
| Income Bracket | Owner-occupied | Renter-occupied |
| Less than $5,000 | 72 (1.3%) | 52 (2.2%) |
| $5,000 to $9,999 | 33 (0.6%) | 22 (0.9%) |
| $10,000 to $14,999 | 34 (0.6%) | 153 (6.5%) |
| $15,000 to $19,999 | 96 (1.8%) | 194 (8.3%) |
| $20,000 to $24,999 | 172 (3.2%) | 166 (7.1%) |
| $25,000 to $34,999 | 300 (5.6%) | 197 (8.4%) |
| $35,000 to $49,999 | 440 (8.2%) | 518 (22.0%) |
| $50,000 to $74,999 | 806 (15.0%) | 530 (22.6%) |
| $75,000 to $99,999 | 750 (14.0%) | 296 (12.6%) |
| $100,000 to $149,999 | 1,441 (26.8%) | 104 (4.4%) |
| $150,000 or more | 1,233 (22.9%) | 118 (5.0%) |
| Total | 5,377 (100.0%) | 2,350 (100.0%) |
Monthly Housing Cost Tiers in Fairview Park
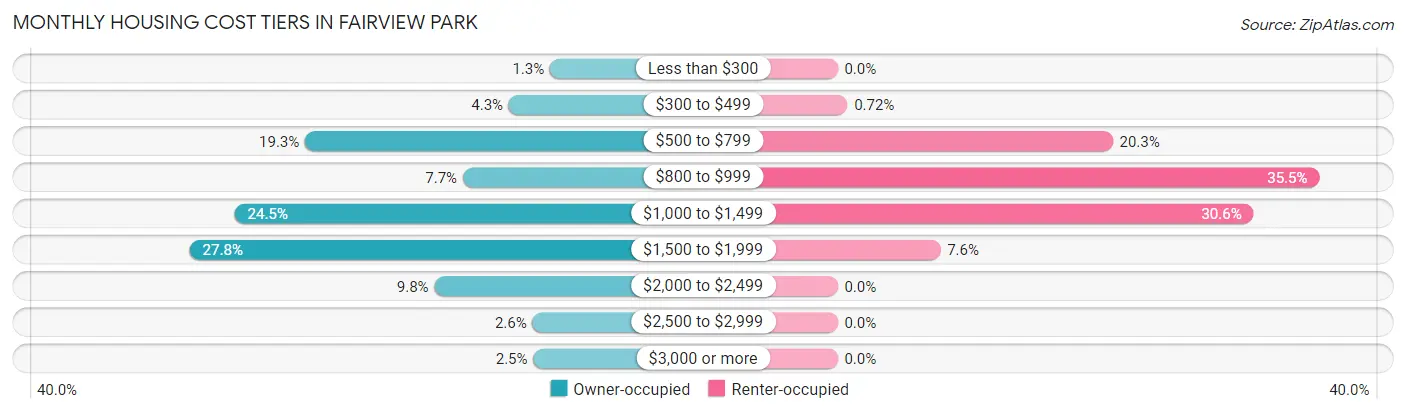
| Monthly Cost | Owner-occupied | Renter-occupied |
| Less than $300 | 70 (1.3%) | 0 (0.0%) |
| $300 to $499 | 233 (4.3%) | 17 (0.7%) |
| $500 to $799 | 1,040 (19.3%) | 476 (20.3%) |
| $800 to $999 | 415 (7.7%) | 834 (35.5%) |
| $1,000 to $1,499 | 1,319 (24.5%) | 720 (30.6%) |
| $1,500 to $1,999 | 1,497 (27.8%) | 178 (7.6%) |
| $2,000 to $2,499 | 528 (9.8%) | 0 (0.0%) |
| $2,500 to $2,999 | 139 (2.6%) | 0 (0.0%) |
| $3,000 or more | 136 (2.5%) | 0 (0.0%) |
| Total | 5,377 (100.0%) | 2,350 (100.0%) |
Physical Housing Characteristics in Fairview Park
Housing Structures in Fairview Park
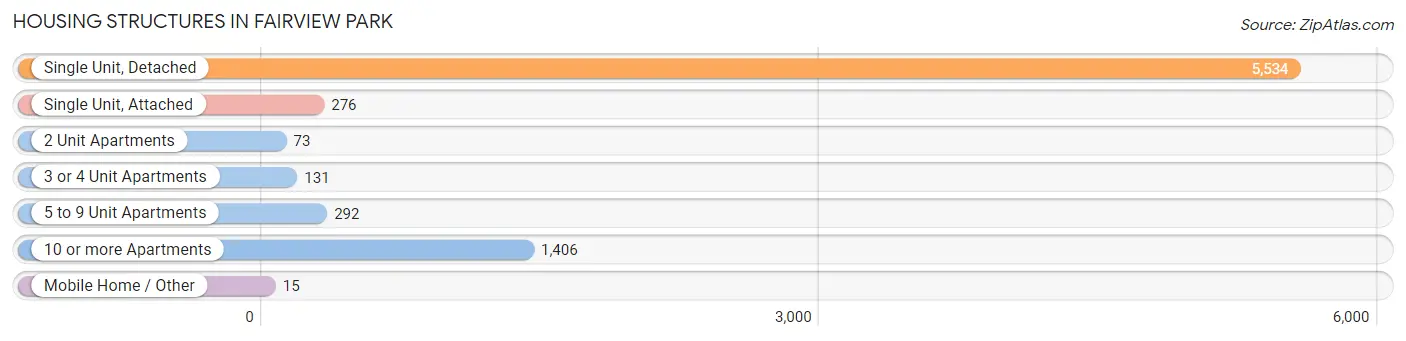
| Structure Type | # Housing Units | % Housing Units |
| Single Unit, Detached | 5,534 | 71.6% |
| Single Unit, Attached | 276 | 3.6% |
| 2 Unit Apartments | 73 | 0.9% |
| 3 or 4 Unit Apartments | 131 | 1.7% |
| 5 to 9 Unit Apartments | 292 | 3.8% |
| 10 or more Apartments | 1,406 | 18.2% |
| Mobile Home / Other | 15 | 0.2% |
| Total | 7,727 | 100.0% |
Housing Structures by Occupancy in Fairview Park
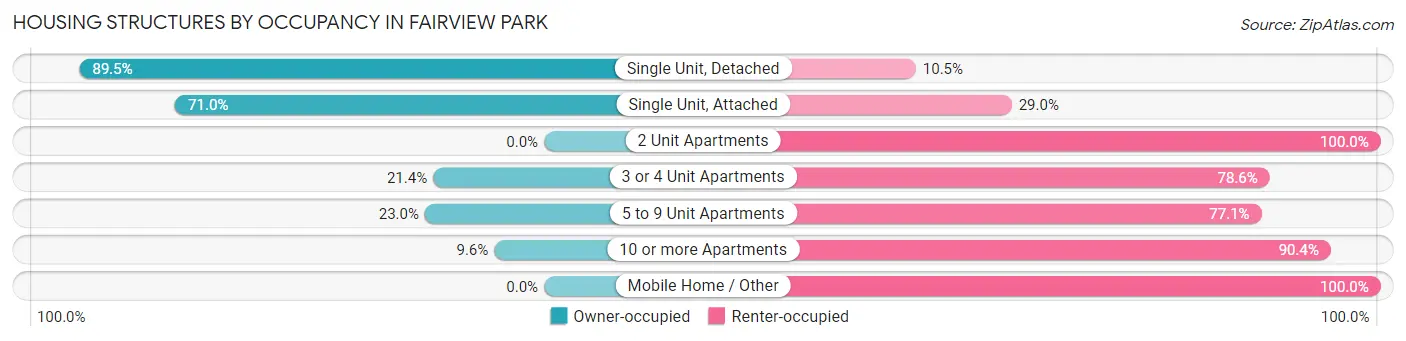
| Structure Type | Owner-occupied | Renter-occupied |
| Single Unit, Detached | 4,951 (89.5%) | 583 (10.5%) |
| Single Unit, Attached | 196 (71.0%) | 80 (29.0%) |
| 2 Unit Apartments | 0 (0.0%) | 73 (100.0%) |
| 3 or 4 Unit Apartments | 28 (21.4%) | 103 (78.6%) |
| 5 to 9 Unit Apartments | 67 (23.0%) | 225 (77.0%) |
| 10 or more Apartments | 135 (9.6%) | 1,271 (90.4%) |
| Mobile Home / Other | 0 (0.0%) | 15 (100.0%) |
| Total | 5,377 (69.6%) | 2,350 (30.4%) |
Housing Structures by Number of Rooms in Fairview Park
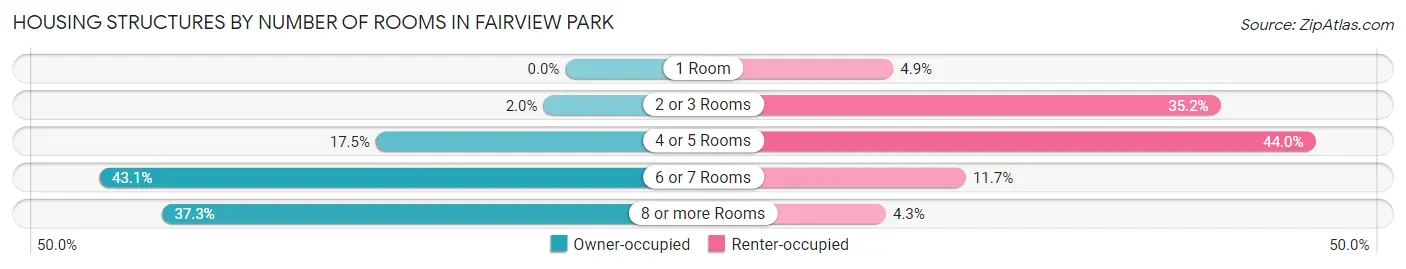
| Number of Rooms | Owner-occupied | Renter-occupied |
| 1 Room | 0 (0.0%) | 116 (4.9%) |
| 2 or 3 Rooms | 109 (2.0%) | 827 (35.2%) |
| 4 or 5 Rooms | 942 (17.5%) | 1,033 (44.0%) |
| 6 or 7 Rooms | 2,318 (43.1%) | 274 (11.7%) |
| 8 or more Rooms | 2,008 (37.3%) | 100 (4.3%) |
| Total | 5,377 (100.0%) | 2,350 (100.0%) |
Housing Structure by Heating Type in Fairview Park
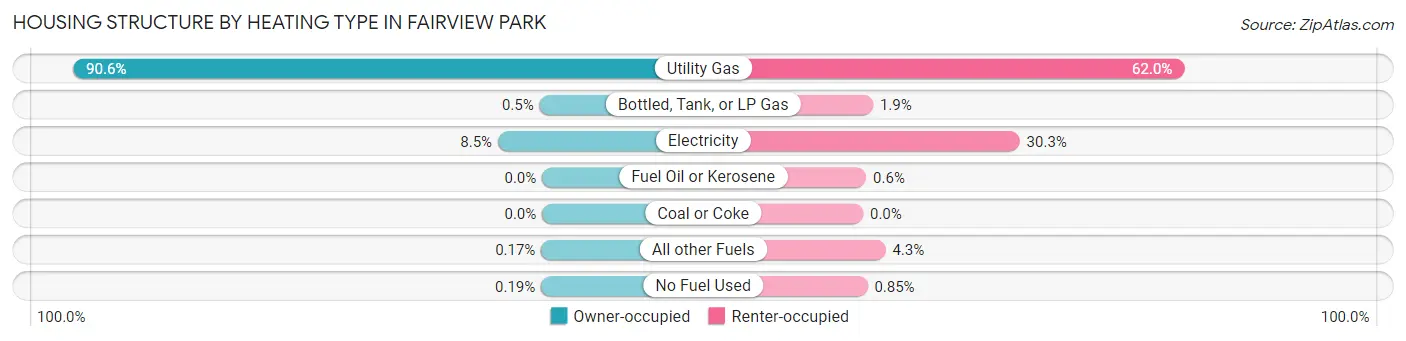
| Heating Type | Owner-occupied | Renter-occupied |
| Utility Gas | 4,872 (90.6%) | 1,458 (62.0%) |
| Bottled, Tank, or LP Gas | 27 (0.5%) | 45 (1.9%) |
| Electricity | 459 (8.5%) | 711 (30.3%) |
| Fuel Oil or Kerosene | 0 (0.0%) | 14 (0.6%) |
| Coal or Coke | 0 (0.0%) | 0 (0.0%) |
| All other Fuels | 9 (0.2%) | 102 (4.3%) |
| No Fuel Used | 10 (0.2%) | 20 (0.9%) |
| Total | 5,377 (100.0%) | 2,350 (100.0%) |
Household Vehicle Usage in Fairview Park
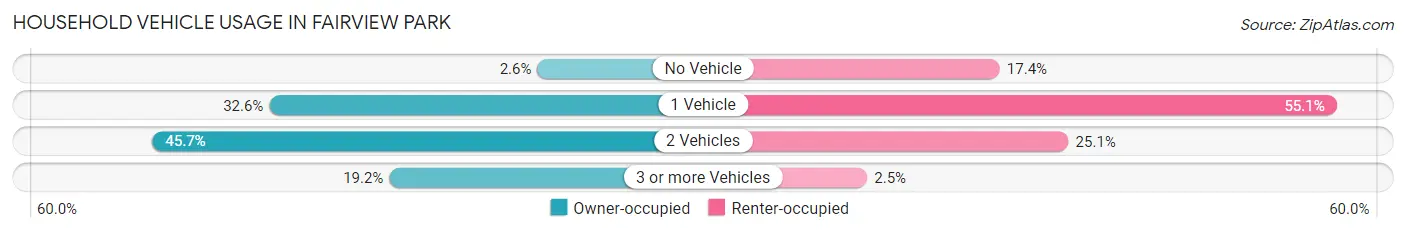
| Vehicles per Household | Owner-occupied | Renter-occupied |
| No Vehicle | 138 (2.6%) | 408 (17.4%) |
| 1 Vehicle | 1,753 (32.6%) | 1,294 (55.1%) |
| 2 Vehicles | 2,456 (45.7%) | 589 (25.1%) |
| 3 or more Vehicles | 1,030 (19.2%) | 59 (2.5%) |
| Total | 5,377 (100.0%) | 2,350 (100.0%) |
Real Estate & Mortgages in Fairview Park
Real Estate and Mortgage Overview in Fairview Park
| Characteristic | Without Mortgage | With Mortgage |
| Housing Units | 1,835 | 3,542 |
| Median Property Value | $195,600 | $222,100 |
| Median Household Income | $81,393 | $865 |
| Monthly Housing Costs | $669 | $136 |
| Real Estate Taxes | $4,615 | $16 |
Property Value by Mortgage Status in Fairview Park
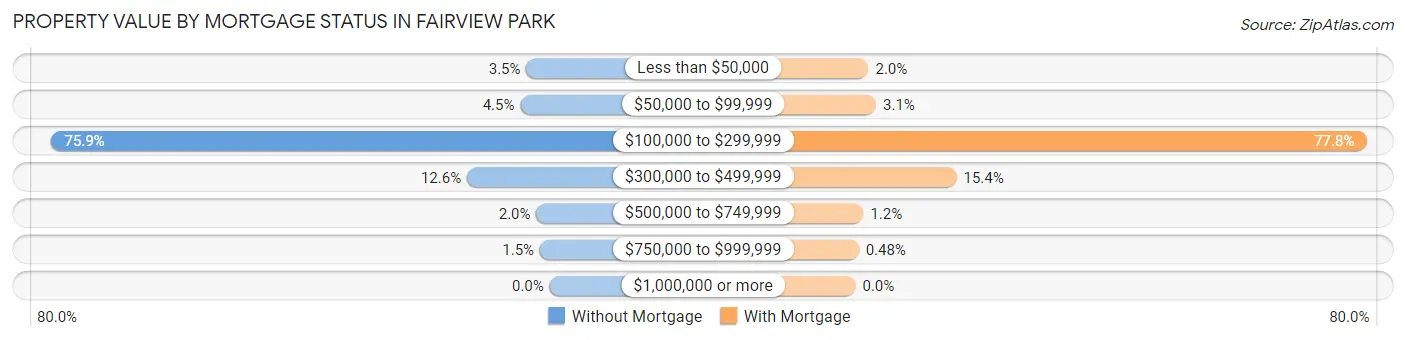
| Property Value | Without Mortgage | With Mortgage |
| Less than $50,000 | 65 (3.5%) | 70 (2.0%) |
| $50,000 to $99,999 | 82 (4.5%) | 111 (3.1%) |
| $100,000 to $299,999 | 1,393 (75.9%) | 2,756 (77.8%) |
| $300,000 to $499,999 | 231 (12.6%) | 545 (15.4%) |
| $500,000 to $749,999 | 37 (2.0%) | 43 (1.2%) |
| $750,000 to $999,999 | 27 (1.5%) | 17 (0.5%) |
| $1,000,000 or more | 0 (0.0%) | 0 (0.0%) |
| Total | 1,835 (100.0%) | 3,542 (100.0%) |
Household Income by Mortgage Status in Fairview Park
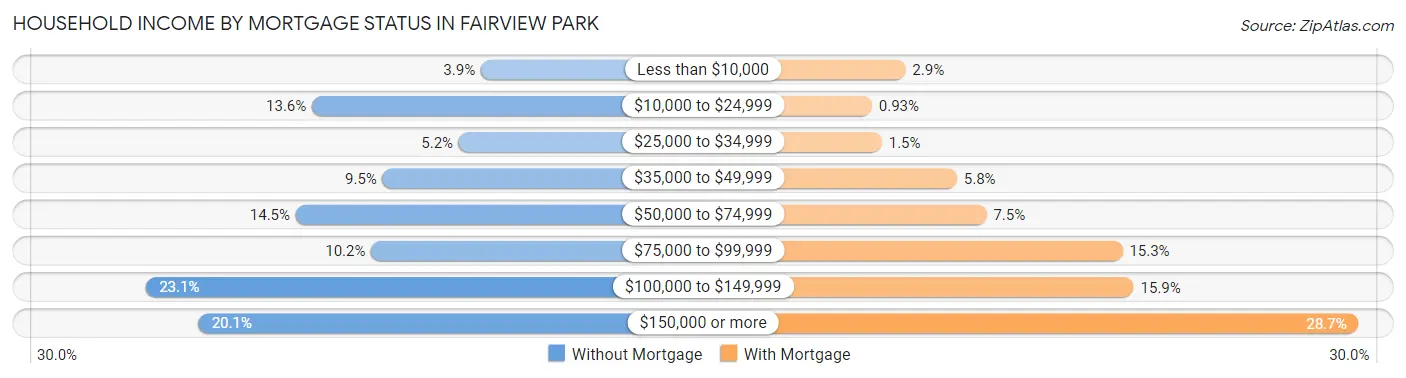
| Household Income | Without Mortgage | With Mortgage |
| Less than $10,000 | 72 (3.9%) | 101 (2.9%) |
| $10,000 to $24,999 | 249 (13.6%) | 33 (0.9%) |
| $25,000 to $34,999 | 95 (5.2%) | 53 (1.5%) |
| $35,000 to $49,999 | 175 (9.5%) | 205 (5.8%) |
| $50,000 to $74,999 | 266 (14.5%) | 265 (7.5%) |
| $75,000 to $99,999 | 187 (10.2%) | 540 (15.2%) |
| $100,000 to $149,999 | 423 (23.1%) | 563 (15.9%) |
| $150,000 or more | 368 (20.1%) | 1,018 (28.7%) |
| Total | 1,835 (100.0%) | 3,542 (100.0%) |
Property Value to Household Income Ratio in Fairview Park
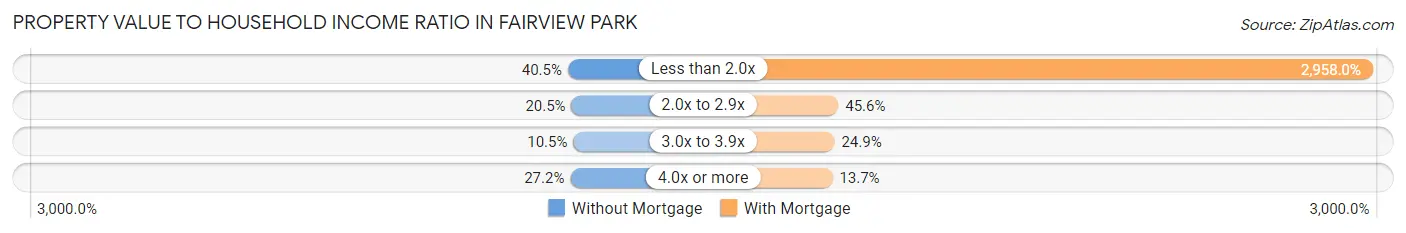
| Value-to-Income Ratio | Without Mortgage | With Mortgage |
| Less than 2.0x | 743 (40.5%) | 104,773 (2,958.0%) |
| 2.0x to 2.9x | 377 (20.5%) | 1,615 (45.6%) |
| 3.0x to 3.9x | 192 (10.5%) | 882 (24.9%) |
| 4.0x or more | 499 (27.2%) | 486 (13.7%) |
| Total | 1,835 (100.0%) | 3,542 (100.0%) |
Real Estate Taxes by Mortgage Status in Fairview Park
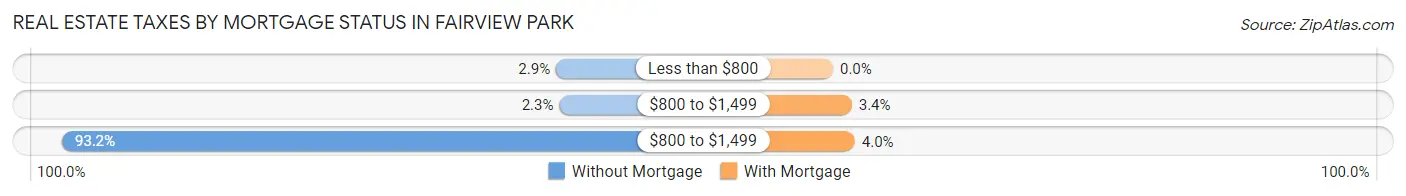
| Property Taxes | Without Mortgage | With Mortgage |
| Less than $800 | 54 (2.9%) | 0 (0.0%) |
| $800 to $1,499 | 43 (2.3%) | 121 (3.4%) |
| $800 to $1,499 | 1,710 (93.2%) | 141 (4.0%) |
| Total | 1,835 (100.0%) | 3,542 (100.0%) |
Health & Disability in Fairview Park
Health Insurance Coverage by Age in Fairview Park
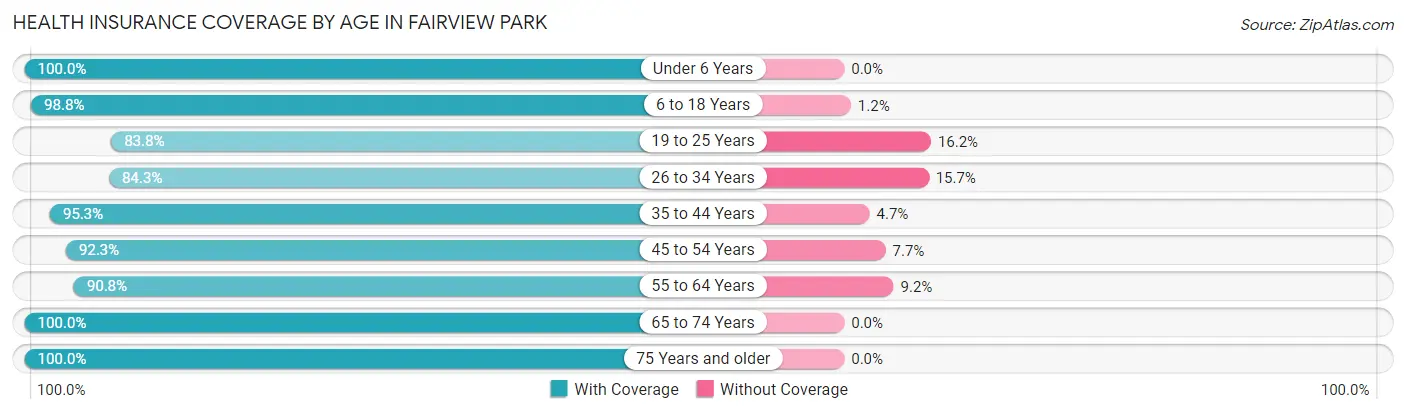
| Age Bracket | With Coverage | Without Coverage |
| Under 6 Years | 1,070 (100.0%) | 0 (0.0%) |
| 6 to 18 Years | 2,492 (98.8%) | 31 (1.2%) |
| 19 to 25 Years | 1,157 (83.8%) | 223 (16.2%) |
| 26 to 34 Years | 2,328 (84.3%) | 435 (15.7%) |
| 35 to 44 Years | 1,777 (95.3%) | 88 (4.7%) |
| 45 to 54 Years | 1,761 (92.3%) | 147 (7.7%) |
| 55 to 64 Years | 2,203 (90.8%) | 223 (9.2%) |
| 65 to 74 Years | 1,880 (100.0%) | 0 (0.0%) |
| 75 Years and older | 1,308 (100.0%) | 0 (0.0%) |
| Total | 15,976 (93.3%) | 1,147 (6.7%) |
Health Insurance Coverage by Citizenship Status in Fairview Park
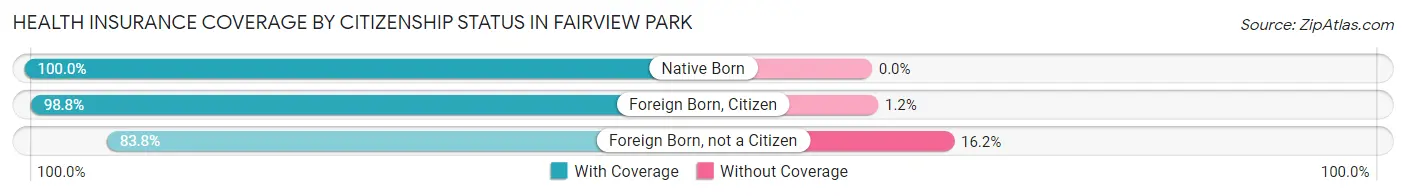
| Citizenship Status | With Coverage | Without Coverage |
| Native Born | 1,070 (100.0%) | 0 (0.0%) |
| Foreign Born, Citizen | 2,492 (98.8%) | 31 (1.2%) |
| Foreign Born, not a Citizen | 1,157 (83.8%) | 223 (16.2%) |
Health Insurance Coverage by Household Income in Fairview Park
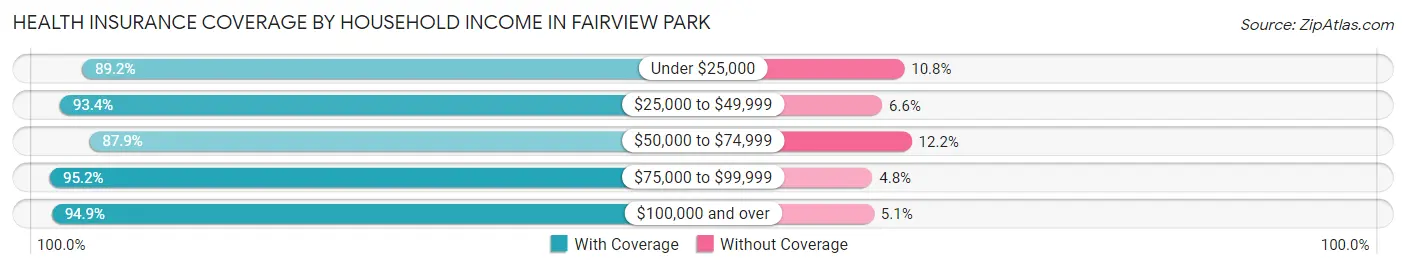
| Household Income | With Coverage | Without Coverage |
| Under $25,000 | 1,259 (89.2%) | 152 (10.8%) |
| $25,000 to $49,999 | 2,639 (93.4%) | 187 (6.6%) |
| $50,000 to $74,999 | 2,002 (87.8%) | 277 (12.1%) |
| $75,000 to $99,999 | 2,228 (95.2%) | 112 (4.8%) |
| $100,000 and over | 7,831 (94.9%) | 419 (5.1%) |
Public vs Private Health Insurance Coverage by Age in Fairview Park
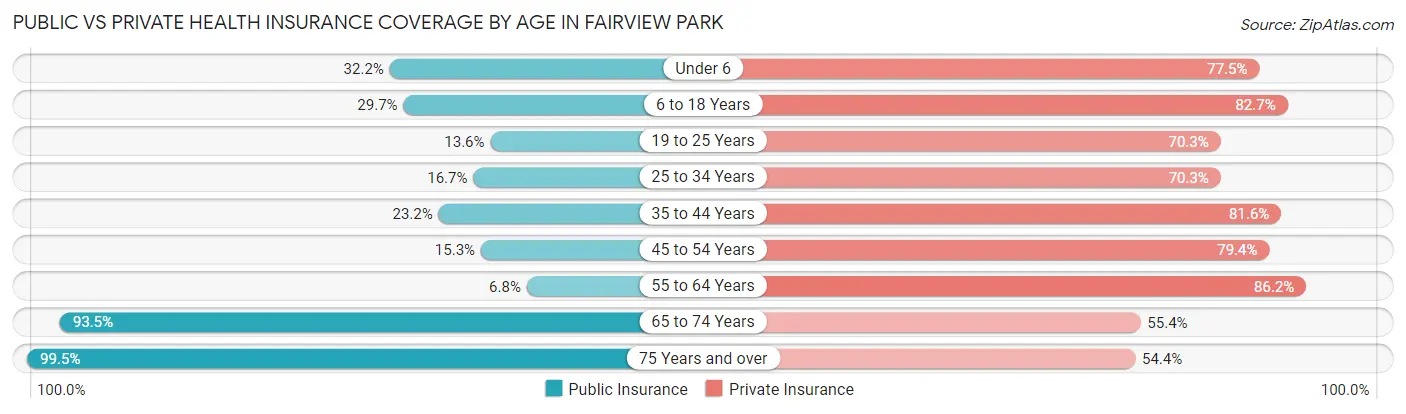
| Age Bracket | Public Insurance | Private Insurance |
| Under 6 | 345 (32.2%) | 829 (77.5%) |
| 6 to 18 Years | 749 (29.7%) | 2,087 (82.7%) |
| 19 to 25 Years | 187 (13.6%) | 970 (70.3%) |
| 25 to 34 Years | 462 (16.7%) | 1,943 (70.3%) |
| 35 to 44 Years | 432 (23.2%) | 1,521 (81.6%) |
| 45 to 54 Years | 292 (15.3%) | 1,514 (79.3%) |
| 55 to 64 Years | 165 (6.8%) | 2,091 (86.2%) |
| 65 to 74 Years | 1,757 (93.5%) | 1,042 (55.4%) |
| 75 Years and over | 1,302 (99.5%) | 712 (54.4%) |
| Total | 5,691 (33.2%) | 12,709 (74.2%) |
Disability Status by Sex by Age in Fairview Park
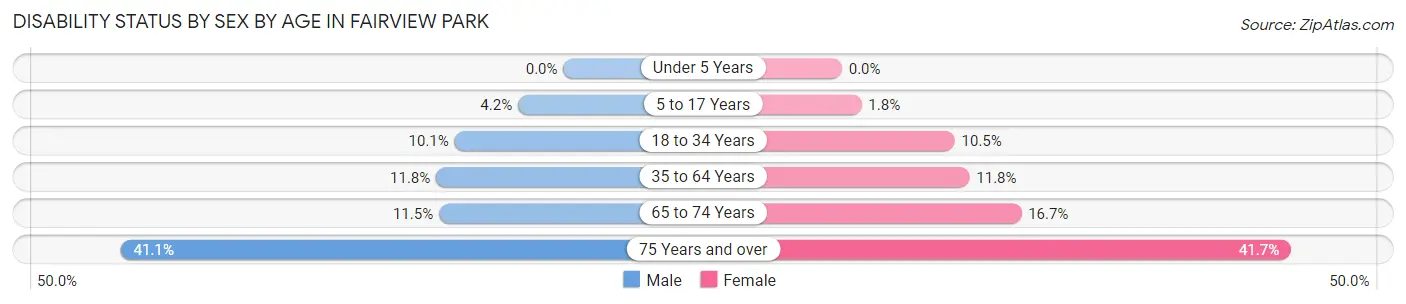
| Age Bracket | Male | Female |
| Under 5 Years | 0 (0.0%) | 0 (0.0%) |
| 5 to 17 Years | 59 (4.2%) | 23 (1.8%) |
| 18 to 34 Years | 226 (10.1%) | 213 (10.5%) |
| 35 to 64 Years | 339 (11.8%) | 394 (11.8%) |
| 65 to 74 Years | 104 (11.5%) | 163 (16.7%) |
| 75 Years and over | 226 (41.1%) | 316 (41.7%) |
Disability Class by Sex by Age in Fairview Park
Disability Class: Hearing Difficulty
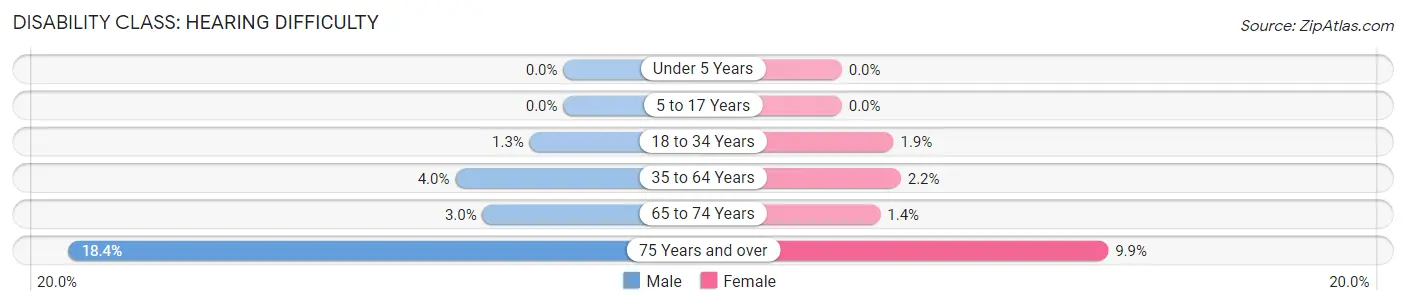
| Age Bracket | Male | Female |
| Under 5 Years | 0 (0.0%) | 0 (0.0%) |
| 5 to 17 Years | 0 (0.0%) | 0 (0.0%) |
| 18 to 34 Years | 28 (1.3%) | 39 (1.9%) |
| 35 to 64 Years | 115 (4.0%) | 73 (2.2%) |
| 65 to 74 Years | 27 (3.0%) | 14 (1.4%) |
| 75 Years and over | 101 (18.4%) | 75 (9.9%) |
Disability Class: Vision Difficulty
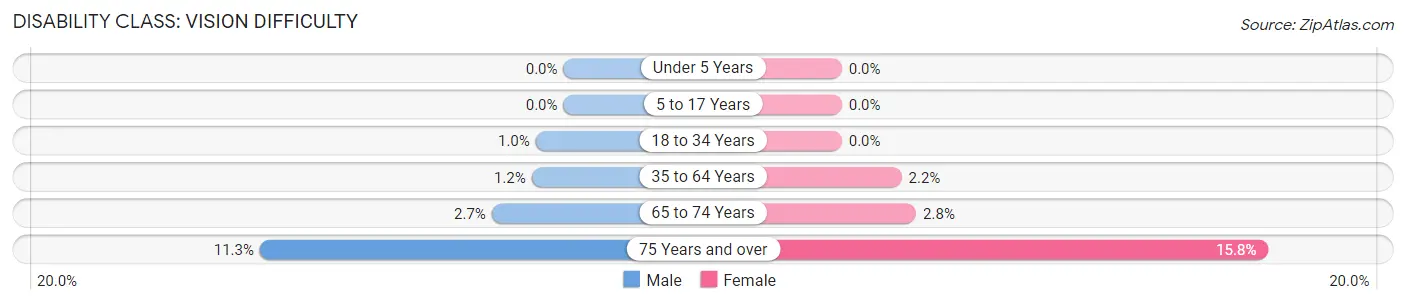
| Age Bracket | Male | Female |
| Under 5 Years | 0 (0.0%) | 0 (0.0%) |
| 5 to 17 Years | 0 (0.0%) | 0 (0.0%) |
| 18 to 34 Years | 23 (1.0%) | 0 (0.0%) |
| 35 to 64 Years | 34 (1.2%) | 74 (2.2%) |
| 65 to 74 Years | 24 (2.7%) | 27 (2.8%) |
| 75 Years and over | 62 (11.3%) | 120 (15.8%) |
Disability Class: Cognitive Difficulty
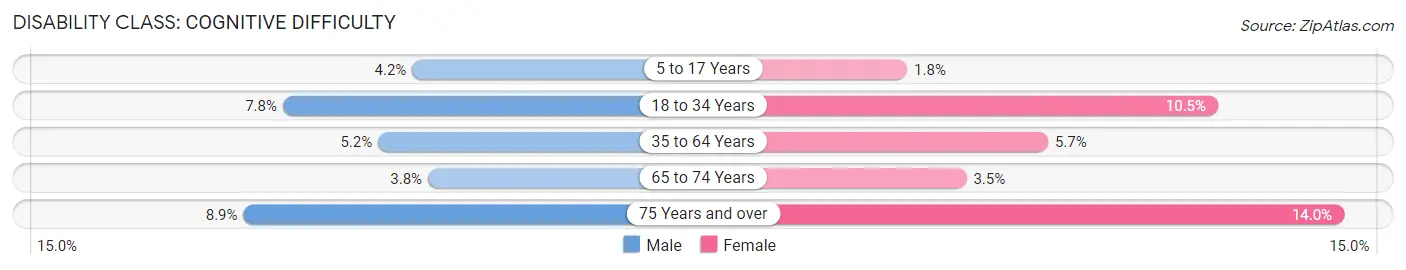
| Age Bracket | Male | Female |
| 5 to 17 Years | 59 (4.2%) | 23 (1.8%) |
| 18 to 34 Years | 175 (7.8%) | 213 (10.5%) |
| 35 to 64 Years | 148 (5.2%) | 191 (5.7%) |
| 65 to 74 Years | 34 (3.8%) | 34 (3.5%) |
| 75 Years and over | 49 (8.9%) | 106 (14.0%) |
Disability Class: Ambulatory Difficulty
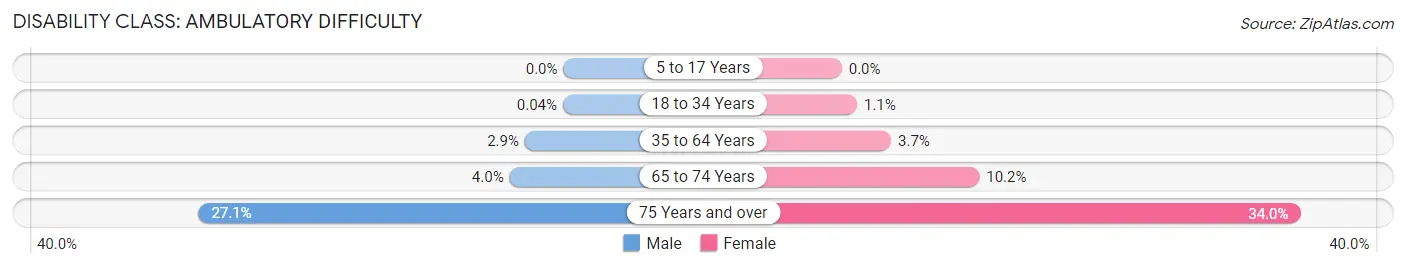
| Age Bracket | Male | Female |
| 5 to 17 Years | 0 (0.0%) | 0 (0.0%) |
| 18 to 34 Years | 1 (0.0%) | 23 (1.1%) |
| 35 to 64 Years | 82 (2.9%) | 122 (3.7%) |
| 65 to 74 Years | 36 (4.0%) | 100 (10.2%) |
| 75 Years and over | 149 (27.1%) | 258 (34.0%) |
Disability Class: Self-Care Difficulty
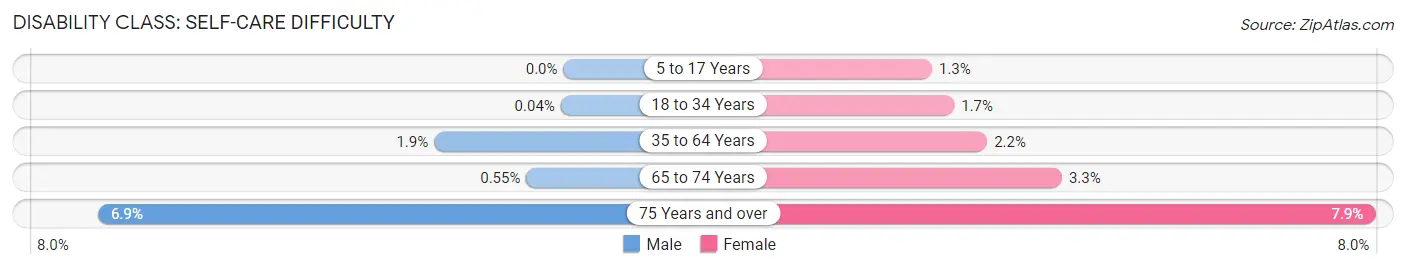
| Age Bracket | Male | Female |
| 5 to 17 Years | 0 (0.0%) | 17 (1.3%) |
| 18 to 34 Years | 1 (0.0%) | 34 (1.7%) |
| 35 to 64 Years | 55 (1.9%) | 72 (2.2%) |
| 65 to 74 Years | 5 (0.5%) | 32 (3.3%) |
| 75 Years and over | 38 (6.9%) | 60 (7.9%) |
Technology Access in Fairview Park
Computing Device Access in Fairview Park
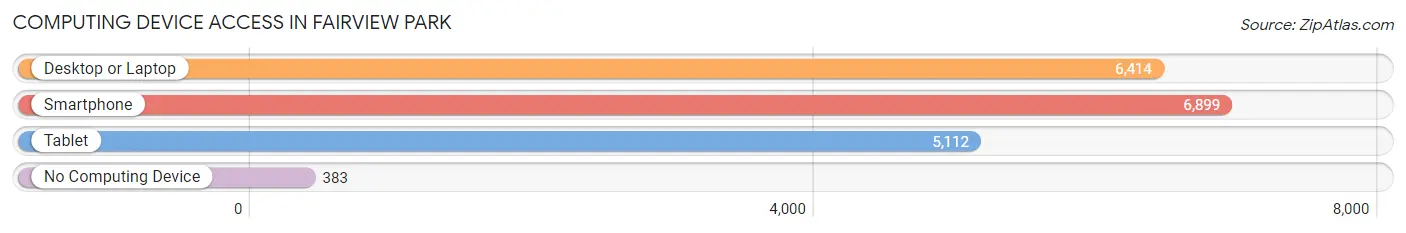
| Device Type | # Households | % Households |
| Desktop or Laptop | 6,414 | 83.0% |
| Smartphone | 6,899 | 89.3% |
| Tablet | 5,112 | 66.2% |
| No Computing Device | 383 | 5.0% |
| Total | 7,727 | 100.0% |
Internet Access in Fairview Park
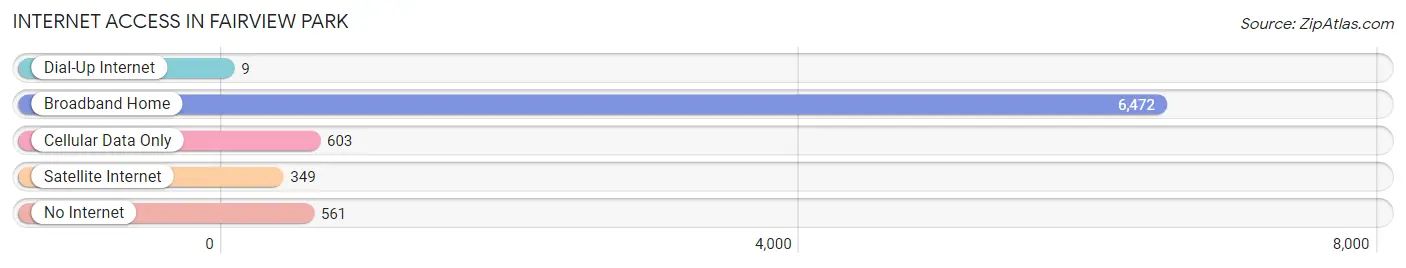
| Internet Type | # Households | % Households |
| Dial-Up Internet | 9 | 0.1% |
| Broadband Home | 6,472 | 83.8% |
| Cellular Data Only | 603 | 7.8% |
| Satellite Internet | 349 | 4.5% |
| No Internet | 561 | 7.3% |
| Total | 7,727 | 100.0% |
Fairview Park Summary
Introduction
Fairview Park is a city located in Cuyahoga County, Ohio. It is a suburb of Cleveland and is located on the western edge of the county. The city is bordered by Lakewood to the north, Rocky River to the east, and Westlake to the south. The city has a population of approximately 17,000 people and covers an area of 4.5 square miles.
History
The area that is now Fairview Park was originally inhabited by the Erie Indians. The first settlers arrived in the area in the early 1800s. The area was originally known as Grangers Corners, named after the Granger family who were among the first settlers. In the late 1800s, the area was renamed Fairview Park after the Fairview Park Hotel, which was built in the area in 1887.
In the early 1900s, the area began to grow rapidly as more people moved to the area. The city was officially incorporated in 1945. Since then, the city has continued to grow and develop.
Geography
Fairview Park is located in Cuyahoga County, Ohio. It is located on the western edge of the county and is bordered by Lakewood to the north, Rocky River to the east, and Westlake to the south. The city covers an area of 4.5 square miles and has a population of approximately 17,000 people.
The city is located on the shore of Lake Erie and is home to several parks and recreational areas. The city is also home to the Rocky River Reservation, which is a part of the Cleveland Metroparks system.
Economy
Fairview Park has a diverse economy that is largely based on the service industry. The city is home to several large employers, including the Cleveland Clinic, the Cleveland Metroparks, and the Cleveland Institute of Art. The city is also home to several small businesses, including restaurants, retail stores, and professional services.
The city is also home to several industrial parks, which are home to a variety of manufacturing and industrial businesses. The city is also home to several corporate headquarters, including the headquarters of the Cleveland Clinic and the Cleveland Metroparks.
Demographics
As of the 2010 census, the population of Fairview Park was 16,826. The racial makeup of the city was 87.3% White, 5.3% African American, 0.3% Native American, 2.2% Asian, 0.1% Pacific Islander, and 4.8% from other races. Hispanic or Latino of any race were 6.2% of the population.
The median household income in Fairview Park was $50,945 in 2018. The median home value was $179,400 in 2018. The median age of the population was 43.7 years.
Conclusion
Fairview Park is a city located in Cuyahoga County, Ohio. It is a suburb of Cleveland and is located on the western edge of the county. The city has a population of approximately 17,000 people and covers an area of 4.5 square miles. The city has a diverse economy that is largely based on the service industry. The racial makeup of the city is 87.3% White, 5.3% African American, 0.3% Native American, 2.2% Asian, 0.1% Pacific Islander, and 4.8% from other races. The median household income in Fairview Park was $50,945 in 2018. The median home value was $179,400 in 2018. The median age of the population was 43.7 years.
Common Questions
What is Per Capita Income in Fairview Park?
Per Capita income in Fairview Park is $44,373.
What is the Median Family Income in Fairview Park?
Median Family Income in Fairview Park is $102,326.
What is the Median Household income in Fairview Park?
Median Household Income in Fairview Park is $76,027.
What is Income or Wage Gap in Fairview Park?
Income or Wage Gap in Fairview Park is 27.4%.
Women in Fairview Park earn 72.6 cents for every dollar earned by a man.
What is Family Income Deficit in Fairview Park?
Family Income Deficit in Fairview Park is $4,876.
Families that are below poverty line in Fairview Park earn $4,876 less on average than the poverty threshold level.
What is Inequality or Gini Index in Fairview Park?
Inequality or Gini Index in Fairview Park is 0.42.
What is the Total Population of Fairview Park?
Total Population of Fairview Park is 17,137.
What is the Total Male Population of Fairview Park?
Total Male Population of Fairview Park is 8,415.
What is the Total Female Population of Fairview Park?
Total Female Population of Fairview Park is 8,722.
What is the Ratio of Males per 100 Females in Fairview Park?
There are 96.48 Males per 100 Females in Fairview Park.
What is the Ratio of Females per 100 Males in Fairview Park?
There are 103.65 Females per 100 Males in Fairview Park.
What is the Median Population Age in Fairview Park?
Median Population Age in Fairview Park is 39.1 Years.
What is the Average Family Size in Fairview Park
Average Family Size in Fairview Park is 2.9 People.
What is the Average Household Size in Fairview Park
Average Household Size in Fairview Park is 2.2 People.
How Large is the Labor Force in Fairview Park?
There are 10,216 People in the Labor Forcein in Fairview Park.
What is the Percentage of People in the Labor Force in Fairview Park?
73.0% of People are in the Labor Force in Fairview Park.
What is the Unemployment Rate in Fairview Park?
Unemployment Rate in Fairview Park is 3.3%.