Washington Court House, OH Map & Demographics
Washington Court House Map
Washington Court House Overview
$28,885
PER CAPITA INCOME
$61,661
AVG FAMILY INCOME
$51,601
AVG HOUSEHOLD INCOME
40.0%
WAGE / INCOME GAP [ % ]
60.0¢/ $1
WAGE / INCOME GAP [ $ ]
$14,293
FAMILY INCOME DEFICIT
0.46
INEQUALITY / GINI INDEX
14,387
TOTAL POPULATION
7,139
MALE POPULATION
7,248
FEMALE POPULATION
98.50
MALES / 100 FEMALES
101.53
FEMALES / 100 MALES
38.6
MEDIAN AGE
3.0
AVG FAMILY SIZE
2.4
AVG HOUSEHOLD SIZE
6,836
LABOR FORCE [ PEOPLE ]
60.2%
PERCENT IN LABOR FORCE
6.0%
UNEMPLOYMENT RATE
Washington Court House Zip Codes
Washington Court House Area Codes
Income in Washington Court House
Income Overview in Washington Court House
Per Capita Income in Washington Court House is $28,885, while median incomes of families and households are $61,661 and $51,601 respectively.
| Characteristic | Number | Measure |
| Per Capita Income | 14,387 | $28,885 |
| Median Family Income | 3,557 | $61,661 |
| Mean Family Income | 3,557 | $80,107 |
| Median Household Income | 5,941 | $51,601 |
| Mean Household Income | 5,941 | $66,739 |
| Income Deficit | 3,557 | $14,293 |
| Wage / Income Gap (%) | 14,387 | 40.02% |
| Wage / Income Gap ($) | 14,387 | 59.98¢ per $1 |
| Gini / Inequality Index | 14,387 | 0.46 |
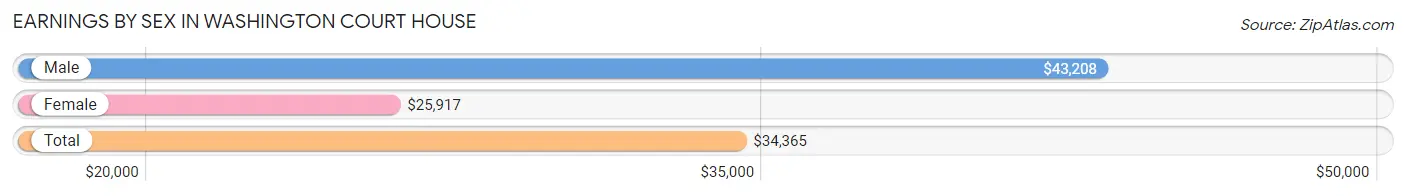
Earnings by Sex in Washington Court House
Average Earnings in Washington Court House are $34,365, $43,208 for men and $25,917 for women, a difference of 40.0%.
| Sex | Number | Average Earnings |
| Male | 3,793 (52.7%) | $43,208 |
| Female | 3,402 (47.3%) | $25,917 |
| Total | 7,195 (100.0%) | $34,365 |
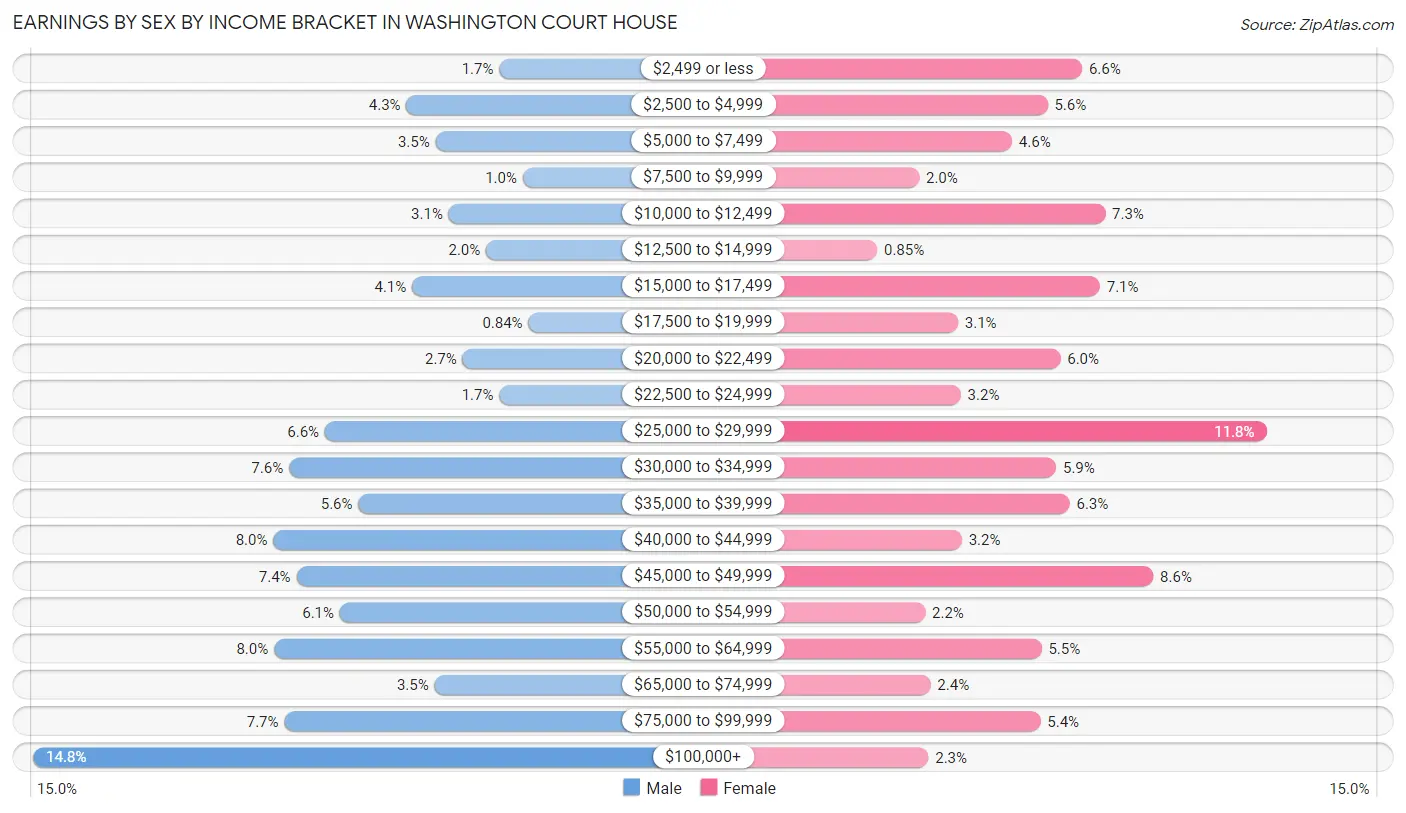
Earnings by Sex by Income Bracket in Washington Court House
The most common earnings brackets in Washington Court House are $100,000+ for men (560 | 14.8%) and $25,000 to $29,999 for women (401 | 11.8%).
| Income | Male | Female |
| $2,499 or less | 63 (1.7%) | 225 (6.6%) |
| $2,500 to $4,999 | 162 (4.3%) | 192 (5.6%) |
| $5,000 to $7,499 | 131 (3.5%) | 158 (4.6%) |
| $7,500 to $9,999 | 38 (1.0%) | 69 (2.0%) |
| $10,000 to $12,499 | 117 (3.1%) | 247 (7.3%) |
| $12,500 to $14,999 | 77 (2.0%) | 29 (0.9%) |
| $15,000 to $17,499 | 156 (4.1%) | 242 (7.1%) |
| $17,500 to $19,999 | 32 (0.8%) | 106 (3.1%) |
| $20,000 to $22,499 | 102 (2.7%) | 204 (6.0%) |
| $22,500 to $24,999 | 63 (1.7%) | 109 (3.2%) |
| $25,000 to $29,999 | 249 (6.6%) | 401 (11.8%) |
| $30,000 to $34,999 | 287 (7.6%) | 200 (5.9%) |
| $35,000 to $39,999 | 213 (5.6%) | 213 (6.3%) |
| $40,000 to $44,999 | 304 (8.0%) | 110 (3.2%) |
| $45,000 to $49,999 | 279 (7.4%) | 293 (8.6%) |
| $50,000 to $54,999 | 233 (6.1%) | 75 (2.2%) |
| $55,000 to $64,999 | 303 (8.0%) | 186 (5.5%) |
| $65,000 to $74,999 | 132 (3.5%) | 80 (2.4%) |
| $75,000 to $99,999 | 292 (7.7%) | 185 (5.4%) |
| $100,000+ | 560 (14.8%) | 78 (2.3%) |
| Total | 3,793 (100.0%) | 3,402 (100.0%) |
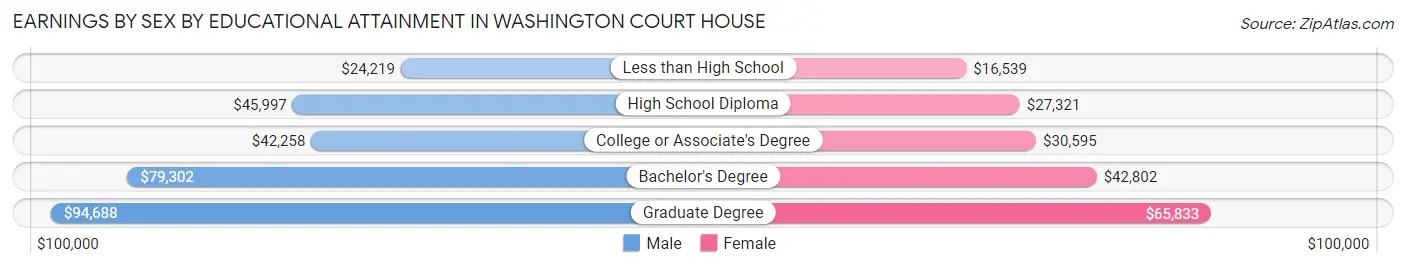
Earnings by Sex by Educational Attainment in Washington Court House
Average earnings in Washington Court House are $47,394 for men and $27,460 for women, a difference of 42.1%. Men with an educational attainment of graduate degree enjoy the highest average annual earnings of $94,688, while those with less than high school education earn the least with $24,219. Women with an educational attainment of graduate degree earn the most with the average annual earnings of $65,833, while those with less than high school education have the smallest earnings of $16,539.
| Educational Attainment | Male Income | Female Income |
| Less than High School | $24,219 | $16,539 |
| High School Diploma | $45,997 | $27,321 |
| College or Associate's Degree | $42,258 | $30,595 |
| Bachelor's Degree | $79,302 | $42,802 |
| Graduate Degree | $94,688 | $65,833 |
| Total | $47,394 | $27,460 |
Family Income in Washington Court House
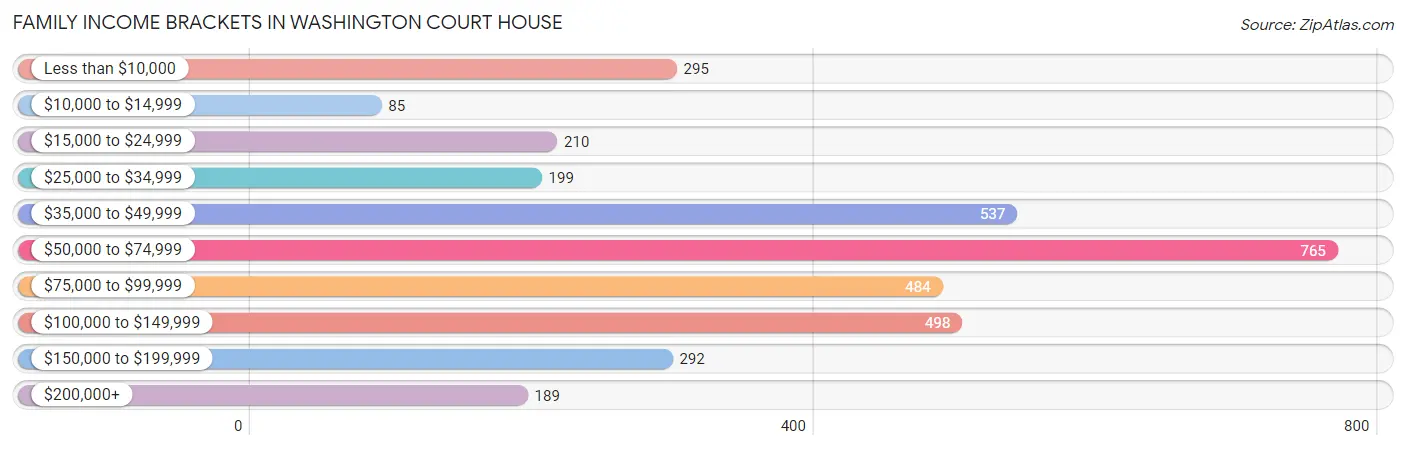
Family Income Brackets in Washington Court House
According to the Washington Court House family income data, there are 765 families falling into the $50,000 to $74,999 income range, which is the most common income bracket and makes up 21.5% of all families. Conversely, the $10,000 to $14,999 income bracket is the least frequent group with only 85 families (2.4%) belonging to this category.
| Income Bracket | # Families | % Families |
| Less than $10,000 | 295 | 8.3% |
| $10,000 to $14,999 | 85 | 2.4% |
| $15,000 to $24,999 | 210 | 5.9% |
| $25,000 to $34,999 | 199 | 5.6% |
| $35,000 to $49,999 | 537 | 15.1% |
| $50,000 to $74,999 | 765 | 21.5% |
| $75,000 to $99,999 | 484 | 13.6% |
| $100,000 to $149,999 | 498 | 14.0% |
| $150,000 to $199,999 | 292 | 8.2% |
| $200,000+ | 189 | 5.3% |
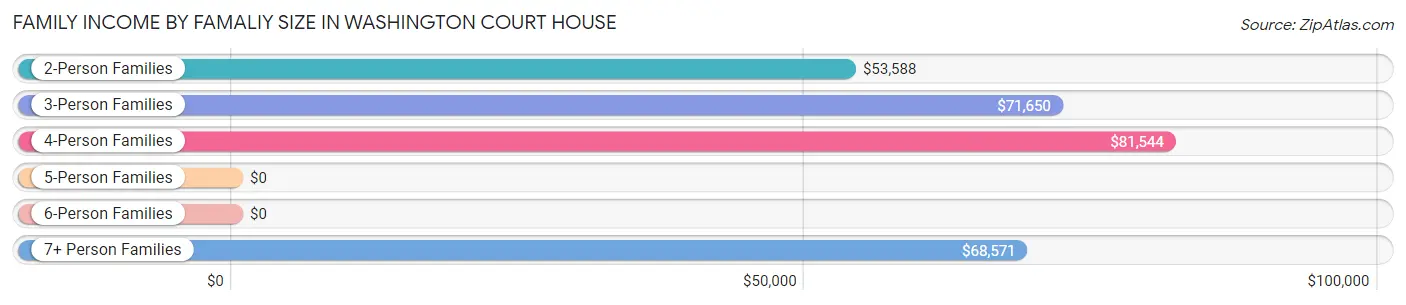
Family Income by Famaliy Size in Washington Court House
4-person families (483 | 13.6%) account for the highest median family income in Washington Court House with $81,544 per family, while 2-person families (1,831 | 51.5%) have the highest median income of $26,794 per family member.
| Income Bracket | # Families | Median Income |
| 2-Person Families | 1,831 (51.5%) | $53,588 |
| 3-Person Families | 761 (21.4%) | $71,650 |
| 4-Person Families | 483 (13.6%) | $81,544 |
| 5-Person Families | 316 (8.9%) | $0 |
| 6-Person Families | 76 (2.1%) | $0 |
| 7+ Person Families | 90 (2.5%) | $68,571 |
| Total | 3,557 (100.0%) | $61,661 |
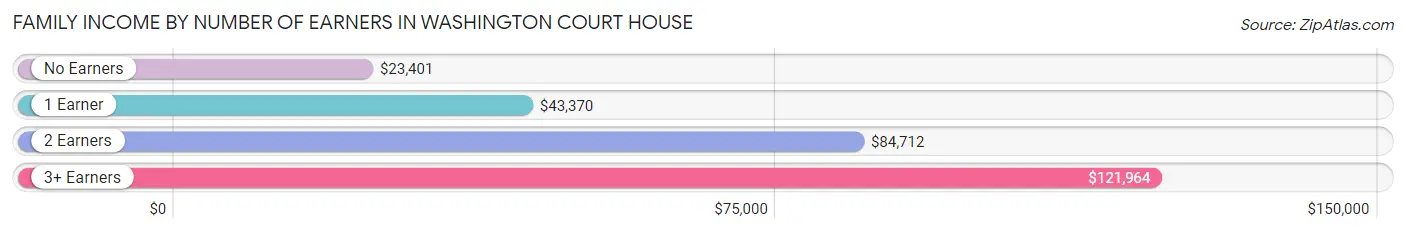
Family Income by Number of Earners in Washington Court House
The median family income in Washington Court House is $61,661, with families comprising 3+ earners (487) having the highest median family income of $121,964, while families with no earners (775) have the lowest median family income of $23,401, accounting for 13.7% and 21.8% of families, respectively.
| Number of Earners | # Families | Median Income |
| No Earners | 775 (21.8%) | $23,401 |
| 1 Earner | 1,100 (30.9%) | $43,370 |
| 2 Earners | 1,195 (33.6%) | $84,712 |
| 3+ Earners | 487 (13.7%) | $121,964 |
| Total | 3,557 (100.0%) | $61,661 |
Household Income in Washington Court House
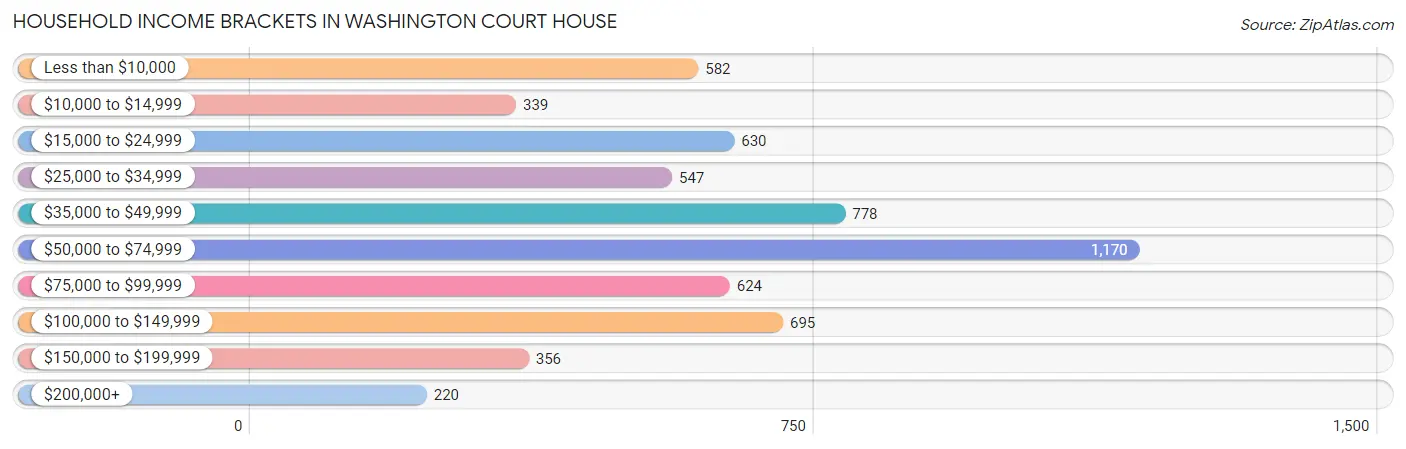
Household Income Brackets in Washington Court House
With 1,170 households falling in the category, the $50,000 to $74,999 income range is the most frequent in Washington Court House, accounting for 19.7% of all households. In contrast, only 220 households (3.7%) fall into the $200,000+ income bracket, making it the least populous group.
| Income Bracket | # Households | % Households |
| Less than $10,000 | 582 | 9.8% |
| $10,000 to $14,999 | 339 | 5.7% |
| $15,000 to $24,999 | 630 | 10.6% |
| $25,000 to $34,999 | 547 | 9.2% |
| $35,000 to $49,999 | 778 | 13.1% |
| $50,000 to $74,999 | 1,170 | 19.7% |
| $75,000 to $99,999 | 624 | 10.5% |
| $100,000 to $149,999 | 695 | 11.7% |
| $150,000 to $199,999 | 356 | 6.0% |
| $200,000+ | 220 | 3.7% |
Household Income by Householder Age in Washington Court House
The median household income in Washington Court House is $51,601, with the highest median household income of $66,490 found in the 25 to 44 years age bracket for the primary householder. A total of 1,895 households (31.9%) fall into this category. Meanwhile, the 65+ years age bracket for the primary householder has the lowest median household income of $37,826, with 1,626 households (27.4%) in this group.
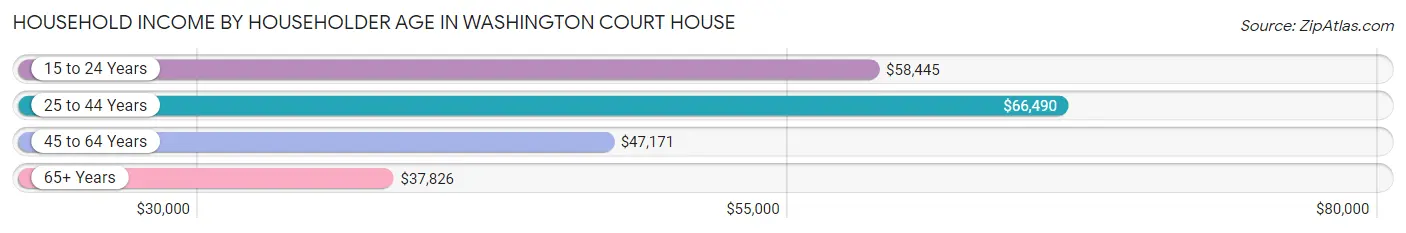
| Income Bracket | # Households | Median Income |
| 15 to 24 Years | 273 (4.6%) | $58,445 |
| 25 to 44 Years | 1,895 (31.9%) | $66,490 |
| 45 to 64 Years | 2,147 (36.1%) | $47,171 |
| 65+ Years | 1,626 (27.4%) | $37,826 |
| Total | 5,941 (100.0%) | $51,601 |
Poverty in Washington Court House
Income Below Poverty by Sex and Age in Washington Court House
With 15.9% poverty level for males and 24.0% for females among the residents of Washington Court House, 6 to 11 year old males and 15 year old females are the most vulnerable to poverty, with 326 males (46.7%) and 44 females (48.3%) in their respective age groups living below the poverty level.
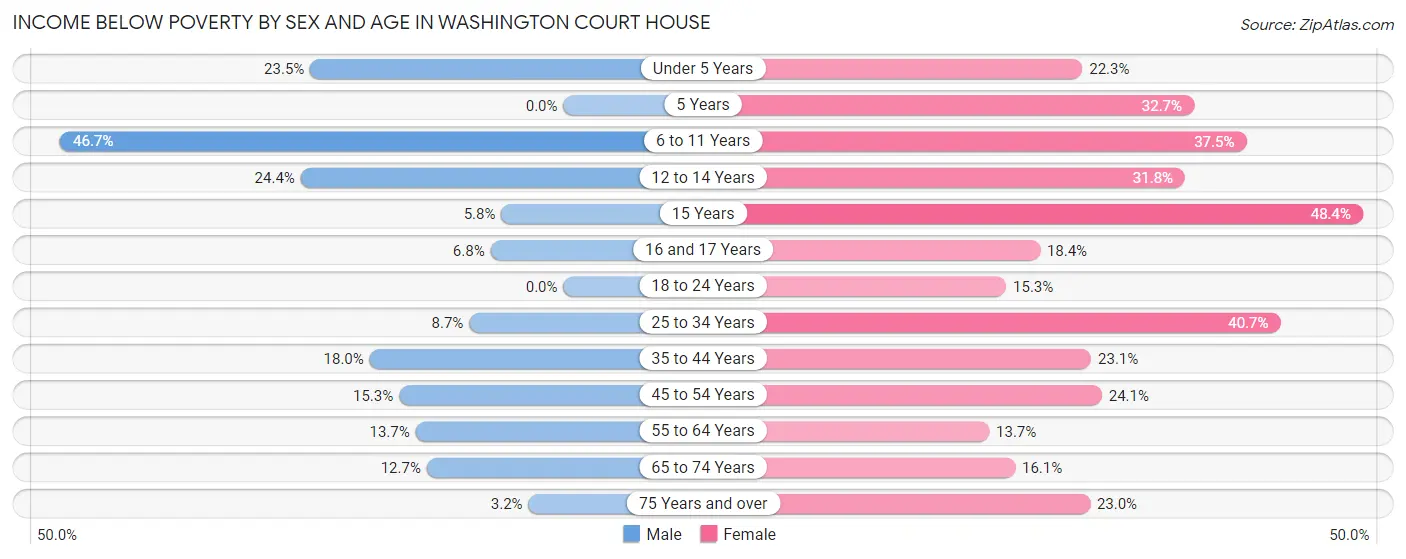
| Age Bracket | Male | Female |
| Under 5 Years | 110 (23.5%) | 73 (22.3%) |
| 5 Years | 0 (0.0%) | 33 (32.7%) |
| 6 to 11 Years | 326 (46.7%) | 182 (37.5%) |
| 12 to 14 Years | 89 (24.4%) | 71 (31.8%) |
| 15 Years | 8 (5.8%) | 44 (48.3%) |
| 16 and 17 Years | 15 (6.8%) | 32 (18.4%) |
| 18 to 24 Years | 0 (0.0%) | 102 (15.2%) |
| 25 to 34 Years | 90 (8.7%) | 372 (40.7%) |
| 35 to 44 Years | 132 (18.0%) | 184 (23.1%) |
| 45 to 54 Years | 133 (15.2%) | 214 (24.1%) |
| 55 to 64 Years | 108 (13.7%) | 149 (13.7%) |
| 65 to 74 Years | 90 (12.7%) | 138 (16.1%) |
| 75 Years and over | 9 (3.2%) | 105 (23.0%) |
| Total | 1,110 (15.9%) | 1,699 (24.0%) |
Income Above Poverty by Sex and Age in Washington Court House
According to the poverty statistics in Washington Court House, males aged 5 years and females aged 55 to 64 years are the age groups that are most secure financially, with 100.0% of males and 86.3% of females in these age groups living above the poverty line.
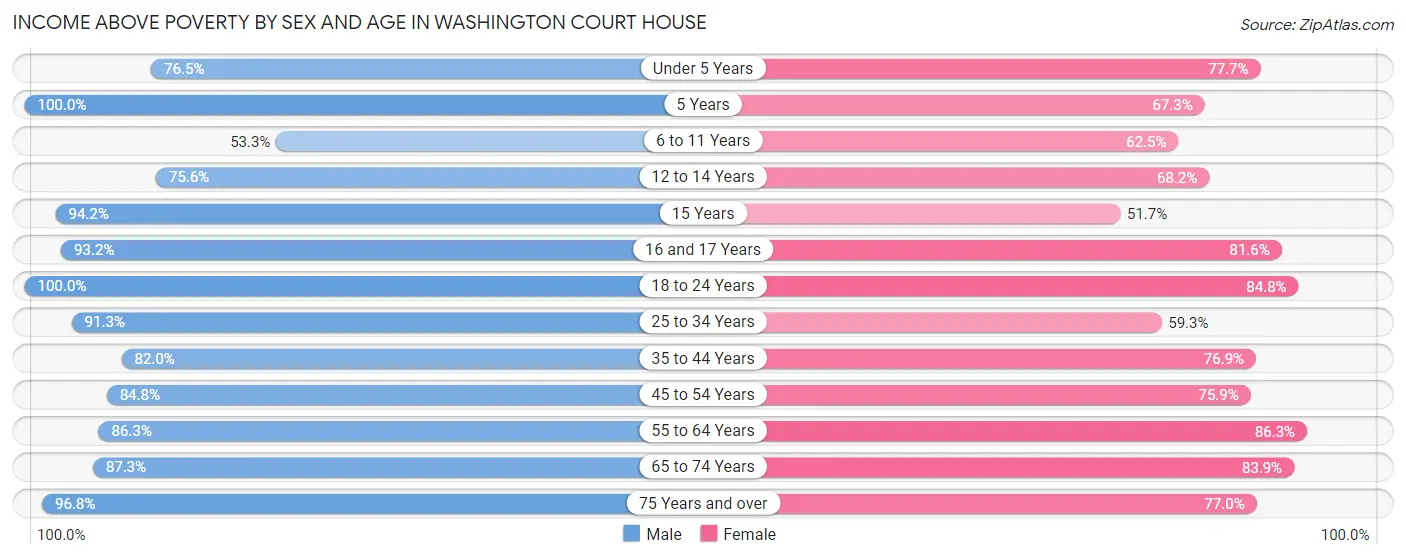
| Age Bracket | Male | Female |
| Under 5 Years | 358 (76.5%) | 254 (77.7%) |
| 5 Years | 55 (100.0%) | 68 (67.3%) |
| 6 to 11 Years | 372 (53.3%) | 303 (62.5%) |
| 12 to 14 Years | 276 (75.6%) | 152 (68.2%) |
| 15 Years | 131 (94.2%) | 47 (51.6%) |
| 16 and 17 Years | 207 (93.2%) | 142 (81.6%) |
| 18 to 24 Years | 620 (100.0%) | 567 (84.8%) |
| 25 to 34 Years | 940 (91.3%) | 542 (59.3%) |
| 35 to 44 Years | 602 (82.0%) | 611 (76.9%) |
| 45 to 54 Years | 739 (84.8%) | 673 (75.9%) |
| 55 to 64 Years | 679 (86.3%) | 941 (86.3%) |
| 65 to 74 Years | 620 (87.3%) | 720 (83.9%) |
| 75 Years and over | 269 (96.8%) | 351 (77.0%) |
| Total | 5,868 (84.1%) | 5,371 (76.0%) |
Income Below Poverty Among Married-Couple Families in Washington Court House
The poverty statistics for married-couple families in Washington Court House show that 6.8% or 154 of the total 2,272 families live below the poverty line. Families with 5 or more children have the highest poverty rate of 47.4%, comprising of 27 families. On the other hand, families with 1 or 2 children have the lowest poverty rate of 3.9%, which includes 28 families.
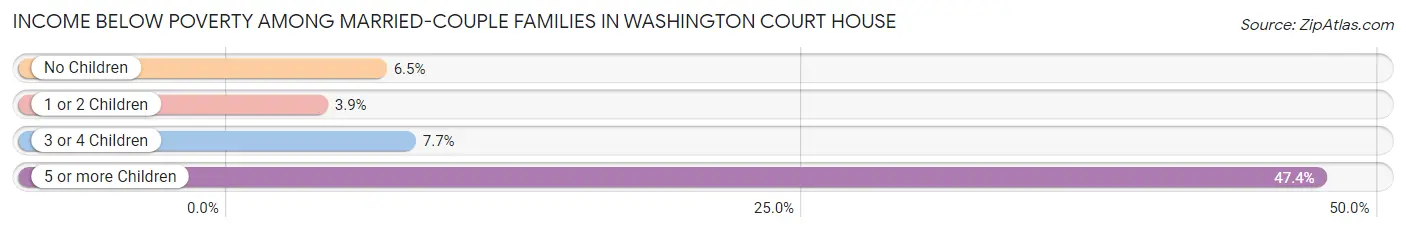
| Children | Above Poverty | Below Poverty |
| No Children | 1,257 (93.5%) | 87 (6.5%) |
| 1 or 2 Children | 688 (96.1%) | 28 (3.9%) |
| 3 or 4 Children | 143 (92.3%) | 12 (7.7%) |
| 5 or more Children | 30 (52.6%) | 27 (47.4%) |
| Total | 2,118 (93.2%) | 154 (6.8%) |
Income Below Poverty Among Single-Parent Households in Washington Court House
According to the poverty data in Washington Court House, 15.4% or 75 single-father households and 41.0% or 327 single-mother households are living below the poverty line. Among single-father households, those with 1 or 2 children have the highest poverty rate, with 66 households (23.5%) experiencing poverty. Likewise, among single-mother households, those with 3 or 4 children have the highest poverty rate, with 115 households (100.0%) falling below the poverty line.
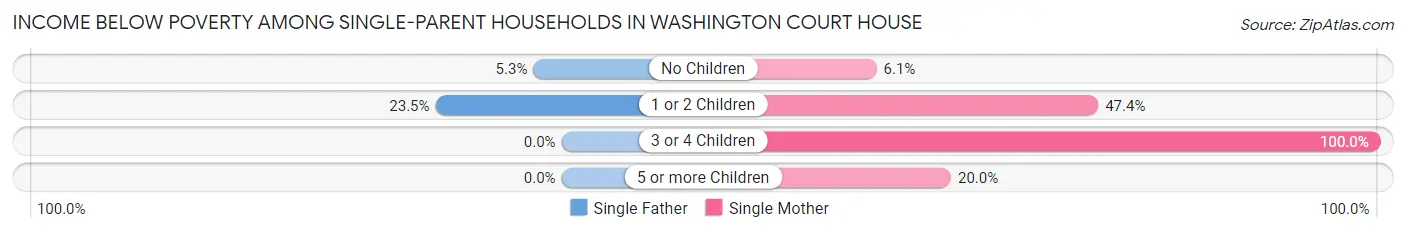
| Children | Single Father | Single Mother |
| No Children | 9 (5.3%) | 16 (6.1%) |
| 1 or 2 Children | 66 (23.5%) | 193 (47.4%) |
| 3 or 4 Children | 0 (0.0%) | 115 (100.0%) |
| 5 or more Children | 0 (0.0%) | 3 (20.0%) |
| Total | 75 (15.4%) | 327 (41.0%) |
Income Below Poverty Among Married-Couple vs Single-Parent Households in Washington Court House
The poverty data for Washington Court House shows that 154 of the married-couple family households (6.8%) and 402 of the single-parent households (31.3%) are living below the poverty level. Within the married-couple family households, those with 5 or more children have the highest poverty rate, with 27 households (47.4%) falling below the poverty line. Among the single-parent households, those with 3 or 4 children have the highest poverty rate, with 115 household (76.7%) living below poverty.
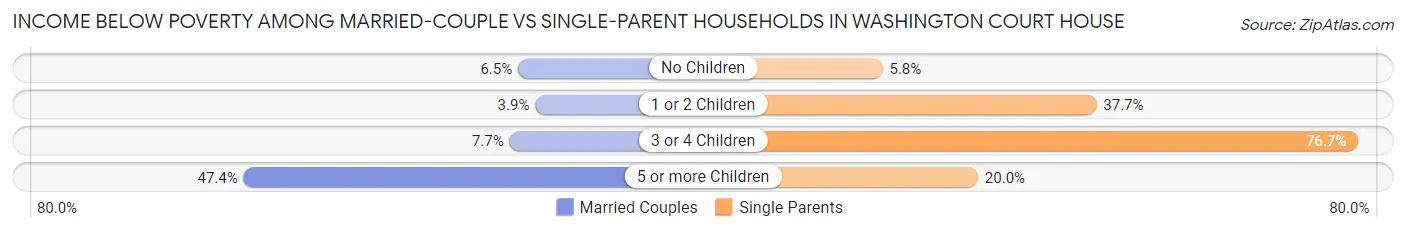
| Children | Married-Couple Families | Single-Parent Households |
| No Children | 87 (6.5%) | 25 (5.8%) |
| 1 or 2 Children | 28 (3.9%) | 259 (37.7%) |
| 3 or 4 Children | 12 (7.7%) | 115 (76.7%) |
| 5 or more Children | 27 (47.4%) | 3 (20.0%) |
| Total | 154 (6.8%) | 402 (31.3%) |
Race in Washington Court House
The most populous races in Washington Court House are White / Caucasian (12,984 | 90.2%), Two or more Races (580 | 4.0%), and Black / African American (508 | 3.5%).
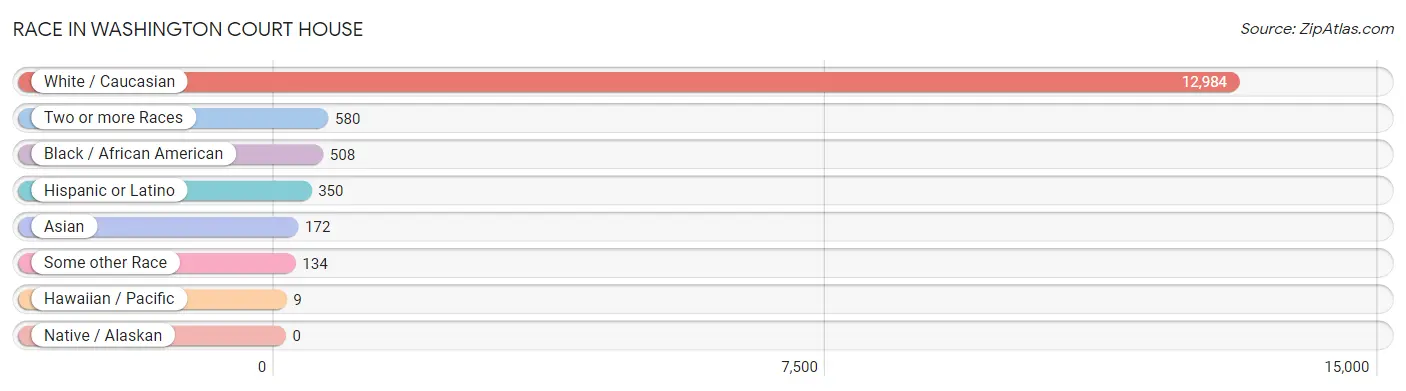
| Race | # Population | % Population |
| Asian | 172 | 1.2% |
| Black / African American | 508 | 3.5% |
| Hawaiian / Pacific | 9 | 0.1% |
| Hispanic or Latino | 350 | 2.4% |
| Native / Alaskan | 0 | 0.0% |
| White / Caucasian | 12,984 | 90.2% |
| Two or more Races | 580 | 4.0% |
| Some other Race | 134 | 0.9% |
| Total | 14,387 | 100.0% |
Ancestry in Washington Court House
The most populous ancestries reported in Washington Court House are German (2,504 | 17.4%), Irish (1,646 | 11.4%), American (1,629 | 11.3%), English (1,214 | 8.4%), and Italian (427 | 3.0%), together accounting for 51.6% of all Washington Court House residents.
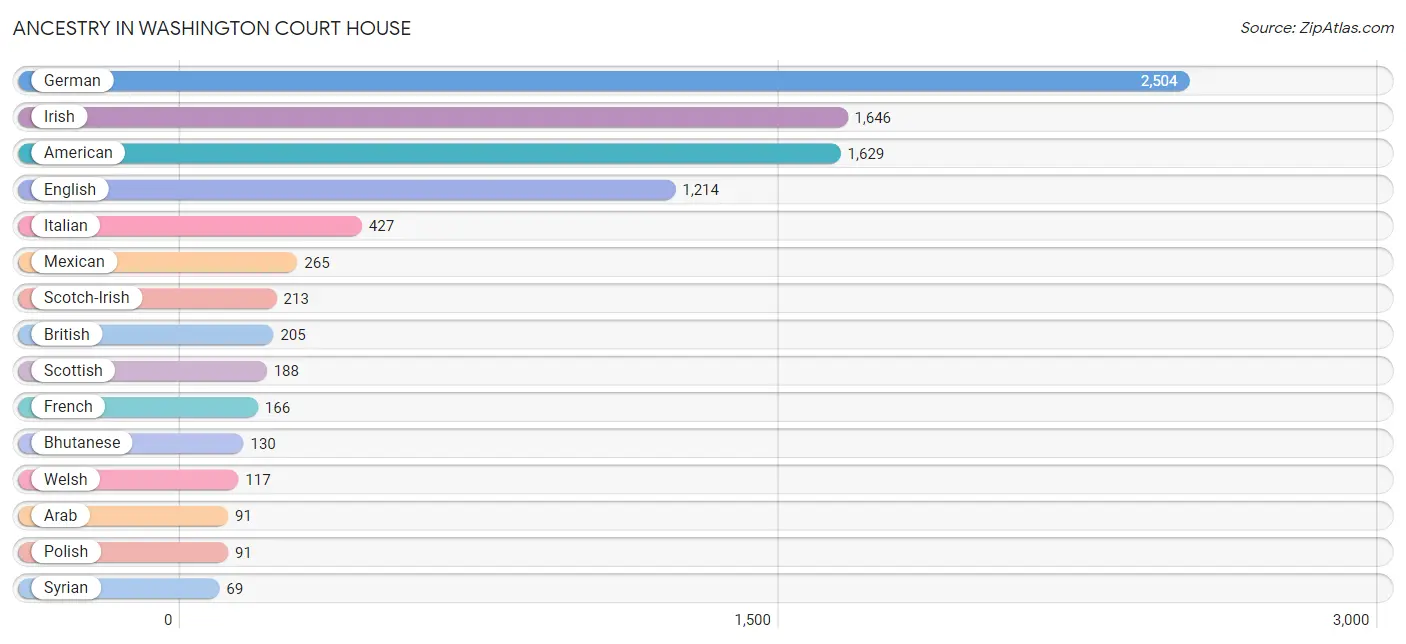
| Ancestry | # Population | % Population |
| African | 7 | 0.1% |
| American | 1,629 | 11.3% |
| Arab | 91 | 0.6% |
| Austrian | 5 | 0.0% |
| Bhutanese | 130 | 0.9% |
| British | 205 | 1.4% |
| Central American | 25 | 0.2% |
| Cherokee | 7 | 0.1% |
| Czech | 11 | 0.1% |
| Czechoslovakian | 8 | 0.1% |
| Danish | 20 | 0.1% |
| Dutch | 38 | 0.3% |
| Eastern European | 47 | 0.3% |
| Egyptian | 22 | 0.2% |
| English | 1,214 | 8.4% |
| European | 51 | 0.4% |
| Finnish | 23 | 0.2% |
| French | 166 | 1.1% |
| French Canadian | 7 | 0.1% |
| German | 2,504 | 17.4% |
| Guatemalan | 25 | 0.2% |
| Indian (Asian) | 15 | 0.1% |
| Irish | 1,646 | 11.4% |
| Italian | 427 | 3.0% |
| Korean | 42 | 0.3% |
| Lithuanian | 20 | 0.1% |
| Mexican | 265 | 1.8% |
| Native Hawaiian | 9 | 0.1% |
| Norwegian | 14 | 0.1% |
| Polish | 91 | 0.6% |
| Puerto Rican | 60 | 0.4% |
| Romanian | 10 | 0.1% |
| Russian | 49 | 0.3% |
| Scandinavian | 40 | 0.3% |
| Scotch-Irish | 213 | 1.5% |
| Scottish | 188 | 1.3% |
| Slovak | 30 | 0.2% |
| Slovene | 15 | 0.1% |
| Subsaharan African | 7 | 0.1% |
| Swedish | 23 | 0.2% |
| Swiss | 8 | 0.1% |
| Syrian | 69 | 0.5% |
| Welsh | 117 | 0.8% | View All 43 Rows |
Immigrants in Washington Court House
The most numerous immigrant groups reported in Washington Court House came from Asia (172 | 1.2%), Eastern Asia (120 | 0.8%), Japan (120 | 0.8%), Central America (95 | 0.7%), and Latin America (95 | 0.7%), together accounting for 4.2% of all Washington Court House residents.
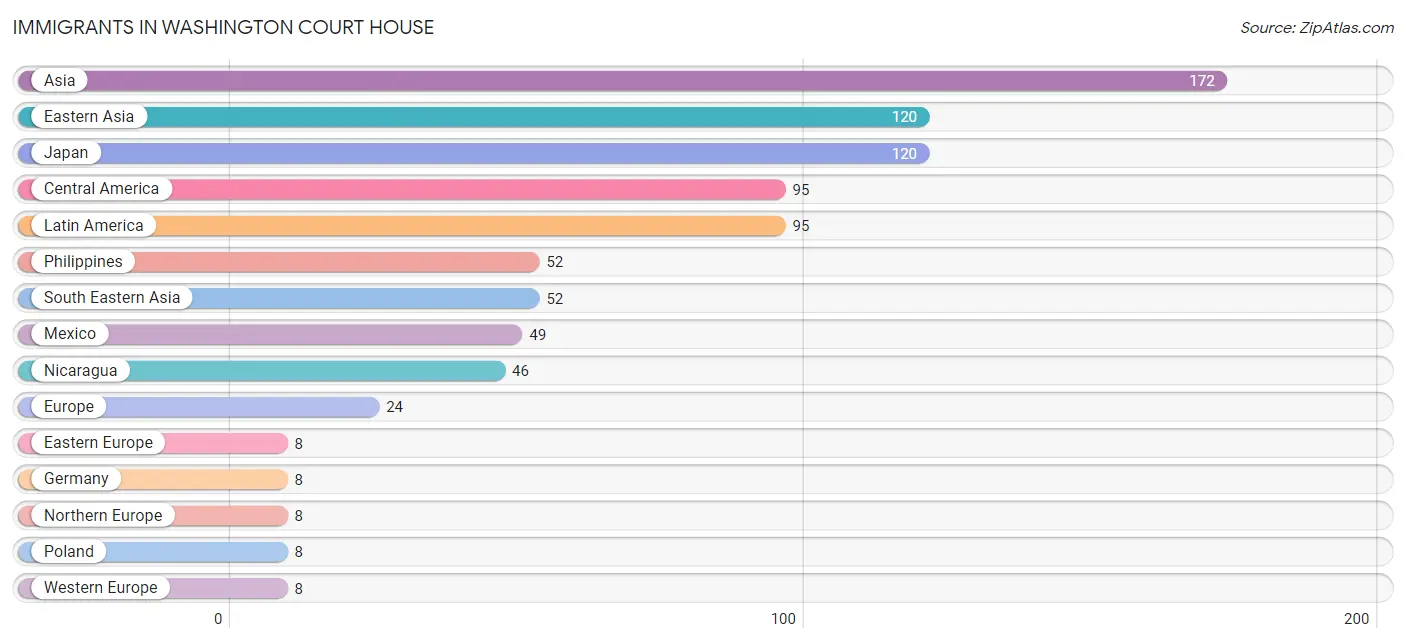
| Immigration Origin | # Population | % Population |
| Africa | 7 | 0.1% |
| Asia | 172 | 1.2% |
| Central America | 95 | 0.7% |
| Eastern Africa | 7 | 0.1% |
| Eastern Asia | 120 | 0.8% |
| Eastern Europe | 8 | 0.1% |
| Ethiopia | 7 | 0.1% |
| Europe | 24 | 0.2% |
| Germany | 8 | 0.1% |
| Japan | 120 | 0.8% |
| Latin America | 95 | 0.7% |
| Mexico | 49 | 0.3% |
| Nicaragua | 46 | 0.3% |
| Northern Europe | 8 | 0.1% |
| Philippines | 52 | 0.4% |
| Poland | 8 | 0.1% |
| South Eastern Asia | 52 | 0.4% |
| Western Europe | 8 | 0.1% | View All 18 Rows |
Sex and Age in Washington Court House
Sex and Age in Washington Court House
The most populous age groups in Washington Court House are 25 to 29 Years (632 | 8.8%) for men and 60 to 64 Years (601 | 8.3%) for women.

| Age Bracket | Male | Female |
| Under 5 Years | 475 (6.7%) | 358 (4.9%) |
| 5 to 9 Years | 521 (7.3%) | 396 (5.5%) |
| 10 to 14 Years | 631 (8.8%) | 421 (5.8%) |
| 15 to 19 Years | 511 (7.2%) | 384 (5.3%) |
| 20 to 24 Years | 474 (6.6%) | 550 (7.6%) |
| 25 to 29 Years | 632 (8.8%) | 467 (6.4%) |
| 30 to 34 Years | 433 (6.1%) | 447 (6.2%) |
| 35 to 39 Years | 298 (4.2%) | 347 (4.8%) |
| 40 to 44 Years | 446 (6.2%) | 448 (6.2%) |
| 45 to 49 Years | 447 (6.3%) | 422 (5.8%) |
| 50 to 54 Years | 430 (6.0%) | 465 (6.4%) |
| 55 to 59 Years | 377 (5.3%) | 489 (6.8%) |
| 60 to 64 Years | 410 (5.7%) | 601 (8.3%) |
| 65 to 69 Years | 275 (3.8%) | 540 (7.4%) |
| 70 to 74 Years | 446 (6.2%) | 354 (4.9%) |
| 75 to 79 Years | 136 (1.9%) | 241 (3.3%) |
| 80 to 84 Years | 105 (1.5%) | 199 (2.8%) |
| 85 Years and over | 92 (1.3%) | 119 (1.6%) |
| Total | 7,139 (100.0%) | 7,248 (100.0%) |
Families and Households in Washington Court House
Median Family Size in Washington Court House
The median family size in Washington Court House is 2.97 persons per family, with married-couple families (2,272 | 63.9%) accounting for the largest median family size of 3.1 persons per family. On the other hand, single male/father families (487 | 13.7%) represent the smallest median family size with 2.57 persons per family.

| Family Type | # Families | Family Size |
| Married-Couple | 2,272 (63.9%) | 3.10 |
| Single Male/Father | 487 (13.7%) | 2.57 |
| Single Female/Mother | 798 (22.4%) | 2.84 |
| Total Families | 3,557 (100.0%) | 2.97 |
Median Household Size in Washington Court House
The median household size in Washington Court House is 2.37 persons per household, with single male/father households (487 | 8.2%) accounting for the largest median household size of 3.17 persons per household. non-family households (2,384 | 40.1%) represent the smallest median household size with 1.26 persons per household.
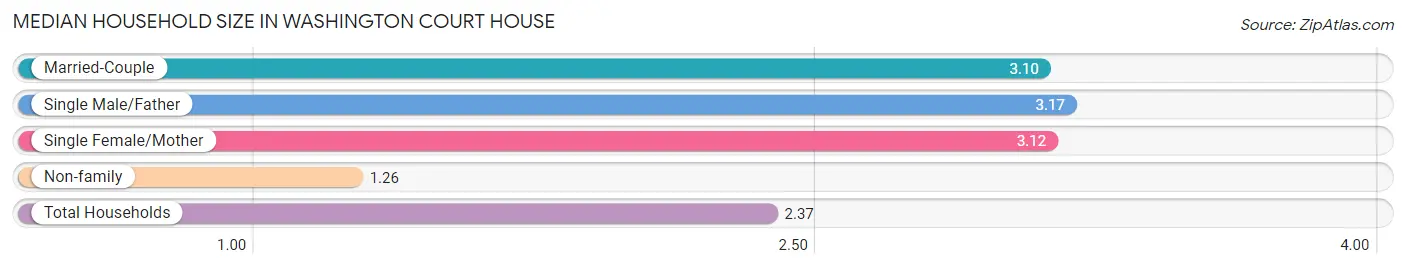
| Household Type | # Households | Household Size |
| Married-Couple | 2,272 (38.2%) | 3.10 |
| Single Male/Father | 487 (8.2%) | 3.17 |
| Single Female/Mother | 798 (13.4%) | 3.12 |
| Non-family | 2,384 (40.1%) | 1.26 |
| Total Households | 5,941 (100.0%) | 2.37 |
Household Size by Marriage Status in Washington Court House
Out of a total of 5,941 households in Washington Court House, 3,557 (59.9%) are family households, while 2,384 (40.1%) are nonfamily households. The most numerous type of family households are 2-person households, comprising 1,606, and the most common type of nonfamily households are 1-person households, comprising 2,044.
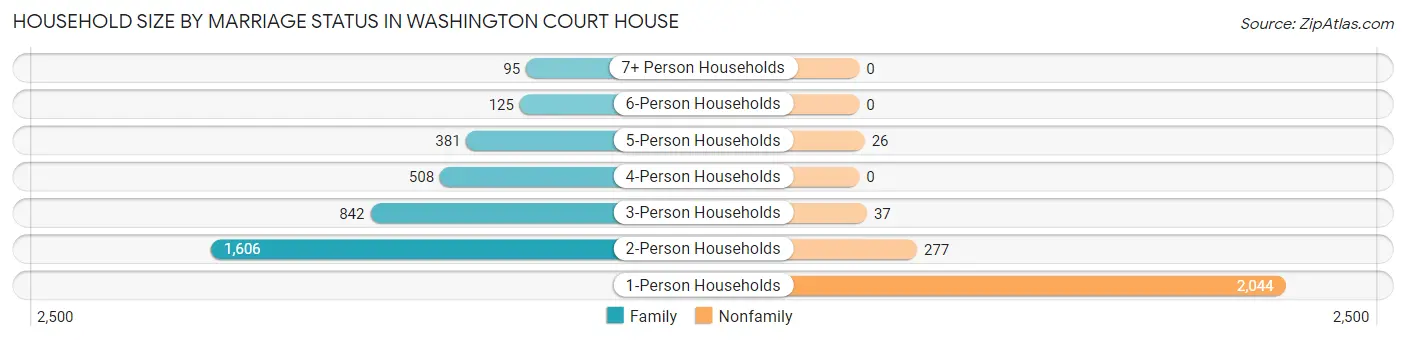
| Household Size | Family Households | Nonfamily Households |
| 1-Person Households | - | 2,044 (34.4%) |
| 2-Person Households | 1,606 (27.0%) | 277 (4.7%) |
| 3-Person Households | 842 (14.2%) | 37 (0.6%) |
| 4-Person Households | 508 (8.6%) | 0 (0.0%) |
| 5-Person Households | 381 (6.4%) | 26 (0.4%) |
| 6-Person Households | 125 (2.1%) | 0 (0.0%) |
| 7+ Person Households | 95 (1.6%) | 0 (0.0%) |
| Total | 3,557 (59.9%) | 2,384 (40.1%) |
Female Fertility in Washington Court House
Fertility by Age in Washington Court House
Average fertility rate in Washington Court House is 80.0 births per 1,000 women. Women in the age bracket of 20 to 34 years have the highest fertility rate with 120.0 births per 1,000 women. Women in the age bracket of 20 to 34 years acount for 70.7% of all women with births.
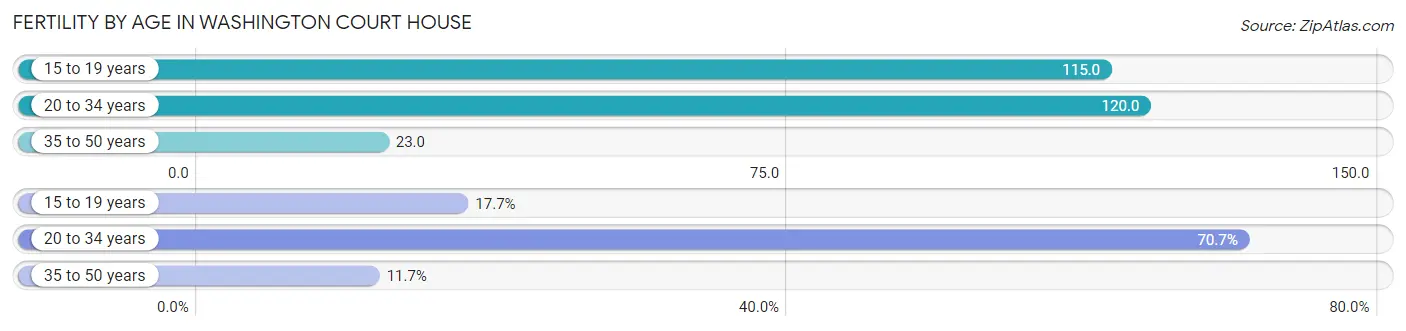
| Age Bracket | Women with Births | Births / 1,000 Women |
| 15 to 19 years | 44 (17.7%) | 115.0 |
| 20 to 34 years | 176 (70.7%) | 120.0 |
| 35 to 50 years | 29 (11.7%) | 23.0 |
| Total | 249 (100.0%) | 80.0 |
Fertility by Age by Marriage Status in Washington Court House
30.1% of women with births (249) in Washington Court House are married. The highest percentage of unmarried women with births falls into 15 to 19 years age bracket with 100.0% of them unmarried at the time of birth, while the lowest percentage of unmarried women with births belong to 20 to 34 years age bracket with 57.4% of them unmarried.
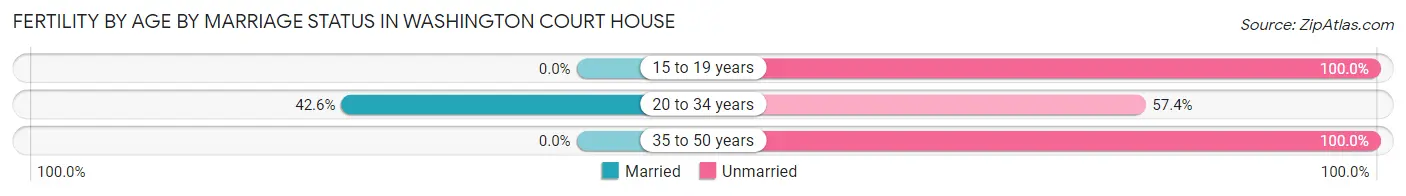
| Age Bracket | Married | Unmarried |
| 15 to 19 years | 0 (0.0%) | 44 (100.0%) |
| 20 to 34 years | 75 (42.6%) | 101 (57.4%) |
| 35 to 50 years | 0 (0.0%) | 29 (100.0%) |
| Total | 75 (30.1%) | 174 (69.9%) |
Fertility by Education in Washington Court House
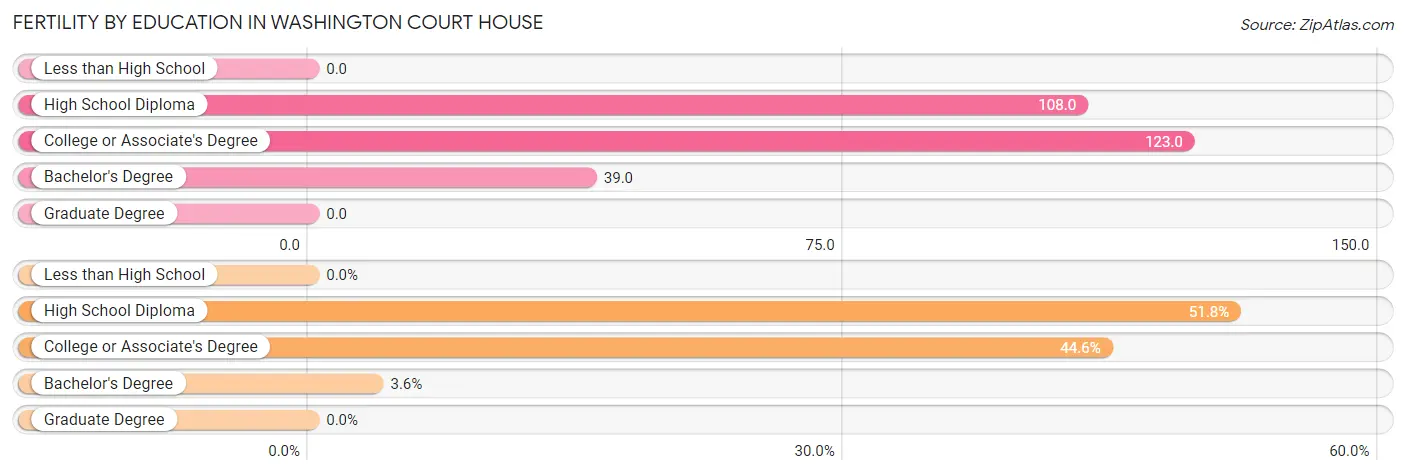
| Educational Attainment | Women with Births | Births / 1,000 Women |
| Less than High School | 0 (0.0%) | 0.0 |
| High School Diploma | 129 (51.8%) | 108.0 |
| College or Associate's Degree | 111 (44.6%) | 123.0 |
| Bachelor's Degree | 9 (3.6%) | 39.0 |
| Graduate Degree | 0 (0.0%) | 0.0 |
| Total | 249 (100.0%) | 80.0 |
Fertility by Education by Marriage Status in Washington Court House
69.9% of women with births in Washington Court House are unmarried. Women with the educational attainment of bachelor's degree are most likely to be married with 100.0% of them married at childbirth, while women with the educational attainment of high school diploma are least likely to be married with 78.3% of them unmarried at childbirth.
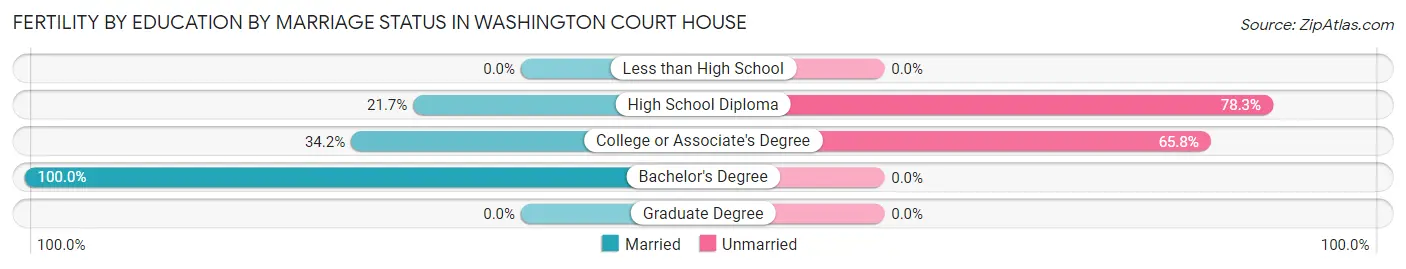
| Educational Attainment | Married | Unmarried |
| Less than High School | 0 (0.0%) | 0 (0.0%) |
| High School Diploma | 28 (21.7%) | 101 (78.3%) |
| College or Associate's Degree | 38 (34.2%) | 73 (65.8%) |
| Bachelor's Degree | 9 (100.0%) | 0 (0.0%) |
| Graduate Degree | 0 (0.0%) | 0 (0.0%) |
| Total | 75 (30.1%) | 174 (69.9%) |
Employment Characteristics in Washington Court House
Employment by Class of Employer in Washington Court House
Among the 6,309 employed individuals in Washington Court House, private company employees (4,748 | 75.3%), local government employees (670 | 10.6%), and not-for-profit organizations (259 | 4.1%) make up the most common classes of employment.
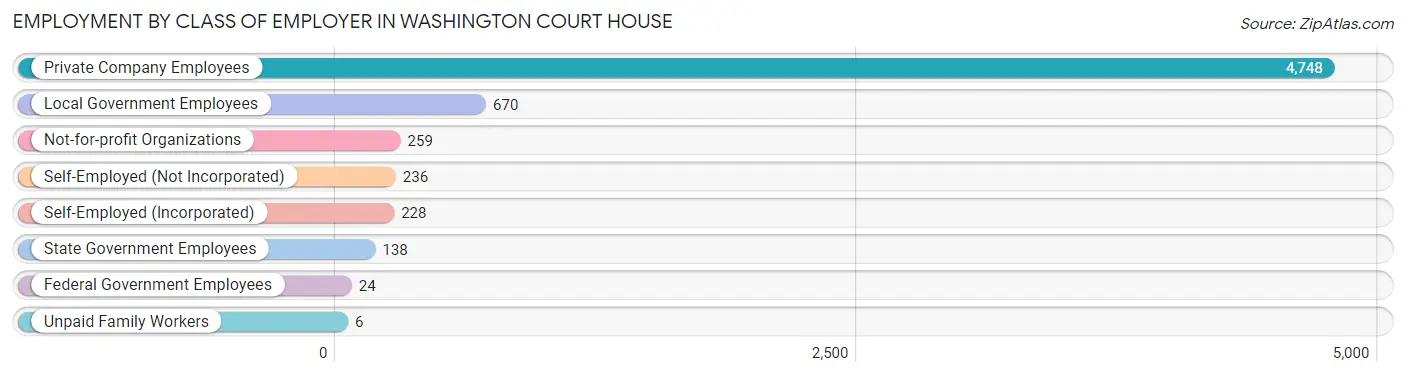
| Employer Class | # Employees | % Employees |
| Private Company Employees | 4,748 | 75.3% |
| Self-Employed (Incorporated) | 228 | 3.6% |
| Self-Employed (Not Incorporated) | 236 | 3.7% |
| Not-for-profit Organizations | 259 | 4.1% |
| Local Government Employees | 670 | 10.6% |
| State Government Employees | 138 | 2.2% |
| Federal Government Employees | 24 | 0.4% |
| Unpaid Family Workers | 6 | 0.1% |
| Total | 6,309 | 100.0% |
Employment Status by Age in Washington Court House
According to the labor force statistics for Washington Court House, out of the total population over 16 years of age (11,355), 60.2% or 6,836 individuals are in the labor force, with 6.0% or 410 of them unemployed. The age group with the highest labor force participation rate is 20 to 24 years, with 84.9% or 869 individuals in the labor force. Within the labor force, the 16 to 19 years age range has the highest percentage of unemployed individuals, with 19.7% or 77 of them being unemployed.
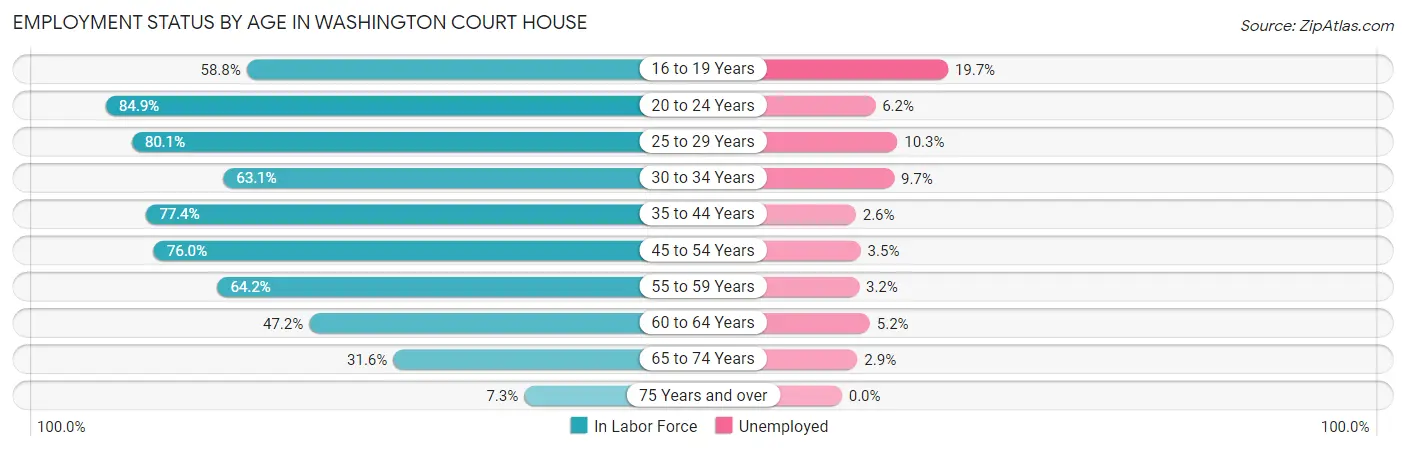
| Age Bracket | In Labor Force | Unemployed |
| 16 to 19 Years | 391 (58.8%) | 77 (19.7%) |
| 20 to 24 Years | 869 (84.9%) | 54 (6.2%) |
| 25 to 29 Years | 880 (80.1%) | 91 (10.3%) |
| 30 to 34 Years | 555 (63.1%) | 54 (9.7%) |
| 35 to 44 Years | 1,191 (77.4%) | 31 (2.6%) |
| 45 to 54 Years | 1,341 (76.0%) | 47 (3.5%) |
| 55 to 59 Years | 556 (64.2%) | 18 (3.2%) |
| 60 to 64 Years | 477 (47.2%) | 25 (5.2%) |
| 65 to 74 Years | 510 (31.6%) | 15 (2.9%) |
| 75 Years and over | 65 (7.3%) | 0 (0.0%) |
| Total | 6,836 (60.2%) | 410 (6.0%) |
Employment Status by Educational Attainment in Washington Court House
According to labor force statistics for Washington Court House, 69.8% of individuals (4,997) out of the total population between 25 and 64 years of age (7,159) are in the labor force, with 5.3% or 265 of them being unemployed. The group with the highest labor force participation rate are those with the educational attainment of bachelor's degree or higher, with 92.3% or 961 individuals in the labor force. Within the labor force, individuals with less than high school education have the highest percentage of unemployment, with 19.4% or 87 of them being unemployed.
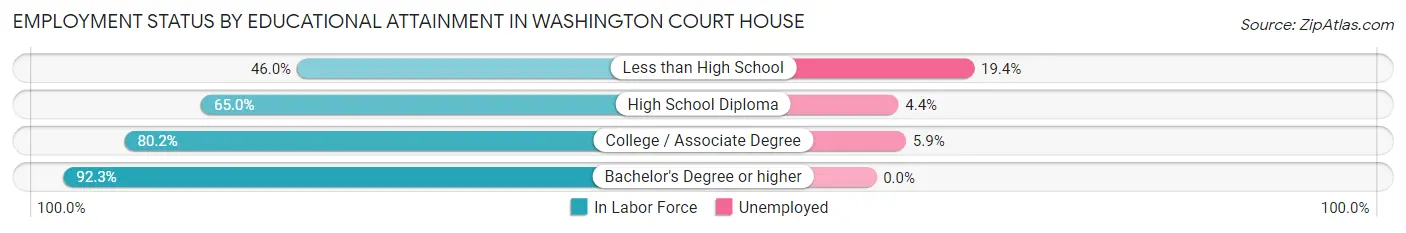
| Educational Attainment | In Labor Force | Unemployed |
| Less than High School | 449 (46.0%) | 189 (19.4%) |
| High School Diploma | 2,280 (65.0%) | 154 (4.4%) |
| College / Associate Degree | 1,310 (80.2%) | 96 (5.9%) |
| Bachelor's Degree or higher | 961 (92.3%) | 0 (0.0%) |
| Total | 4,997 (69.8%) | 379 (5.3%) |
Employment Occupations by Sex in Washington Court House
Management, Business, Science and Arts Occupations
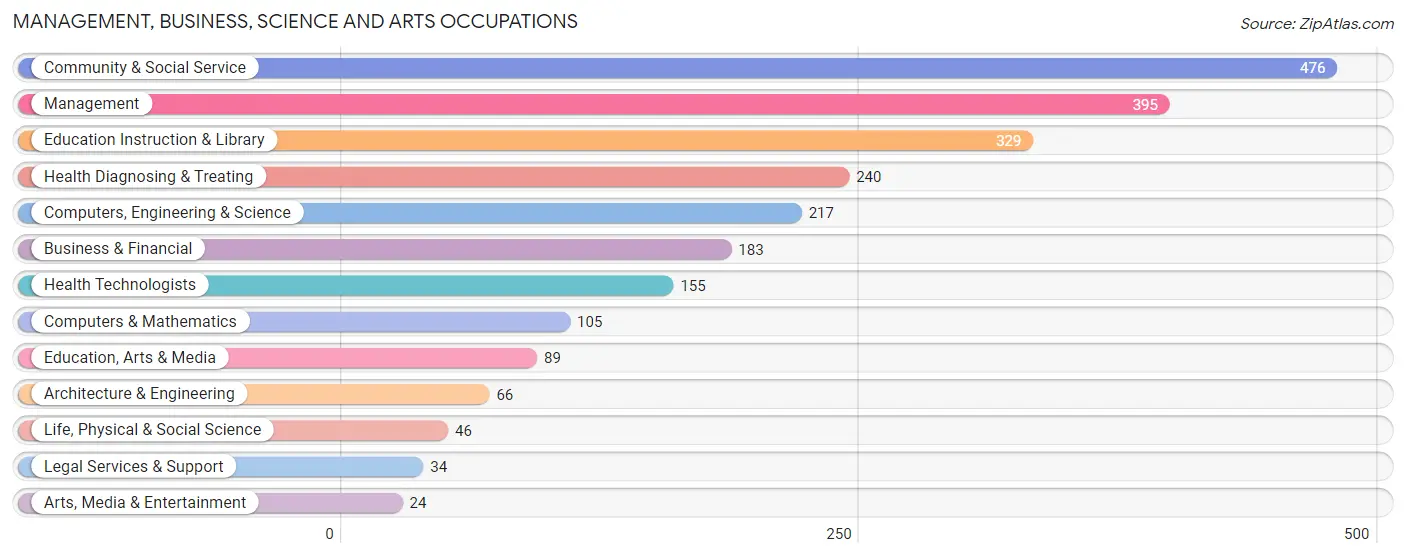
The most common Management, Business, Science and Arts occupations in Washington Court House are Community & Social Service (476 | 7.4%), Management (395 | 6.1%), Education Instruction & Library (329 | 5.1%), Health Diagnosing & Treating (240 | 3.7%), and Computers, Engineering & Science (217 | 3.4%).
Management, Business, Science and Arts Occupations by Sex
Within the Management, Business, Science and Arts occupations in Washington Court House, the most male-oriented occupations are Computers & Mathematics (100.0%), Architecture & Engineering (86.4%), and Management (83.0%), while the most female-oriented occupations are Life, Physical & Social Science (100.0%), Health Diagnosing & Treating (81.7%), and Health Technologists (76.1%).
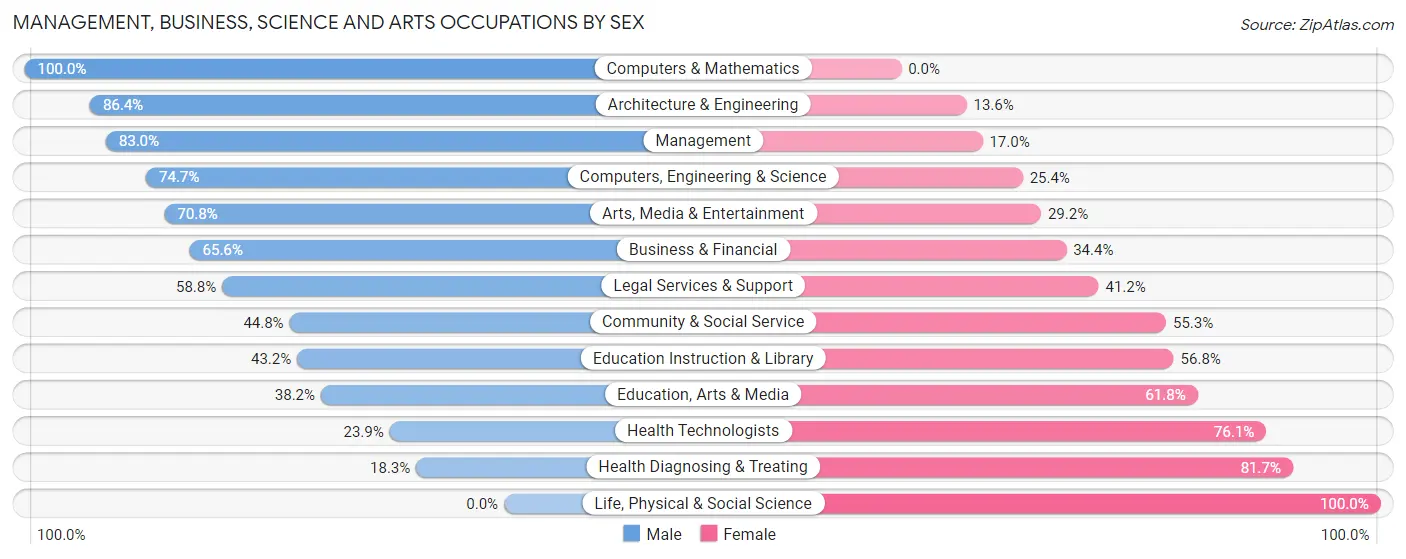
| Occupation | Male | Female |
| Management | 328 (83.0%) | 67 (17.0%) |
| Business & Financial | 120 (65.6%) | 63 (34.4%) |
| Computers, Engineering & Science | 162 (74.7%) | 55 (25.4%) |
| Computers & Mathematics | 105 (100.0%) | 0 (0.0%) |
| Architecture & Engineering | 57 (86.4%) | 9 (13.6%) |
| Life, Physical & Social Science | 0 (0.0%) | 46 (100.0%) |
| Community & Social Service | 213 (44.8%) | 263 (55.2%) |
| Education, Arts & Media | 34 (38.2%) | 55 (61.8%) |
| Legal Services & Support | 20 (58.8%) | 14 (41.2%) |
| Education Instruction & Library | 142 (43.2%) | 187 (56.8%) |
| Arts, Media & Entertainment | 17 (70.8%) | 7 (29.2%) |
| Health Diagnosing & Treating | 44 (18.3%) | 196 (81.7%) |
| Health Technologists | 37 (23.9%) | 118 (76.1%) |
| Total (Category) | 867 (57.4%) | 644 (42.6%) |
| Total (Overall) | 3,505 (54.6%) | 2,919 (45.4%) |
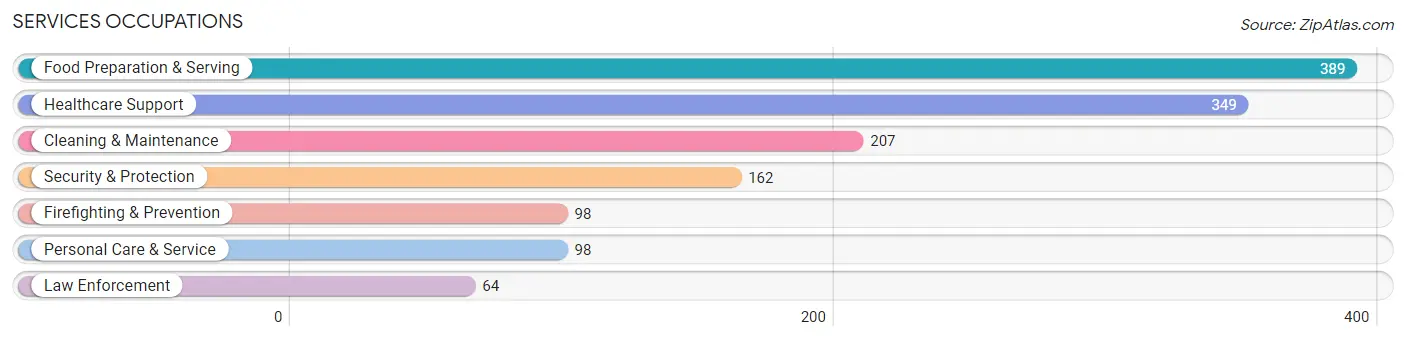
Services Occupations
The most common Services occupations in Washington Court House are Food Preparation & Serving (389 | 6.1%), Healthcare Support (349 | 5.4%), Cleaning & Maintenance (207 | 3.2%), Security & Protection (162 | 2.5%), and Firefighting & Prevention (98 | 1.5%).
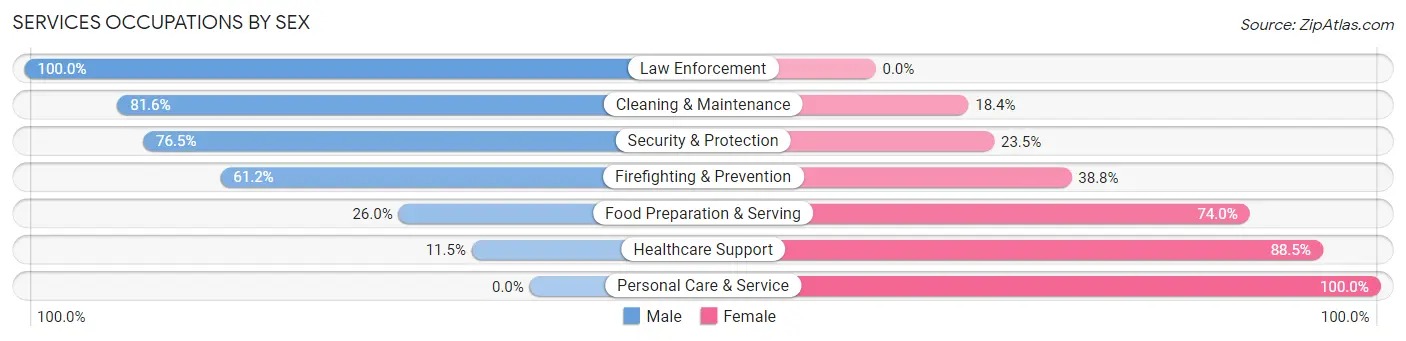
Services Occupations by Sex
Within the Services occupations in Washington Court House, the most male-oriented occupations are Law Enforcement (100.0%), Cleaning & Maintenance (81.6%), and Security & Protection (76.5%), while the most female-oriented occupations are Personal Care & Service (100.0%), Healthcare Support (88.5%), and Food Preparation & Serving (74.0%).
| Occupation | Male | Female |
| Healthcare Support | 40 (11.5%) | 309 (88.5%) |
| Security & Protection | 124 (76.5%) | 38 (23.5%) |
| Firefighting & Prevention | 60 (61.2%) | 38 (38.8%) |
| Law Enforcement | 64 (100.0%) | 0 (0.0%) |
| Food Preparation & Serving | 101 (26.0%) | 288 (74.0%) |
| Cleaning & Maintenance | 169 (81.6%) | 38 (18.4%) |
| Personal Care & Service | 0 (0.0%) | 98 (100.0%) |
| Total (Category) | 434 (36.0%) | 771 (64.0%) |
| Total (Overall) | 3,505 (54.6%) | 2,919 (45.4%) |
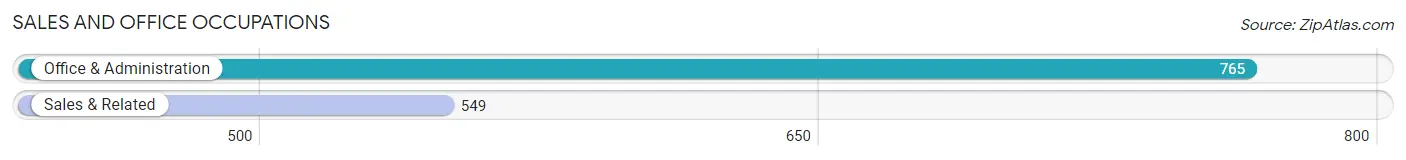
Sales and Office Occupations
The most common Sales and Office occupations in Washington Court House are Office & Administration (765 | 11.9%), and Sales & Related (549 | 8.6%).
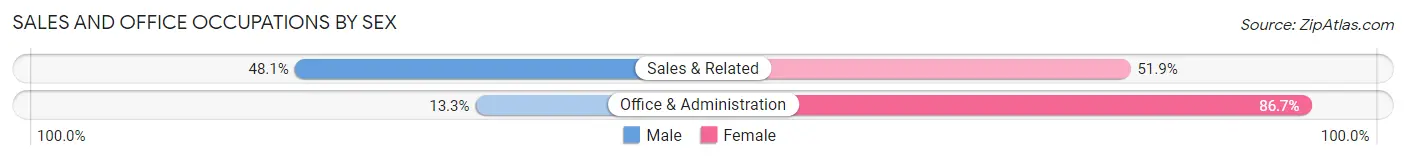
Sales and Office Occupations by Sex
| Occupation | Male | Female |
| Sales & Related | 264 (48.1%) | 285 (51.9%) |
| Office & Administration | 102 (13.3%) | 663 (86.7%) |
| Total (Category) | 366 (27.9%) | 948 (72.2%) |
| Total (Overall) | 3,505 (54.6%) | 2,919 (45.4%) |
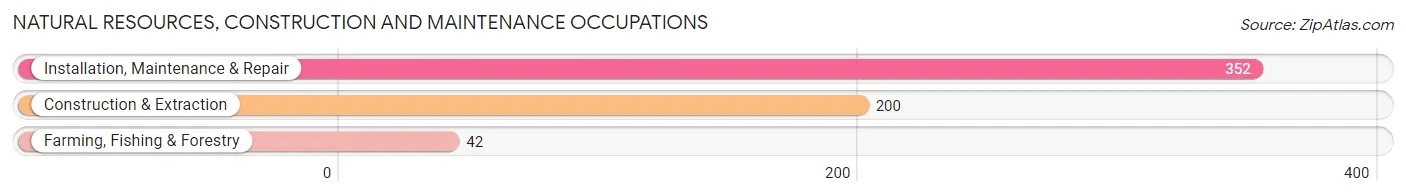
Natural Resources, Construction and Maintenance Occupations
The most common Natural Resources, Construction and Maintenance occupations in Washington Court House are Installation, Maintenance & Repair (352 | 5.5%), Construction & Extraction (200 | 3.1%), and Farming, Fishing & Forestry (42 | 0.6%).
Natural Resources, Construction and Maintenance Occupations by Sex
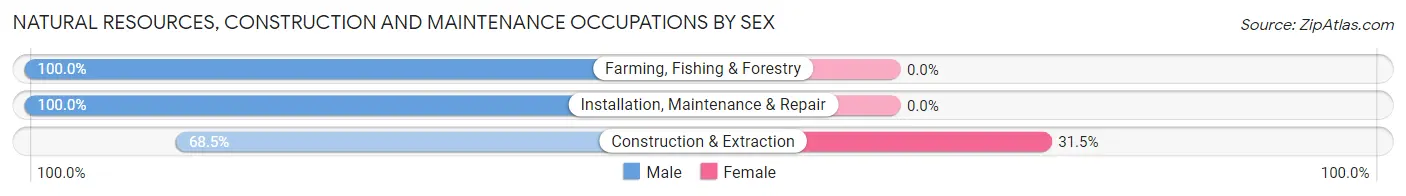
| Occupation | Male | Female |
| Farming, Fishing & Forestry | 42 (100.0%) | 0 (0.0%) |
| Construction & Extraction | 137 (68.5%) | 63 (31.5%) |
| Installation, Maintenance & Repair | 352 (100.0%) | 0 (0.0%) |
| Total (Category) | 531 (89.4%) | 63 (10.6%) |
| Total (Overall) | 3,505 (54.6%) | 2,919 (45.4%) |
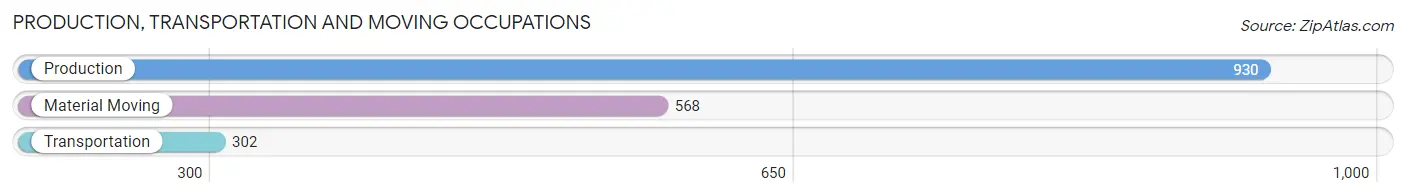
Production, Transportation and Moving Occupations
The most common Production, Transportation and Moving occupations in Washington Court House are Production (930 | 14.5%), Material Moving (568 | 8.8%), and Transportation (302 | 4.7%).
Production, Transportation and Moving Occupations by Sex
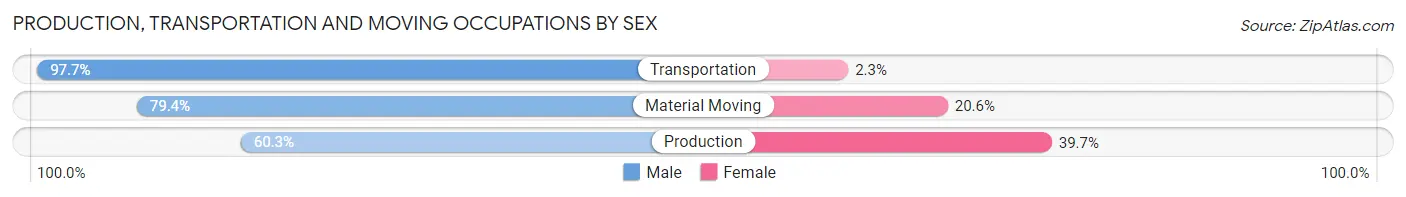
| Occupation | Male | Female |
| Production | 561 (60.3%) | 369 (39.7%) |
| Transportation | 295 (97.7%) | 7 (2.3%) |
| Material Moving | 451 (79.4%) | 117 (20.6%) |
| Total (Category) | 1,307 (72.6%) | 493 (27.4%) |
| Total (Overall) | 3,505 (54.6%) | 2,919 (45.4%) |
Employment Industries by Sex in Washington Court House
Employment Industries in Washington Court House
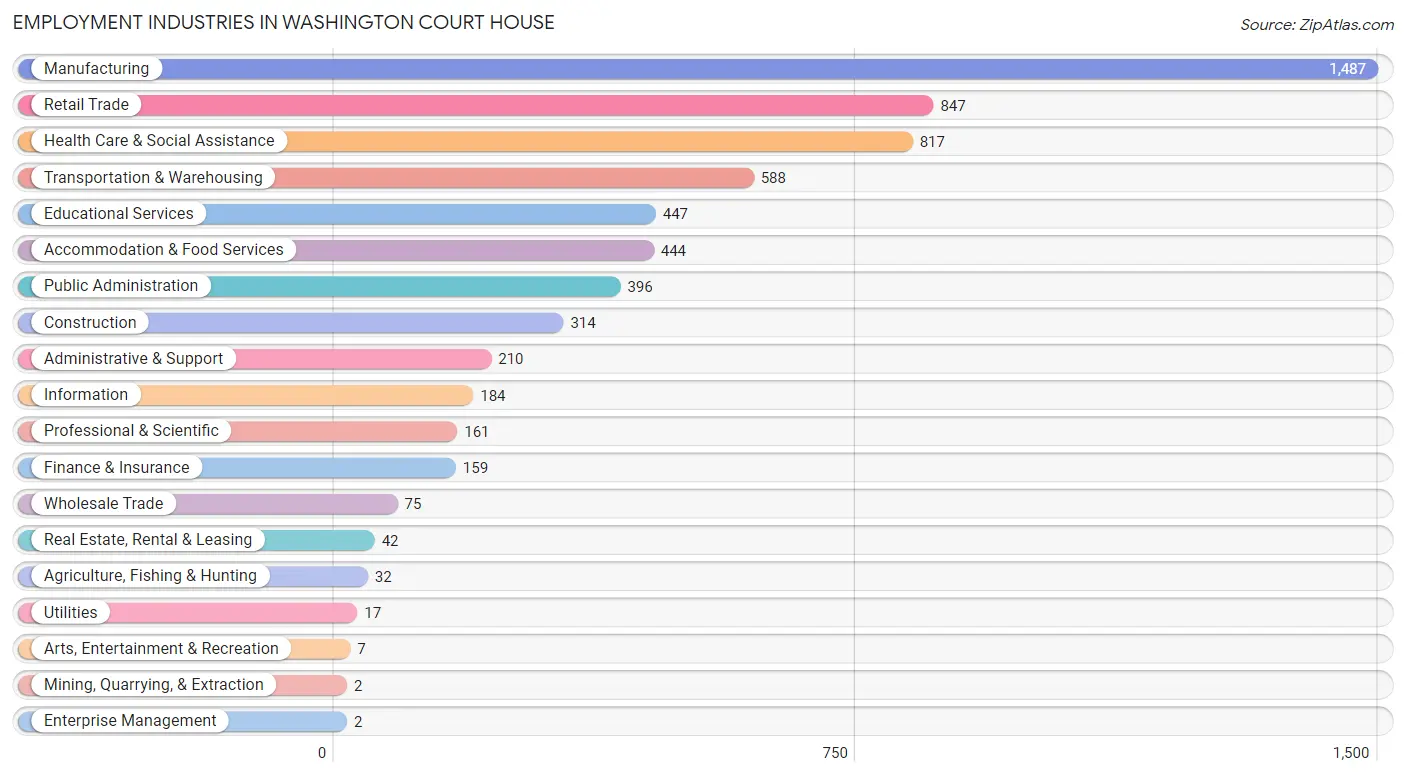
The major employment industries in Washington Court House include Manufacturing (1,487 | 23.2%), Retail Trade (847 | 13.2%), Health Care & Social Assistance (817 | 12.7%), Transportation & Warehousing (588 | 9.1%), and Educational Services (447 | 7.0%).
Employment Industries by Sex in Washington Court House
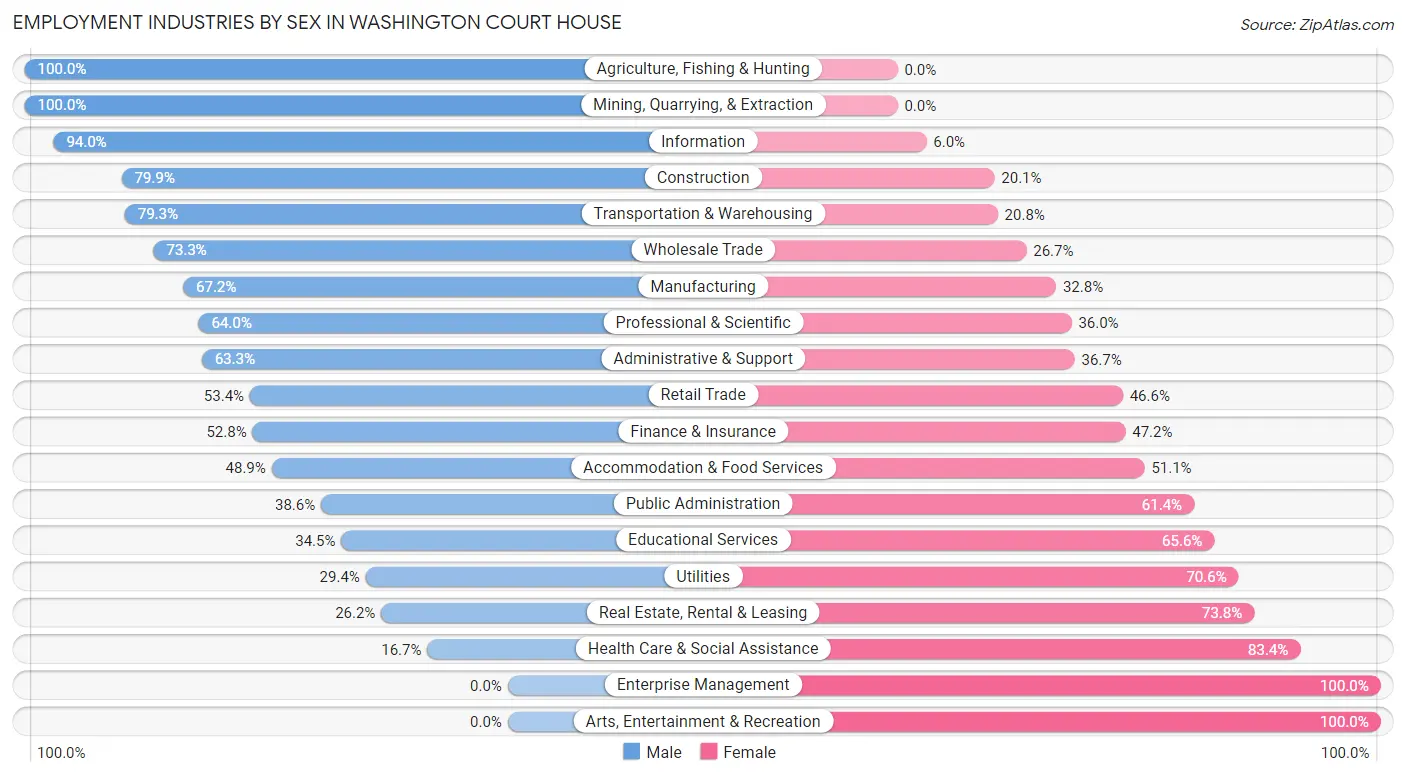
The Washington Court House industries that see more men than women are Agriculture, Fishing & Hunting (100.0%), Mining, Quarrying, & Extraction (100.0%), and Information (94.0%), whereas the industries that tend to have a higher number of women are Enterprise Management (100.0%), Arts, Entertainment & Recreation (100.0%), and Health Care & Social Assistance (83.4%).
| Industry | Male | Female |
| Agriculture, Fishing & Hunting | 32 (100.0%) | 0 (0.0%) |
| Mining, Quarrying, & Extraction | 2 (100.0%) | 0 (0.0%) |
| Construction | 251 (79.9%) | 63 (20.1%) |
| Manufacturing | 999 (67.2%) | 488 (32.8%) |
| Wholesale Trade | 55 (73.3%) | 20 (26.7%) |
| Retail Trade | 452 (53.4%) | 395 (46.6%) |
| Transportation & Warehousing | 466 (79.2%) | 122 (20.7%) |
| Utilities | 5 (29.4%) | 12 (70.6%) |
| Information | 173 (94.0%) | 11 (6.0%) |
| Finance & Insurance | 84 (52.8%) | 75 (47.2%) |
| Real Estate, Rental & Leasing | 11 (26.2%) | 31 (73.8%) |
| Professional & Scientific | 103 (64.0%) | 58 (36.0%) |
| Enterprise Management | 0 (0.0%) | 2 (100.0%) |
| Administrative & Support | 133 (63.3%) | 77 (36.7%) |
| Educational Services | 154 (34.4%) | 293 (65.5%) |
| Health Care & Social Assistance | 136 (16.7%) | 681 (83.4%) |
| Arts, Entertainment & Recreation | 0 (0.0%) | 7 (100.0%) |
| Accommodation & Food Services | 217 (48.9%) | 227 (51.1%) |
| Public Administration | 153 (38.6%) | 243 (61.4%) |
| Total | 3,505 (54.6%) | 2,919 (45.4%) |
Education in Washington Court House
School Enrollment in Washington Court House
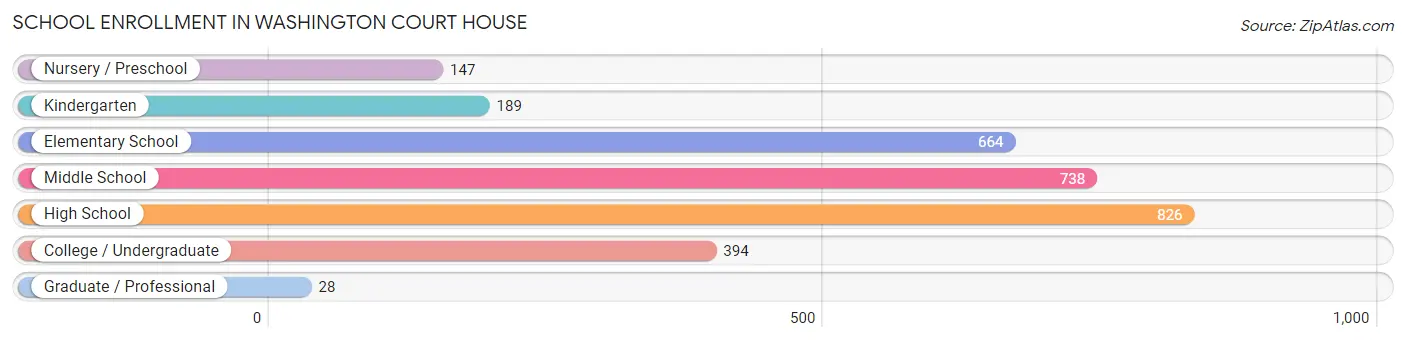
The most common levels of schooling among the 2,986 students in Washington Court House are high school (826 | 27.7%), middle school (738 | 24.7%), and elementary school (664 | 22.2%).
| School Level | # Students | % Students |
| Nursery / Preschool | 147 | 4.9% |
| Kindergarten | 189 | 6.3% |
| Elementary School | 664 | 22.2% |
| Middle School | 738 | 24.7% |
| High School | 826 | 27.7% |
| College / Undergraduate | 394 | 13.2% |
| Graduate / Professional | 28 | 0.9% |
| Total | 2,986 | 100.0% |
School Enrollment by Age by Funding Source in Washington Court House
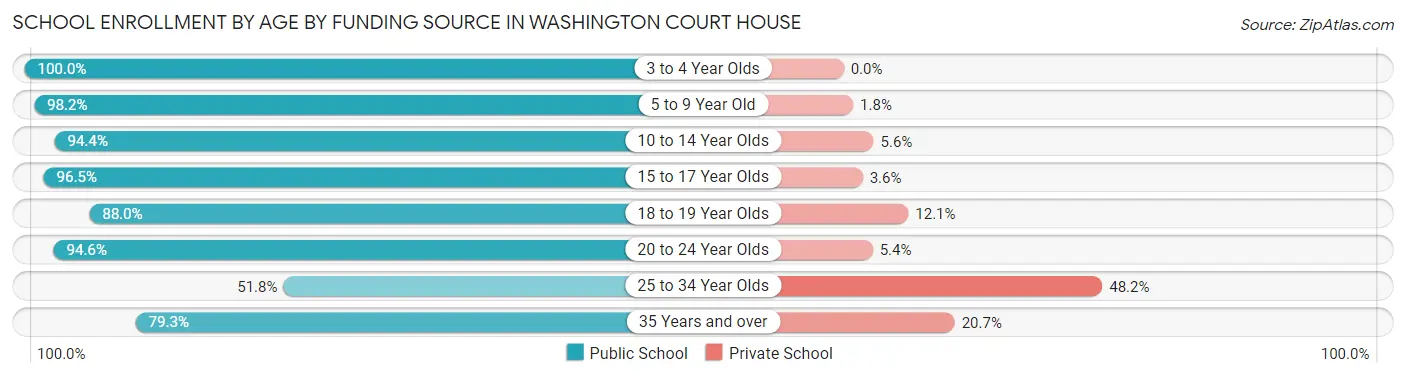
Out of a total of 2,986 students who are enrolled in schools in Washington Court House, 185 (6.2%) attend a private institution, while the remaining 2,801 (93.8%) are enrolled in public schools. The age group of 25 to 34 year olds has the highest likelihood of being enrolled in private schools, with 53 (48.2% in the age bracket) enrolled. Conversely, the age group of 3 to 4 year olds has the lowest likelihood of being enrolled in a private school, with 90 (100.0% in the age bracket) attending a public institution.
| Age Bracket | Public School | Private School |
| 3 to 4 Year Olds | 90 (100.0%) | 0 (0.0%) |
| 5 to 9 Year Old | 776 (98.2%) | 14 (1.8%) |
| 10 to 14 Year Olds | 913 (94.4%) | 54 (5.6%) |
| 15 to 17 Year Olds | 598 (96.5%) | 22 (3.5%) |
| 18 to 19 Year Olds | 146 (87.9%) | 20 (12.0%) |
| 20 to 24 Year Olds | 175 (94.6%) | 10 (5.4%) |
| 25 to 34 Year Olds | 57 (51.8%) | 53 (48.2%) |
| 35 Years and over | 46 (79.3%) | 12 (20.7%) |
| Total | 2,801 (93.8%) | 185 (6.2%) |
Educational Attainment by Field of Study in Washington Court House
Education (294 | 20.0%), business (257 | 17.5%), science & technology (196 | 13.3%), bio, nature & agricultural (143 | 9.7%), and social sciences (117 | 8.0%) are the most common fields of study among 1,470 individuals in Washington Court House who have obtained a bachelor's degree or higher.
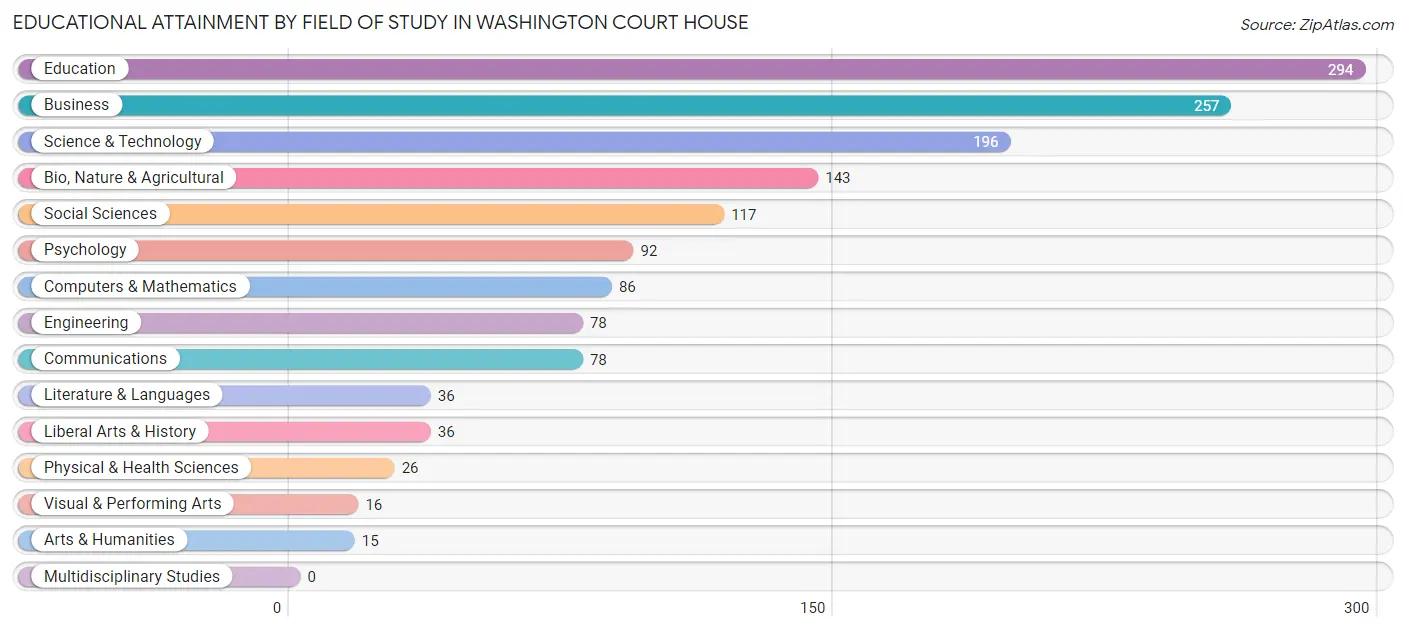
| Field of Study | # Graduates | % Graduates |
| Computers & Mathematics | 86 | 5.9% |
| Bio, Nature & Agricultural | 143 | 9.7% |
| Physical & Health Sciences | 26 | 1.8% |
| Psychology | 92 | 6.3% |
| Social Sciences | 117 | 8.0% |
| Engineering | 78 | 5.3% |
| Multidisciplinary Studies | 0 | 0.0% |
| Science & Technology | 196 | 13.3% |
| Business | 257 | 17.5% |
| Education | 294 | 20.0% |
| Literature & Languages | 36 | 2.5% |
| Liberal Arts & History | 36 | 2.5% |
| Visual & Performing Arts | 16 | 1.1% |
| Communications | 78 | 5.3% |
| Arts & Humanities | 15 | 1.0% |
| Total | 1,470 | 100.0% |
Transportation & Commute in Washington Court House
Vehicle Availability by Sex in Washington Court House
The most prevalent vehicle ownership categories in Washington Court House are males with 2 vehicles (1,254, accounting for 36.2%) and females with 2 vehicles (1,032, making up 44.1%).
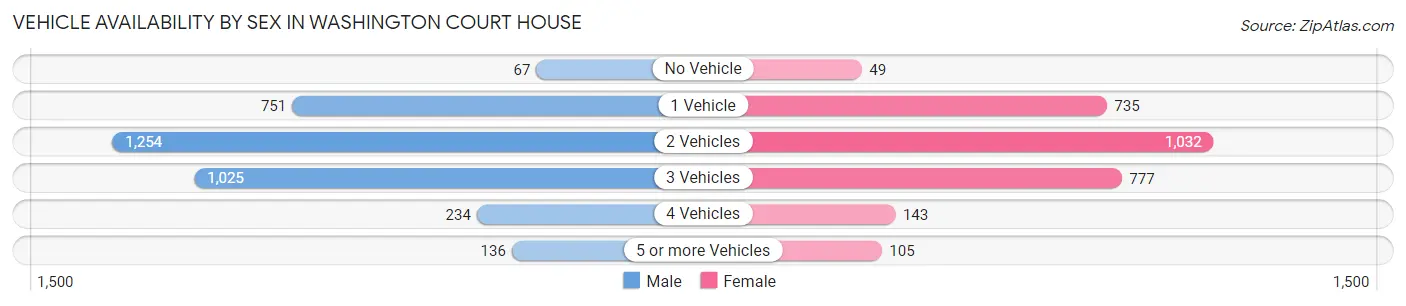
| Vehicles Available | Male | Female |
| No Vehicle | 67 (1.9%) | 49 (1.7%) |
| 1 Vehicle | 751 (21.7%) | 735 (25.9%) |
| 2 Vehicles | 1,254 (36.2%) | 1,032 (36.3%) |
| 3 Vehicles | 1,025 (29.6%) | 777 (27.4%) |
| 4 Vehicles | 234 (6.8%) | 143 (5.0%) |
| 5 or more Vehicles | 136 (3.9%) | 105 (3.7%) |
| Total | 3,467 (100.0%) | 2,841 (100.0%) |
Commute Time in Washington Court House
The most frequently occuring commute durations in Washington Court House are 5 to 9 minutes (1,373 commuters, 22.4%), 10 to 14 minutes (1,234 commuters, 20.1%), and 60 to 89 minutes (563 commuters, 9.2%).
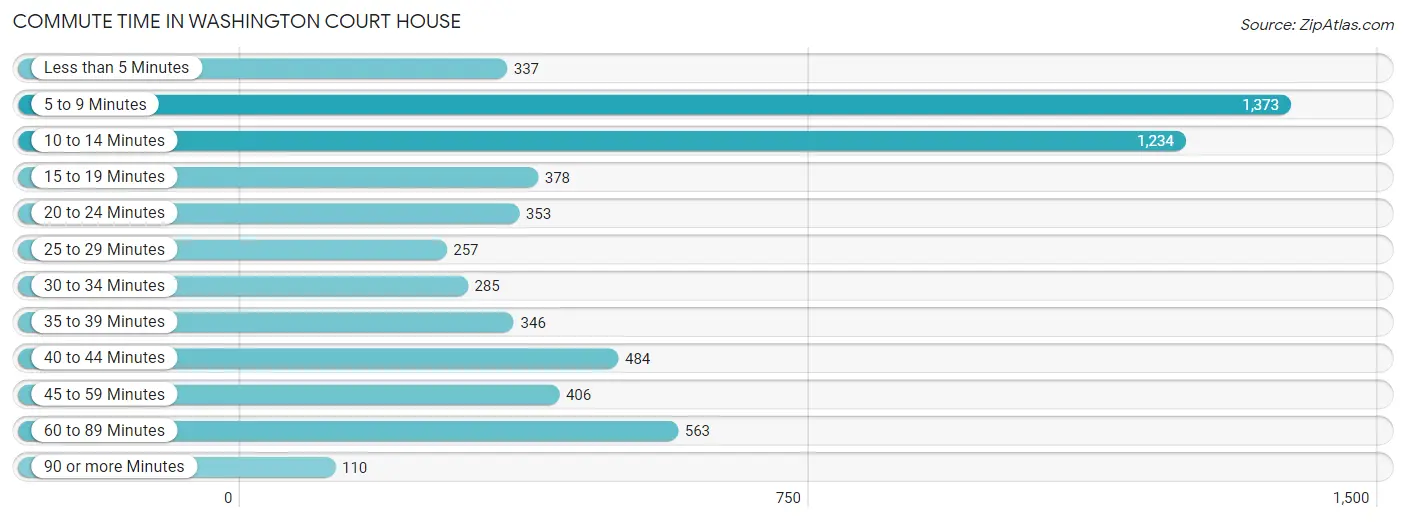
| Commute Time | # Commuters | % Commuters |
| Less than 5 Minutes | 337 | 5.5% |
| 5 to 9 Minutes | 1,373 | 22.4% |
| 10 to 14 Minutes | 1,234 | 20.1% |
| 15 to 19 Minutes | 378 | 6.2% |
| 20 to 24 Minutes | 353 | 5.8% |
| 25 to 29 Minutes | 257 | 4.2% |
| 30 to 34 Minutes | 285 | 4.6% |
| 35 to 39 Minutes | 346 | 5.7% |
| 40 to 44 Minutes | 484 | 7.9% |
| 45 to 59 Minutes | 406 | 6.6% |
| 60 to 89 Minutes | 563 | 9.2% |
| 90 or more Minutes | 110 | 1.8% |
Commute Time by Sex in Washington Court House
The most common commute times in Washington Court House are 5 to 9 minutes (675 commuters, 19.9%) for males and 5 to 9 minutes (698 commuters, 25.5%) for females.
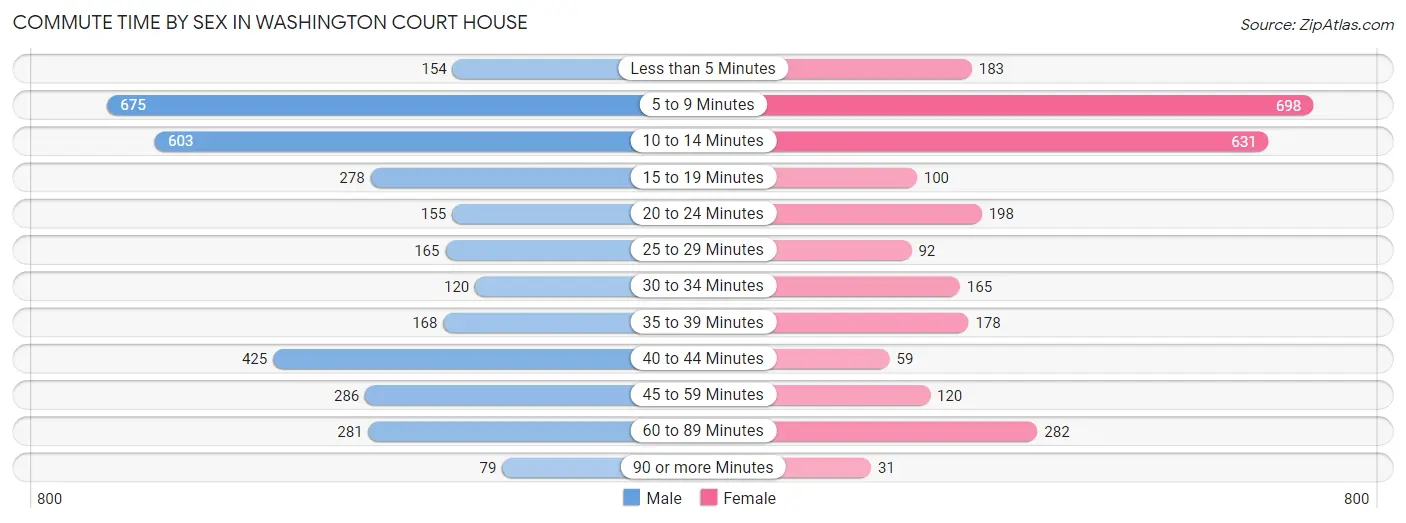
| Commute Time | Male | Female |
| Less than 5 Minutes | 154 (4.5%) | 183 (6.7%) |
| 5 to 9 Minutes | 675 (19.9%) | 698 (25.5%) |
| 10 to 14 Minutes | 603 (17.8%) | 631 (23.1%) |
| 15 to 19 Minutes | 278 (8.2%) | 100 (3.6%) |
| 20 to 24 Minutes | 155 (4.6%) | 198 (7.2%) |
| 25 to 29 Minutes | 165 (4.9%) | 92 (3.4%) |
| 30 to 34 Minutes | 120 (3.5%) | 165 (6.0%) |
| 35 to 39 Minutes | 168 (5.0%) | 178 (6.5%) |
| 40 to 44 Minutes | 425 (12.5%) | 59 (2.2%) |
| 45 to 59 Minutes | 286 (8.4%) | 120 (4.4%) |
| 60 to 89 Minutes | 281 (8.3%) | 282 (10.3%) |
| 90 or more Minutes | 79 (2.3%) | 31 (1.1%) |
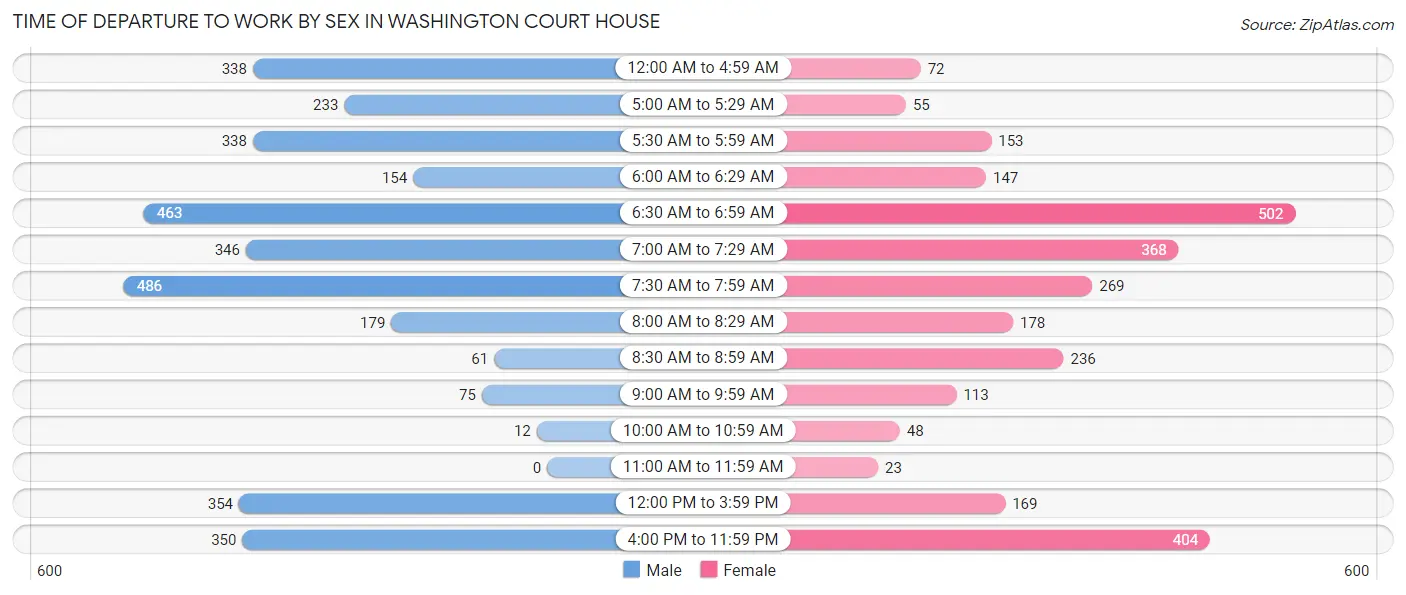
Time of Departure to Work by Sex in Washington Court House
The most frequent times of departure to work in Washington Court House are 7:30 AM to 7:59 AM (486, 14.3%) for males and 6:30 AM to 6:59 AM (502, 18.3%) for females.
| Time of Departure | Male | Female |
| 12:00 AM to 4:59 AM | 338 (10.0%) | 72 (2.6%) |
| 5:00 AM to 5:29 AM | 233 (6.9%) | 55 (2.0%) |
| 5:30 AM to 5:59 AM | 338 (10.0%) | 153 (5.6%) |
| 6:00 AM to 6:29 AM | 154 (4.5%) | 147 (5.4%) |
| 6:30 AM to 6:59 AM | 463 (13.7%) | 502 (18.3%) |
| 7:00 AM to 7:29 AM | 346 (10.2%) | 368 (13.5%) |
| 7:30 AM to 7:59 AM | 486 (14.3%) | 269 (9.8%) |
| 8:00 AM to 8:29 AM | 179 (5.3%) | 178 (6.5%) |
| 8:30 AM to 8:59 AM | 61 (1.8%) | 236 (8.6%) |
| 9:00 AM to 9:59 AM | 75 (2.2%) | 113 (4.1%) |
| 10:00 AM to 10:59 AM | 12 (0.4%) | 48 (1.8%) |
| 11:00 AM to 11:59 AM | 0 (0.0%) | 23 (0.8%) |
| 12:00 PM to 3:59 PM | 354 (10.4%) | 169 (6.2%) |
| 4:00 PM to 11:59 PM | 350 (10.3%) | 404 (14.8%) |
| Total | 3,389 (100.0%) | 2,737 (100.0%) |
Housing Occupancy in Washington Court House
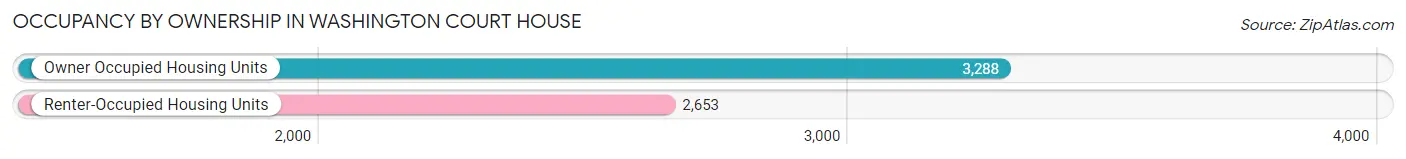
Occupancy by Ownership in Washington Court House
Of the total 5,941 dwellings in Washington Court House, owner-occupied units account for 3,288 (55.3%), while renter-occupied units make up 2,653 (44.7%).
| Occupancy | # Housing Units | % Housing Units |
| Owner Occupied Housing Units | 3,288 | 55.3% |
| Renter-Occupied Housing Units | 2,653 | 44.7% |
| Total Occupied Housing Units | 5,941 | 100.0% |
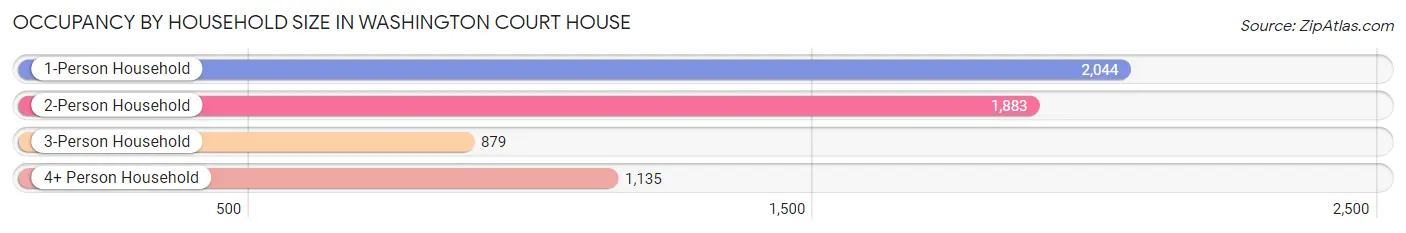
Occupancy by Household Size in Washington Court House
| Household Size | # Housing Units | % Housing Units |
| 1-Person Household | 2,044 | 34.4% |
| 2-Person Household | 1,883 | 31.7% |
| 3-Person Household | 879 | 14.8% |
| 4+ Person Household | 1,135 | 19.1% |
| Total Housing Units | 5,941 | 100.0% |
Occupancy by Ownership by Household Size in Washington Court House
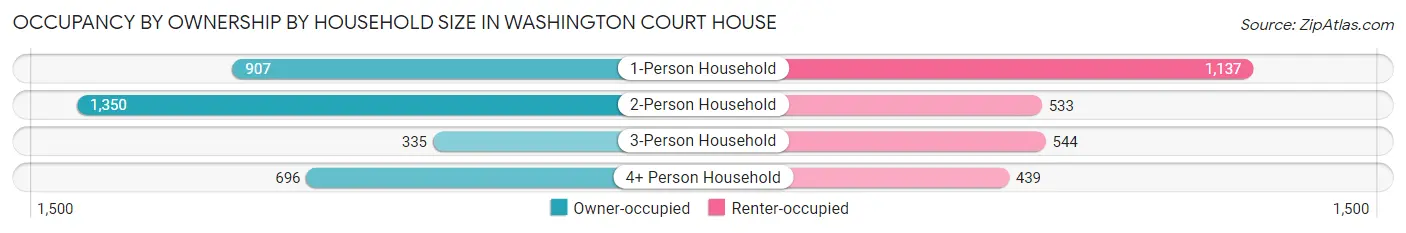
| Household Size | Owner-occupied | Renter-occupied |
| 1-Person Household | 907 (44.4%) | 1,137 (55.6%) |
| 2-Person Household | 1,350 (71.7%) | 533 (28.3%) |
| 3-Person Household | 335 (38.1%) | 544 (61.9%) |
| 4+ Person Household | 696 (61.3%) | 439 (38.7%) |
| Total Housing Units | 3,288 (55.3%) | 2,653 (44.7%) |
Occupancy by Educational Attainment in Washington Court House
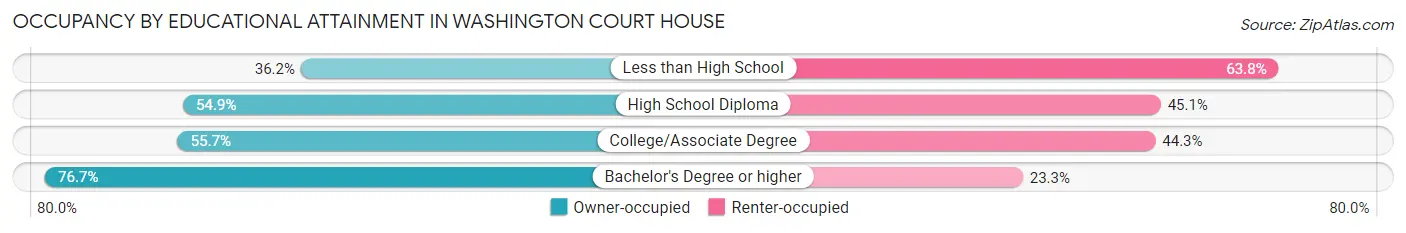
| Household Size | Owner-occupied | Renter-occupied |
| Less than High School | 279 (36.2%) | 492 (63.8%) |
| High School Diploma | 1,639 (54.9%) | 1,348 (45.1%) |
| College/Associate Degree | 809 (55.7%) | 643 (44.3%) |
| Bachelor's Degree or higher | 561 (76.7%) | 170 (23.3%) |
Occupancy by Age of Householder in Washington Court House
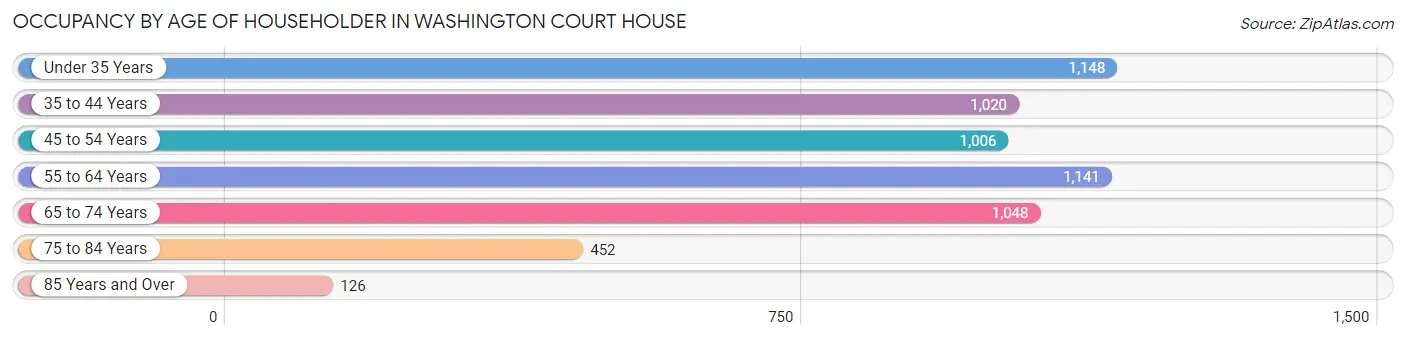
| Age Bracket | # Households | % Households |
| Under 35 Years | 1,148 | 19.3% |
| 35 to 44 Years | 1,020 | 17.2% |
| 45 to 54 Years | 1,006 | 16.9% |
| 55 to 64 Years | 1,141 | 19.2% |
| 65 to 74 Years | 1,048 | 17.6% |
| 75 to 84 Years | 452 | 7.6% |
| 85 Years and Over | 126 | 2.1% |
| Total | 5,941 | 100.0% |
Housing Finances in Washington Court House
Median Income by Occupancy in Washington Court House
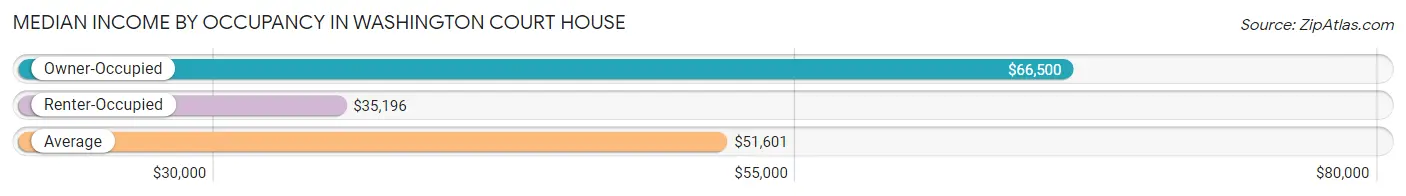
| Occupancy Type | # Households | Median Income |
| Owner-Occupied | 3,288 (55.3%) | $66,500 |
| Renter-Occupied | 2,653 (44.7%) | $35,196 |
| Average | 5,941 (100.0%) | $51,601 |
Occupancy by Householder Income Bracket in Washington Court House
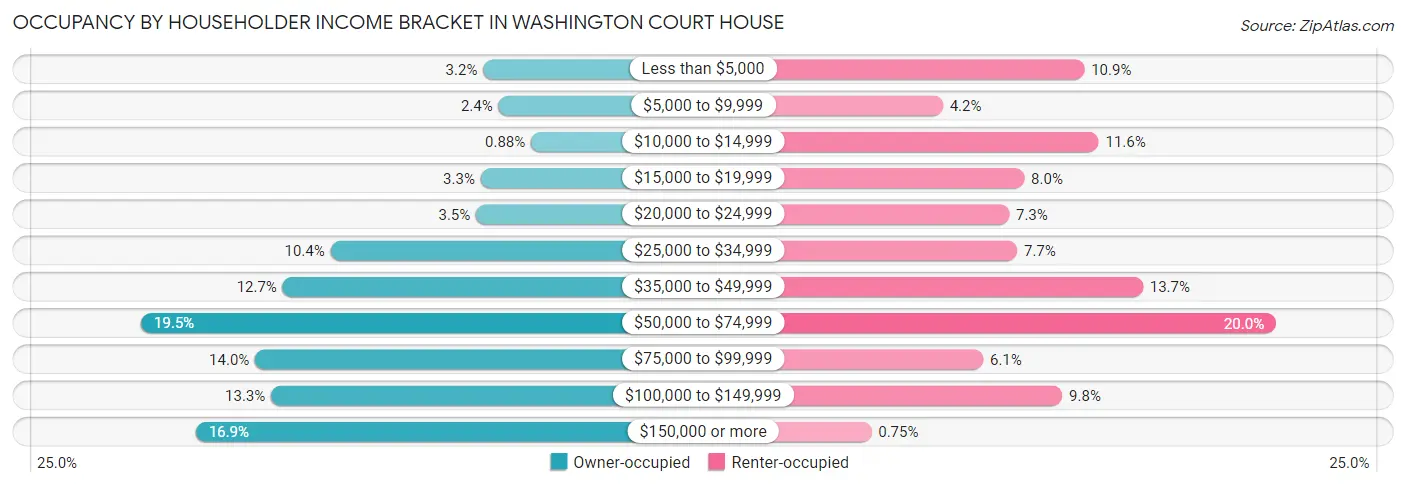
| Income Bracket | Owner-occupied | Renter-occupied |
| Less than $5,000 | 104 (3.2%) | 289 (10.9%) |
| $5,000 to $9,999 | 80 (2.4%) | 110 (4.2%) |
| $10,000 to $14,999 | 29 (0.9%) | 307 (11.6%) |
| $15,000 to $19,999 | 108 (3.3%) | 213 (8.0%) |
| $20,000 to $24,999 | 115 (3.5%) | 194 (7.3%) |
| $25,000 to $34,999 | 343 (10.4%) | 204 (7.7%) |
| $35,000 to $49,999 | 418 (12.7%) | 363 (13.7%) |
| $50,000 to $74,999 | 640 (19.5%) | 531 (20.0%) |
| $75,000 to $99,999 | 461 (14.0%) | 161 (6.1%) |
| $100,000 to $149,999 | 436 (13.3%) | 261 (9.8%) |
| $150,000 or more | 554 (16.9%) | 20 (0.7%) |
| Total | 3,288 (100.0%) | 2,653 (100.0%) |
Monthly Housing Cost Tiers in Washington Court House
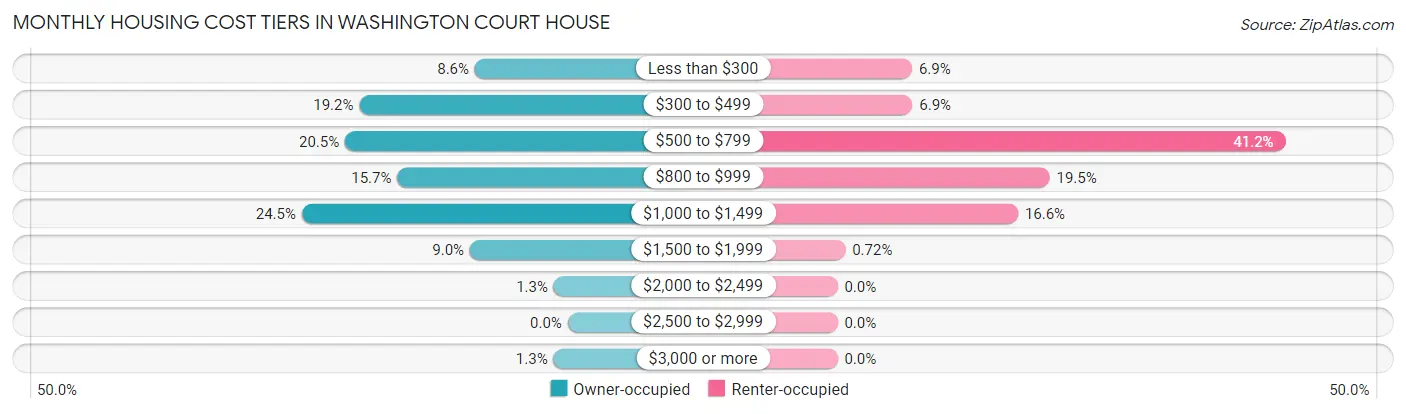
| Monthly Cost | Owner-occupied | Renter-occupied |
| Less than $300 | 281 (8.6%) | 182 (6.9%) |
| $300 to $499 | 631 (19.2%) | 183 (6.9%) |
| $500 to $799 | 674 (20.5%) | 1,094 (41.2%) |
| $800 to $999 | 516 (15.7%) | 518 (19.5%) |
| $1,000 to $1,499 | 805 (24.5%) | 441 (16.6%) |
| $1,500 to $1,999 | 296 (9.0%) | 19 (0.7%) |
| $2,000 to $2,499 | 42 (1.3%) | 0 (0.0%) |
| $2,500 to $2,999 | 0 (0.0%) | 0 (0.0%) |
| $3,000 or more | 43 (1.3%) | 0 (0.0%) |
| Total | 3,288 (100.0%) | 2,653 (100.0%) |
Physical Housing Characteristics in Washington Court House
Housing Structures in Washington Court House
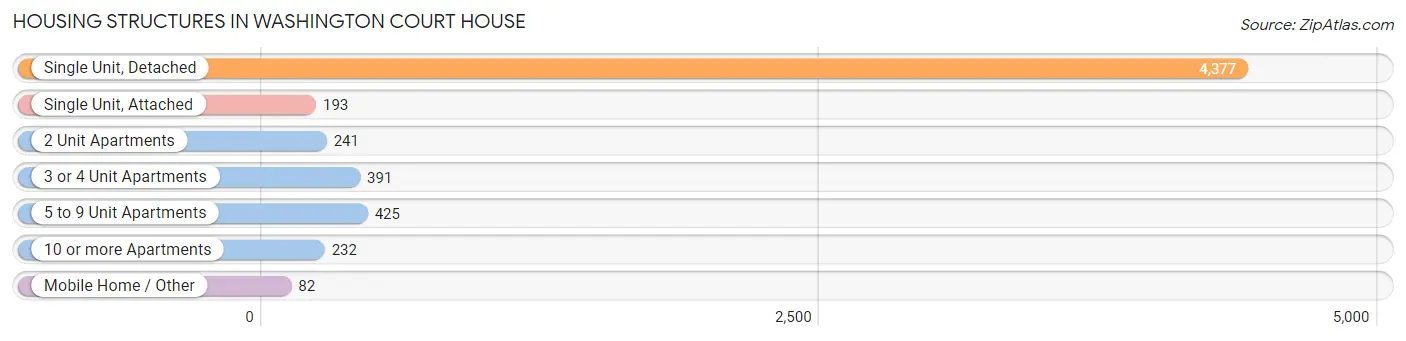
| Structure Type | # Housing Units | % Housing Units |
| Single Unit, Detached | 4,377 | 73.7% |
| Single Unit, Attached | 193 | 3.3% |
| 2 Unit Apartments | 241 | 4.1% |
| 3 or 4 Unit Apartments | 391 | 6.6% |
| 5 to 9 Unit Apartments | 425 | 7.1% |
| 10 or more Apartments | 232 | 3.9% |
| Mobile Home / Other | 82 | 1.4% |
| Total | 5,941 | 100.0% |
Housing Structures by Occupancy in Washington Court House
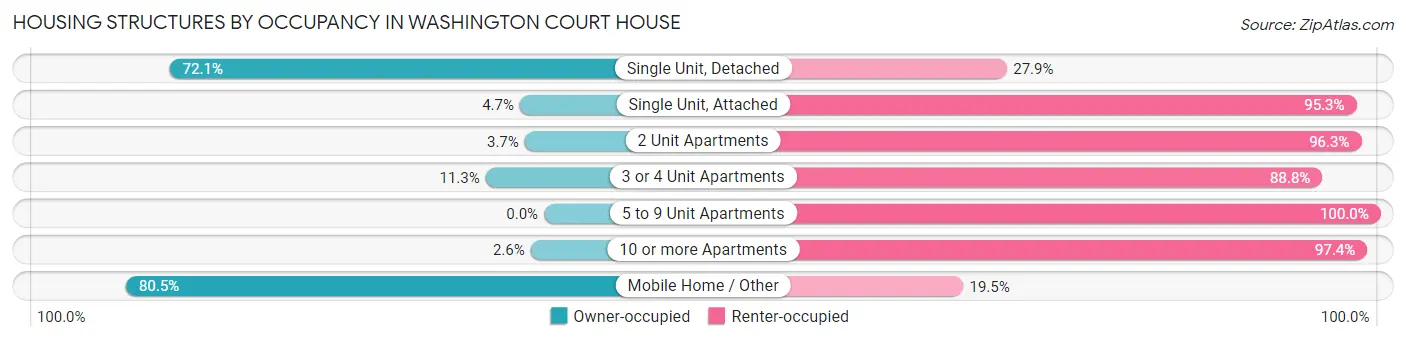
| Structure Type | Owner-occupied | Renter-occupied |
| Single Unit, Detached | 3,154 (72.1%) | 1,223 (27.9%) |
| Single Unit, Attached | 9 (4.7%) | 184 (95.3%) |
| 2 Unit Apartments | 9 (3.7%) | 232 (96.3%) |
| 3 or 4 Unit Apartments | 44 (11.3%) | 347 (88.7%) |
| 5 to 9 Unit Apartments | 0 (0.0%) | 425 (100.0%) |
| 10 or more Apartments | 6 (2.6%) | 226 (97.4%) |
| Mobile Home / Other | 66 (80.5%) | 16 (19.5%) |
| Total | 3,288 (55.3%) | 2,653 (44.7%) |
Housing Structures by Number of Rooms in Washington Court House
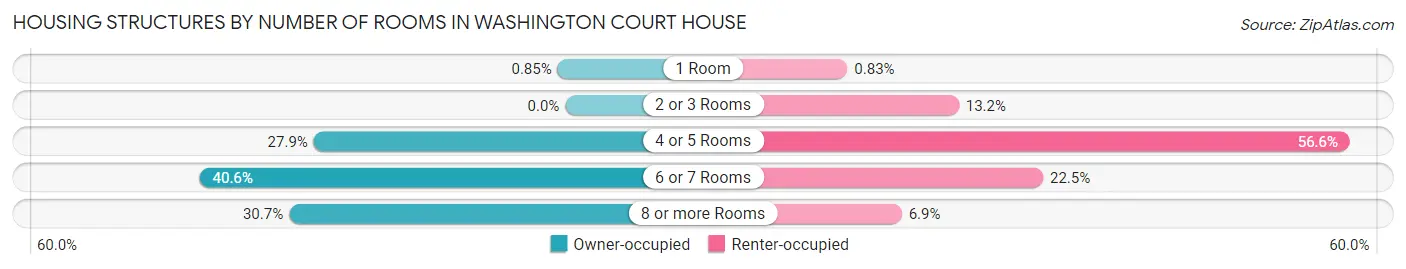
| Number of Rooms | Owner-occupied | Renter-occupied |
| 1 Room | 28 (0.9%) | 22 (0.8%) |
| 2 or 3 Rooms | 0 (0.0%) | 350 (13.2%) |
| 4 or 5 Rooms | 918 (27.9%) | 1,501 (56.6%) |
| 6 or 7 Rooms | 1,334 (40.6%) | 598 (22.5%) |
| 8 or more Rooms | 1,008 (30.7%) | 182 (6.9%) |
| Total | 3,288 (100.0%) | 2,653 (100.0%) |
Housing Structure by Heating Type in Washington Court House
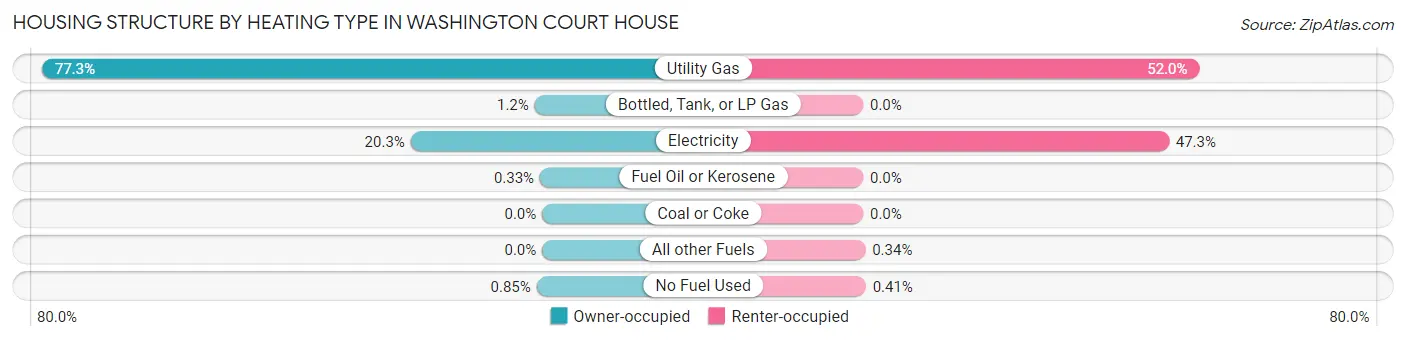
| Heating Type | Owner-occupied | Renter-occupied |
| Utility Gas | 2,543 (77.3%) | 1,379 (52.0%) |
| Bottled, Tank, or LP Gas | 38 (1.2%) | 0 (0.0%) |
| Electricity | 668 (20.3%) | 1,254 (47.3%) |
| Fuel Oil or Kerosene | 11 (0.3%) | 0 (0.0%) |
| Coal or Coke | 0 (0.0%) | 0 (0.0%) |
| All other Fuels | 0 (0.0%) | 9 (0.3%) |
| No Fuel Used | 28 (0.9%) | 11 (0.4%) |
| Total | 3,288 (100.0%) | 2,653 (100.0%) |
Household Vehicle Usage in Washington Court House
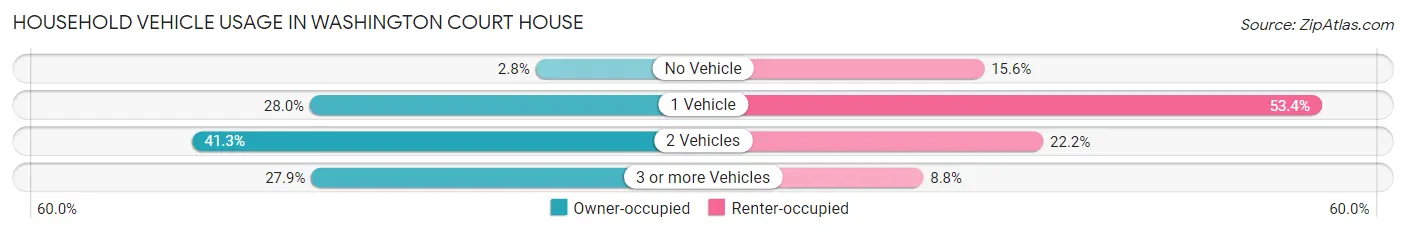
| Vehicles per Household | Owner-occupied | Renter-occupied |
| No Vehicle | 91 (2.8%) | 414 (15.6%) |
| 1 Vehicle | 922 (28.0%) | 1,417 (53.4%) |
| 2 Vehicles | 1,358 (41.3%) | 589 (22.2%) |
| 3 or more Vehicles | 917 (27.9%) | 233 (8.8%) |
| Total | 3,288 (100.0%) | 2,653 (100.0%) |
Real Estate & Mortgages in Washington Court House
Real Estate and Mortgage Overview in Washington Court House
| Characteristic | Without Mortgage | With Mortgage |
| Housing Units | 1,175 | 2,113 |
| Median Property Value | $131,600 | $137,500 |
| Median Household Income | $50,739 | $481 |
| Monthly Housing Costs | $392 | $20 |
| Real Estate Taxes | $1,189 | $103 |
Property Value by Mortgage Status in Washington Court House
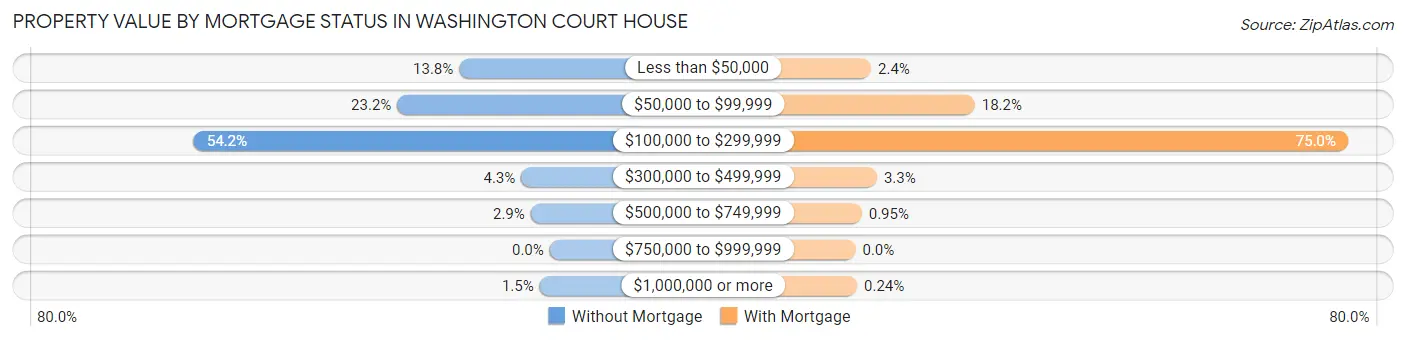
| Property Value | Without Mortgage | With Mortgage |
| Less than $50,000 | 162 (13.8%) | 50 (2.4%) |
| $50,000 to $99,999 | 273 (23.2%) | 384 (18.2%) |
| $100,000 to $299,999 | 637 (54.2%) | 1,585 (75.0%) |
| $300,000 to $499,999 | 51 (4.3%) | 69 (3.3%) |
| $500,000 to $749,999 | 34 (2.9%) | 20 (0.9%) |
| $750,000 to $999,999 | 0 (0.0%) | 0 (0.0%) |
| $1,000,000 or more | 18 (1.5%) | 5 (0.2%) |
| Total | 1,175 (100.0%) | 2,113 (100.0%) |
Household Income by Mortgage Status in Washington Court House
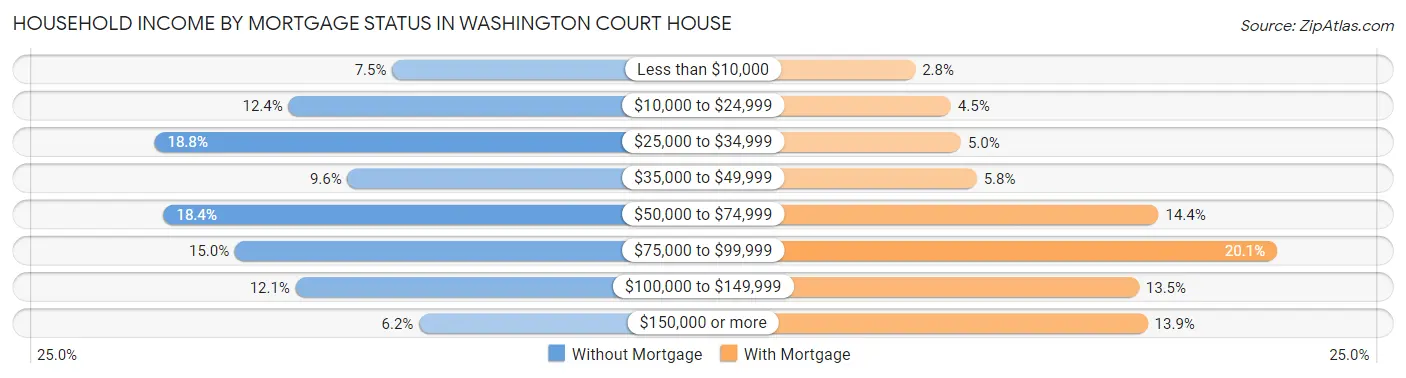
| Household Income | Without Mortgage | With Mortgage |
| Less than $10,000 | 88 (7.5%) | 60 (2.8%) |
| $10,000 to $24,999 | 146 (12.4%) | 96 (4.5%) |
| $25,000 to $34,999 | 221 (18.8%) | 106 (5.0%) |
| $35,000 to $49,999 | 113 (9.6%) | 122 (5.8%) |
| $50,000 to $74,999 | 216 (18.4%) | 305 (14.4%) |
| $75,000 to $99,999 | 176 (15.0%) | 424 (20.1%) |
| $100,000 to $149,999 | 142 (12.1%) | 285 (13.5%) |
| $150,000 or more | 73 (6.2%) | 294 (13.9%) |
| Total | 1,175 (100.0%) | 2,113 (100.0%) |
Property Value to Household Income Ratio in Washington Court House
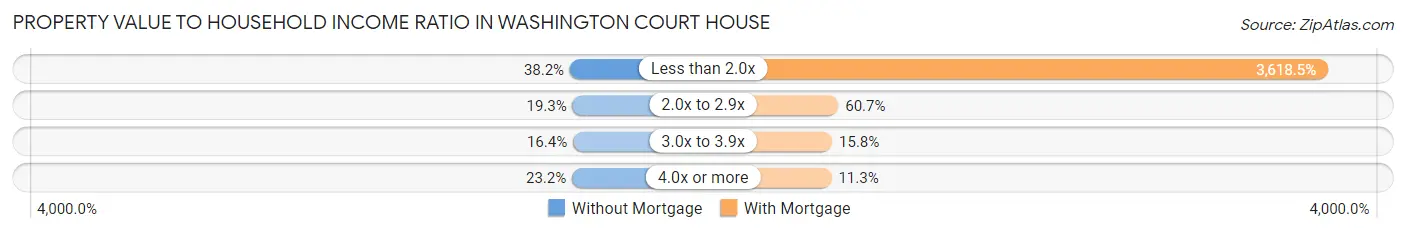
| Value-to-Income Ratio | Without Mortgage | With Mortgage |
| Less than 2.0x | 449 (38.2%) | 76,458 (3,618.5%) |
| 2.0x to 2.9x | 227 (19.3%) | 1,283 (60.7%) |
| 3.0x to 3.9x | 193 (16.4%) | 333 (15.8%) |
| 4.0x or more | 273 (23.2%) | 239 (11.3%) |
| Total | 1,175 (100.0%) | 2,113 (100.0%) |
Real Estate Taxes by Mortgage Status in Washington Court House
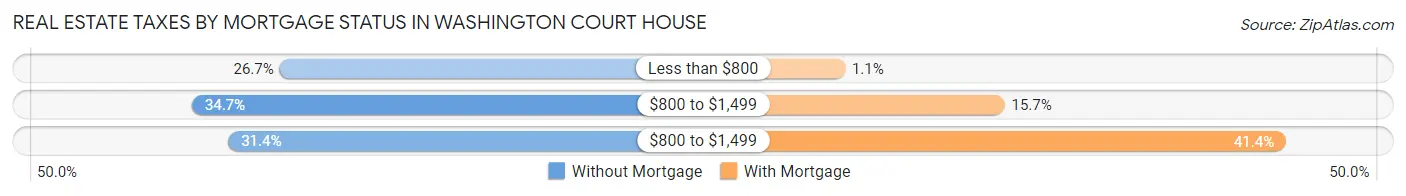
| Property Taxes | Without Mortgage | With Mortgage |
| Less than $800 | 314 (26.7%) | 23 (1.1%) |
| $800 to $1,499 | 408 (34.7%) | 331 (15.7%) |
| $800 to $1,499 | 369 (31.4%) | 874 (41.4%) |
| Total | 1,175 (100.0%) | 2,113 (100.0%) |
Health & Disability in Washington Court House
Health Insurance Coverage by Age in Washington Court House
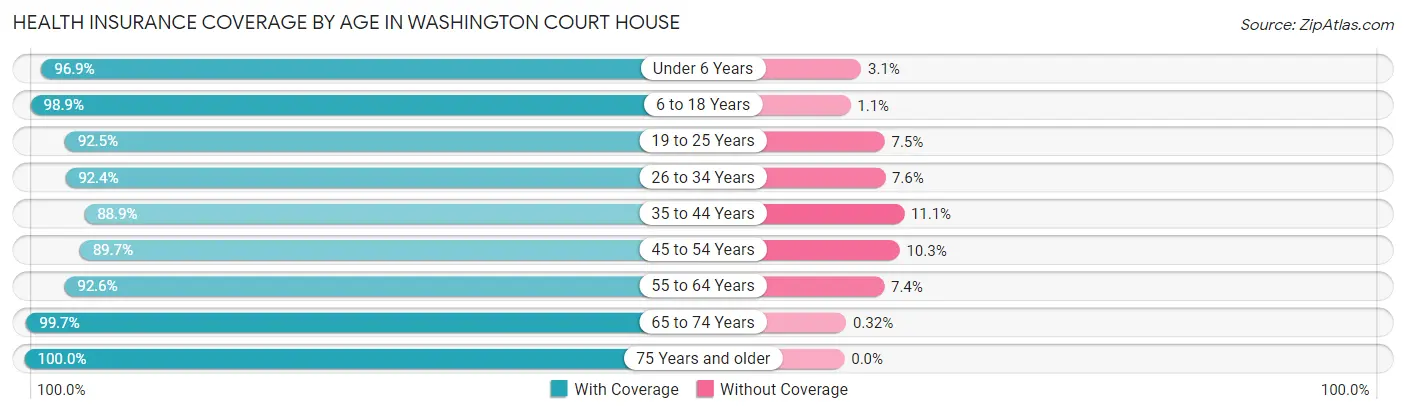
| Age Bracket | With Coverage | Without Coverage |
| Under 6 Years | 958 (96.9%) | 31 (3.1%) |
| 6 to 18 Years | 2,528 (98.9%) | 29 (1.1%) |
| 19 to 25 Years | 1,295 (92.5%) | 105 (7.5%) |
| 26 to 34 Years | 1,585 (92.4%) | 130 (7.6%) |
| 35 to 44 Years | 1,359 (88.9%) | 170 (11.1%) |
| 45 to 54 Years | 1,578 (89.7%) | 181 (10.3%) |
| 55 to 64 Years | 1,738 (92.6%) | 139 (7.4%) |
| 65 to 74 Years | 1,563 (99.7%) | 5 (0.3%) |
| 75 Years and older | 734 (100.0%) | 0 (0.0%) |
| Total | 13,338 (94.4%) | 790 (5.6%) |
Health Insurance Coverage by Citizenship Status in Washington Court House
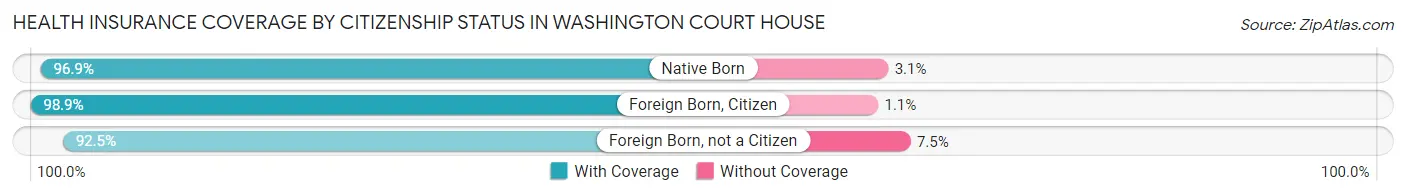
| Citizenship Status | With Coverage | Without Coverage |
| Native Born | 958 (96.9%) | 31 (3.1%) |
| Foreign Born, Citizen | 2,528 (98.9%) | 29 (1.1%) |
| Foreign Born, not a Citizen | 1,295 (92.5%) | 105 (7.5%) |
Health Insurance Coverage by Household Income in Washington Court House
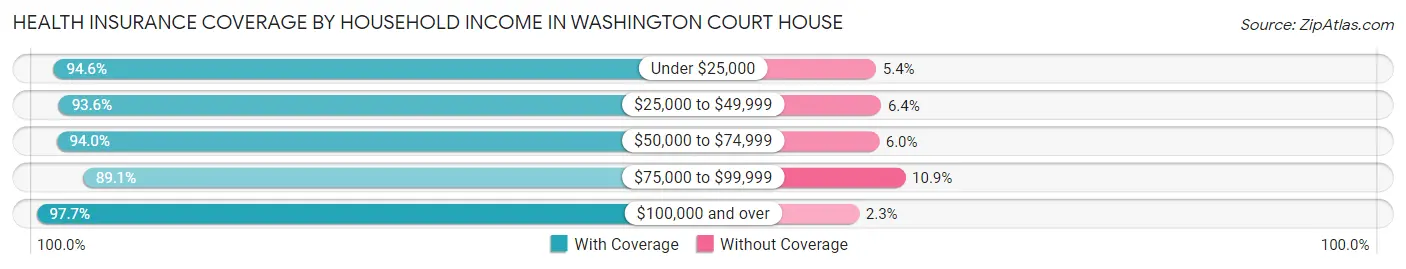
| Household Income | With Coverage | Without Coverage |
| Under $25,000 | 2,505 (94.6%) | 144 (5.4%) |
| $25,000 to $49,999 | 2,661 (93.6%) | 182 (6.4%) |
| $50,000 to $74,999 | 2,777 (94.0%) | 177 (6.0%) |
| $75,000 to $99,999 | 1,640 (89.1%) | 201 (10.9%) |
| $100,000 and over | 3,716 (97.7%) | 86 (2.3%) |
Public vs Private Health Insurance Coverage by Age in Washington Court House
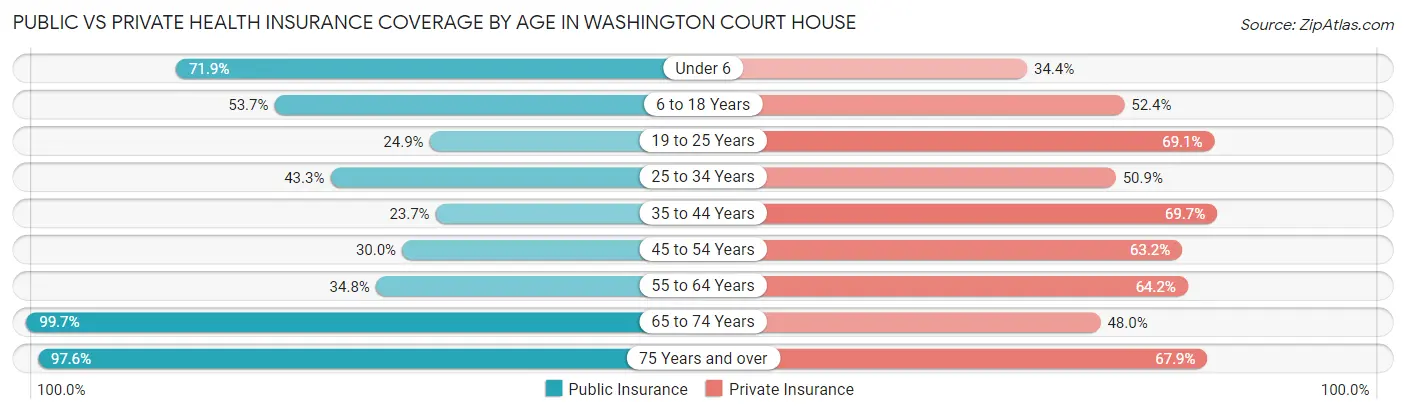
| Age Bracket | Public Insurance | Private Insurance |
| Under 6 | 711 (71.9%) | 340 (34.4%) |
| 6 to 18 Years | 1,372 (53.7%) | 1,341 (52.4%) |
| 19 to 25 Years | 348 (24.9%) | 968 (69.1%) |
| 25 to 34 Years | 742 (43.3%) | 872 (50.8%) |
| 35 to 44 Years | 363 (23.7%) | 1,065 (69.7%) |
| 45 to 54 Years | 527 (30.0%) | 1,111 (63.2%) |
| 55 to 64 Years | 654 (34.8%) | 1,205 (64.2%) |
| 65 to 74 Years | 1,563 (99.7%) | 753 (48.0%) |
| 75 Years and over | 716 (97.6%) | 498 (67.8%) |
| Total | 6,996 (49.5%) | 8,153 (57.7%) |
Disability Status by Sex by Age in Washington Court House
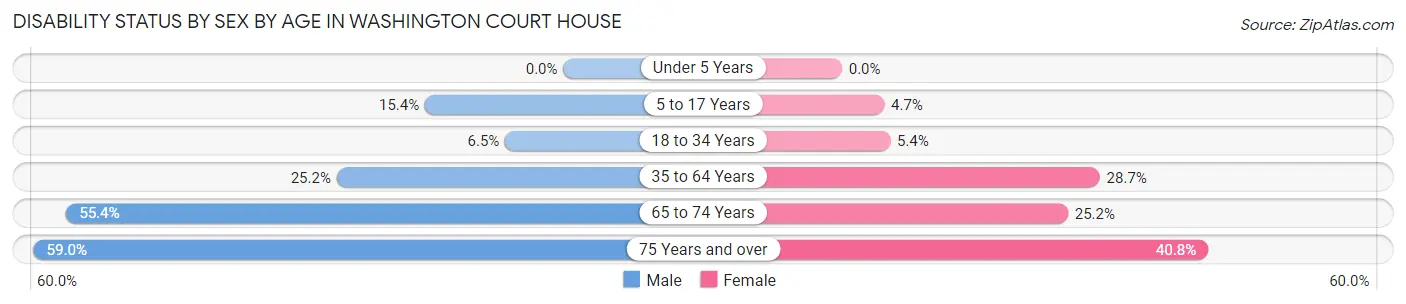
| Age Bracket | Male | Female |
| Under 5 Years | 0 (0.0%) | 0 (0.0%) |
| 5 to 17 Years | 233 (15.4%) | 51 (4.7%) |
| 18 to 34 Years | 107 (6.5%) | 85 (5.4%) |
| 35 to 64 Years | 604 (25.2%) | 796 (28.7%) |
| 65 to 74 Years | 393 (55.3%) | 216 (25.2%) |
| 75 Years and over | 164 (59.0%) | 186 (40.8%) |
Disability Class by Sex by Age in Washington Court House
Disability Class: Hearing Difficulty
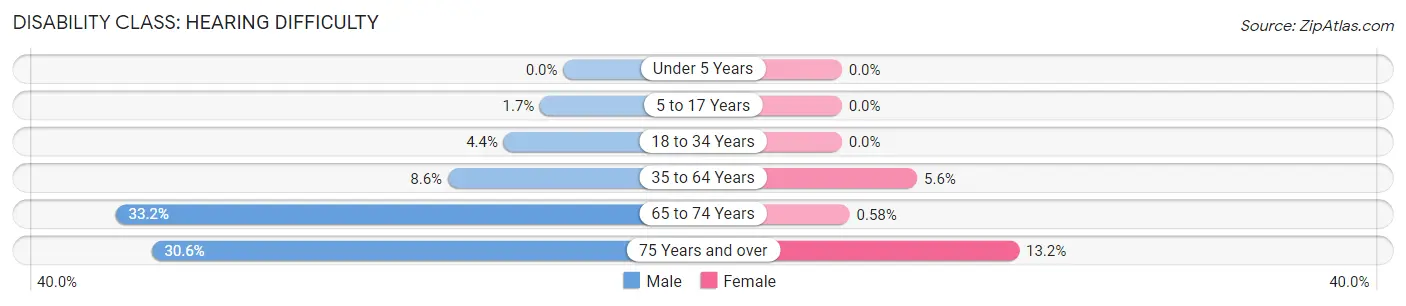
| Age Bracket | Male | Female |
| Under 5 Years | 0 (0.0%) | 0 (0.0%) |
| 5 to 17 Years | 26 (1.7%) | 0 (0.0%) |
| 18 to 34 Years | 73 (4.4%) | 0 (0.0%) |
| 35 to 64 Years | 205 (8.6%) | 155 (5.6%) |
| 65 to 74 Years | 236 (33.2%) | 5 (0.6%) |
| 75 Years and over | 85 (30.6%) | 60 (13.2%) |
Disability Class: Vision Difficulty
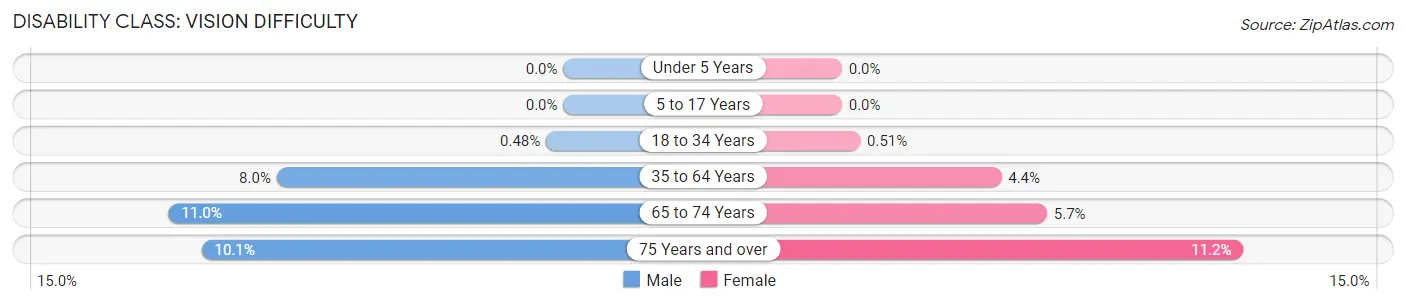
| Age Bracket | Male | Female |
| Under 5 Years | 0 (0.0%) | 0 (0.0%) |
| 5 to 17 Years | 0 (0.0%) | 0 (0.0%) |
| 18 to 34 Years | 8 (0.5%) | 8 (0.5%) |
| 35 to 64 Years | 191 (8.0%) | 123 (4.4%) |
| 65 to 74 Years | 78 (11.0%) | 49 (5.7%) |
| 75 Years and over | 28 (10.1%) | 51 (11.2%) |
Disability Class: Cognitive Difficulty
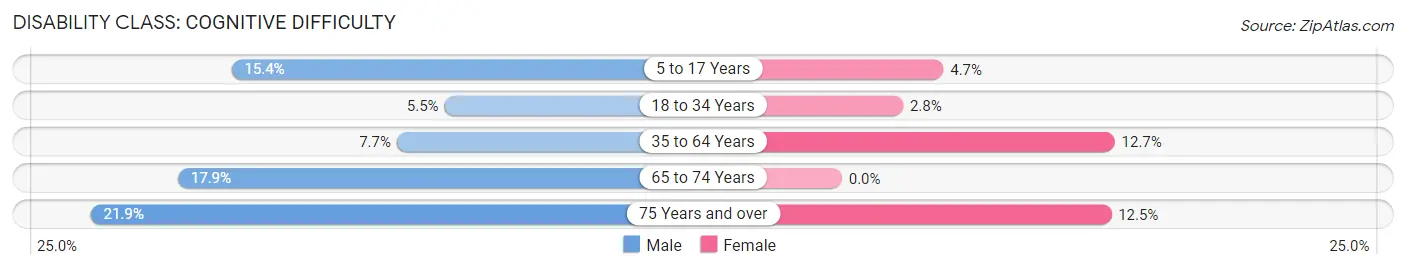
| Age Bracket | Male | Female |
| 5 to 17 Years | 233 (15.4%) | 51 (4.7%) |
| 18 to 34 Years | 91 (5.5%) | 45 (2.8%) |
| 35 to 64 Years | 185 (7.7%) | 351 (12.7%) |
| 65 to 74 Years | 127 (17.9%) | 0 (0.0%) |
| 75 Years and over | 61 (21.9%) | 57 (12.5%) |
Disability Class: Ambulatory Difficulty
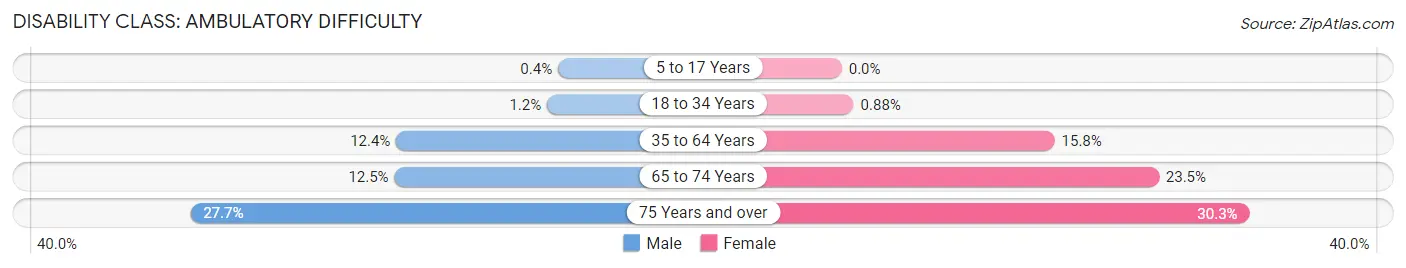
| Age Bracket | Male | Female |
| 5 to 17 Years | 6 (0.4%) | 0 (0.0%) |
| 18 to 34 Years | 20 (1.2%) | 14 (0.9%) |
| 35 to 64 Years | 297 (12.4%) | 438 (15.8%) |
| 65 to 74 Years | 89 (12.5%) | 202 (23.5%) |
| 75 Years and over | 77 (27.7%) | 138 (30.3%) |
Disability Class: Self-Care Difficulty
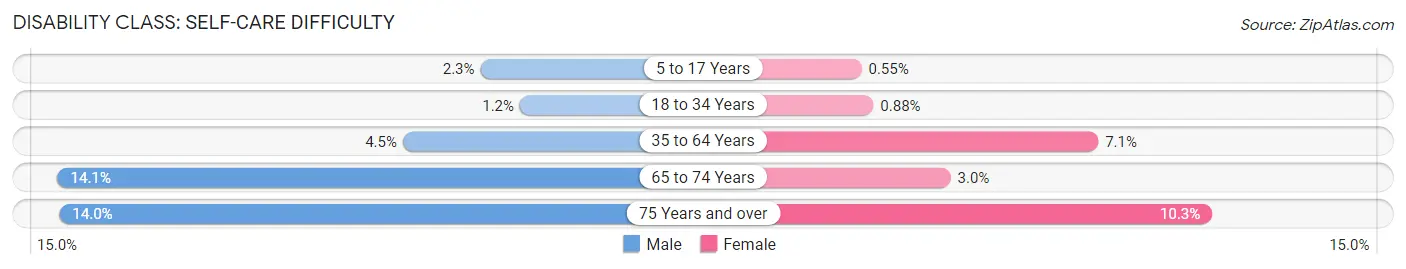
| Age Bracket | Male | Female |
| 5 to 17 Years | 35 (2.3%) | 6 (0.5%) |
| 18 to 34 Years | 20 (1.2%) | 14 (0.9%) |
| 35 to 64 Years | 107 (4.5%) | 198 (7.1%) |
| 65 to 74 Years | 100 (14.1%) | 26 (3.0%) |
| 75 Years and over | 39 (14.0%) | 47 (10.3%) |
Technology Access in Washington Court House
Computing Device Access in Washington Court House
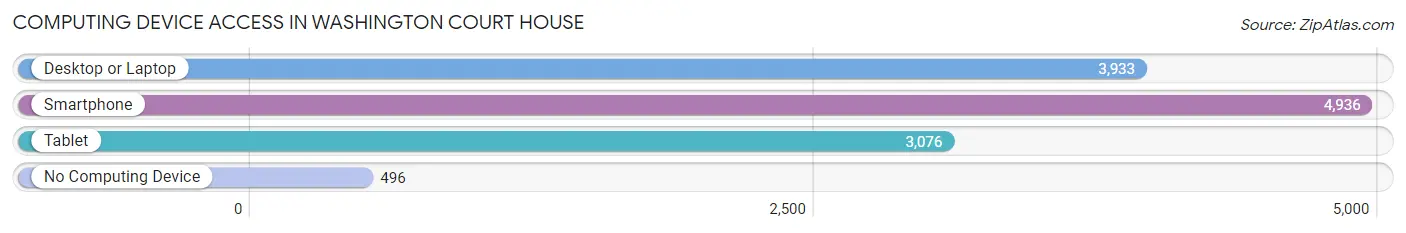
| Device Type | # Households | % Households |
| Desktop or Laptop | 3,933 | 66.2% |
| Smartphone | 4,936 | 83.1% |
| Tablet | 3,076 | 51.8% |
| No Computing Device | 496 | 8.4% |
| Total | 5,941 | 100.0% |
Internet Access in Washington Court House
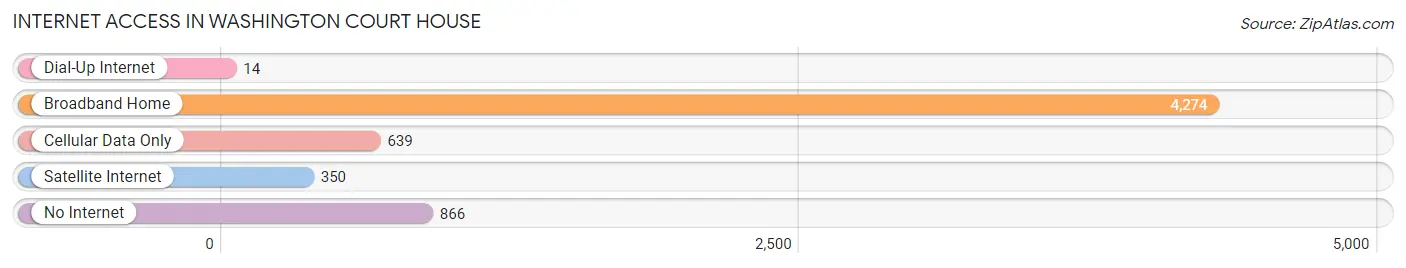
| Internet Type | # Households | % Households |
| Dial-Up Internet | 14 | 0.2% |
| Broadband Home | 4,274 | 71.9% |
| Cellular Data Only | 639 | 10.8% |
| Satellite Internet | 350 | 5.9% |
| No Internet | 866 | 14.6% |
| Total | 5,941 | 100.0% |
Washington Court House Summary
Washington Court House, Ohio is a small city located in Fayette County, Ohio. It is the county seat of Fayette County and is located approximately 50 miles southwest of Columbus, Ohio. The city has a population of 14,192 as of the 2020 census.
History
Washington Court House was founded in 1810 by William Lytle, a Revolutionary War veteran. The city was named after the first president of the United States, George Washington. The city was originally known as Washington, but the name was changed to Washington Court House in 1812 when the county seat was moved from nearby New Holland to Washington.
The city was an important stop on the Underground Railroad, with many slaves escaping to freedom in Canada. The city was also the site of a major Civil War battle in 1863, when Union forces defeated Confederate forces in the Battle of Washington Court House.
Geography
Washington Court House is located in the central part of Fayette County, Ohio. The city is situated on the banks of the Paint Creek, a tributary of the Scioto River. The city is located approximately 50 miles southwest of Columbus, Ohio.
The city has a total area of 5.3 square miles, all of which is land. The city is located in the Appalachian Plateau region of Ohio, and is surrounded by rolling hills and forests.
Economy
Washington Court House has a diverse economy, with a variety of industries represented in the city. The city is home to several manufacturing companies, including a steel mill, a paper mill, and a plastics plant. The city is also home to several retail stores, restaurants, and other businesses.
The city is also home to several educational institutions, including a community college, a technical college, and a vocational school. The city is also home to a hospital and several medical clinics.
Demographics
As of the 2020 census, Washington Court House had a population of 14,192. The city has a population density of 2,664 people per square mile. The median age of the city is 39.7 years, and the median household income is $41,945.
The racial makeup of the city is 92.3% White, 4.2% African American, 0.4% Native American, 0.7% Asian, 0.1% Pacific Islander, 0.7% from other races, and 1.6% from two or more races. Hispanic or Latino of any race make up 2.2% of the population.
The city has a high rate of poverty, with 24.3% of the population living below the poverty line. The city also has a high rate of unemployment, with 8.2% of the population unemployed.
Conclusion
Washington Court House, Ohio is a small city located in Fayette County, Ohio. It is the county seat of Fayette County and is located approximately 50 miles southwest of Columbus, Ohio. The city has a population of 14,192 as of the 2020 census. The city has a diverse economy, with a variety of industries represented in the city. The city also has a high rate of poverty and unemployment.
Common Questions
What is Per Capita Income in Washington Court House?
Per Capita income in Washington Court House is $28,885.
What is the Median Family Income in Washington Court House?
Median Family Income in Washington Court House is $61,661.
What is the Median Household income in Washington Court House?
Median Household Income in Washington Court House is $51,601.
What is Income or Wage Gap in Washington Court House?
Income or Wage Gap in Washington Court House is 40.0%.
Women in Washington Court House earn 60.0 cents for every dollar earned by a man.
What is Family Income Deficit in Washington Court House?
Family Income Deficit in Washington Court House is $14,293.
Families that are below poverty line in Washington Court House earn $14,293 less on average than the poverty threshold level.
What is Inequality or Gini Index in Washington Court House?
Inequality or Gini Index in Washington Court House is 0.46.
What is the Total Population of Washington Court House?
Total Population of Washington Court House is 14,387.
What is the Total Male Population of Washington Court House?
Total Male Population of Washington Court House is 7,139.
What is the Total Female Population of Washington Court House?
Total Female Population of Washington Court House is 7,248.
What is the Ratio of Males per 100 Females in Washington Court House?
There are 98.50 Males per 100 Females in Washington Court House.
What is the Ratio of Females per 100 Males in Washington Court House?
There are 101.53 Females per 100 Males in Washington Court House.
What is the Median Population Age in Washington Court House?
Median Population Age in Washington Court House is 38.6 Years.
What is the Average Family Size in Washington Court House
Average Family Size in Washington Court House is 3.0 People.
What is the Average Household Size in Washington Court House
Average Household Size in Washington Court House is 2.4 People.
How Large is the Labor Force in Washington Court House?
There are 6,836 People in the Labor Forcein in Washington Court House.
What is the Percentage of People in the Labor Force in Washington Court House?
60.2% of People are in the Labor Force in Washington Court House.
What is the Unemployment Rate in Washington Court House?
Unemployment Rate in Washington Court House is 6.0%.