Louisville, OH Map & Demographics
Louisville Map
Louisville Overview
$34,758
PER CAPITA INCOME
$85,000
AVG FAMILY INCOME
$62,287
AVG HOUSEHOLD INCOME
22.7%
WAGE / INCOME GAP [ % ]
77.3¢/ $1
WAGE / INCOME GAP [ $ ]
0.44
INEQUALITY / GINI INDEX
9,500
TOTAL POPULATION
4,636
MALE POPULATION
4,864
FEMALE POPULATION
95.31
MALES / 100 FEMALES
104.92
FEMALES / 100 MALES
41.2
MEDIAN AGE
3.0
AVG FAMILY SIZE
2.3
AVG HOUSEHOLD SIZE
4,600
LABOR FORCE [ PEOPLE ]
61.9%
PERCENT IN LABOR FORCE
1.7%
UNEMPLOYMENT RATE
Louisville Zip Codes
Income in Louisville
Income Overview in Louisville
Per Capita Income in Louisville is $34,758, while median incomes of families and households are $85,000 and $62,287 respectively.
| Characteristic | Number | Measure |
| Per Capita Income | 9,500 | $34,758 |
| Median Family Income | 2,480 | $85,000 |
| Mean Family Income | 2,480 | $102,485 |
| Median Household Income | 4,035 | $62,287 |
| Mean Household Income | 4,035 | $80,913 |
| Income Deficit | 2,480 | $0 |
| Wage / Income Gap (%) | 9,500 | 22.68% |
| Wage / Income Gap ($) | 9,500 | 77.32¢ per $1 |
| Gini / Inequality Index | 9,500 | 0.44 |
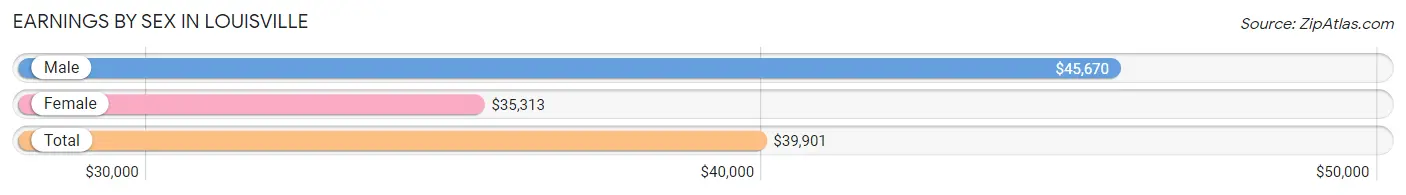
Earnings by Sex in Louisville
Average Earnings in Louisville are $39,901, $45,670 for men and $35,313 for women, a difference of 22.7%.
| Sex | Number | Average Earnings |
| Male | 2,563 (52.1%) | $45,670 |
| Female | 2,354 (47.9%) | $35,313 |
| Total | 4,917 (100.0%) | $39,901 |
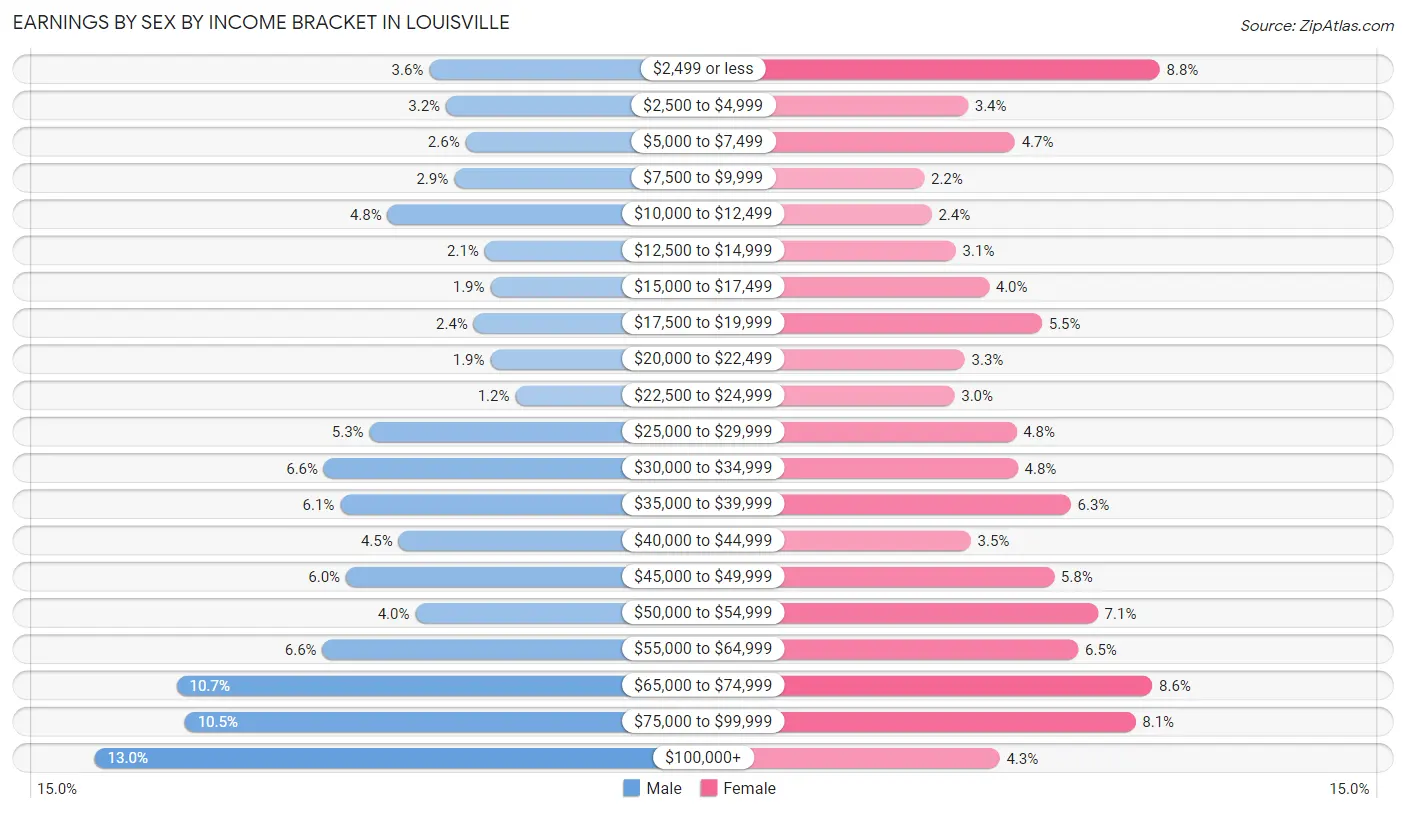
Earnings by Sex by Income Bracket in Louisville
The most common earnings brackets in Louisville are $100,000+ for men (334 | 13.0%) and $2,499 or less for women (207 | 8.8%).
| Income | Male | Female |
| $2,499 or less | 93 (3.6%) | 207 (8.8%) |
| $2,500 to $4,999 | 81 (3.2%) | 80 (3.4%) |
| $5,000 to $7,499 | 67 (2.6%) | 111 (4.7%) |
| $7,500 to $9,999 | 75 (2.9%) | 51 (2.2%) |
| $10,000 to $12,499 | 123 (4.8%) | 56 (2.4%) |
| $12,500 to $14,999 | 53 (2.1%) | 72 (3.1%) |
| $15,000 to $17,499 | 49 (1.9%) | 94 (4.0%) |
| $17,500 to $19,999 | 61 (2.4%) | 129 (5.5%) |
| $20,000 to $22,499 | 49 (1.9%) | 78 (3.3%) |
| $22,500 to $24,999 | 31 (1.2%) | 71 (3.0%) |
| $25,000 to $29,999 | 136 (5.3%) | 112 (4.8%) |
| $30,000 to $34,999 | 169 (6.6%) | 113 (4.8%) |
| $35,000 to $39,999 | 157 (6.1%) | 148 (6.3%) |
| $40,000 to $44,999 | 115 (4.5%) | 82 (3.5%) |
| $45,000 to $49,999 | 153 (6.0%) | 137 (5.8%) |
| $50,000 to $54,999 | 103 (4.0%) | 166 (7.0%) |
| $55,000 to $64,999 | 170 (6.6%) | 153 (6.5%) |
| $65,000 to $74,999 | 275 (10.7%) | 202 (8.6%) |
| $75,000 to $99,999 | 269 (10.5%) | 191 (8.1%) |
| $100,000+ | 334 (13.0%) | 101 (4.3%) |
| Total | 2,563 (100.0%) | 2,354 (100.0%) |
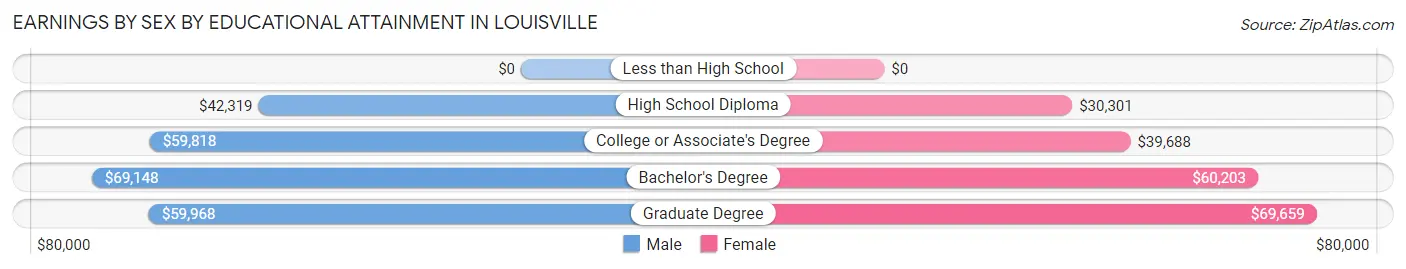
Earnings by Sex by Educational Attainment in Louisville
Average earnings in Louisville are $56,131 for men and $39,496 for women, a difference of 29.6%. Men with an educational attainment of bachelor's degree enjoy the highest average annual earnings of $69,148, while those with high school diploma education earn the least with $42,319. Women with an educational attainment of graduate degree earn the most with the average annual earnings of $69,659, while those with high school diploma education have the smallest earnings of $30,301.
| Educational Attainment | Male Income | Female Income |
| Less than High School | - | - |
| High School Diploma | $42,319 | $30,301 |
| College or Associate's Degree | $59,818 | $39,688 |
| Bachelor's Degree | $69,148 | $60,203 |
| Graduate Degree | $59,968 | $69,659 |
| Total | $56,131 | $39,496 |
Family Income in Louisville
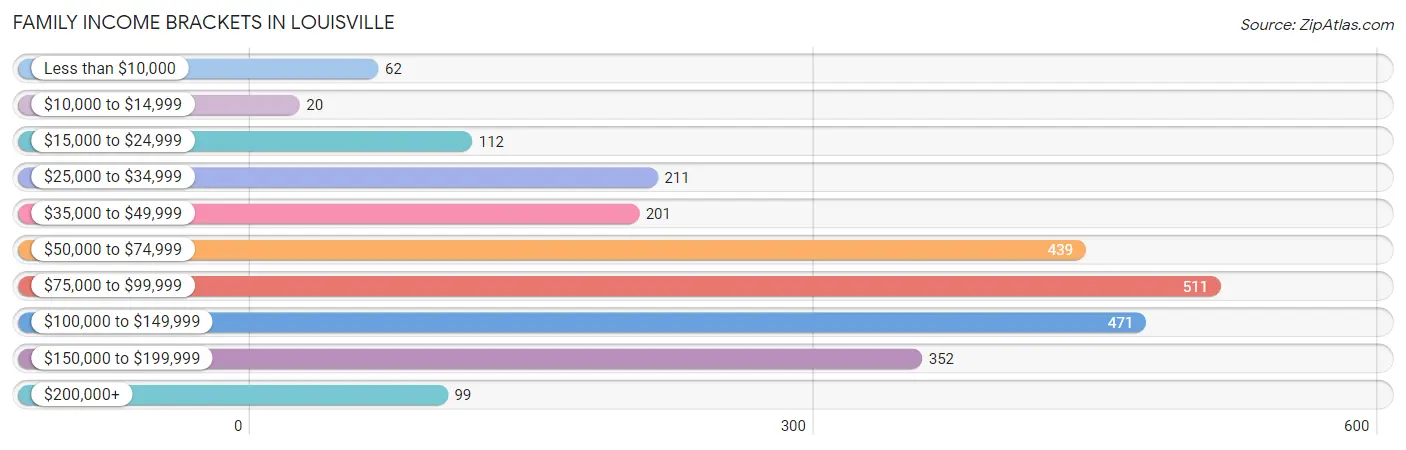
Family Income Brackets in Louisville
According to the Louisville family income data, there are 511 families falling into the $75,000 to $99,999 income range, which is the most common income bracket and makes up 20.6% of all families. Conversely, the $10,000 to $14,999 income bracket is the least frequent group with only 20 families (0.8%) belonging to this category.
| Income Bracket | # Families | % Families |
| Less than $10,000 | 62 | 2.5% |
| $10,000 to $14,999 | 20 | 0.8% |
| $15,000 to $24,999 | 112 | 4.5% |
| $25,000 to $34,999 | 211 | 8.5% |
| $35,000 to $49,999 | 201 | 8.1% |
| $50,000 to $74,999 | 439 | 17.7% |
| $75,000 to $99,999 | 511 | 20.6% |
| $100,000 to $149,999 | 471 | 19.0% |
| $150,000 to $199,999 | 352 | 14.2% |
| $200,000+ | 99 | 4.0% |
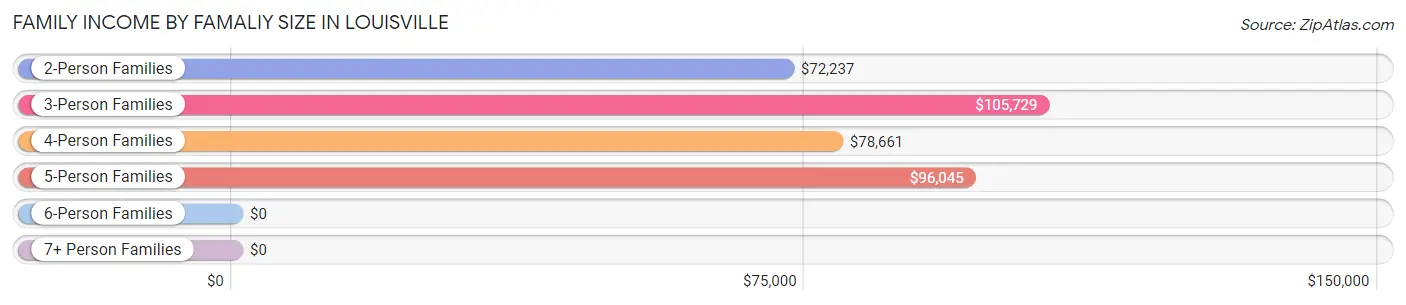
Family Income by Famaliy Size in Louisville
3-person families (629 | 25.4%) account for the highest median family income in Louisville with $105,729 per family, while 2-person families (1,126 | 45.4%) have the highest median income of $36,118 per family member.
| Income Bracket | # Families | Median Income |
| 2-Person Families | 1,126 (45.4%) | $72,237 |
| 3-Person Families | 629 (25.4%) | $105,729 |
| 4-Person Families | 497 (20.0%) | $78,661 |
| 5-Person Families | 149 (6.0%) | $96,045 |
| 6-Person Families | 79 (3.2%) | $0 |
| 7+ Person Families | 0 (0.0%) | $0 |
| Total | 2,480 (100.0%) | $85,000 |
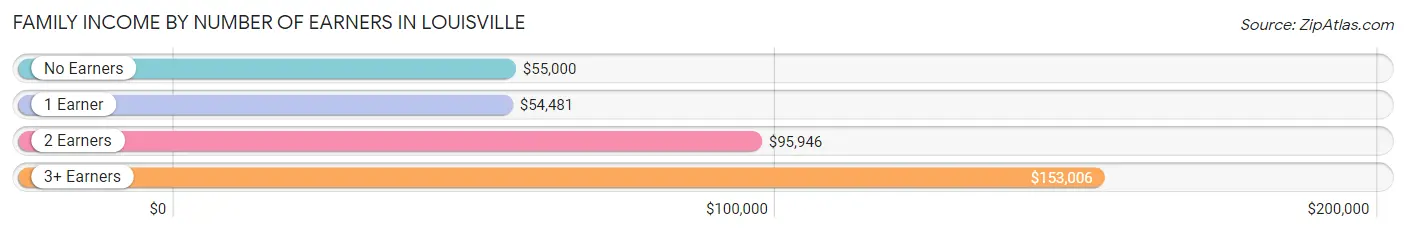
Family Income by Number of Earners in Louisville
The median family income in Louisville is $85,000, with families comprising 3+ earners (422) having the highest median family income of $153,006, while families with 1 earner (768) have the lowest median family income of $54,481, accounting for 17.0% and 31.0% of families, respectively.
| Number of Earners | # Families | Median Income |
| No Earners | 376 (15.2%) | $55,000 |
| 1 Earner | 768 (31.0%) | $54,481 |
| 2 Earners | 914 (36.8%) | $95,946 |
| 3+ Earners | 422 (17.0%) | $153,006 |
| Total | 2,480 (100.0%) | $85,000 |
Household Income in Louisville
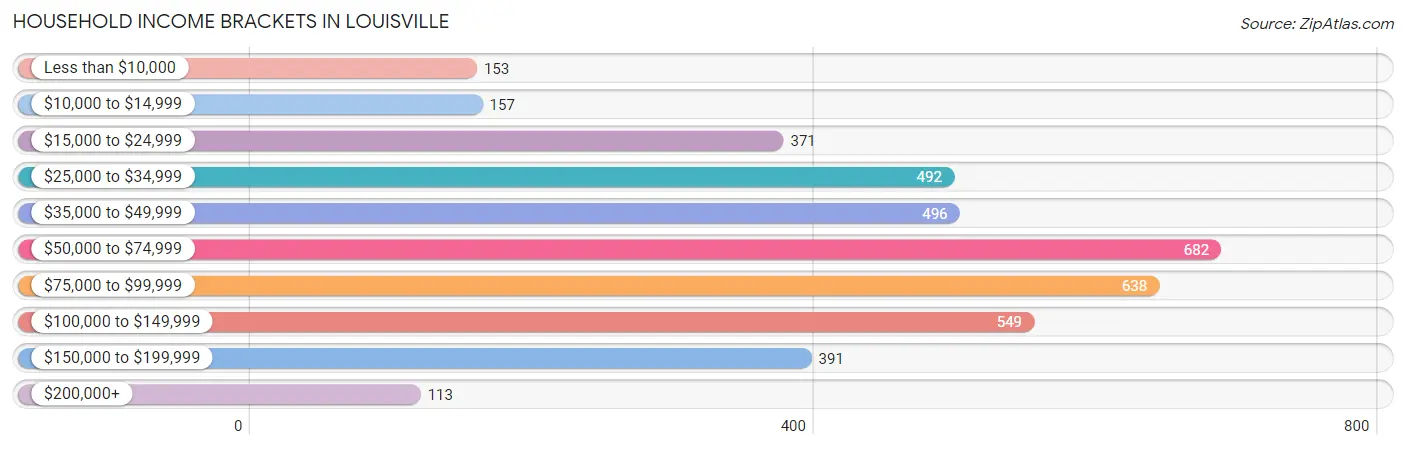
Household Income Brackets in Louisville
With 682 households falling in the category, the $50,000 to $74,999 income range is the most frequent in Louisville, accounting for 16.9% of all households. In contrast, only 113 households (2.8%) fall into the $200,000+ income bracket, making it the least populous group.
| Income Bracket | # Households | % Households |
| Less than $10,000 | 153 | 3.8% |
| $10,000 to $14,999 | 157 | 3.9% |
| $15,000 to $24,999 | 371 | 9.2% |
| $25,000 to $34,999 | 492 | 12.2% |
| $35,000 to $49,999 | 496 | 12.3% |
| $50,000 to $74,999 | 682 | 16.9% |
| $75,000 to $99,999 | 638 | 15.8% |
| $100,000 to $149,999 | 549 | 13.6% |
| $150,000 to $199,999 | 391 | 9.7% |
| $200,000+ | 113 | 2.8% |
Household Income by Householder Age in Louisville
The median household income in Louisville is $62,287, with the highest median household income of $83,065 found in the 45 to 64 years age bracket for the primary householder. A total of 1,482 households (36.7%) fall into this category. Meanwhile, the 65+ years age bracket for the primary householder has the lowest median household income of $42,619, with 1,232 households (30.5%) in this group.
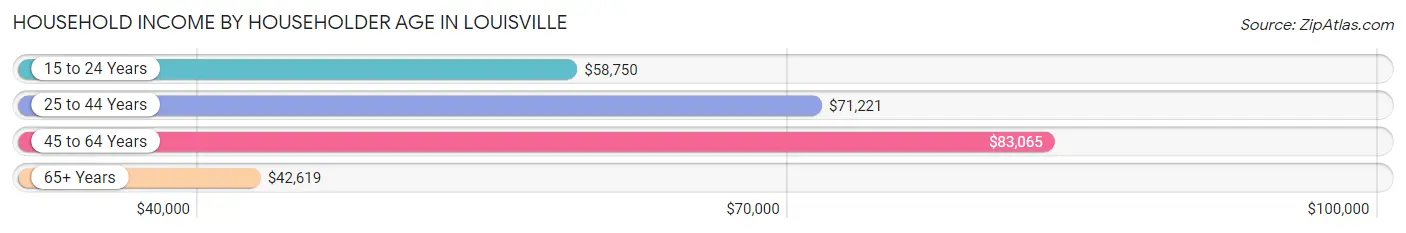
| Income Bracket | # Households | Median Income |
| 15 to 24 Years | 90 (2.2%) | $58,750 |
| 25 to 44 Years | 1,231 (30.5%) | $71,221 |
| 45 to 64 Years | 1,482 (36.7%) | $83,065 |
| 65+ Years | 1,232 (30.5%) | $42,619 |
| Total | 4,035 (100.0%) | $62,287 |
Poverty in Louisville
Income Below Poverty by Sex and Age in Louisville
With 7.9% poverty level for males and 9.6% for females among the residents of Louisville, 15 year old males and 18 to 24 year old females are the most vulnerable to poverty, with 52 males (35.6%) and 73 females (21.8%) in their respective age groups living below the poverty level.
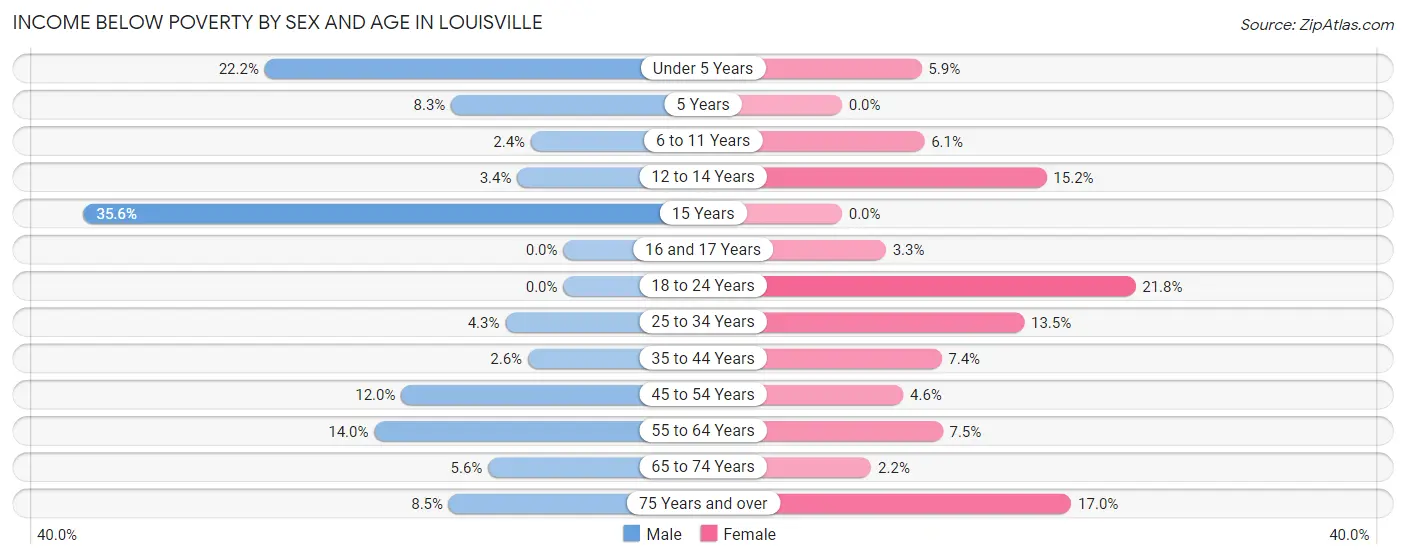
| Age Bracket | Male | Female |
| Under 5 Years | 47 (22.2%) | 12 (5.9%) |
| 5 Years | 7 (8.3%) | 0 (0.0%) |
| 6 to 11 Years | 7 (2.4%) | 21 (6.1%) |
| 12 to 14 Years | 11 (3.4%) | 48 (15.2%) |
| 15 Years | 52 (35.6%) | 0 (0.0%) |
| 16 and 17 Years | 0 (0.0%) | 3 (3.3%) |
| 18 to 24 Years | 0 (0.0%) | 73 (21.8%) |
| 25 to 34 Years | 19 (4.3%) | 61 (13.5%) |
| 35 to 44 Years | 14 (2.6%) | 52 (7.4%) |
| 45 to 54 Years | 89 (12.0%) | 26 (4.5%) |
| 55 to 64 Years | 73 (14.0%) | 47 (7.5%) |
| 65 to 74 Years | 24 (5.6%) | 8 (2.2%) |
| 75 Years and over | 21 (8.5%) | 109 (17.0%) |
| Total | 364 (7.9%) | 460 (9.6%) |
Income Above Poverty by Sex and Age in Louisville
According to the poverty statistics in Louisville, males aged 16 and 17 years and females aged 5 years are the age groups that are most secure financially, with 100.0% of males and 100.0% of females in these age groups living above the poverty line.
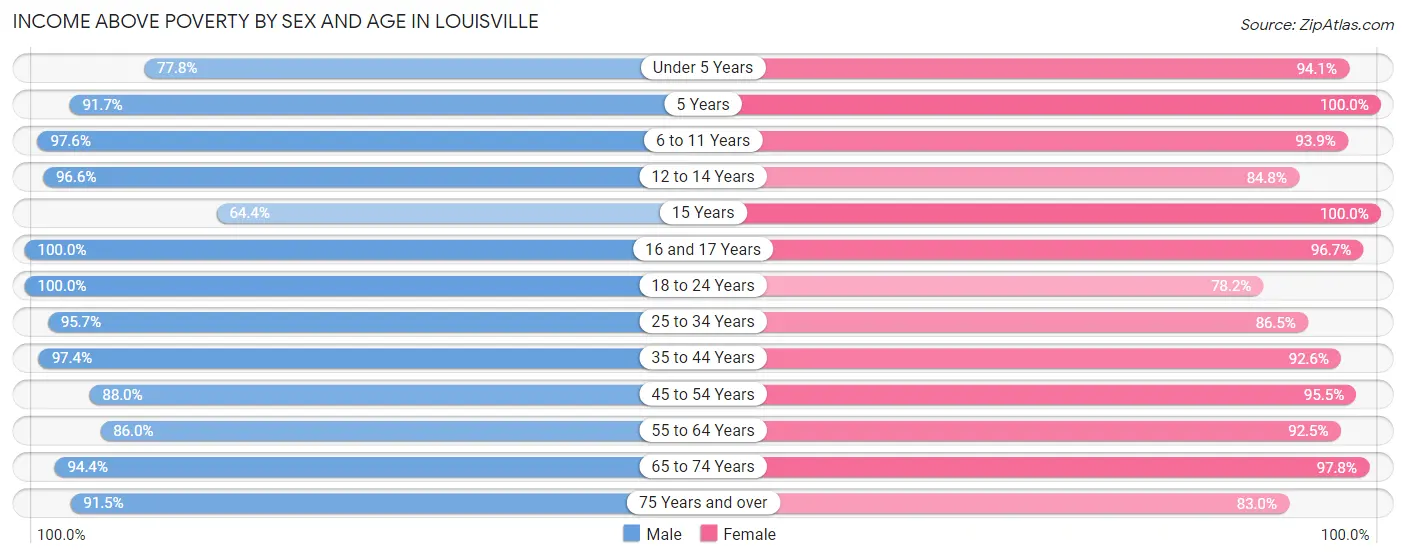
| Age Bracket | Male | Female |
| Under 5 Years | 165 (77.8%) | 191 (94.1%) |
| 5 Years | 77 (91.7%) | 97 (100.0%) |
| 6 to 11 Years | 283 (97.6%) | 322 (93.9%) |
| 12 to 14 Years | 311 (96.6%) | 268 (84.8%) |
| 15 Years | 94 (64.4%) | 25 (100.0%) |
| 16 and 17 Years | 263 (100.0%) | 89 (96.7%) |
| 18 to 24 Years | 366 (100.0%) | 262 (78.2%) |
| 25 to 34 Years | 422 (95.7%) | 390 (86.5%) |
| 35 to 44 Years | 519 (97.4%) | 652 (92.6%) |
| 45 to 54 Years | 651 (88.0%) | 545 (95.5%) |
| 55 to 64 Years | 447 (86.0%) | 581 (92.5%) |
| 65 to 74 Years | 406 (94.4%) | 359 (97.8%) |
| 75 Years and over | 226 (91.5%) | 531 (83.0%) |
| Total | 4,230 (92.1%) | 4,312 (90.4%) |
Income Below Poverty Among Married-Couple Families in Louisville
The poverty statistics for married-couple families in Louisville show that 1.9% or 35 of the total 1,854 families live below the poverty line. Families with no children have the highest poverty rate of 3.4%, comprising of 35 families. On the other hand, families with 1 or 2 children have the lowest poverty rate of 0.0%, which includes 0 families.
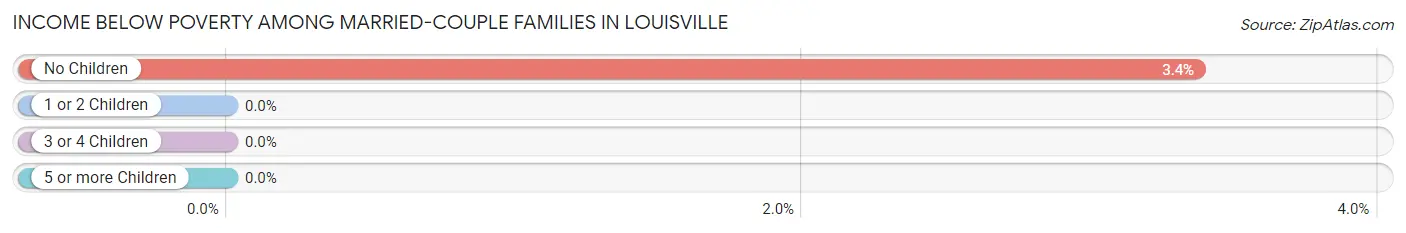
| Children | Above Poverty | Below Poverty |
| No Children | 1,003 (96.6%) | 35 (3.4%) |
| 1 or 2 Children | 625 (100.0%) | 0 (0.0%) |
| 3 or 4 Children | 191 (100.0%) | 0 (0.0%) |
| 5 or more Children | 0 (0.0%) | 0 (0.0%) |
| Total | 1,819 (98.1%) | 35 (1.9%) |
Income Below Poverty Among Single-Parent Households in Louisville
According to the poverty data in Louisville, 14.2% or 52 single-father households and 36.1% or 94 single-mother households are living below the poverty line. Among single-father households, those with 1 or 2 children have the highest poverty rate, with 52 households (19.6%) experiencing poverty. Likewise, among single-mother households, those with 3 or 4 children have the highest poverty rate, with 28 households (45.9%) falling below the poverty line.
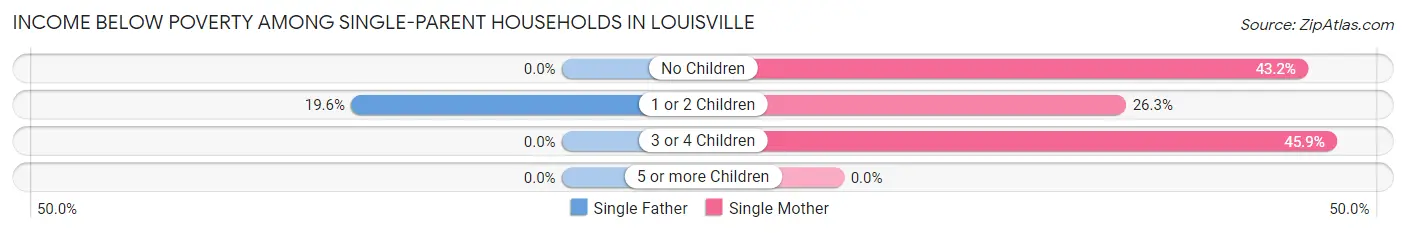
| Children | Single Father | Single Mother |
| No Children | 0 (0.0%) | 35 (43.2%) |
| 1 or 2 Children | 52 (19.6%) | 31 (26.3%) |
| 3 or 4 Children | 0 (0.0%) | 28 (45.9%) |
| 5 or more Children | 0 (0.0%) | 0 (0.0%) |
| Total | 52 (14.2%) | 94 (36.1%) |
Income Below Poverty Among Married-Couple vs Single-Parent Households in Louisville
The poverty data for Louisville shows that 35 of the married-couple family households (1.9%) and 146 of the single-parent households (23.3%) are living below the poverty level. Within the married-couple family households, those with no children have the highest poverty rate, with 35 households (3.4%) falling below the poverty line. Among the single-parent households, those with 3 or 4 children have the highest poverty rate, with 28 household (38.4%) living below poverty.
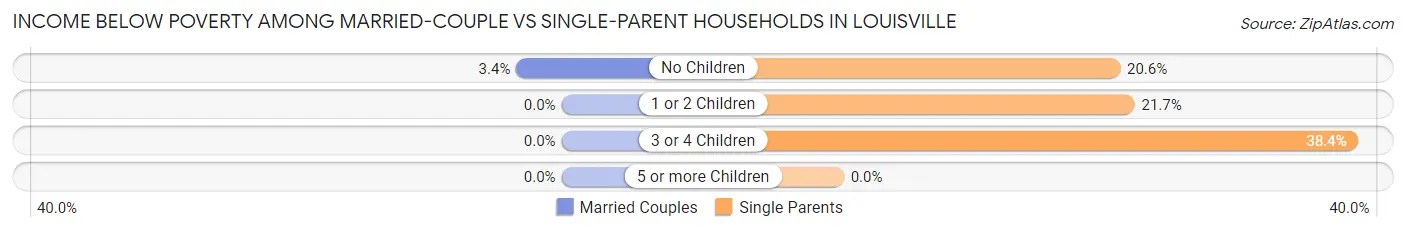
| Children | Married-Couple Families | Single-Parent Households |
| No Children | 35 (3.4%) | 35 (20.6%) |
| 1 or 2 Children | 0 (0.0%) | 83 (21.7%) |
| 3 or 4 Children | 0 (0.0%) | 28 (38.4%) |
| 5 or more Children | 0 (0.0%) | 0 (0.0%) |
| Total | 35 (1.9%) | 146 (23.3%) |
Race in Louisville
The most populous races in Louisville are White / Caucasian (9,183 | 96.7%), Two or more Races (193 | 2.0%), and Hispanic or Latino (144 | 1.5%).
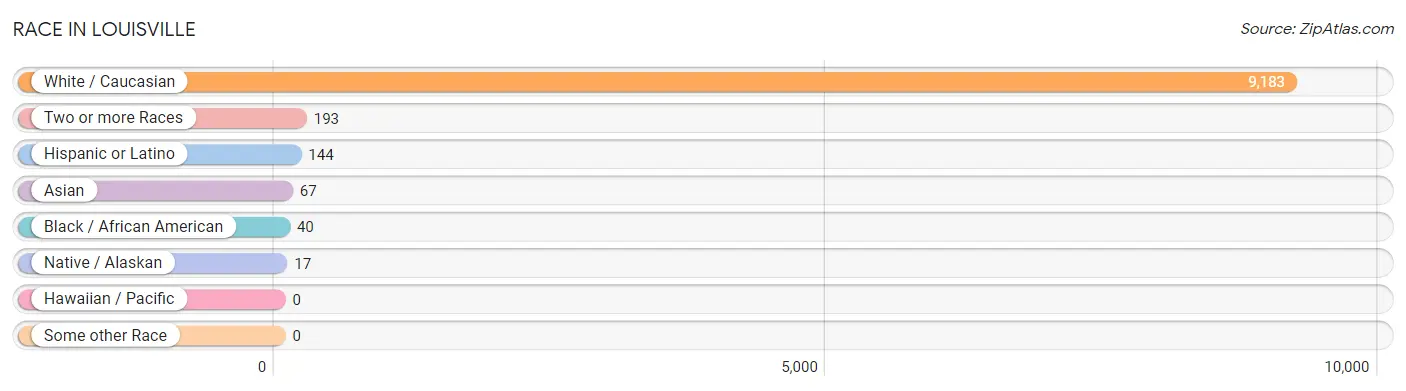
| Race | # Population | % Population |
| Asian | 67 | 0.7% |
| Black / African American | 40 | 0.4% |
| Hawaiian / Pacific | 0 | 0.0% |
| Hispanic or Latino | 144 | 1.5% |
| Native / Alaskan | 17 | 0.2% |
| White / Caucasian | 9,183 | 96.7% |
| Two or more Races | 193 | 2.0% |
| Some other Race | 0 | 0.0% |
| Total | 9,500 | 100.0% |
Ancestry in Louisville
The most populous ancestries reported in Louisville are German (3,111 | 32.8%), Irish (1,595 | 16.8%), Italian (1,264 | 13.3%), English (947 | 10.0%), and American (605 | 6.4%), together accounting for 79.2% of all Louisville residents.
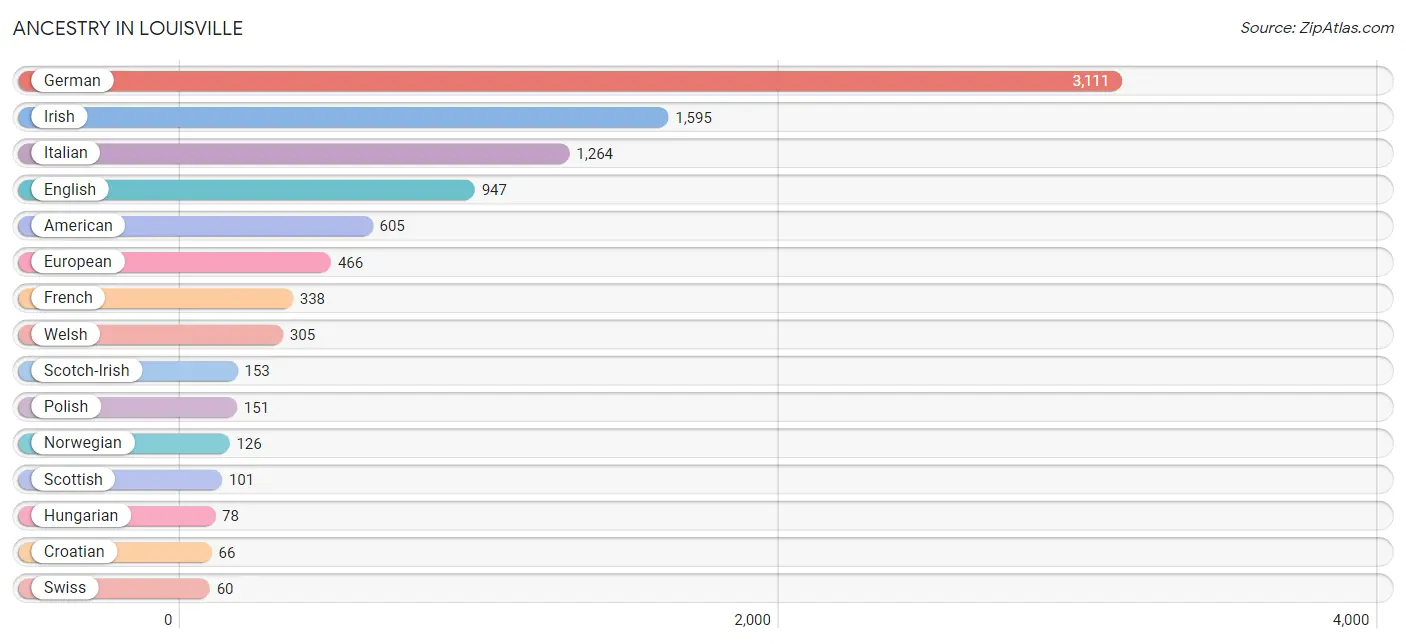
| Ancestry | # Population | % Population |
| American | 605 | 6.4% |
| Arab | 13 | 0.1% |
| Austrian | 23 | 0.2% |
| British | 56 | 0.6% |
| Burmese | 5 | 0.1% |
| Central American | 13 | 0.1% |
| Central American Indian | 13 | 0.1% |
| Cherokee | 6 | 0.1% |
| Croatian | 66 | 0.7% |
| Czech | 6 | 0.1% |
| Czechoslovakian | 45 | 0.5% |
| Danish | 15 | 0.2% |
| Dutch | 44 | 0.5% |
| English | 947 | 10.0% |
| European | 466 | 4.9% |
| French | 338 | 3.6% |
| French American Indian | 8 | 0.1% |
| French Canadian | 13 | 0.1% |
| German | 3,111 | 32.8% |
| Greek | 14 | 0.2% |
| Honduran | 13 | 0.1% |
| Hungarian | 78 | 0.8% |
| Indian (Asian) | 38 | 0.4% |
| Iranian | 43 | 0.4% |
| Irish | 1,595 | 16.8% |
| Iroquois | 10 | 0.1% |
| Italian | 1,264 | 13.3% |
| Jamaican | 14 | 0.2% |
| Korean | 19 | 0.2% |
| Laotian | 26 | 0.3% |
| Lebanese | 13 | 0.1% |
| Mexican | 45 | 0.5% |
| Northern European | 37 | 0.4% |
| Norwegian | 126 | 1.3% |
| Pennsylvania German | 7 | 0.1% |
| Polish | 151 | 1.6% |
| Portuguese | 33 | 0.4% |
| Puerto Rican | 56 | 0.6% |
| Romanian | 47 | 0.5% |
| Scandinavian | 15 | 0.2% |
| Scotch-Irish | 153 | 1.6% |
| Scottish | 101 | 1.1% |
| Sioux | 8 | 0.1% |
| Slavic | 43 | 0.4% |
| Slovak | 55 | 0.6% |
| Spaniard | 30 | 0.3% |
| Swedish | 54 | 0.6% |
| Swiss | 60 | 0.6% |
| Thai | 51 | 0.5% |
| Welsh | 305 | 3.2% |
| West Indian | 13 | 0.1% | View All 51 Rows |
Immigrants in Louisville
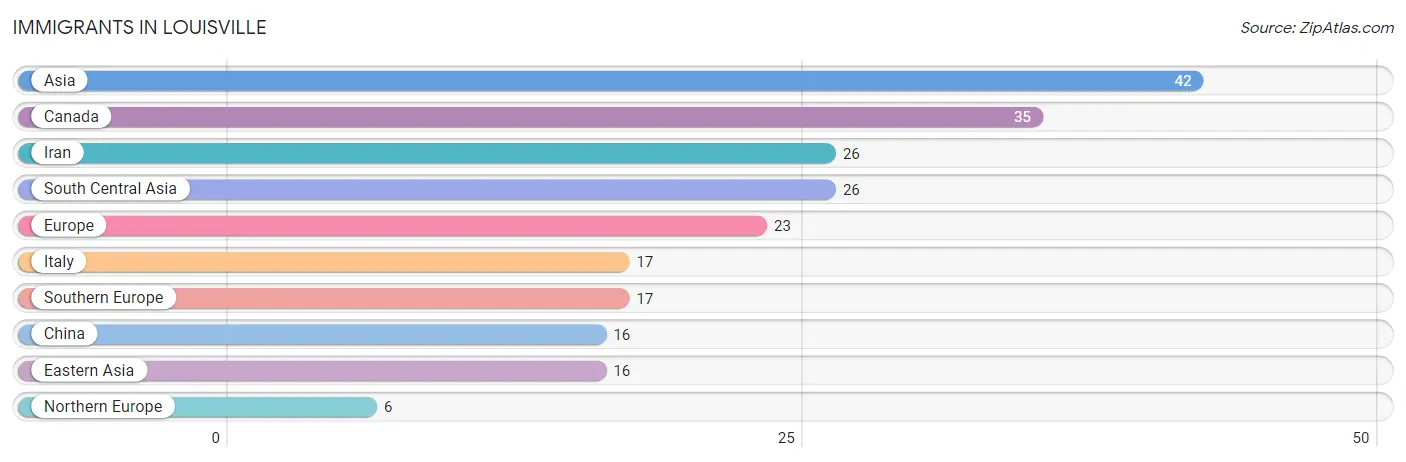
The most numerous immigrant groups reported in Louisville came from Asia (42 | 0.4%), Canada (35 | 0.4%), Iran (26 | 0.3%), South Central Asia (26 | 0.3%), and Europe (23 | 0.2%), together accounting for 1.6% of all Louisville residents.
| Immigration Origin | # Population | % Population |
| Asia | 42 | 0.4% |
| Canada | 35 | 0.4% |
| China | 16 | 0.2% |
| Eastern Asia | 16 | 0.2% |
| Europe | 23 | 0.2% |
| Iran | 26 | 0.3% |
| Italy | 17 | 0.2% |
| Northern Europe | 6 | 0.1% |
| South Central Asia | 26 | 0.3% |
| Southern Europe | 17 | 0.2% | View All 10 Rows |
Sex and Age in Louisville
Sex and Age in Louisville
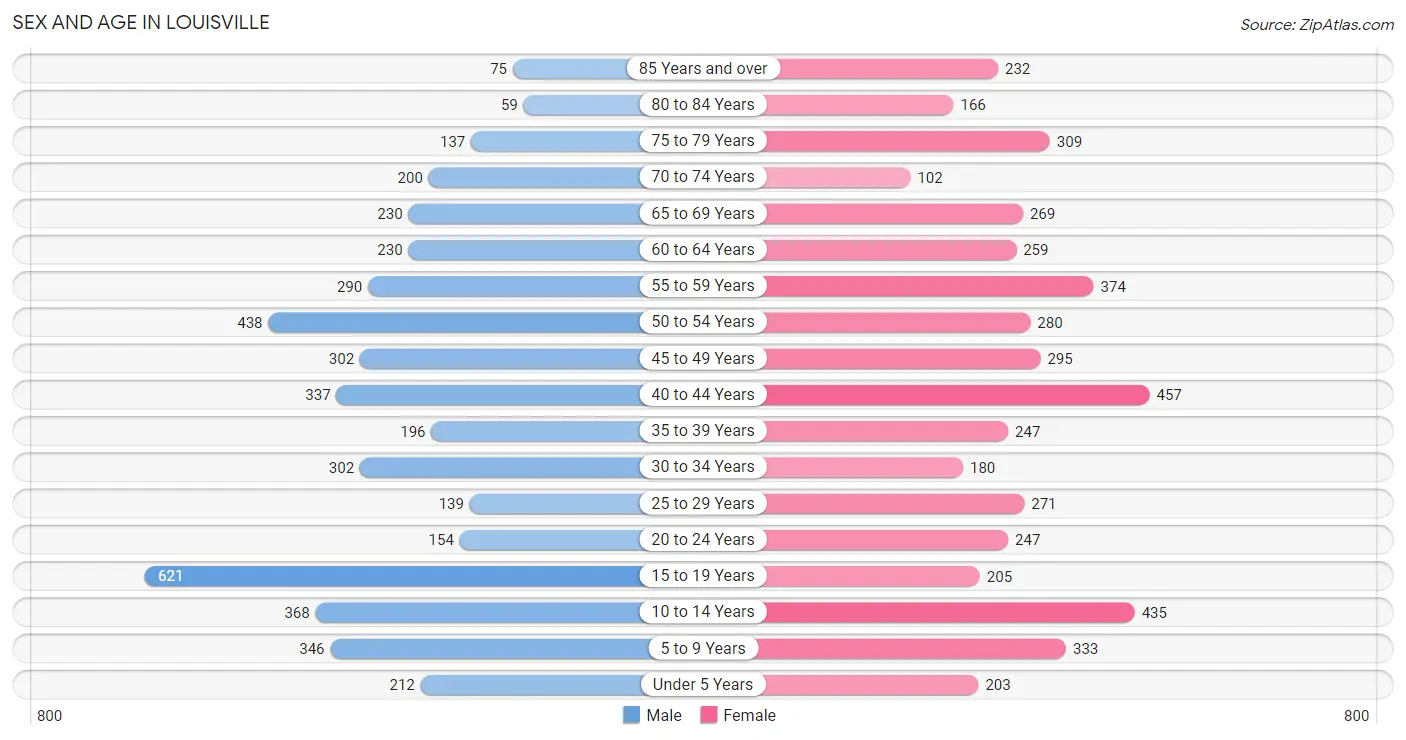
The most populous age groups in Louisville are 15 to 19 Years (621 | 13.4%) for men and 40 to 44 Years (457 | 9.4%) for women.
| Age Bracket | Male | Female |
| Under 5 Years | 212 (4.6%) | 203 (4.2%) |
| 5 to 9 Years | 346 (7.5%) | 333 (6.9%) |
| 10 to 14 Years | 368 (7.9%) | 435 (8.9%) |
| 15 to 19 Years | 621 (13.4%) | 205 (4.2%) |
| 20 to 24 Years | 154 (3.3%) | 247 (5.1%) |
| 25 to 29 Years | 139 (3.0%) | 271 (5.6%) |
| 30 to 34 Years | 302 (6.5%) | 180 (3.7%) |
| 35 to 39 Years | 196 (4.2%) | 247 (5.1%) |
| 40 to 44 Years | 337 (7.3%) | 457 (9.4%) |
| 45 to 49 Years | 302 (6.5%) | 295 (6.1%) |
| 50 to 54 Years | 438 (9.5%) | 280 (5.8%) |
| 55 to 59 Years | 290 (6.3%) | 374 (7.7%) |
| 60 to 64 Years | 230 (5.0%) | 259 (5.3%) |
| 65 to 69 Years | 230 (5.0%) | 269 (5.5%) |
| 70 to 74 Years | 200 (4.3%) | 102 (2.1%) |
| 75 to 79 Years | 137 (3.0%) | 309 (6.4%) |
| 80 to 84 Years | 59 (1.3%) | 166 (3.4%) |
| 85 Years and over | 75 (1.6%) | 232 (4.8%) |
| Total | 4,636 (100.0%) | 4,864 (100.0%) |
Families and Households in Louisville
Median Family Size in Louisville
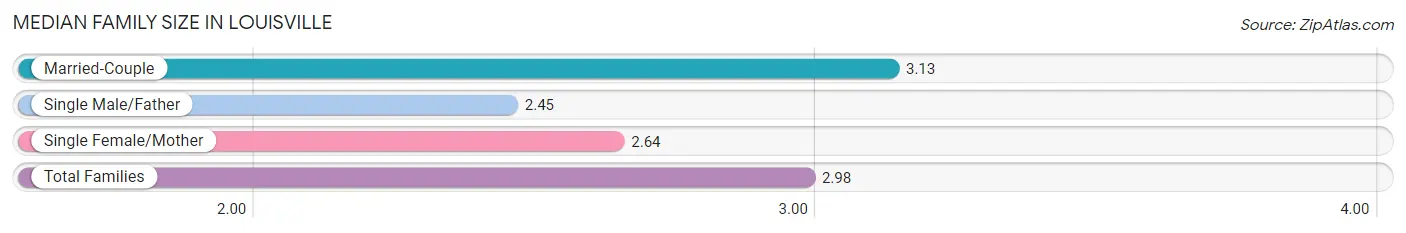
The median family size in Louisville is 2.98 persons per family, with married-couple families (1,854 | 74.8%) accounting for the largest median family size of 3.13 persons per family. On the other hand, single male/father families (366 | 14.8%) represent the smallest median family size with 2.45 persons per family.
| Family Type | # Families | Family Size |
| Married-Couple | 1,854 (74.8%) | 3.13 |
| Single Male/Father | 366 (14.8%) | 2.45 |
| Single Female/Mother | 260 (10.5%) | 2.64 |
| Total Families | 2,480 (100.0%) | 2.98 |
Median Household Size in Louisville
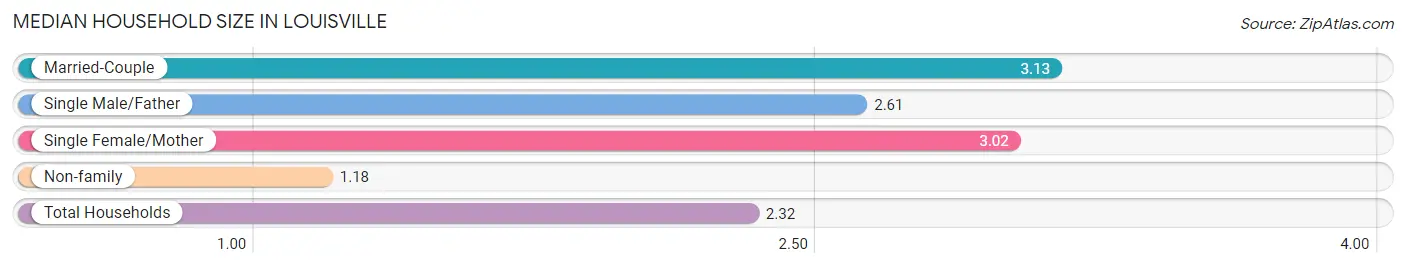
The median household size in Louisville is 2.32 persons per household, with married-couple households (1,854 | 46.0%) accounting for the largest median household size of 3.13 persons per household. non-family households (1,555 | 38.5%) represent the smallest median household size with 1.18 persons per household.
| Household Type | # Households | Household Size |
| Married-Couple | 1,854 (46.0%) | 3.13 |
| Single Male/Father | 366 (9.1%) | 2.61 |
| Single Female/Mother | 260 (6.4%) | 3.02 |
| Non-family | 1,555 (38.5%) | 1.18 |
| Total Households | 4,035 (100.0%) | 2.32 |
Household Size by Marriage Status in Louisville
Out of a total of 4,035 households in Louisville, 2,480 (61.5%) are family households, while 1,555 (38.5%) are nonfamily households. The most numerous type of family households are 2-person households, comprising 1,031, and the most common type of nonfamily households are 1-person households, comprising 1,306.
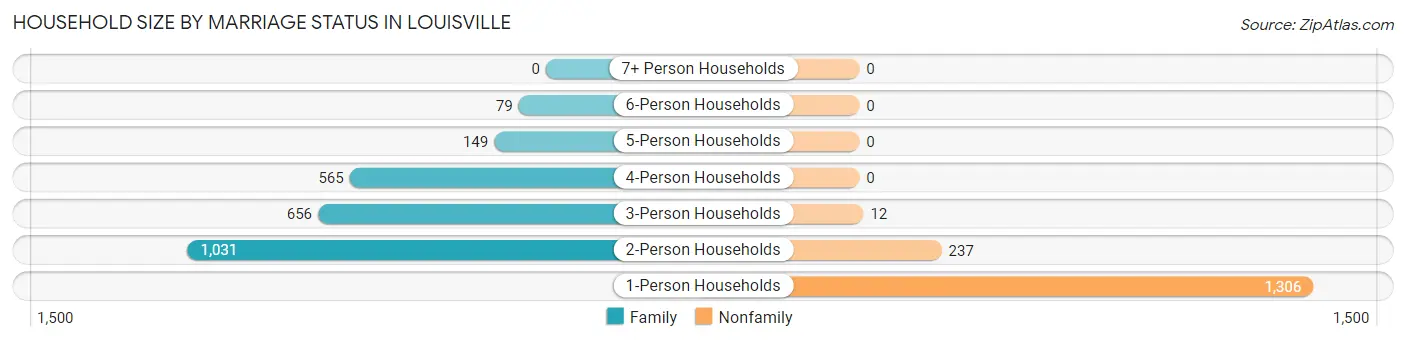
| Household Size | Family Households | Nonfamily Households |
| 1-Person Households | - | 1,306 (32.4%) |
| 2-Person Households | 1,031 (25.6%) | 237 (5.9%) |
| 3-Person Households | 656 (16.3%) | 12 (0.3%) |
| 4-Person Households | 565 (14.0%) | 0 (0.0%) |
| 5-Person Households | 149 (3.7%) | 0 (0.0%) |
| 6-Person Households | 79 (2.0%) | 0 (0.0%) |
| 7+ Person Households | 0 (0.0%) | 0 (0.0%) |
| Total | 2,480 (61.5%) | 1,555 (38.5%) |
Female Fertility in Louisville
Fertility by Age in Louisville
Average fertility rate in Louisville is 51.0 births per 1,000 women. Women in the age bracket of 20 to 34 years have the highest fertility rate with 70.0 births per 1,000 women. Women in the age bracket of 35 to 50 years acount for 50.5% of all women with births.
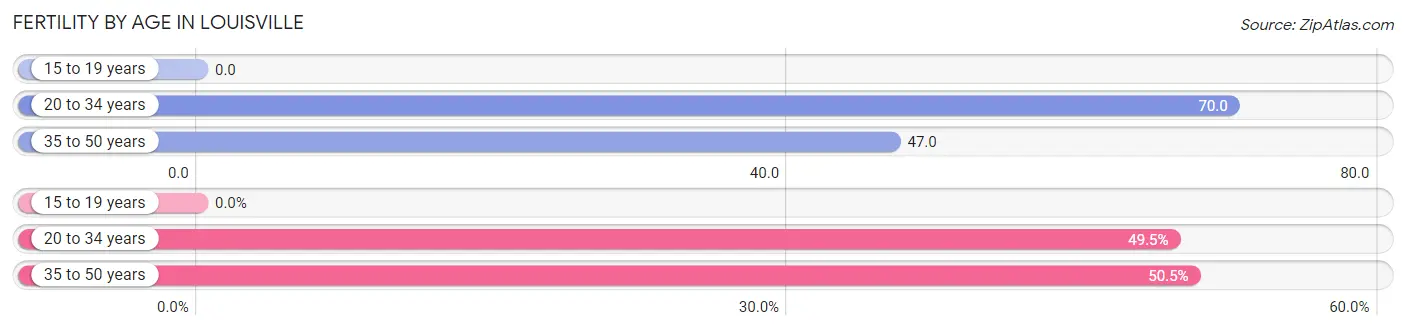
| Age Bracket | Women with Births | Births / 1,000 Women |
| 15 to 19 years | 0 (0.0%) | 0.0 |
| 20 to 34 years | 49 (49.5%) | 70.0 |
| 35 to 50 years | 50 (50.5%) | 47.0 |
| Total | 99 (100.0%) | 51.0 |
Fertility by Age by Marriage Status in Louisville
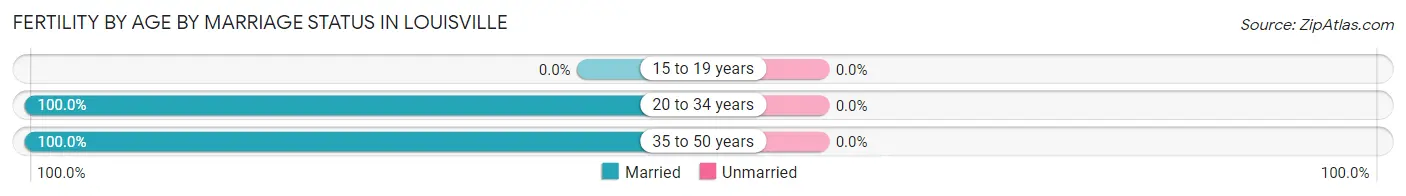
| Age Bracket | Married | Unmarried |
| 15 to 19 years | 0 (0.0%) | 0 (0.0%) |
| 20 to 34 years | 49 (100.0%) | 0 (0.0%) |
| 35 to 50 years | 50 (100.0%) | 0 (0.0%) |
| Total | 99 (100.0%) | 0 (0.0%) |
Fertility by Education in Louisville
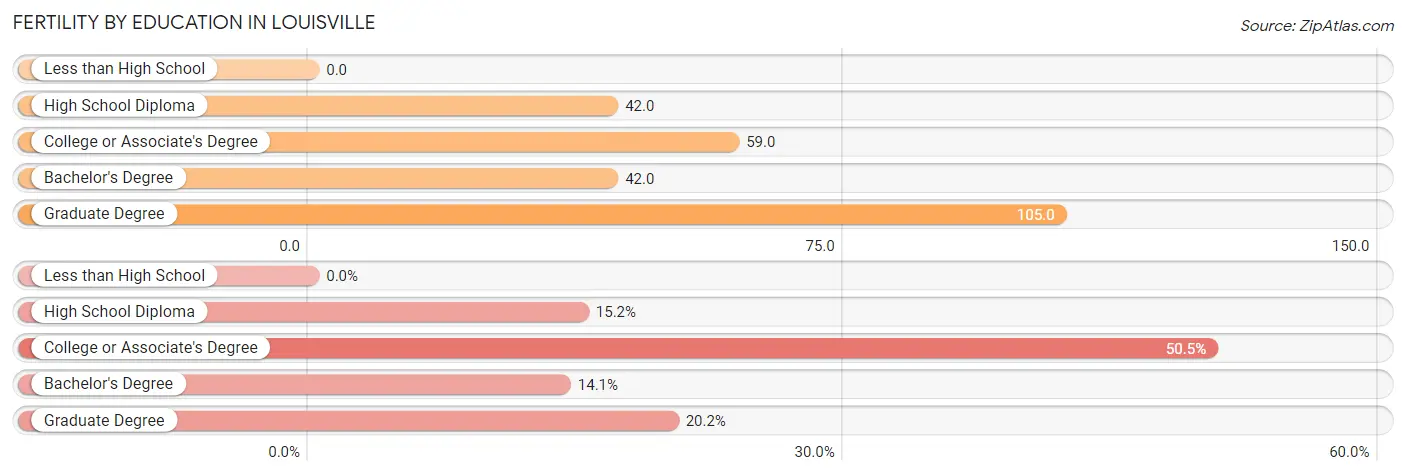
| Educational Attainment | Women with Births | Births / 1,000 Women |
| Less than High School | 0 (0.0%) | 0.0 |
| High School Diploma | 15 (15.1%) | 42.0 |
| College or Associate's Degree | 50 (50.5%) | 59.0 |
| Bachelor's Degree | 14 (14.1%) | 42.0 |
| Graduate Degree | 20 (20.2%) | 105.0 |
| Total | 99 (100.0%) | 51.0 |
Fertility by Education by Marriage Status in Louisville
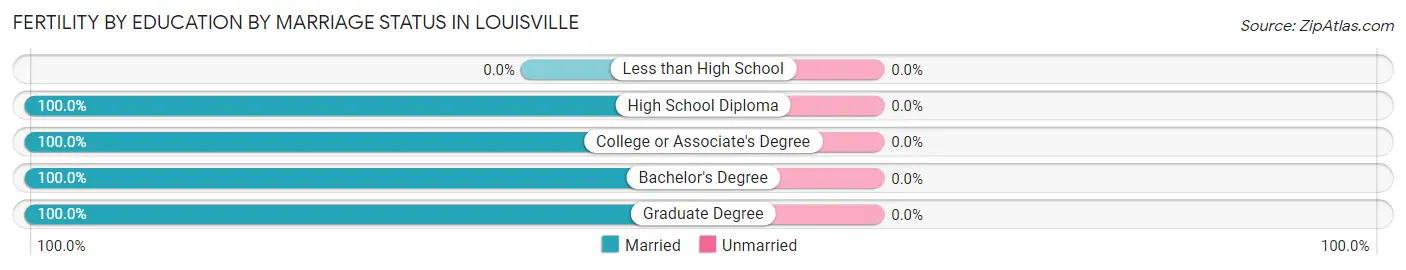
| Educational Attainment | Married | Unmarried |
| Less than High School | 0 (0.0%) | 0 (0.0%) |
| High School Diploma | 15 (100.0%) | 0 (0.0%) |
| College or Associate's Degree | 50 (100.0%) | 0 (0.0%) |
| Bachelor's Degree | 14 (100.0%) | 0 (0.0%) |
| Graduate Degree | 20 (100.0%) | 0 (0.0%) |
| Total | 99 (100.0%) | 0 (0.0%) |
Employment Characteristics in Louisville
Employment by Class of Employer in Louisville
Among the 4,460 employed individuals in Louisville, private company employees (2,805 | 62.9%), not-for-profit organizations (667 | 15.0%), and local government employees (393 | 8.8%) make up the most common classes of employment.
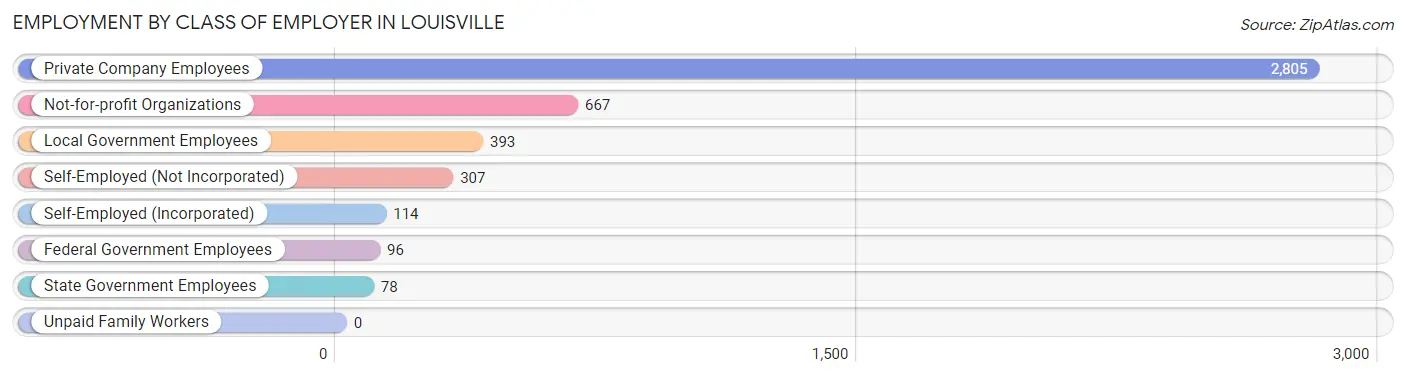
| Employer Class | # Employees | % Employees |
| Private Company Employees | 2,805 | 62.9% |
| Self-Employed (Incorporated) | 114 | 2.6% |
| Self-Employed (Not Incorporated) | 307 | 6.9% |
| Not-for-profit Organizations | 667 | 15.0% |
| Local Government Employees | 393 | 8.8% |
| State Government Employees | 78 | 1.8% |
| Federal Government Employees | 96 | 2.1% |
| Unpaid Family Workers | 0 | 0.0% |
| Total | 4,460 | 100.0% |
Employment Status by Age in Louisville
According to the labor force statistics for Louisville, out of the total population over 16 years of age (7,432), 61.9% or 4,600 individuals are in the labor force, with 1.7% or 78 of them unemployed. The age group with the highest labor force participation rate is 25 to 29 years, with 94.4% or 387 individuals in the labor force. Within the labor force, the 55 to 59 years age range has the highest percentage of unemployed individuals, with 8.2% or 34 of them being unemployed.
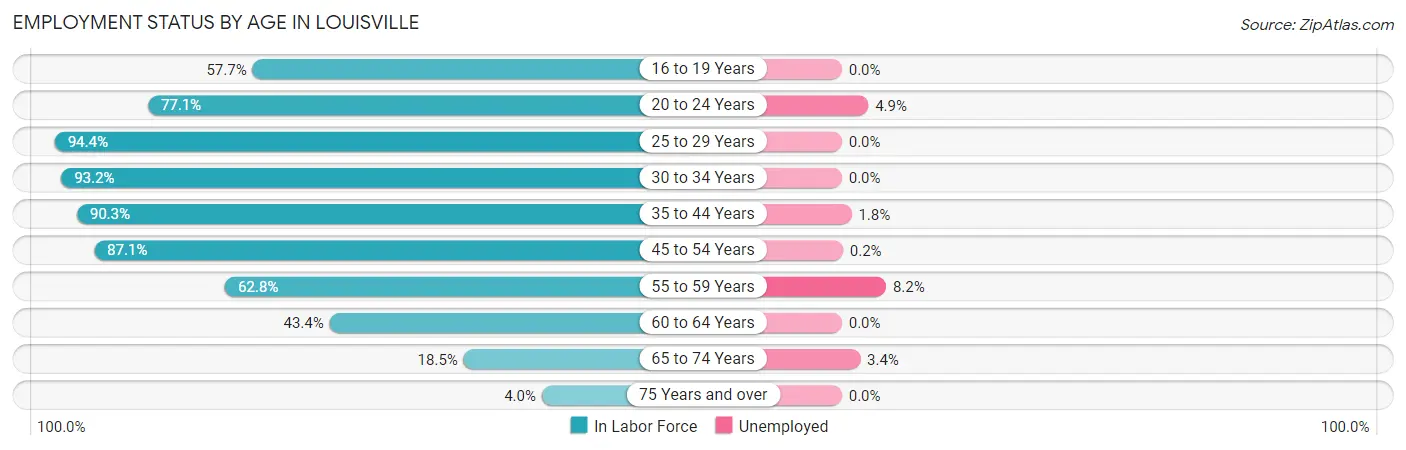
| Age Bracket | In Labor Force | Unemployed |
| 16 to 19 Years | 378 (57.7%) | 0 (0.0%) |
| 20 to 24 Years | 309 (77.1%) | 15 (4.9%) |
| 25 to 29 Years | 387 (94.4%) | 0 (0.0%) |
| 30 to 34 Years | 449 (93.2%) | 0 (0.0%) |
| 35 to 44 Years | 1,117 (90.3%) | 20 (1.8%) |
| 45 to 54 Years | 1,145 (87.1%) | 2 (0.2%) |
| 55 to 59 Years | 417 (62.8%) | 34 (8.2%) |
| 60 to 64 Years | 212 (43.4%) | 0 (0.0%) |
| 65 to 74 Years | 148 (18.5%) | 5 (3.4%) |
| 75 Years and over | 39 (4.0%) | 0 (0.0%) |
| Total | 4,600 (61.9%) | 78 (1.7%) |
Employment Status by Educational Attainment in Louisville
According to labor force statistics for Louisville, 81.1% of individuals (3,728) out of the total population between 25 and 64 years of age (4,597) are in the labor force, with 1.5% or 56 of them being unemployed. The group with the highest labor force participation rate are those with the educational attainment of bachelor's degree or higher, with 87.7% or 980 individuals in the labor force. Within the labor force, individuals with bachelor's degree or higher education have the highest percentage of unemployment, with 3.5% or 34 of them being unemployed.
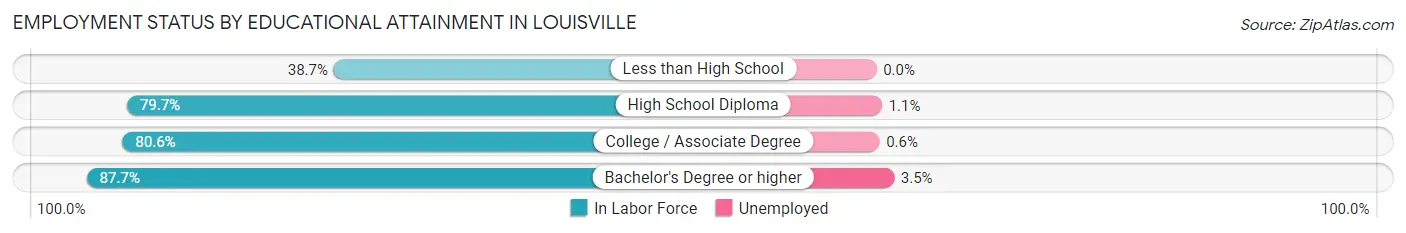
| Educational Attainment | In Labor Force | Unemployed |
| Less than High School | 41 (38.7%) | 0 (0.0%) |
| High School Diploma | 1,220 (79.7%) | 17 (1.1%) |
| College / Associate Degree | 1,485 (80.6%) | 11 (0.6%) |
| Bachelor's Degree or higher | 980 (87.7%) | 39 (3.5%) |
| Total | 3,728 (81.1%) | 69 (1.5%) |
Employment Occupations by Sex in Louisville
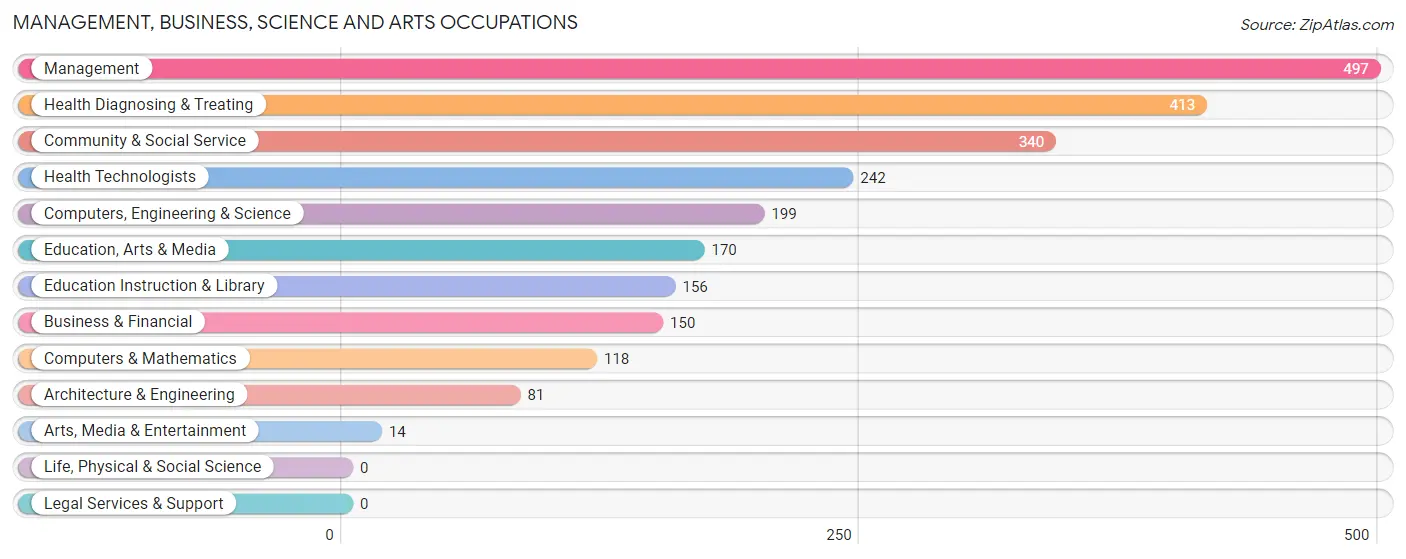
Management, Business, Science and Arts Occupations
The most common Management, Business, Science and Arts occupations in Louisville are Management (497 | 11.0%), Health Diagnosing & Treating (413 | 9.2%), Community & Social Service (340 | 7.5%), Health Technologists (242 | 5.4%), and Computers, Engineering & Science (199 | 4.4%).
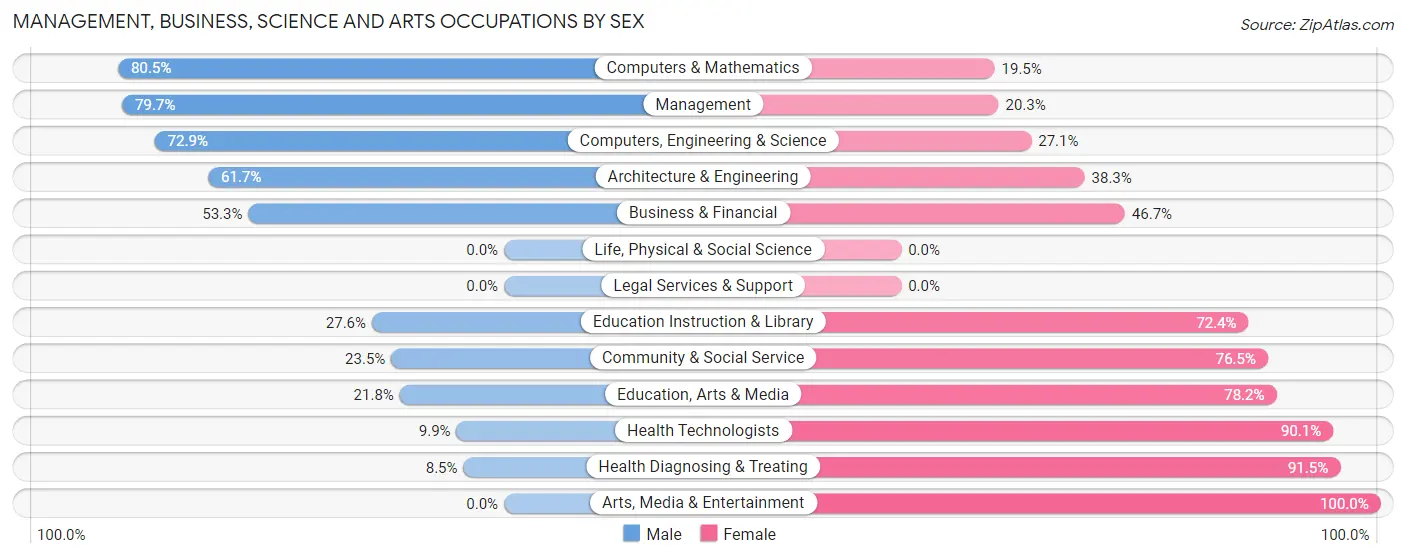
Management, Business, Science and Arts Occupations by Sex
Within the Management, Business, Science and Arts occupations in Louisville, the most male-oriented occupations are Computers & Mathematics (80.5%), Management (79.7%), and Computers, Engineering & Science (72.9%), while the most female-oriented occupations are Arts, Media & Entertainment (100.0%), Health Diagnosing & Treating (91.5%), and Health Technologists (90.1%).
| Occupation | Male | Female |
| Management | 396 (79.7%) | 101 (20.3%) |
| Business & Financial | 80 (53.3%) | 70 (46.7%) |
| Computers, Engineering & Science | 145 (72.9%) | 54 (27.1%) |
| Computers & Mathematics | 95 (80.5%) | 23 (19.5%) |
| Architecture & Engineering | 50 (61.7%) | 31 (38.3%) |
| Life, Physical & Social Science | 0 (0.0%) | 0 (0.0%) |
| Community & Social Service | 80 (23.5%) | 260 (76.5%) |
| Education, Arts & Media | 37 (21.8%) | 133 (78.2%) |
| Legal Services & Support | 0 (0.0%) | 0 (0.0%) |
| Education Instruction & Library | 43 (27.6%) | 113 (72.4%) |
| Arts, Media & Entertainment | 0 (0.0%) | 14 (100.0%) |
| Health Diagnosing & Treating | 35 (8.5%) | 378 (91.5%) |
| Health Technologists | 24 (9.9%) | 218 (90.1%) |
| Total (Category) | 736 (46.0%) | 863 (54.0%) |
| Total (Overall) | 2,388 (52.9%) | 2,123 (47.1%) |
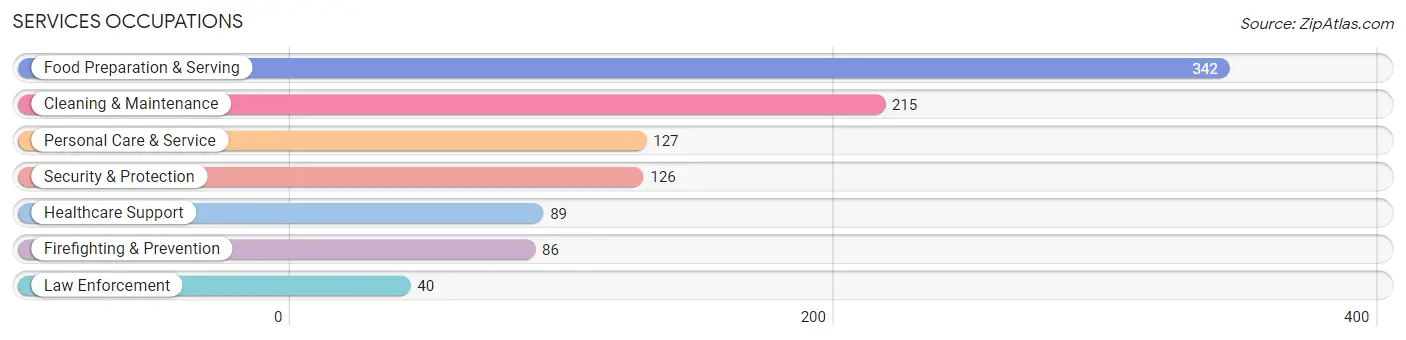
Services Occupations
The most common Services occupations in Louisville are Food Preparation & Serving (342 | 7.6%), Cleaning & Maintenance (215 | 4.8%), Personal Care & Service (127 | 2.8%), Security & Protection (126 | 2.8%), and Healthcare Support (89 | 2.0%).
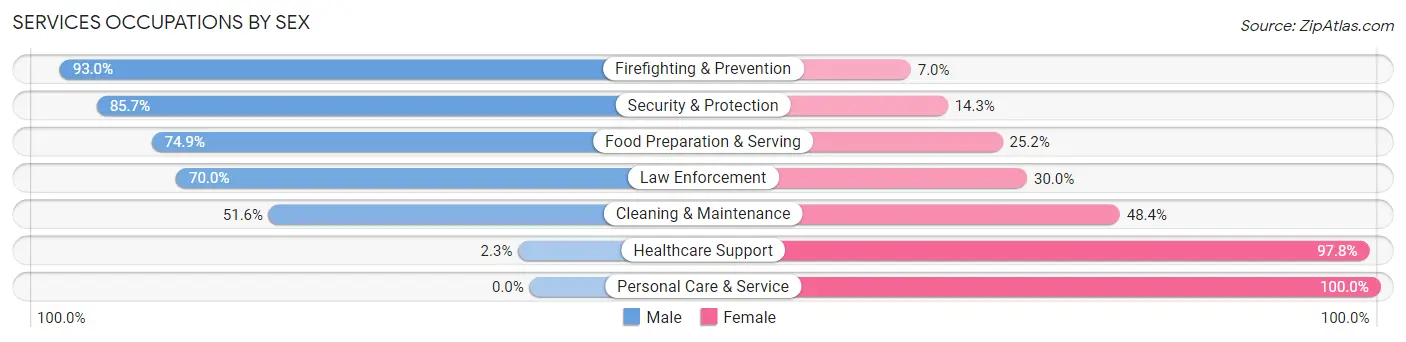
Services Occupations by Sex
Within the Services occupations in Louisville, the most male-oriented occupations are Firefighting & Prevention (93.0%), Security & Protection (85.7%), and Food Preparation & Serving (74.9%), while the most female-oriented occupations are Personal Care & Service (100.0%), Healthcare Support (97.8%), and Cleaning & Maintenance (48.4%).
| Occupation | Male | Female |
| Healthcare Support | 2 (2.2%) | 87 (97.8%) |
| Security & Protection | 108 (85.7%) | 18 (14.3%) |
| Firefighting & Prevention | 80 (93.0%) | 6 (7.0%) |
| Law Enforcement | 28 (70.0%) | 12 (30.0%) |
| Food Preparation & Serving | 256 (74.9%) | 86 (25.2%) |
| Cleaning & Maintenance | 111 (51.6%) | 104 (48.4%) |
| Personal Care & Service | 0 (0.0%) | 127 (100.0%) |
| Total (Category) | 477 (53.1%) | 422 (46.9%) |
| Total (Overall) | 2,388 (52.9%) | 2,123 (47.1%) |
Sales and Office Occupations
The most common Sales and Office occupations in Louisville are Office & Administration (526 | 11.7%), and Sales & Related (504 | 11.2%).

Sales and Office Occupations by Sex
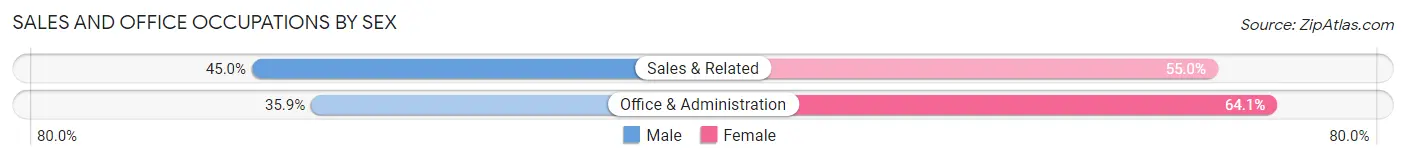
| Occupation | Male | Female |
| Sales & Related | 227 (45.0%) | 277 (55.0%) |
| Office & Administration | 189 (35.9%) | 337 (64.1%) |
| Total (Category) | 416 (40.4%) | 614 (59.6%) |
| Total (Overall) | 2,388 (52.9%) | 2,123 (47.1%) |
Natural Resources, Construction and Maintenance Occupations
The most common Natural Resources, Construction and Maintenance occupations in Louisville are Installation, Maintenance & Repair (161 | 3.6%), and Construction & Extraction (98 | 2.2%).

Natural Resources, Construction and Maintenance Occupations by Sex

| Occupation | Male | Female |
| Farming, Fishing & Forestry | 0 (0.0%) | 0 (0.0%) |
| Construction & Extraction | 98 (100.0%) | 0 (0.0%) |
| Installation, Maintenance & Repair | 161 (100.0%) | 0 (0.0%) |
| Total (Category) | 259 (100.0%) | 0 (0.0%) |
| Total (Overall) | 2,388 (52.9%) | 2,123 (47.1%) |
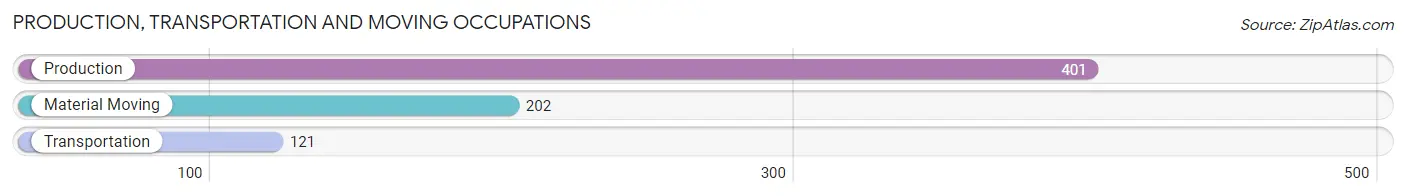
Production, Transportation and Moving Occupations
The most common Production, Transportation and Moving occupations in Louisville are Production (401 | 8.9%), Material Moving (202 | 4.5%), and Transportation (121 | 2.7%).
Production, Transportation and Moving Occupations by Sex
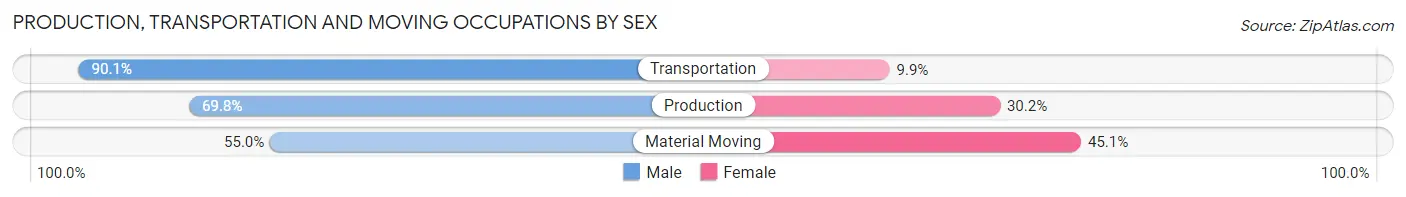
| Occupation | Male | Female |
| Production | 280 (69.8%) | 121 (30.2%) |
| Transportation | 109 (90.1%) | 12 (9.9%) |
| Material Moving | 111 (54.9%) | 91 (45.1%) |
| Total (Category) | 500 (69.1%) | 224 (30.9%) |
| Total (Overall) | 2,388 (52.9%) | 2,123 (47.1%) |
Employment Industries by Sex in Louisville
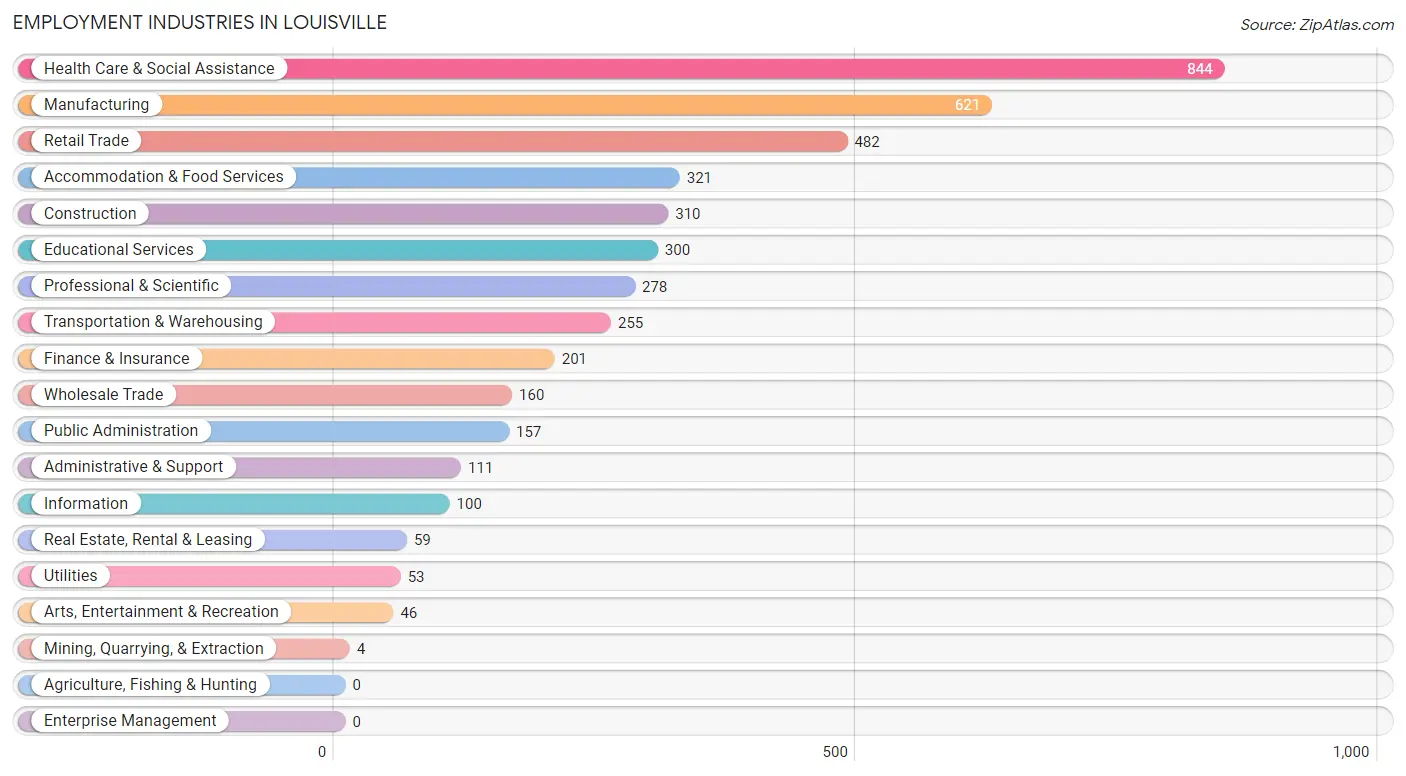
Employment Industries in Louisville
The major employment industries in Louisville include Health Care & Social Assistance (844 | 18.7%), Manufacturing (621 | 13.8%), Retail Trade (482 | 10.7%), Accommodation & Food Services (321 | 7.1%), and Construction (310 | 6.9%).
Employment Industries by Sex in Louisville
The Louisville industries that see more men than women are Mining, Quarrying, & Extraction (100.0%), Construction (92.9%), and Manufacturing (88.2%), whereas the industries that tend to have a higher number of women are Arts, Entertainment & Recreation (100.0%), Health Care & Social Assistance (80.6%), and Information (73.0%).
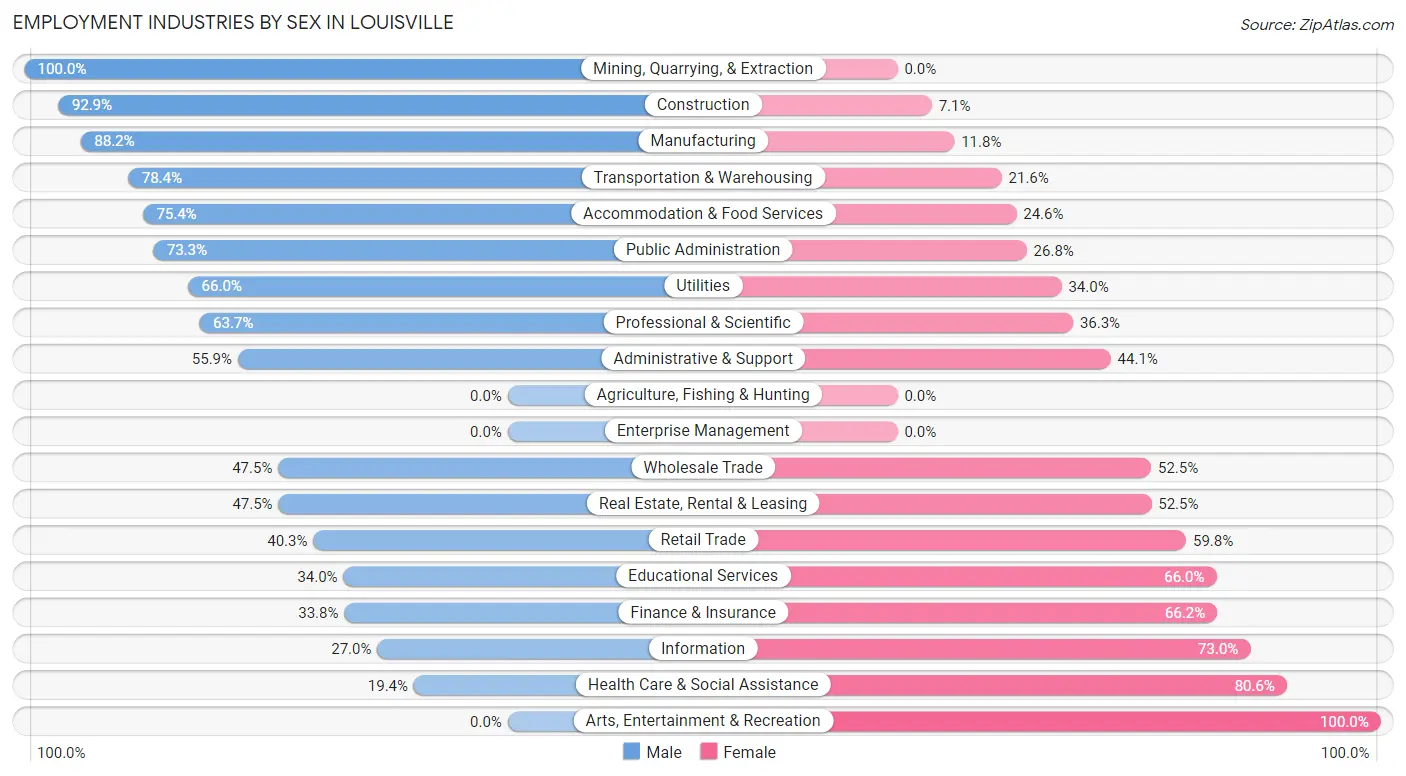
| Industry | Male | Female |
| Agriculture, Fishing & Hunting | 0 (0.0%) | 0 (0.0%) |
| Mining, Quarrying, & Extraction | 4 (100.0%) | 0 (0.0%) |
| Construction | 288 (92.9%) | 22 (7.1%) |
| Manufacturing | 548 (88.2%) | 73 (11.8%) |
| Wholesale Trade | 76 (47.5%) | 84 (52.5%) |
| Retail Trade | 194 (40.3%) | 288 (59.8%) |
| Transportation & Warehousing | 200 (78.4%) | 55 (21.6%) |
| Utilities | 35 (66.0%) | 18 (34.0%) |
| Information | 27 (27.0%) | 73 (73.0%) |
| Finance & Insurance | 68 (33.8%) | 133 (66.2%) |
| Real Estate, Rental & Leasing | 28 (47.5%) | 31 (52.5%) |
| Professional & Scientific | 177 (63.7%) | 101 (36.3%) |
| Enterprise Management | 0 (0.0%) | 0 (0.0%) |
| Administrative & Support | 62 (55.9%) | 49 (44.1%) |
| Educational Services | 102 (34.0%) | 198 (66.0%) |
| Health Care & Social Assistance | 164 (19.4%) | 680 (80.6%) |
| Arts, Entertainment & Recreation | 0 (0.0%) | 46 (100.0%) |
| Accommodation & Food Services | 242 (75.4%) | 79 (24.6%) |
| Public Administration | 115 (73.3%) | 42 (26.8%) |
| Total | 2,388 (52.9%) | 2,123 (47.1%) |
Education in Louisville
School Enrollment in Louisville
The most common levels of schooling among the 2,626 students in Louisville are high school (848 | 32.3%), middle school (680 | 25.9%), and elementary school (392 | 14.9%).
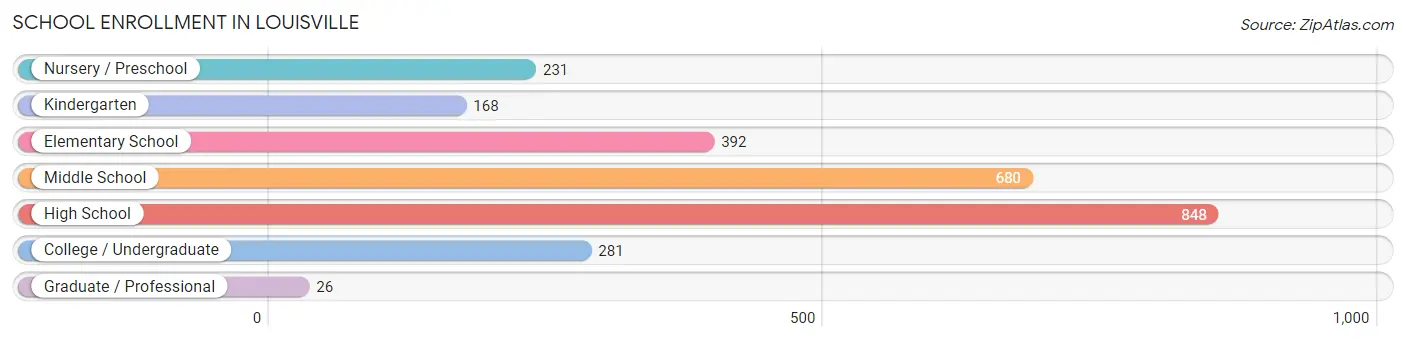
| School Level | # Students | % Students |
| Nursery / Preschool | 231 | 8.8% |
| Kindergarten | 168 | 6.4% |
| Elementary School | 392 | 14.9% |
| Middle School | 680 | 25.9% |
| High School | 848 | 32.3% |
| College / Undergraduate | 281 | 10.7% |
| Graduate / Professional | 26 | 1.0% |
| Total | 2,626 | 100.0% |
School Enrollment by Age by Funding Source in Louisville
Out of a total of 2,626 students who are enrolled in schools in Louisville, 221 (8.4%) attend a private institution, while the remaining 2,405 (91.6%) are enrolled in public schools. The age group of 20 to 24 year olds has the highest likelihood of being enrolled in private schools, with 34 (21.1% in the age bracket) enrolled. Conversely, the age group of 35 years and over has the lowest likelihood of being enrolled in a private school, with 6 (100.0% in the age bracket) attending a public institution.
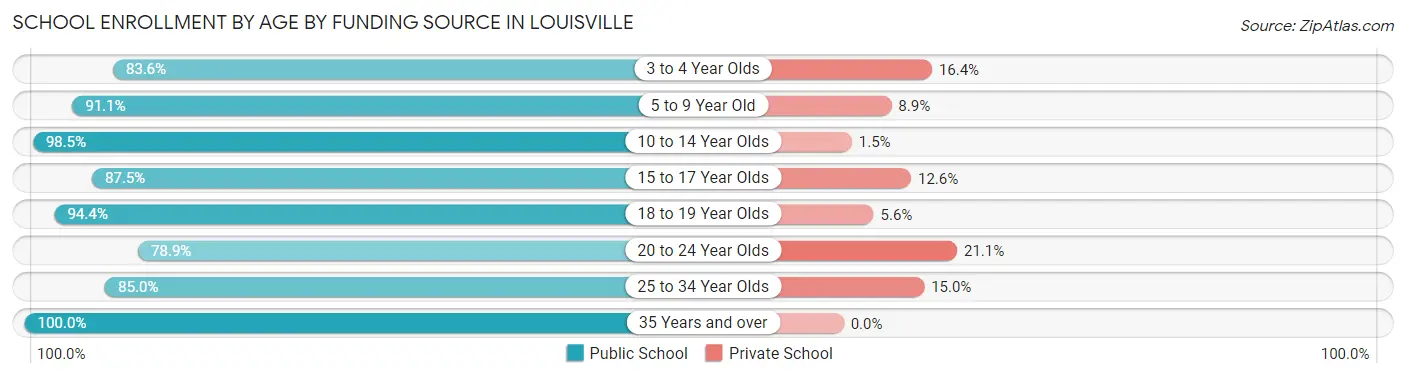
| Age Bracket | Public School | Private School |
| 3 to 4 Year Olds | 122 (83.6%) | 24 (16.4%) |
| 5 to 9 Year Old | 574 (91.1%) | 56 (8.9%) |
| 10 to 14 Year Olds | 778 (98.5%) | 12 (1.5%) |
| 15 to 17 Year Olds | 460 (87.5%) | 66 (12.6%) |
| 18 to 19 Year Olds | 271 (94.4%) | 16 (5.6%) |
| 20 to 24 Year Olds | 127 (78.9%) | 34 (21.1%) |
| 25 to 34 Year Olds | 68 (85.0%) | 12 (15.0%) |
| 35 Years and over | 6 (100.0%) | 0 (0.0%) |
| Total | 2,405 (91.6%) | 221 (8.4%) |
Educational Attainment by Field of Study in Louisville
Business (380 | 25.5%), education (271 | 18.2%), science & technology (261 | 17.5%), engineering (106 | 7.1%), and bio, nature & agricultural (80 | 5.4%) are the most common fields of study among 1,490 individuals in Louisville who have obtained a bachelor's degree or higher.
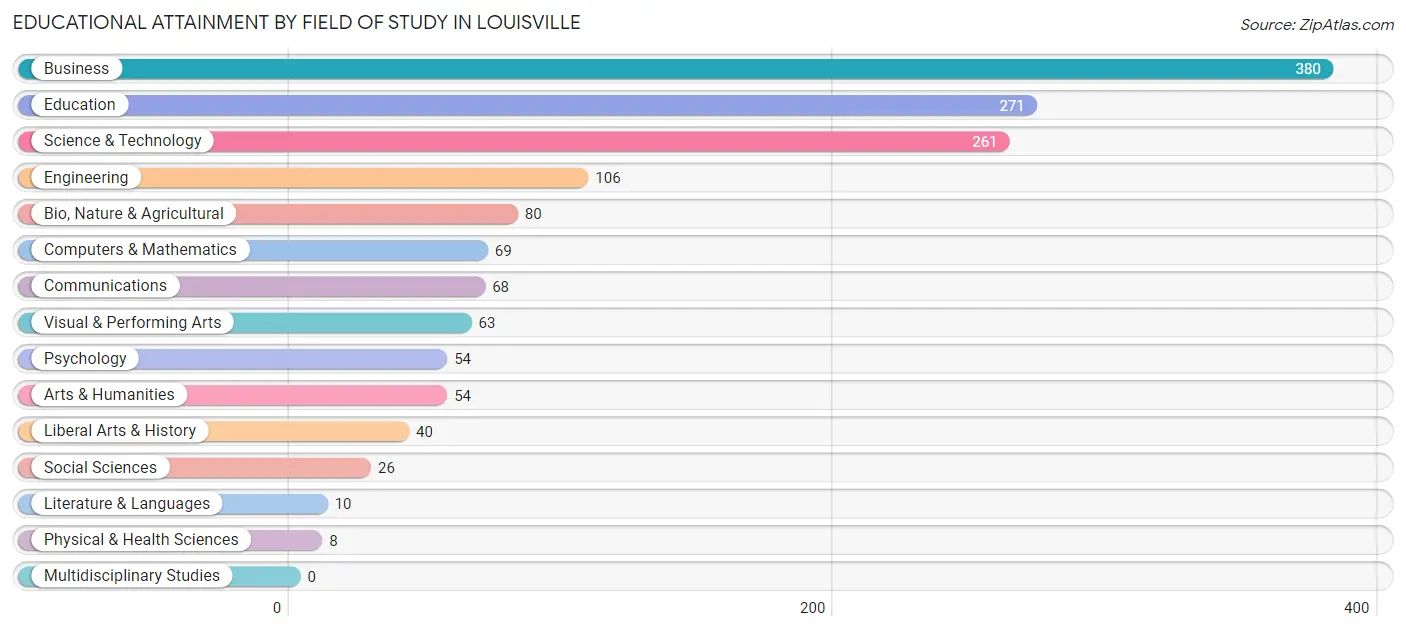
| Field of Study | # Graduates | % Graduates |
| Computers & Mathematics | 69 | 4.6% |
| Bio, Nature & Agricultural | 80 | 5.4% |
| Physical & Health Sciences | 8 | 0.5% |
| Psychology | 54 | 3.6% |
| Social Sciences | 26 | 1.7% |
| Engineering | 106 | 7.1% |
| Multidisciplinary Studies | 0 | 0.0% |
| Science & Technology | 261 | 17.5% |
| Business | 380 | 25.5% |
| Education | 271 | 18.2% |
| Literature & Languages | 10 | 0.7% |
| Liberal Arts & History | 40 | 2.7% |
| Visual & Performing Arts | 63 | 4.2% |
| Communications | 68 | 4.6% |
| Arts & Humanities | 54 | 3.6% |
| Total | 1,490 | 100.0% |
Transportation & Commute in Louisville
Vehicle Availability by Sex in Louisville
The most prevalent vehicle ownership categories in Louisville are males with 2 vehicles (1,054, accounting for 44.5%) and females with 2 vehicles (871, making up 50.4%).
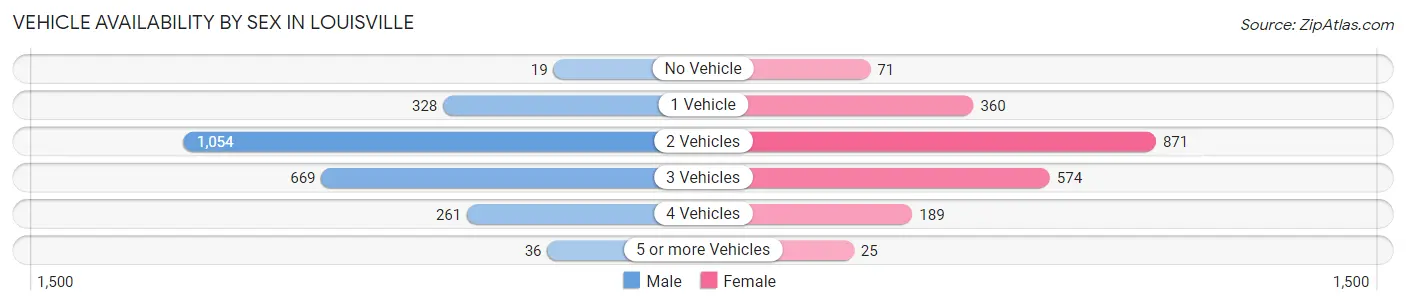
| Vehicles Available | Male | Female |
| No Vehicle | 19 (0.8%) | 71 (3.4%) |
| 1 Vehicle | 328 (13.9%) | 360 (17.2%) |
| 2 Vehicles | 1,054 (44.5%) | 871 (41.7%) |
| 3 Vehicles | 669 (28.3%) | 574 (27.5%) |
| 4 Vehicles | 261 (11.0%) | 189 (9.0%) |
| 5 or more Vehicles | 36 (1.5%) | 25 (1.2%) |
| Total | 2,367 (100.0%) | 2,090 (100.0%) |
Commute Time in Louisville
The most frequently occuring commute durations in Louisville are 20 to 24 minutes (943 commuters, 23.5%), 30 to 34 minutes (574 commuters, 14.3%), and 15 to 19 minutes (557 commuters, 13.9%).
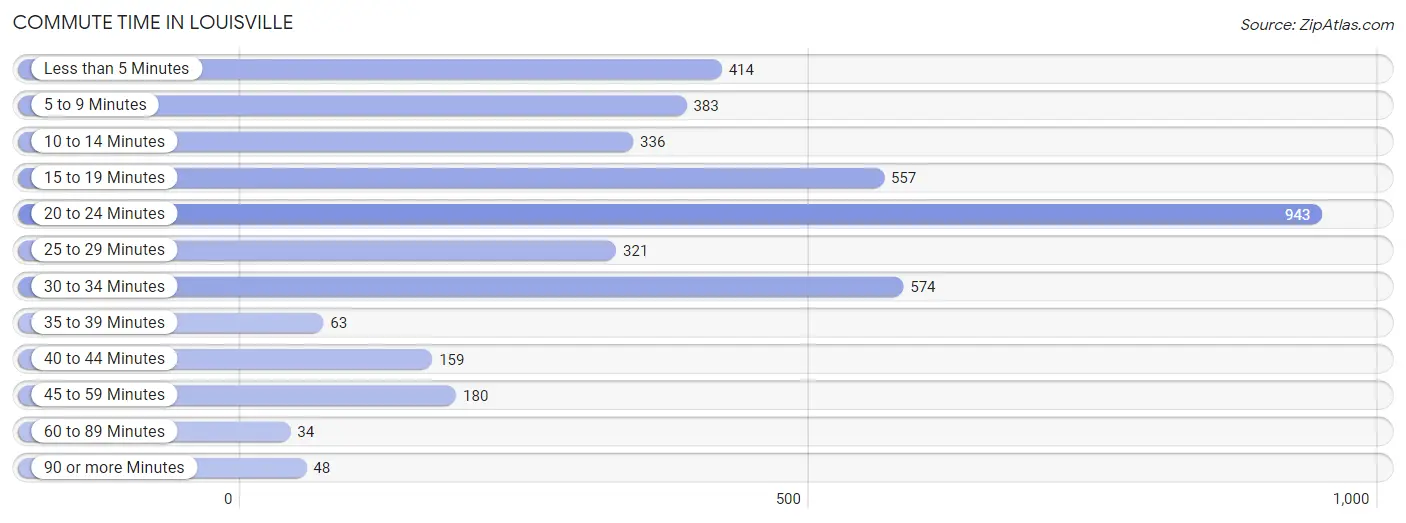
| Commute Time | # Commuters | % Commuters |
| Less than 5 Minutes | 414 | 10.3% |
| 5 to 9 Minutes | 383 | 9.6% |
| 10 to 14 Minutes | 336 | 8.4% |
| 15 to 19 Minutes | 557 | 13.9% |
| 20 to 24 Minutes | 943 | 23.5% |
| 25 to 29 Minutes | 321 | 8.0% |
| 30 to 34 Minutes | 574 | 14.3% |
| 35 to 39 Minutes | 63 | 1.6% |
| 40 to 44 Minutes | 159 | 4.0% |
| 45 to 59 Minutes | 180 | 4.5% |
| 60 to 89 Minutes | 34 | 0.9% |
| 90 or more Minutes | 48 | 1.2% |
Commute Time by Sex in Louisville
The most common commute times in Louisville are 20 to 24 minutes (478 commuters, 22.6%) for males and 20 to 24 minutes (465 commuters, 24.5%) for females.
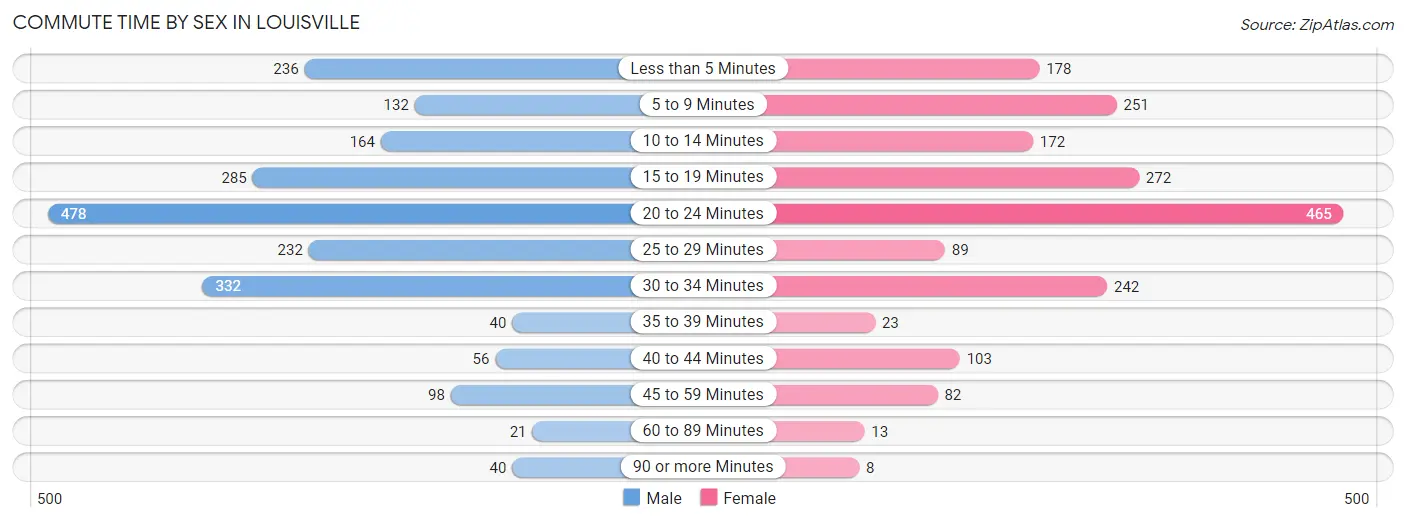
| Commute Time | Male | Female |
| Less than 5 Minutes | 236 (11.2%) | 178 (9.4%) |
| 5 to 9 Minutes | 132 (6.2%) | 251 (13.2%) |
| 10 to 14 Minutes | 164 (7.8%) | 172 (9.1%) |
| 15 to 19 Minutes | 285 (13.5%) | 272 (14.3%) |
| 20 to 24 Minutes | 478 (22.6%) | 465 (24.5%) |
| 25 to 29 Minutes | 232 (11.0%) | 89 (4.7%) |
| 30 to 34 Minutes | 332 (15.7%) | 242 (12.8%) |
| 35 to 39 Minutes | 40 (1.9%) | 23 (1.2%) |
| 40 to 44 Minutes | 56 (2.6%) | 103 (5.4%) |
| 45 to 59 Minutes | 98 (4.6%) | 82 (4.3%) |
| 60 to 89 Minutes | 21 (1.0%) | 13 (0.7%) |
| 90 or more Minutes | 40 (1.9%) | 8 (0.4%) |
Time of Departure to Work by Sex in Louisville
The most frequent times of departure to work in Louisville are 7:00 AM to 7:29 AM (468, 22.1%) for males and 7:00 AM to 7:29 AM (291, 15.3%) for females.
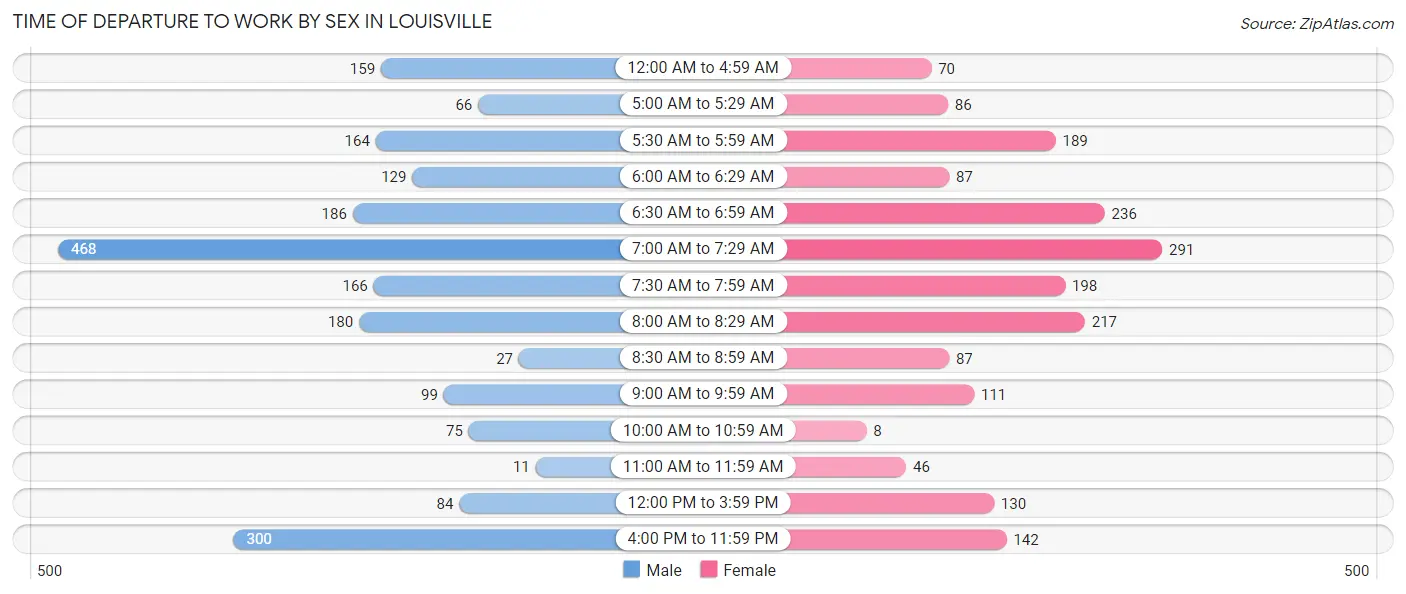
| Time of Departure | Male | Female |
| 12:00 AM to 4:59 AM | 159 (7.5%) | 70 (3.7%) |
| 5:00 AM to 5:29 AM | 66 (3.1%) | 86 (4.5%) |
| 5:30 AM to 5:59 AM | 164 (7.8%) | 189 (10.0%) |
| 6:00 AM to 6:29 AM | 129 (6.1%) | 87 (4.6%) |
| 6:30 AM to 6:59 AM | 186 (8.8%) | 236 (12.4%) |
| 7:00 AM to 7:29 AM | 468 (22.1%) | 291 (15.3%) |
| 7:30 AM to 7:59 AM | 166 (7.9%) | 198 (10.4%) |
| 8:00 AM to 8:29 AM | 180 (8.5%) | 217 (11.4%) |
| 8:30 AM to 8:59 AM | 27 (1.3%) | 87 (4.6%) |
| 9:00 AM to 9:59 AM | 99 (4.7%) | 111 (5.9%) |
| 10:00 AM to 10:59 AM | 75 (3.5%) | 8 (0.4%) |
| 11:00 AM to 11:59 AM | 11 (0.5%) | 46 (2.4%) |
| 12:00 PM to 3:59 PM | 84 (4.0%) | 130 (6.9%) |
| 4:00 PM to 11:59 PM | 300 (14.2%) | 142 (7.5%) |
| Total | 2,114 (100.0%) | 1,898 (100.0%) |
Housing Occupancy in Louisville
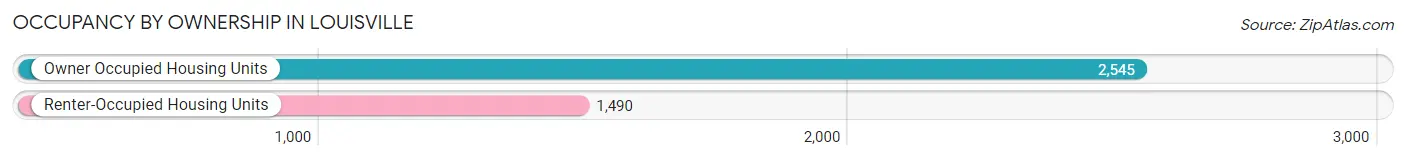
Occupancy by Ownership in Louisville
Of the total 4,035 dwellings in Louisville, owner-occupied units account for 2,545 (63.1%), while renter-occupied units make up 1,490 (36.9%).
| Occupancy | # Housing Units | % Housing Units |
| Owner Occupied Housing Units | 2,545 | 63.1% |
| Renter-Occupied Housing Units | 1,490 | 36.9% |
| Total Occupied Housing Units | 4,035 | 100.0% |
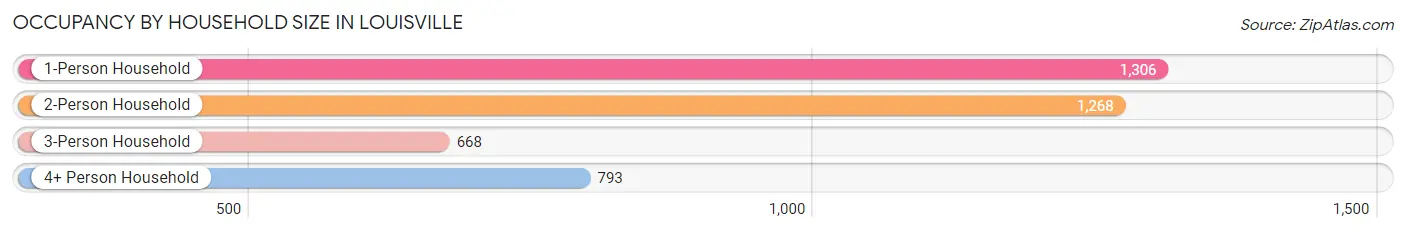
Occupancy by Household Size in Louisville
| Household Size | # Housing Units | % Housing Units |
| 1-Person Household | 1,306 | 32.4% |
| 2-Person Household | 1,268 | 31.4% |
| 3-Person Household | 668 | 16.6% |
| 4+ Person Household | 793 | 19.7% |
| Total Housing Units | 4,035 | 100.0% |
Occupancy by Ownership by Household Size in Louisville
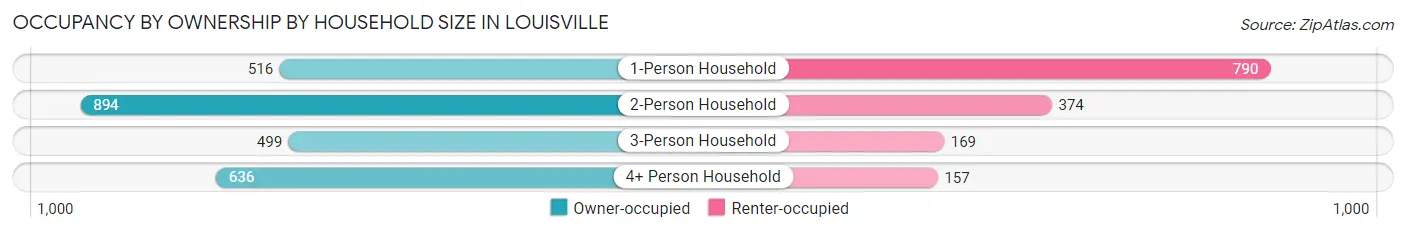
| Household Size | Owner-occupied | Renter-occupied |
| 1-Person Household | 516 (39.5%) | 790 (60.5%) |
| 2-Person Household | 894 (70.5%) | 374 (29.5%) |
| 3-Person Household | 499 (74.7%) | 169 (25.3%) |
| 4+ Person Household | 636 (80.2%) | 157 (19.8%) |
| Total Housing Units | 2,545 (63.1%) | 1,490 (36.9%) |
Occupancy by Educational Attainment in Louisville
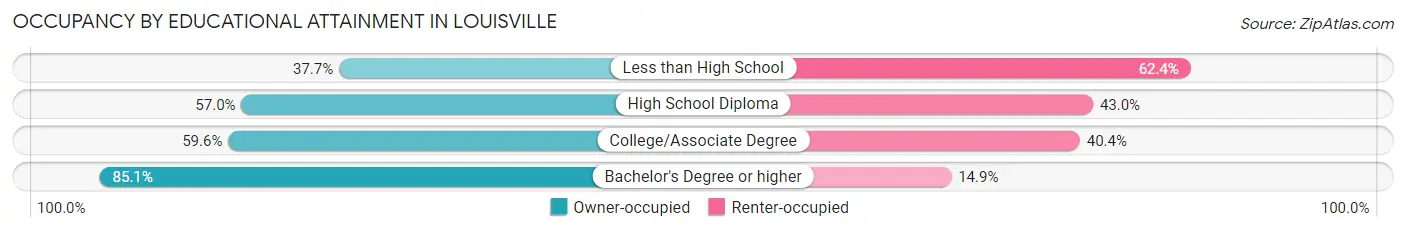
| Household Size | Owner-occupied | Renter-occupied |
| Less than High School | 61 (37.7%) | 101 (62.4%) |
| High School Diploma | 902 (57.0%) | 680 (43.0%) |
| College/Associate Degree | 861 (59.6%) | 583 (40.4%) |
| Bachelor's Degree or higher | 721 (85.1%) | 126 (14.9%) |
Occupancy by Age of Householder in Louisville
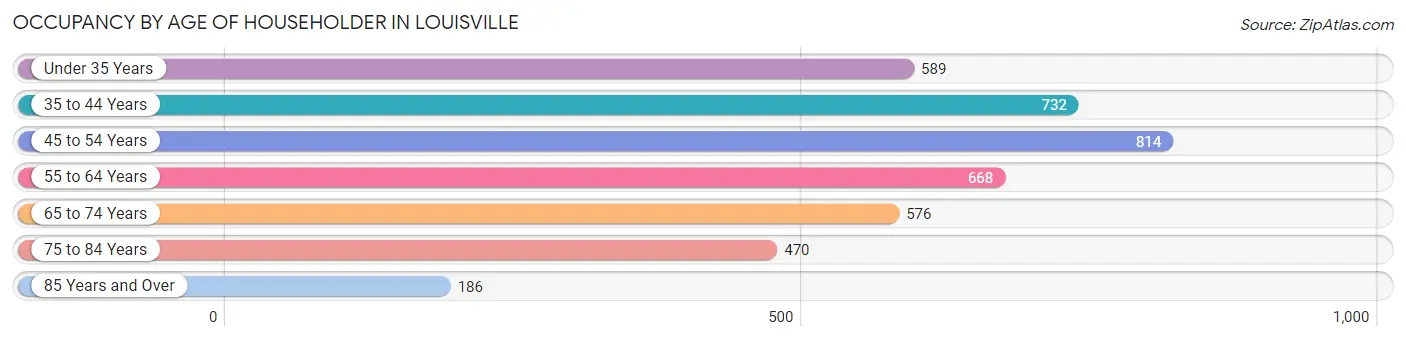
| Age Bracket | # Households | % Households |
| Under 35 Years | 589 | 14.6% |
| 35 to 44 Years | 732 | 18.1% |
| 45 to 54 Years | 814 | 20.2% |
| 55 to 64 Years | 668 | 16.6% |
| 65 to 74 Years | 576 | 14.3% |
| 75 to 84 Years | 470 | 11.7% |
| 85 Years and Over | 186 | 4.6% |
| Total | 4,035 | 100.0% |
Housing Finances in Louisville
Median Income by Occupancy in Louisville
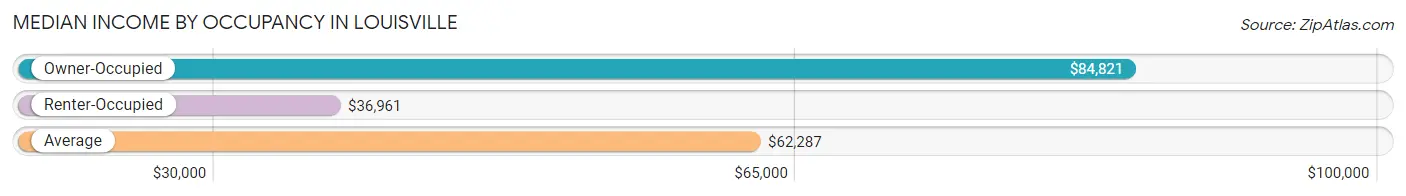
| Occupancy Type | # Households | Median Income |
| Owner-Occupied | 2,545 (63.1%) | $84,821 |
| Renter-Occupied | 1,490 (36.9%) | $36,961 |
| Average | 4,035 (100.0%) | $62,287 |
Occupancy by Householder Income Bracket in Louisville
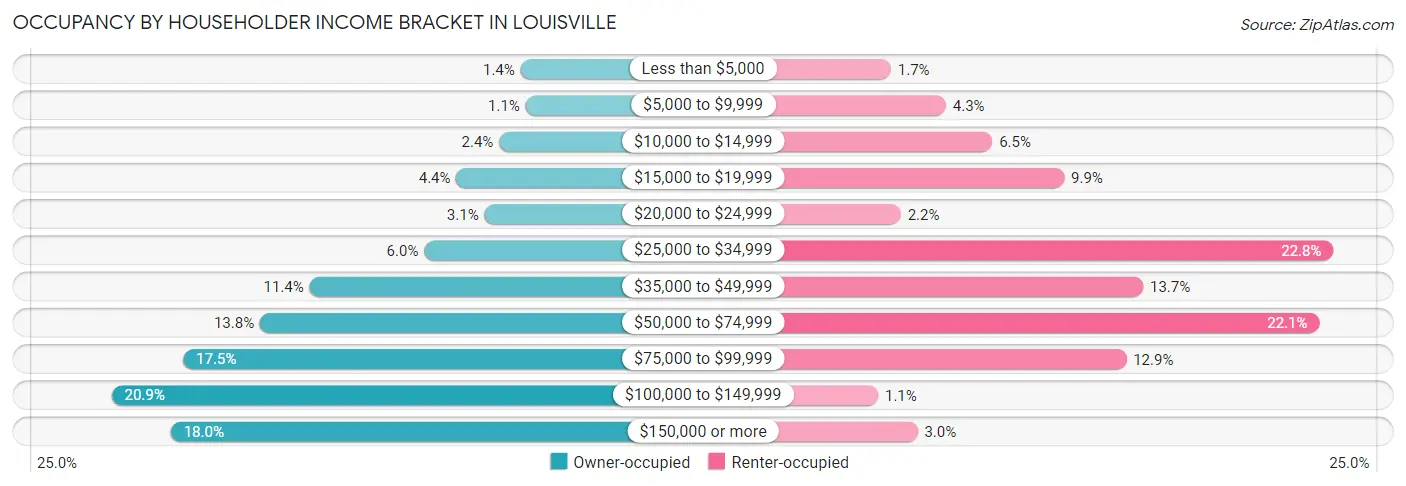
| Income Bracket | Owner-occupied | Renter-occupied |
| Less than $5,000 | 35 (1.4%) | 25 (1.7%) |
| $5,000 to $9,999 | 29 (1.1%) | 64 (4.3%) |
| $10,000 to $14,999 | 61 (2.4%) | 97 (6.5%) |
| $15,000 to $19,999 | 113 (4.4%) | 148 (9.9%) |
| $20,000 to $24,999 | 79 (3.1%) | 32 (2.1%) |
| $25,000 to $34,999 | 152 (6.0%) | 339 (22.8%) |
| $35,000 to $49,999 | 291 (11.4%) | 204 (13.7%) |
| $50,000 to $74,999 | 351 (13.8%) | 329 (22.1%) |
| $75,000 to $99,999 | 444 (17.4%) | 192 (12.9%) |
| $100,000 to $149,999 | 531 (20.9%) | 16 (1.1%) |
| $150,000 or more | 459 (18.0%) | 44 (2.9%) |
| Total | 2,545 (100.0%) | 1,490 (100.0%) |
Monthly Housing Cost Tiers in Louisville
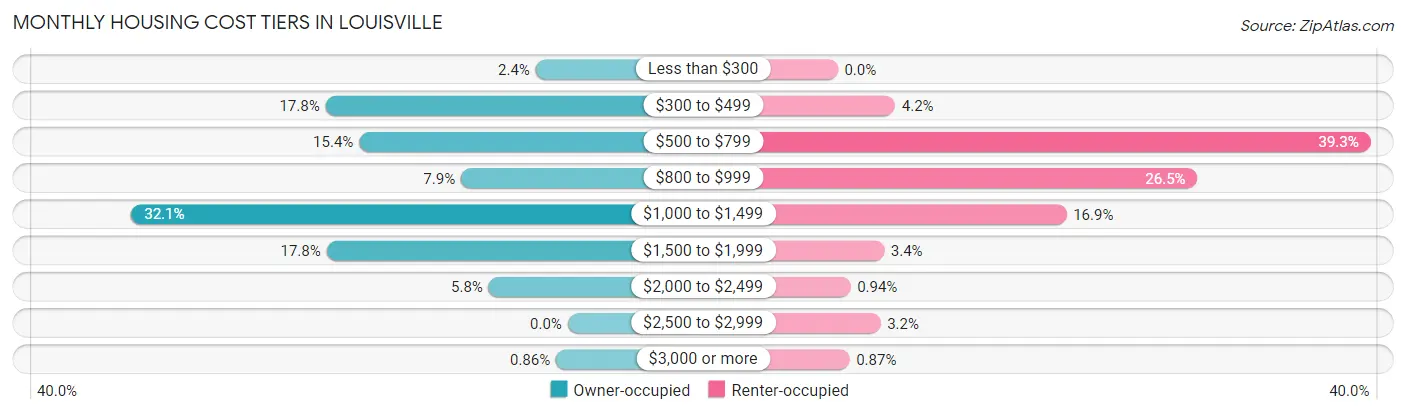
| Monthly Cost | Owner-occupied | Renter-occupied |
| Less than $300 | 60 (2.4%) | 0 (0.0%) |
| $300 to $499 | 454 (17.8%) | 63 (4.2%) |
| $500 to $799 | 391 (15.4%) | 585 (39.3%) |
| $800 to $999 | 200 (7.9%) | 395 (26.5%) |
| $1,000 to $1,499 | 818 (32.1%) | 251 (16.9%) |
| $1,500 to $1,999 | 452 (17.8%) | 51 (3.4%) |
| $2,000 to $2,499 | 148 (5.8%) | 14 (0.9%) |
| $2,500 to $2,999 | 0 (0.0%) | 47 (3.2%) |
| $3,000 or more | 22 (0.9%) | 13 (0.9%) |
| Total | 2,545 (100.0%) | 1,490 (100.0%) |
Physical Housing Characteristics in Louisville
Housing Structures in Louisville
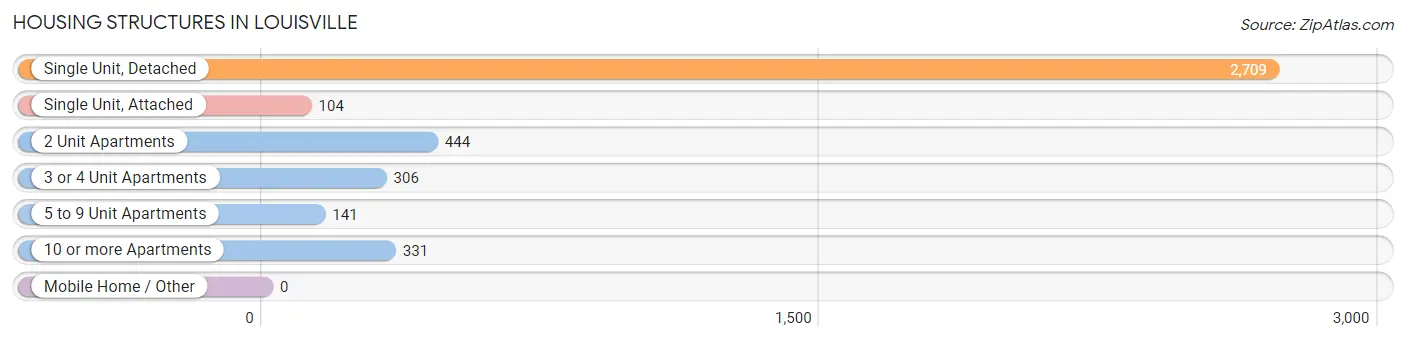
| Structure Type | # Housing Units | % Housing Units |
| Single Unit, Detached | 2,709 | 67.1% |
| Single Unit, Attached | 104 | 2.6% |
| 2 Unit Apartments | 444 | 11.0% |
| 3 or 4 Unit Apartments | 306 | 7.6% |
| 5 to 9 Unit Apartments | 141 | 3.5% |
| 10 or more Apartments | 331 | 8.2% |
| Mobile Home / Other | 0 | 0.0% |
| Total | 4,035 | 100.0% |
Housing Structures by Occupancy in Louisville
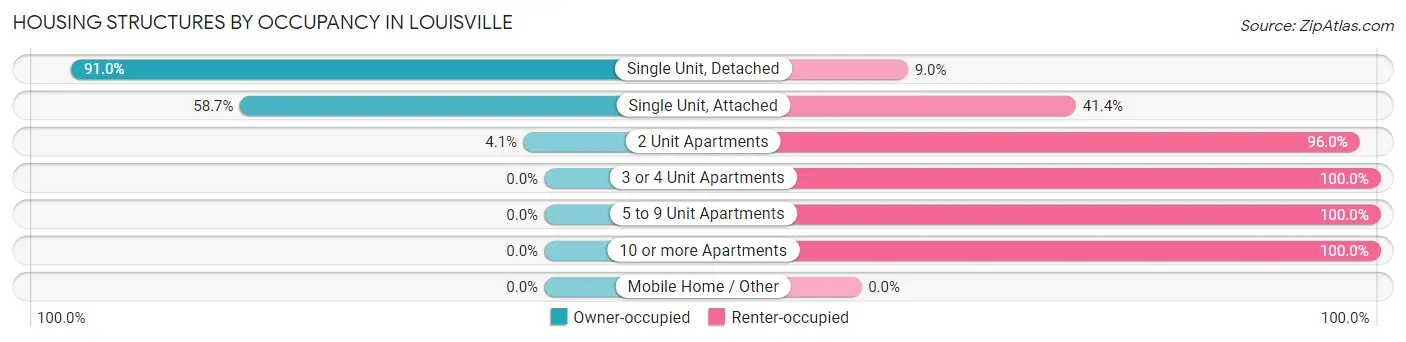
| Structure Type | Owner-occupied | Renter-occupied |
| Single Unit, Detached | 2,466 (91.0%) | 243 (9.0%) |
| Single Unit, Attached | 61 (58.7%) | 43 (41.3%) |
| 2 Unit Apartments | 18 (4.1%) | 426 (96.0%) |
| 3 or 4 Unit Apartments | 0 (0.0%) | 306 (100.0%) |
| 5 to 9 Unit Apartments | 0 (0.0%) | 141 (100.0%) |
| 10 or more Apartments | 0 (0.0%) | 331 (100.0%) |
| Mobile Home / Other | 0 (0.0%) | 0 (0.0%) |
| Total | 2,545 (63.1%) | 1,490 (36.9%) |
Housing Structures by Number of Rooms in Louisville
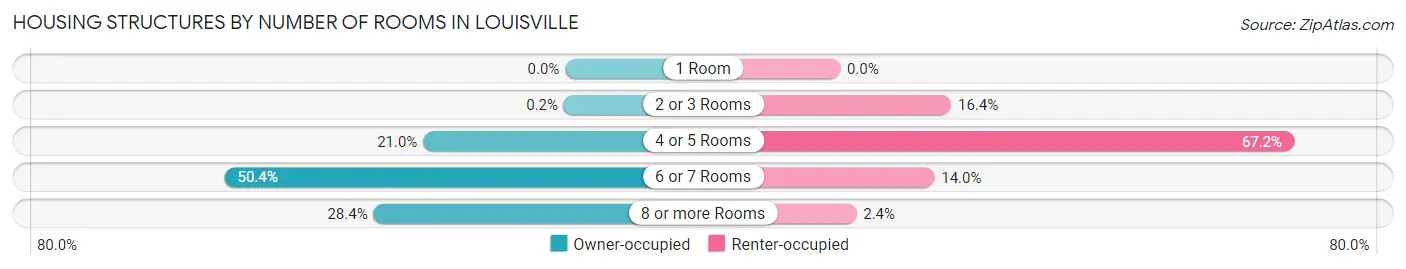
| Number of Rooms | Owner-occupied | Renter-occupied |
| 1 Room | 0 (0.0%) | 0 (0.0%) |
| 2 or 3 Rooms | 5 (0.2%) | 245 (16.4%) |
| 4 or 5 Rooms | 535 (21.0%) | 1,001 (67.2%) |
| 6 or 7 Rooms | 1,283 (50.4%) | 208 (14.0%) |
| 8 or more Rooms | 722 (28.4%) | 36 (2.4%) |
| Total | 2,545 (100.0%) | 1,490 (100.0%) |
Housing Structure by Heating Type in Louisville
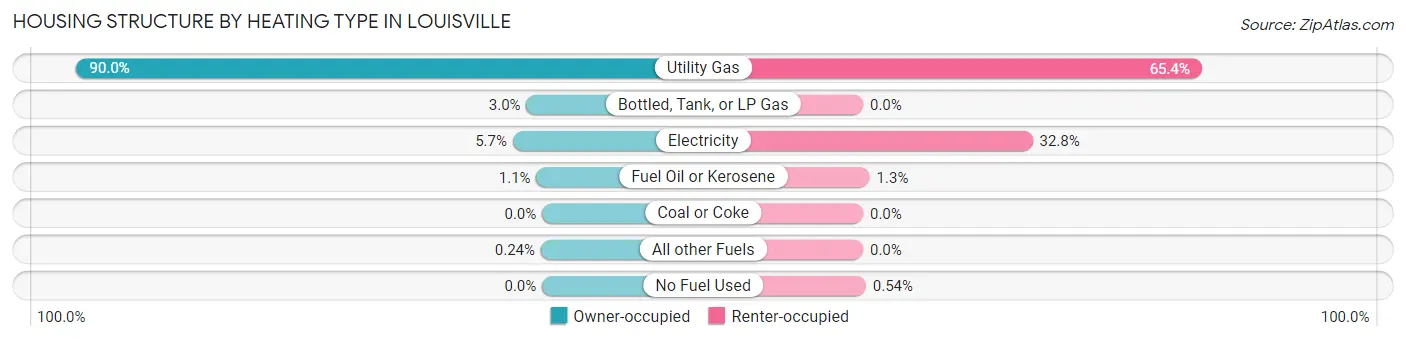
| Heating Type | Owner-occupied | Renter-occupied |
| Utility Gas | 2,290 (90.0%) | 975 (65.4%) |
| Bottled, Tank, or LP Gas | 77 (3.0%) | 0 (0.0%) |
| Electricity | 144 (5.7%) | 488 (32.8%) |
| Fuel Oil or Kerosene | 28 (1.1%) | 19 (1.3%) |
| Coal or Coke | 0 (0.0%) | 0 (0.0%) |
| All other Fuels | 6 (0.2%) | 0 (0.0%) |
| No Fuel Used | 0 (0.0%) | 8 (0.5%) |
| Total | 2,545 (100.0%) | 1,490 (100.0%) |
Household Vehicle Usage in Louisville
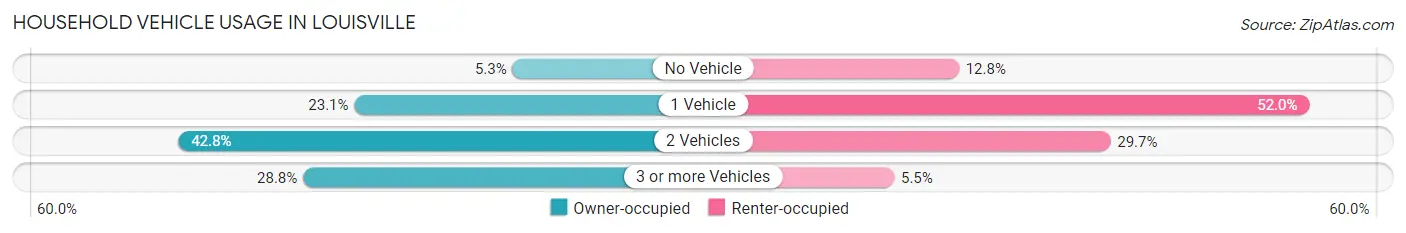
| Vehicles per Household | Owner-occupied | Renter-occupied |
| No Vehicle | 136 (5.3%) | 190 (12.8%) |
| 1 Vehicle | 587 (23.1%) | 775 (52.0%) |
| 2 Vehicles | 1,089 (42.8%) | 443 (29.7%) |
| 3 or more Vehicles | 733 (28.8%) | 82 (5.5%) |
| Total | 2,545 (100.0%) | 1,490 (100.0%) |
Real Estate & Mortgages in Louisville
Real Estate and Mortgage Overview in Louisville
| Characteristic | Without Mortgage | With Mortgage |
| Housing Units | 717 | 1,828 |
| Median Property Value | $157,500 | $192,600 |
| Median Household Income | $47,740 | $439 |
| Monthly Housing Costs | $450 | $0 |
| Real Estate Taxes | $2,159 | $45 |
Property Value by Mortgage Status in Louisville
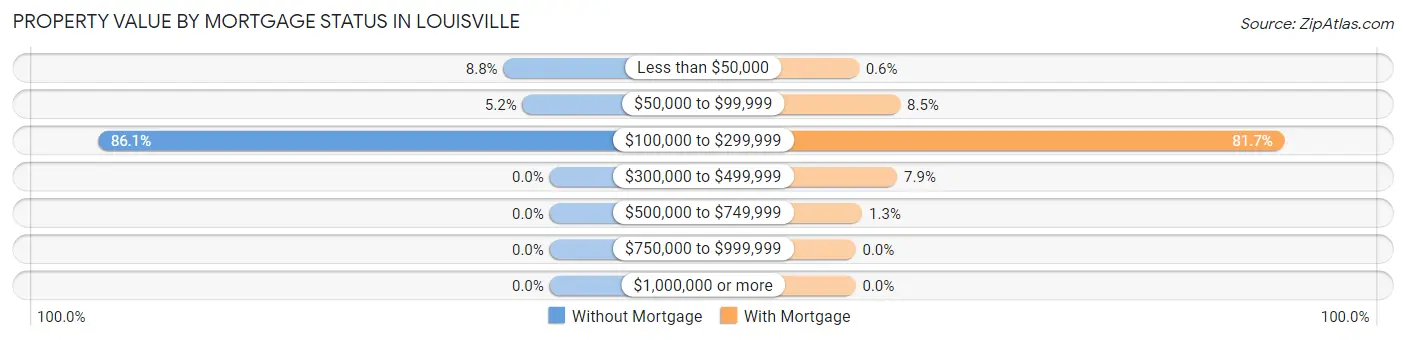
| Property Value | Without Mortgage | With Mortgage |
| Less than $50,000 | 63 (8.8%) | 11 (0.6%) |
| $50,000 to $99,999 | 37 (5.2%) | 155 (8.5%) |
| $100,000 to $299,999 | 617 (86.1%) | 1,494 (81.7%) |
| $300,000 to $499,999 | 0 (0.0%) | 145 (7.9%) |
| $500,000 to $749,999 | 0 (0.0%) | 23 (1.3%) |
| $750,000 to $999,999 | 0 (0.0%) | 0 (0.0%) |
| $1,000,000 or more | 0 (0.0%) | 0 (0.0%) |
| Total | 717 (100.0%) | 1,828 (100.0%) |
Household Income by Mortgage Status in Louisville
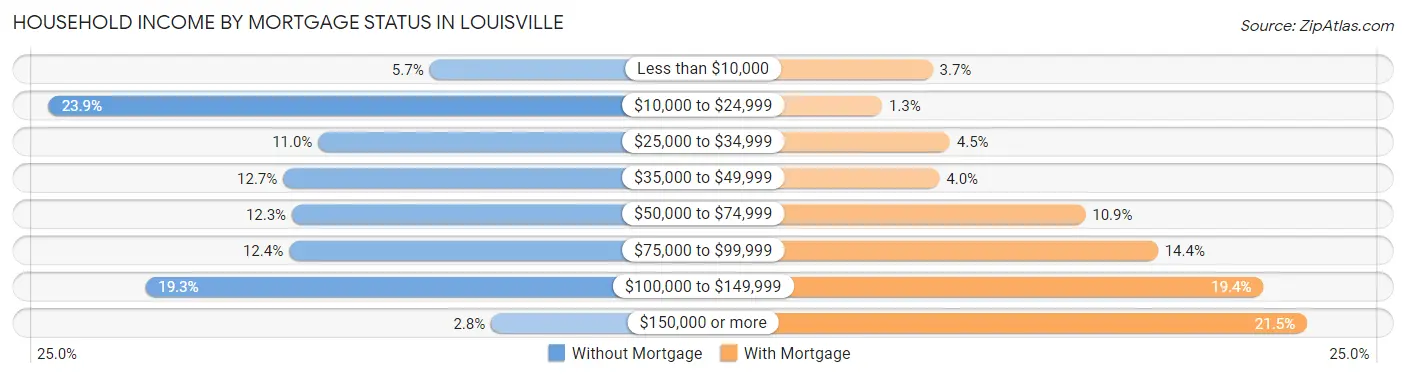
| Household Income | Without Mortgage | With Mortgage |
| Less than $10,000 | 41 (5.7%) | 67 (3.7%) |
| $10,000 to $24,999 | 171 (23.8%) | 23 (1.3%) |
| $25,000 to $34,999 | 79 (11.0%) | 82 (4.5%) |
| $35,000 to $49,999 | 91 (12.7%) | 73 (4.0%) |
| $50,000 to $74,999 | 88 (12.3%) | 200 (10.9%) |
| $75,000 to $99,999 | 89 (12.4%) | 263 (14.4%) |
| $100,000 to $149,999 | 138 (19.3%) | 355 (19.4%) |
| $150,000 or more | 20 (2.8%) | 393 (21.5%) |
| Total | 717 (100.0%) | 1,828 (100.0%) |
Property Value to Household Income Ratio in Louisville
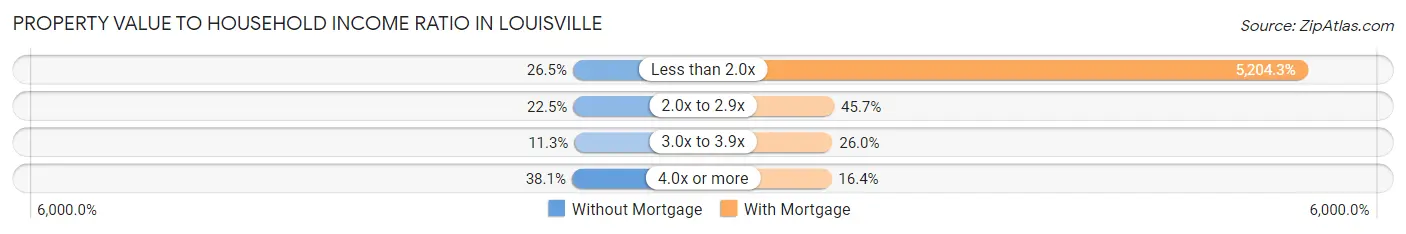
| Value-to-Income Ratio | Without Mortgage | With Mortgage |
| Less than 2.0x | 190 (26.5%) | 95,135 (5,204.3%) |
| 2.0x to 2.9x | 161 (22.5%) | 835 (45.7%) |
| 3.0x to 3.9x | 81 (11.3%) | 475 (26.0%) |
| 4.0x or more | 273 (38.1%) | 299 (16.4%) |
| Total | 717 (100.0%) | 1,828 (100.0%) |
Real Estate Taxes by Mortgage Status in Louisville
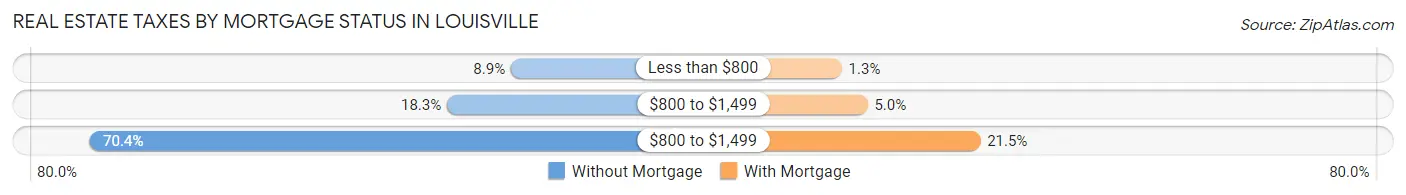
| Property Taxes | Without Mortgage | With Mortgage |
| Less than $800 | 64 (8.9%) | 23 (1.3%) |
| $800 to $1,499 | 131 (18.3%) | 92 (5.0%) |
| $800 to $1,499 | 505 (70.4%) | 393 (21.5%) |
| Total | 717 (100.0%) | 1,828 (100.0%) |
Health & Disability in Louisville
Health Insurance Coverage by Age in Louisville
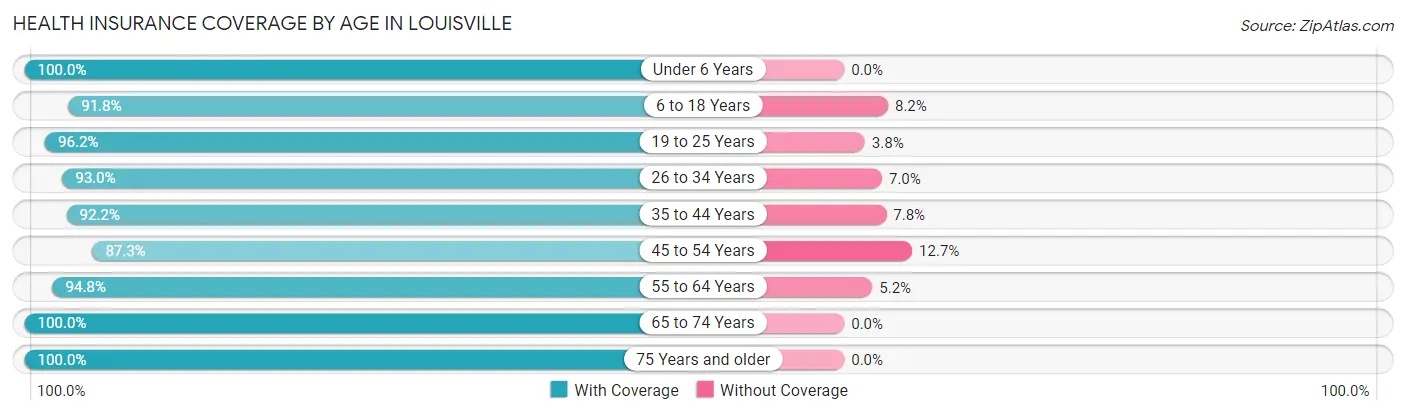
| Age Bracket | With Coverage | Without Coverage |
| Under 6 Years | 596 (100.0%) | 0 (0.0%) |
| 6 to 18 Years | 1,891 (91.8%) | 168 (8.2%) |
| 19 to 25 Years | 626 (96.2%) | 25 (3.8%) |
| 26 to 34 Years | 647 (93.0%) | 49 (7.0%) |
| 35 to 44 Years | 1,140 (92.2%) | 97 (7.8%) |
| 45 to 54 Years | 1,145 (87.3%) | 166 (12.7%) |
| 55 to 64 Years | 1,088 (94.8%) | 60 (5.2%) |
| 65 to 74 Years | 797 (100.0%) | 0 (0.0%) |
| 75 Years and older | 887 (100.0%) | 0 (0.0%) |
| Total | 8,817 (94.0%) | 565 (6.0%) |
Health Insurance Coverage by Citizenship Status in Louisville
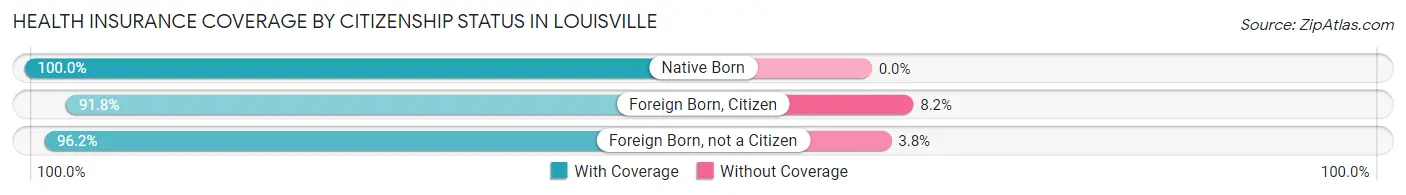
| Citizenship Status | With Coverage | Without Coverage |
| Native Born | 596 (100.0%) | 0 (0.0%) |
| Foreign Born, Citizen | 1,891 (91.8%) | 168 (8.2%) |
| Foreign Born, not a Citizen | 626 (96.2%) | 25 (3.8%) |
Health Insurance Coverage by Household Income in Louisville
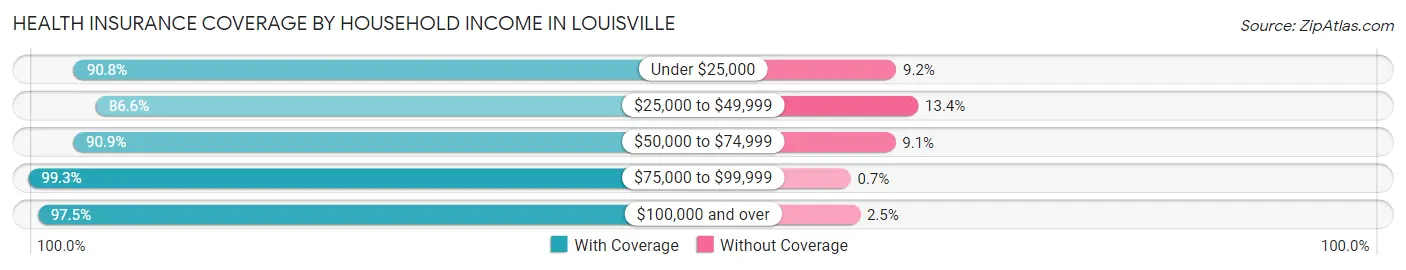
| Household Income | With Coverage | Without Coverage |
| Under $25,000 | 875 (90.8%) | 89 (9.2%) |
| $25,000 to $49,999 | 1,505 (86.6%) | 232 (13.4%) |
| $50,000 to $74,999 | 1,510 (90.9%) | 151 (9.1%) |
| $75,000 to $99,999 | 1,712 (99.3%) | 12 (0.7%) |
| $100,000 and over | 3,200 (97.5%) | 81 (2.5%) |
Public vs Private Health Insurance Coverage by Age in Louisville
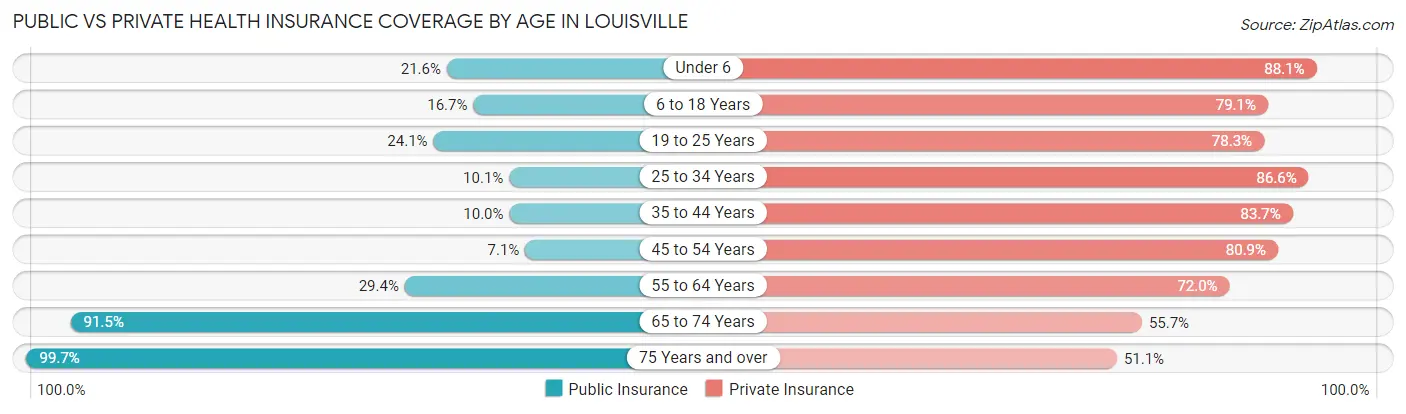
| Age Bracket | Public Insurance | Private Insurance |
| Under 6 | 129 (21.6%) | 525 (88.1%) |
| 6 to 18 Years | 344 (16.7%) | 1,628 (79.1%) |
| 19 to 25 Years | 157 (24.1%) | 510 (78.3%) |
| 25 to 34 Years | 70 (10.1%) | 603 (86.6%) |
| 35 to 44 Years | 124 (10.0%) | 1,035 (83.7%) |
| 45 to 54 Years | 93 (7.1%) | 1,061 (80.9%) |
| 55 to 64 Years | 338 (29.4%) | 826 (72.0%) |
| 65 to 74 Years | 729 (91.5%) | 444 (55.7%) |
| 75 Years and over | 884 (99.7%) | 453 (51.1%) |
| Total | 2,868 (30.6%) | 7,085 (75.5%) |
Disability Status by Sex by Age in Louisville
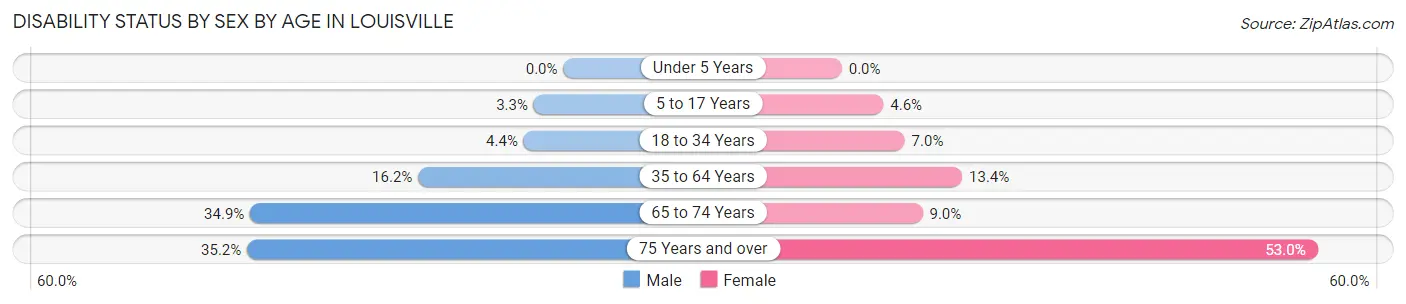
| Age Bracket | Male | Female |
| Under 5 Years | 0 (0.0%) | 0 (0.0%) |
| 5 to 17 Years | 37 (3.3%) | 41 (4.6%) |
| 18 to 34 Years | 35 (4.4%) | 55 (7.0%) |
| 35 to 64 Years | 290 (16.2%) | 255 (13.4%) |
| 65 to 74 Years | 150 (34.9%) | 33 (9.0%) |
| 75 Years and over | 87 (35.2%) | 339 (53.0%) |
Disability Class by Sex by Age in Louisville
Disability Class: Hearing Difficulty
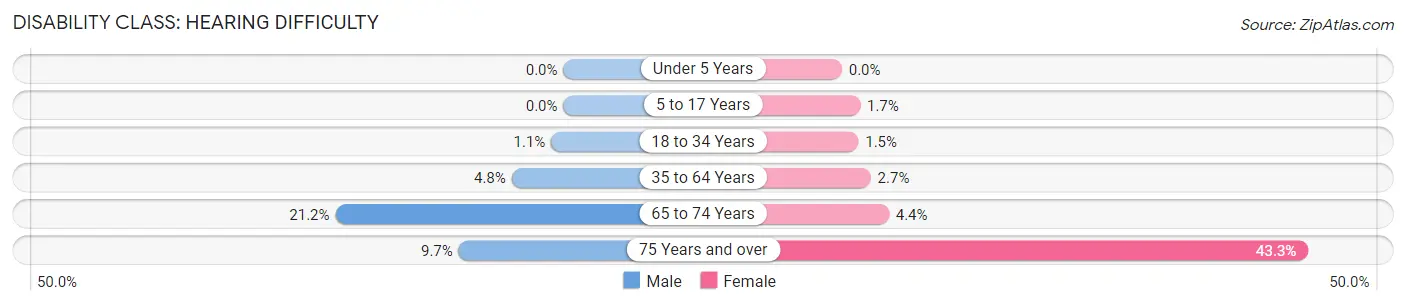
| Age Bracket | Male | Female |
| Under 5 Years | 0 (0.0%) | 0 (0.0%) |
| 5 to 17 Years | 0 (0.0%) | 15 (1.7%) |
| 18 to 34 Years | 9 (1.1%) | 12 (1.5%) |
| 35 to 64 Years | 86 (4.8%) | 51 (2.7%) |
| 65 to 74 Years | 91 (21.2%) | 16 (4.4%) |
| 75 Years and over | 24 (9.7%) | 277 (43.3%) |
Disability Class: Vision Difficulty
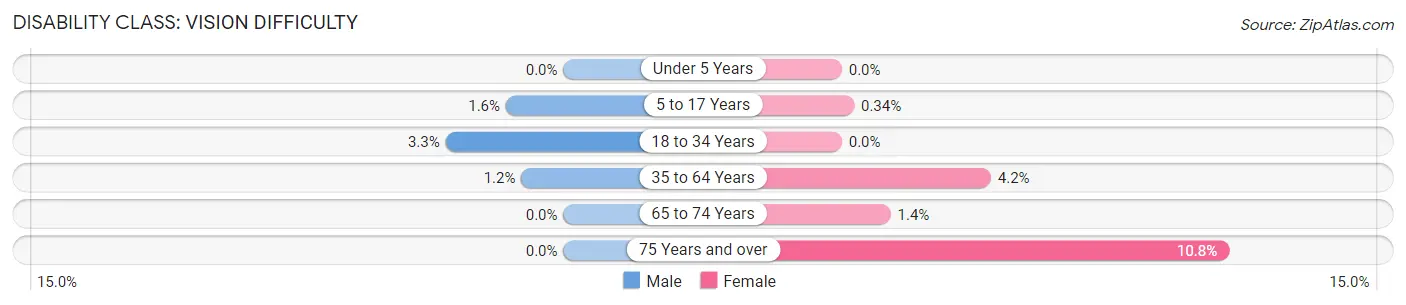
| Age Bracket | Male | Female |
| Under 5 Years | 0 (0.0%) | 0 (0.0%) |
| 5 to 17 Years | 18 (1.6%) | 3 (0.3%) |
| 18 to 34 Years | 26 (3.3%) | 0 (0.0%) |
| 35 to 64 Years | 21 (1.2%) | 79 (4.2%) |
| 65 to 74 Years | 0 (0.0%) | 5 (1.4%) |
| 75 Years and over | 0 (0.0%) | 69 (10.8%) |
Disability Class: Cognitive Difficulty
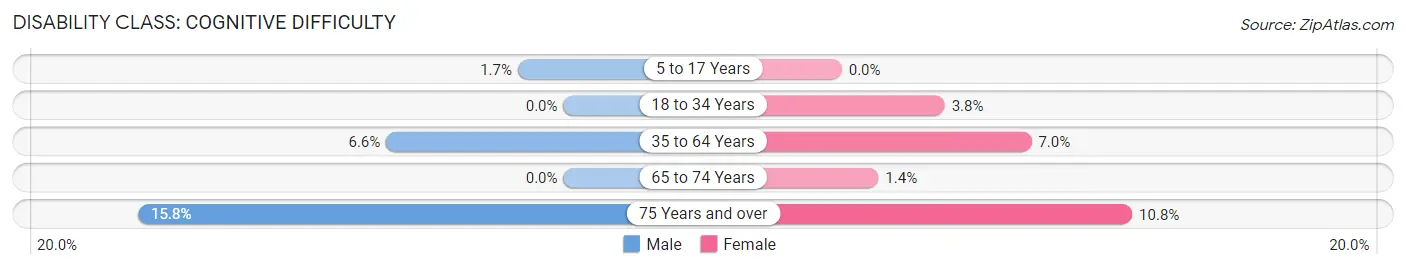
| Age Bracket | Male | Female |
| 5 to 17 Years | 19 (1.7%) | 0 (0.0%) |
| 18 to 34 Years | 0 (0.0%) | 30 (3.8%) |
| 35 to 64 Years | 118 (6.6%) | 134 (7.0%) |
| 65 to 74 Years | 0 (0.0%) | 5 (1.4%) |
| 75 Years and over | 39 (15.8%) | 69 (10.8%) |
Disability Class: Ambulatory Difficulty
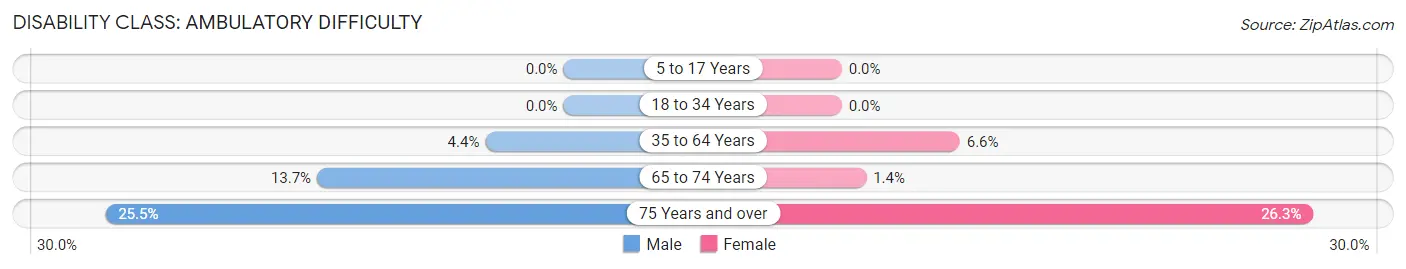
| Age Bracket | Male | Female |
| 5 to 17 Years | 0 (0.0%) | 0 (0.0%) |
| 18 to 34 Years | 0 (0.0%) | 0 (0.0%) |
| 35 to 64 Years | 78 (4.3%) | 125 (6.6%) |
| 65 to 74 Years | 59 (13.7%) | 5 (1.4%) |
| 75 Years and over | 63 (25.5%) | 168 (26.3%) |
Disability Class: Self-Care Difficulty
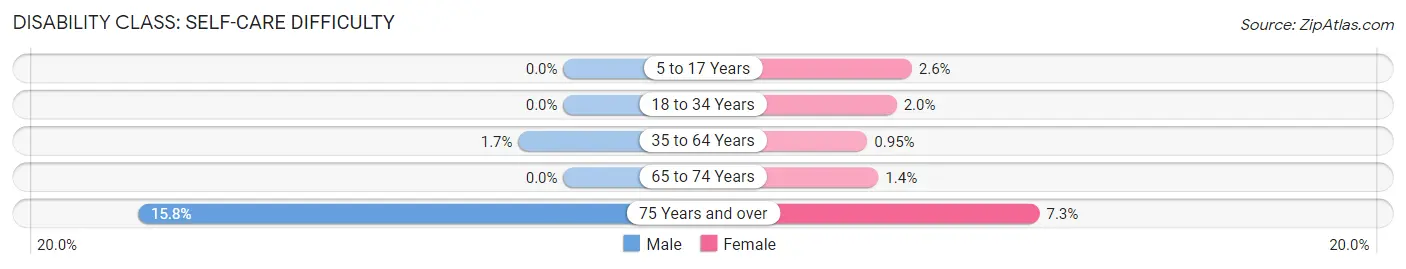
| Age Bracket | Male | Female |
| 5 to 17 Years | 0 (0.0%) | 23 (2.6%) |
| 18 to 34 Years | 0 (0.0%) | 16 (2.0%) |
| 35 to 64 Years | 30 (1.7%) | 18 (0.9%) |
| 65 to 74 Years | 0 (0.0%) | 5 (1.4%) |
| 75 Years and over | 39 (15.8%) | 47 (7.3%) |
Technology Access in Louisville
Computing Device Access in Louisville
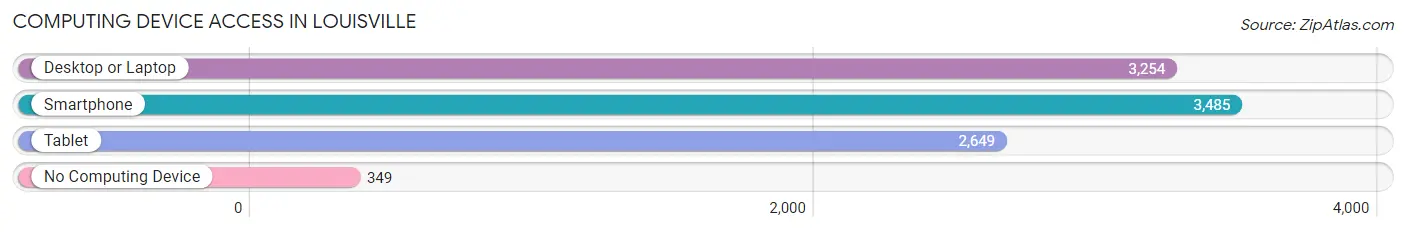
| Device Type | # Households | % Households |
| Desktop or Laptop | 3,254 | 80.6% |
| Smartphone | 3,485 | 86.4% |
| Tablet | 2,649 | 65.6% |
| No Computing Device | 349 | 8.6% |
| Total | 4,035 | 100.0% |
Internet Access in Louisville
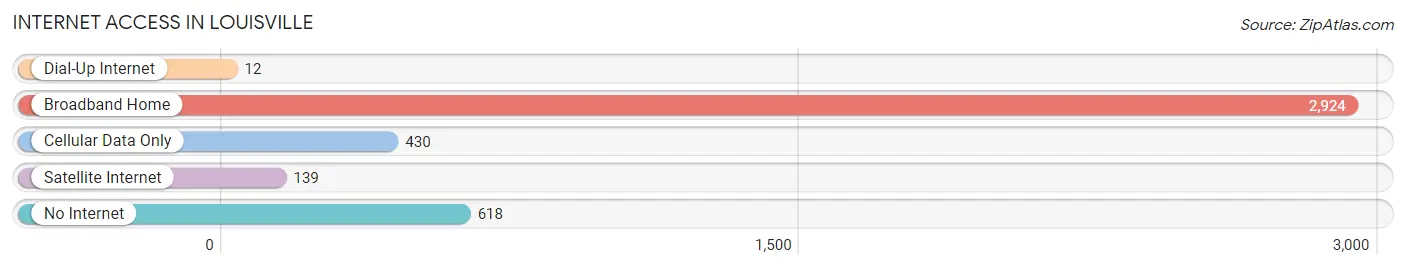
| Internet Type | # Households | % Households |
| Dial-Up Internet | 12 | 0.3% |
| Broadband Home | 2,924 | 72.5% |
| Cellular Data Only | 430 | 10.7% |
| Satellite Internet | 139 | 3.4% |
| No Internet | 618 | 15.3% |
| Total | 4,035 | 100.0% |
Louisville Summary
Louisville is a city located in Stark County, Ohio, United States. The population was 9,186 at the 2010 census. It is part of the Canton-Massillon, OH Metropolitan Statistical Area. Louisville is located in the northeastern part of Ohio, approximately 25 miles south of Akron and 40 miles south of Cleveland.
History
The area that is now Louisville was first settled in 1811 by a group of settlers from Pennsylvania. The town was originally known as "New Philadelphia" and was later renamed "Louisville" in 1814 in honor of King Louis XVI of France. The town was officially incorporated in 1827.
Louisville was an important stop on the Underground Railroad, with many of the town's residents helping to hide and transport escaped slaves. The town was also home to several abolitionist societies, including the Stark County Anti-Slavery Society.
In the late 19th century, Louisville was a major center for the production of glass and pottery. The town was home to several glass factories, including the Louisville Glass Company, which was founded in 1876. The town was also home to several pottery factories, including the Louisville Pottery Company, which was founded in 1883.
Geography
Louisville is located at 40°51'25" North, 81°25'17" West (40.856944, -81.421389). According to the United States Census Bureau, the city has a total area of 4.2 square miles, all of it land.
Economy
The economy of Louisville is largely based on manufacturing and agriculture. The city is home to several manufacturing companies, including the Louisville Glass Company, the Louisville Pottery Company, and the Louisville Steel Company. The city is also home to several agricultural businesses, including the Louisville Dairy Farm and the Louisville Fruit Farm.
Demographics
As of the census of 2010, there were 9,186 people, 3,717 households, and 2,521 families residing in the city. The population density was 2,190.2 people per square mile (845.2/km2). There were 3,945 housing units at an average density of 945.2 per square mile (364.7/km2). The racial makeup of the city was 97.2% White, 0.7% African American, 0.2% Native American, 0.4% Asian, 0.2% from other races, and 1.3% from two or more races. Hispanic or Latino of any race were 1.2% of the population.
There were 3,717 households, out of which 30.2% had children under the age of 18 living with them, 51.2% were married couples living together, 12.2% had a female householder with no husband present, and 32.2% were non-families. 28.2% of all households were made up of individuals, and 13.2% had someone living alone who was 65 years of age or older. The average household size was 2.45 and the average family size was 2.99.
In the city, the population was spread out, with 24.2% under the age of 18, 8.2% from 18 to 24, 27.2% from 25 to 44, 24.2% from 45 to 64, and 16.2% who were 65 years of age or older. The median age was 38 years. For every 100 females, there were 91.2 males. For every 100 females age 18 and over, there were 87.2 males.
The median income for a household in the city was $41,944, and the median income for a family was $50,944. Males had a median income of $37,944 versus $25,944 for females. The per capita income for the city was $20,944. About 6.2% of families and 8.2% of the population were below the poverty line, including 11.2% of those under age 18 and 6.2% of those age 65 or over.
Common Questions
What is Per Capita Income in Louisville?
Per Capita income in Louisville is $34,758.
What is the Median Family Income in Louisville?
Median Family Income in Louisville is $85,000.
What is the Median Household income in Louisville?
Median Household Income in Louisville is $62,287.
What is Income or Wage Gap in Louisville?
Income or Wage Gap in Louisville is 22.7%.
Women in Louisville earn 77.3 cents for every dollar earned by a man.
What is Inequality or Gini Index in Louisville?
Inequality or Gini Index in Louisville is 0.44.
What is the Total Population of Louisville?
Total Population of Louisville is 9,500.
What is the Total Male Population of Louisville?
Total Male Population of Louisville is 4,636.
What is the Total Female Population of Louisville?
Total Female Population of Louisville is 4,864.
What is the Ratio of Males per 100 Females in Louisville?
There are 95.31 Males per 100 Females in Louisville.
What is the Ratio of Females per 100 Males in Louisville?
There are 104.92 Females per 100 Males in Louisville.
What is the Median Population Age in Louisville?
Median Population Age in Louisville is 41.2 Years.
What is the Average Family Size in Louisville
Average Family Size in Louisville is 3.0 People.
What is the Average Household Size in Louisville
Average Household Size in Louisville is 2.3 People.
How Large is the Labor Force in Louisville?
There are 4,600 People in the Labor Forcein in Louisville.
What is the Percentage of People in the Labor Force in Louisville?
61.9% of People are in the Labor Force in Louisville.
What is the Unemployment Rate in Louisville?
Unemployment Rate in Louisville is 1.7%.