Clinton, NY Map & Demographics
Clinton Map
Clinton Overview
$48,085
PER CAPITA INCOME
$106,131
AVG FAMILY INCOME
$84,583
AVG HOUSEHOLD INCOME
34.7%
WAGE / INCOME GAP [ % ]
65.3¢/ $1
WAGE / INCOME GAP [ $ ]
0.39
INEQUALITY / GINI INDEX
1,928
TOTAL POPULATION
960
MALE POPULATION
968
FEMALE POPULATION
99.17
MALES / 100 FEMALES
100.83
FEMALES / 100 MALES
44.7
MEDIAN AGE
2.8
AVG FAMILY SIZE
2.3
AVG HOUSEHOLD SIZE
1,082
LABOR FORCE [ PEOPLE ]
66.0%
PERCENT IN LABOR FORCE
2.4%
UNEMPLOYMENT RATE
Clinton Zip Codes
Clinton Area Codes
Income in Clinton
Income Overview in Clinton
Per Capita Income in Clinton is $48,085, while median incomes of families and households are $106,131 and $84,583 respectively.
| Characteristic | Number | Measure |
| Per Capita Income | 1,928 | $48,085 |
| Median Family Income | 533 | $106,131 |
| Mean Family Income | 533 | $134,448 |
| Median Household Income | 831 | $84,583 |
| Mean Household Income | 831 | $111,028 |
| Income Deficit | 533 | $0 |
| Wage / Income Gap (%) | 1,928 | 34.67% |
| Wage / Income Gap ($) | 1,928 | 65.33¢ per $1 |
| Gini / Inequality Index | 1,928 | 0.39 |
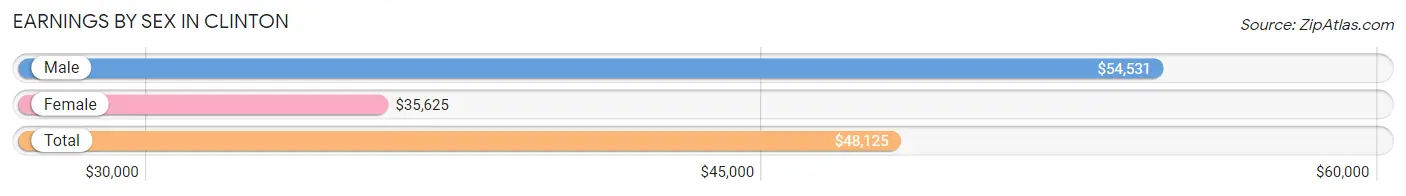
Earnings by Sex in Clinton
Average Earnings in Clinton are $48,125, $54,531 for men and $35,625 for women, a difference of 34.7%.
| Sex | Number | Average Earnings |
| Male | 626 (54.9%) | $54,531 |
| Female | 515 (45.1%) | $35,625 |
| Total | 1,141 (100.0%) | $48,125 |
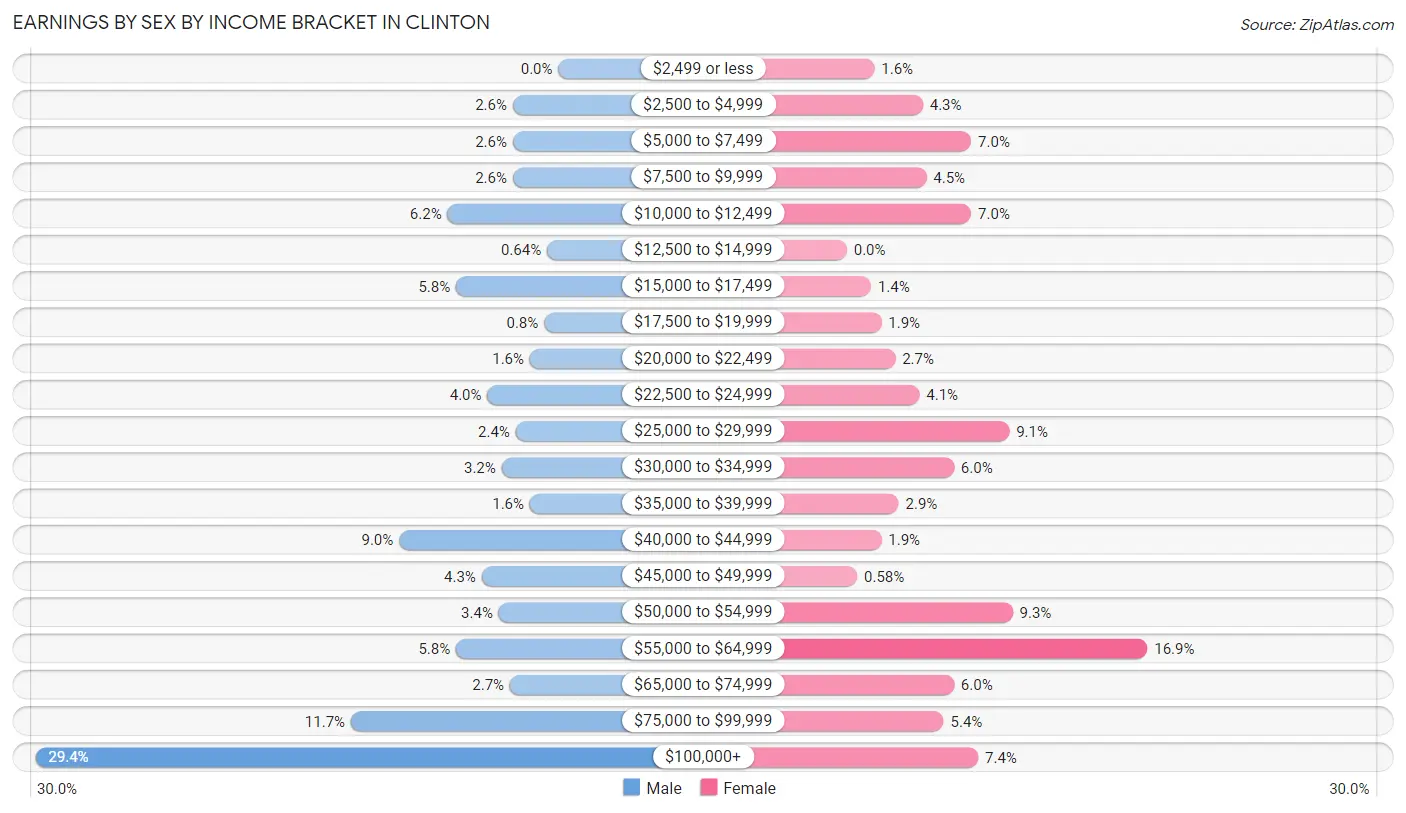
Earnings by Sex by Income Bracket in Clinton
The most common earnings brackets in Clinton are $100,000+ for men (184 | 29.4%) and $55,000 to $64,999 for women (87 | 16.9%).
| Income | Male | Female |
| $2,499 or less | 0 (0.0%) | 8 (1.5%) |
| $2,500 to $4,999 | 16 (2.6%) | 22 (4.3%) |
| $5,000 to $7,499 | 16 (2.6%) | 36 (7.0%) |
| $7,500 to $9,999 | 16 (2.6%) | 23 (4.5%) |
| $10,000 to $12,499 | 39 (6.2%) | 36 (7.0%) |
| $12,500 to $14,999 | 4 (0.6%) | 0 (0.0%) |
| $15,000 to $17,499 | 36 (5.8%) | 7 (1.4%) |
| $17,500 to $19,999 | 5 (0.8%) | 10 (1.9%) |
| $20,000 to $22,499 | 10 (1.6%) | 14 (2.7%) |
| $22,500 to $24,999 | 25 (4.0%) | 21 (4.1%) |
| $25,000 to $29,999 | 15 (2.4%) | 47 (9.1%) |
| $30,000 to $34,999 | 20 (3.2%) | 31 (6.0%) |
| $35,000 to $39,999 | 10 (1.6%) | 15 (2.9%) |
| $40,000 to $44,999 | 56 (8.9%) | 10 (1.9%) |
| $45,000 to $49,999 | 27 (4.3%) | 3 (0.6%) |
| $50,000 to $54,999 | 21 (3.4%) | 48 (9.3%) |
| $55,000 to $64,999 | 36 (5.8%) | 87 (16.9%) |
| $65,000 to $74,999 | 17 (2.7%) | 31 (6.0%) |
| $75,000 to $99,999 | 73 (11.7%) | 28 (5.4%) |
| $100,000+ | 184 (29.4%) | 38 (7.4%) |
| Total | 626 (100.0%) | 515 (100.0%) |
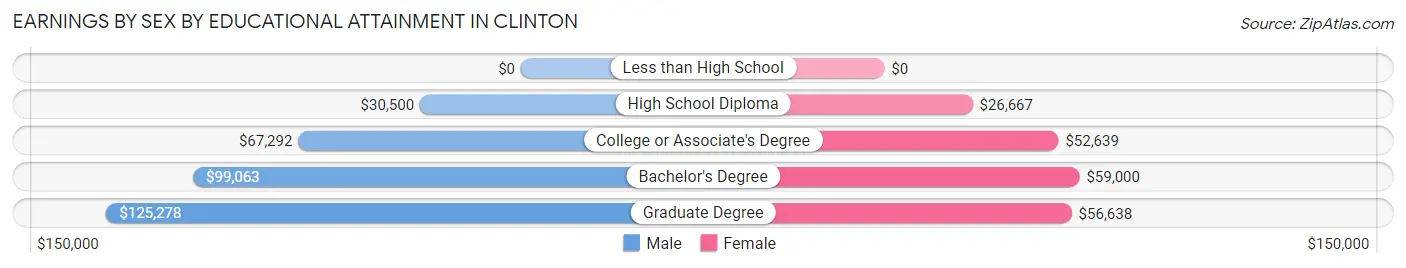
Earnings by Sex by Educational Attainment in Clinton
Average earnings in Clinton are $66,364 for men and $51,100 for women, a difference of 23.0%. Men with an educational attainment of graduate degree enjoy the highest average annual earnings of $125,278, while those with high school diploma education earn the least with $30,500. Women with an educational attainment of bachelor's degree earn the most with the average annual earnings of $59,000, while those with high school diploma education have the smallest earnings of $26,667.
| Educational Attainment | Male Income | Female Income |
| Less than High School | - | - |
| High School Diploma | $30,500 | $26,667 |
| College or Associate's Degree | $67,292 | $52,639 |
| Bachelor's Degree | $99,063 | $59,000 |
| Graduate Degree | $125,278 | $56,638 |
| Total | $66,364 | $51,100 |
Family Income in Clinton
Family Income Brackets in Clinton
According to the Clinton family income data, there are 127 families falling into the $200,000+ income range, which is the most common income bracket and makes up 23.8% of all families.
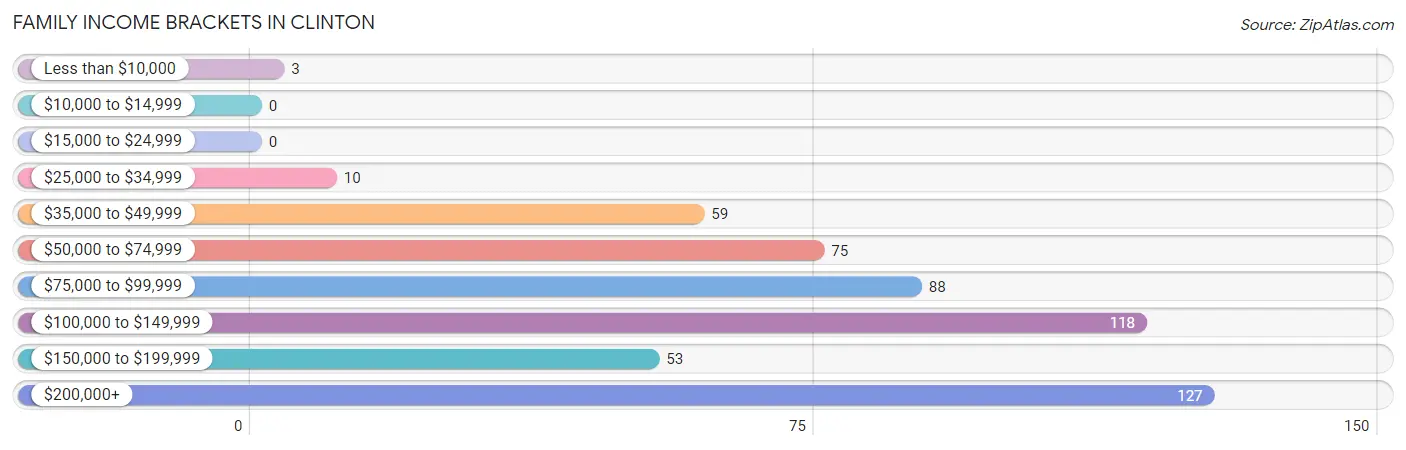
| Income Bracket | # Families | % Families |
| Less than $10,000 | 3 | 0.6% |
| $10,000 to $14,999 | 0 | 0.0% |
| $15,000 to $24,999 | 0 | 0.0% |
| $25,000 to $34,999 | 10 | 1.9% |
| $35,000 to $49,999 | 59 | 11.1% |
| $50,000 to $74,999 | 75 | 14.1% |
| $75,000 to $99,999 | 88 | 16.5% |
| $100,000 to $149,999 | 118 | 22.1% |
| $150,000 to $199,999 | 53 | 9.9% |
| $200,000+ | 127 | 23.8% |
Family Income by Famaliy Size in Clinton
5-person families (25 | 4.7%) account for the highest median family income in Clinton with $209,531 per family, while 2-person families (312 | 58.5%) have the highest median income of $48,750 per family member.
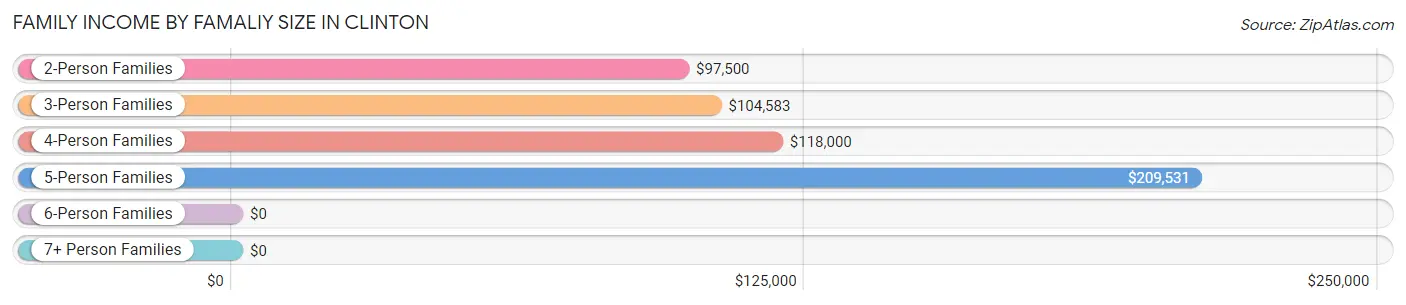
| Income Bracket | # Families | Median Income |
| 2-Person Families | 312 (58.5%) | $97,500 |
| 3-Person Families | 96 (18.0%) | $104,583 |
| 4-Person Families | 74 (13.9%) | $118,000 |
| 5-Person Families | 25 (4.7%) | $209,531 |
| 6-Person Families | 26 (4.9%) | $0 |
| 7+ Person Families | 0 (0.0%) | $0 |
| Total | 533 (100.0%) | $106,131 |
Family Income by Number of Earners in Clinton
The median family income in Clinton is $106,131, with families comprising 3+ earners (50) having the highest median family income of $219,079, while families with 1 earner (183) have the lowest median family income of $84,625, accounting for 9.4% and 34.3% of families, respectively.
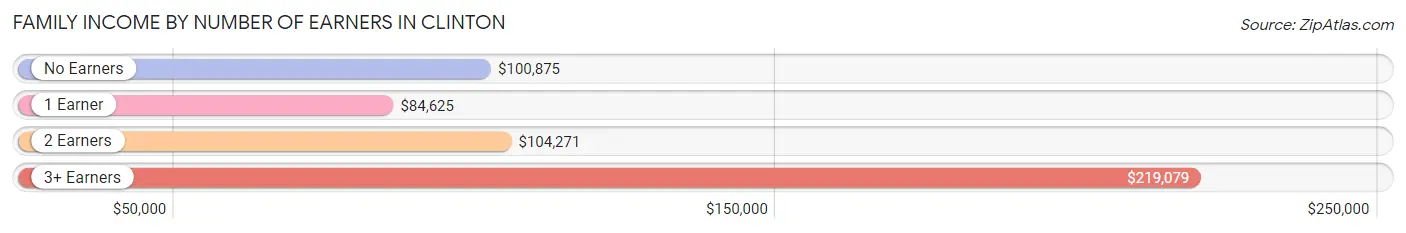
| Number of Earners | # Families | Median Income |
| No Earners | 75 (14.1%) | $100,875 |
| 1 Earner | 183 (34.3%) | $84,625 |
| 2 Earners | 225 (42.2%) | $104,271 |
| 3+ Earners | 50 (9.4%) | $219,079 |
| Total | 533 (100.0%) | $106,131 |
Household Income in Clinton
Household Income Brackets in Clinton
With 163 households falling in the category, the $50,000 to $74,999 income range is the most frequent in Clinton, accounting for 19.6% of all households. In contrast, only 6 households (0.7%) fall into the $10,000 to $14,999 income bracket, making it the least populous group.
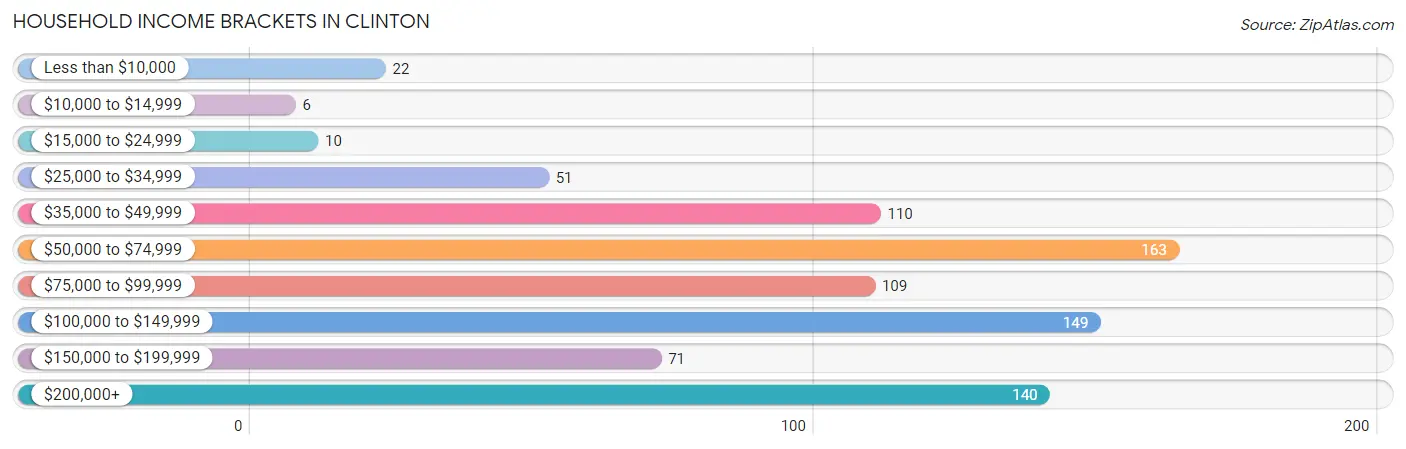
| Income Bracket | # Households | % Households |
| Less than $10,000 | 22 | 2.6% |
| $10,000 to $14,999 | 6 | 0.7% |
| $15,000 to $24,999 | 10 | 1.2% |
| $25,000 to $34,999 | 51 | 6.1% |
| $35,000 to $49,999 | 110 | 13.2% |
| $50,000 to $74,999 | 163 | 19.6% |
| $75,000 to $99,999 | 109 | 13.1% |
| $100,000 to $149,999 | 149 | 17.9% |
| $150,000 to $199,999 | 71 | 8.5% |
| $200,000+ | 140 | 16.8% |
Household Income by Householder Age in Clinton
The median household income in Clinton is $84,583, with the highest median household income of $107,143 found in the 45 to 64 years age bracket for the primary householder. A total of 326 households (39.2%) fall into this category. Meanwhile, the 15 to 24 years age bracket for the primary householder has the lowest median household income of $52,404, with 47 households (5.7%) in this group.
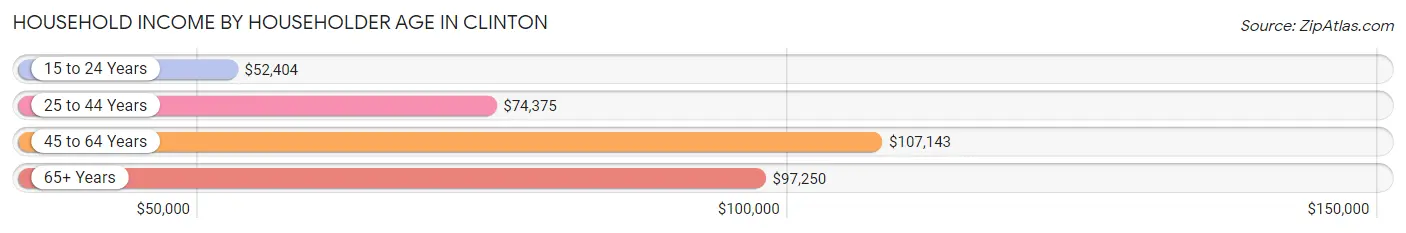
| Income Bracket | # Households | Median Income |
| 15 to 24 Years | 47 (5.7%) | $52,404 |
| 25 to 44 Years | 247 (29.7%) | $74,375 |
| 45 to 64 Years | 326 (39.2%) | $107,143 |
| 65+ Years | 211 (25.4%) | $97,250 |
| Total | 831 (100.0%) | $84,583 |
Poverty in Clinton
Income Below Poverty by Sex and Age in Clinton
With 3.0% poverty level for males and 7.7% for females among the residents of Clinton, 18 to 24 year old males and 18 to 24 year old females are the most vulnerable to poverty, with 12 males (12.2%) and 17 females (23.9%) in their respective age groups living below the poverty level.
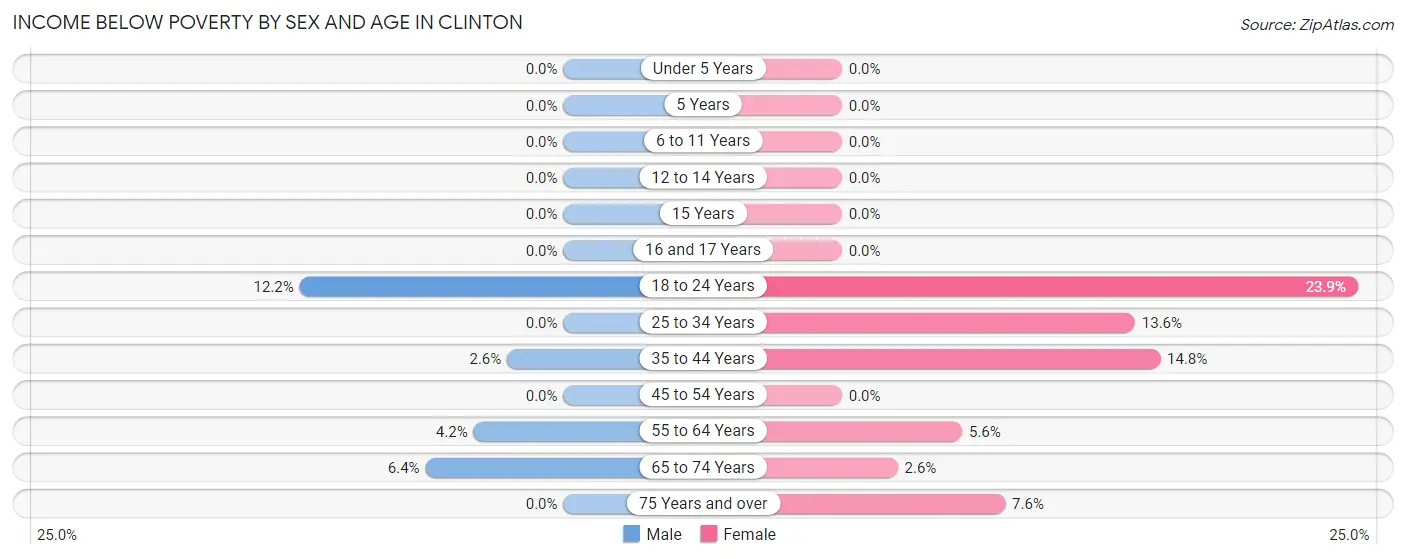
| Age Bracket | Male | Female |
| Under 5 Years | 0 (0.0%) | 0 (0.0%) |
| 5 Years | 0 (0.0%) | 0 (0.0%) |
| 6 to 11 Years | 0 (0.0%) | 0 (0.0%) |
| 12 to 14 Years | 0 (0.0%) | 0 (0.0%) |
| 15 Years | 0 (0.0%) | 0 (0.0%) |
| 16 and 17 Years | 0 (0.0%) | 0 (0.0%) |
| 18 to 24 Years | 12 (12.2%) | 17 (23.9%) |
| 25 to 34 Years | 0 (0.0%) | 17 (13.6%) |
| 35 to 44 Years | 3 (2.6%) | 22 (14.8%) |
| 45 to 54 Years | 0 (0.0%) | 0 (0.0%) |
| 55 to 64 Years | 6 (4.2%) | 11 (5.6%) |
| 65 to 74 Years | 8 (6.4%) | 3 (2.6%) |
| 75 Years and over | 0 (0.0%) | 5 (7.6%) |
| Total | 29 (3.0%) | 75 (7.7%) |
Income Above Poverty by Sex and Age in Clinton
According to the poverty statistics in Clinton, males aged under 5 years and females aged under 5 years are the age groups that are most secure financially, with 100.0% of males and 100.0% of females in these age groups living above the poverty line.
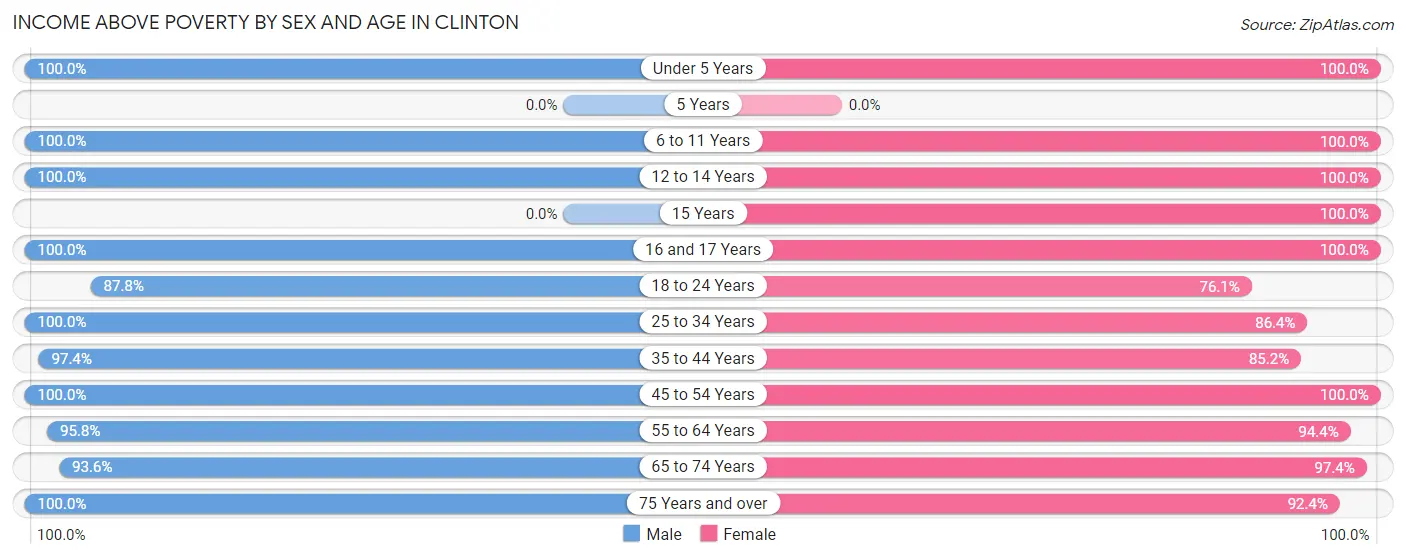
| Age Bracket | Male | Female |
| Under 5 Years | 34 (100.0%) | 15 (100.0%) |
| 5 Years | 0 (0.0%) | 0 (0.0%) |
| 6 to 11 Years | 90 (100.0%) | 53 (100.0%) |
| 12 to 14 Years | 53 (100.0%) | 30 (100.0%) |
| 15 Years | 0 (0.0%) | 14 (100.0%) |
| 16 and 17 Years | 18 (100.0%) | 28 (100.0%) |
| 18 to 24 Years | 86 (87.8%) | 54 (76.1%) |
| 25 to 34 Years | 92 (100.0%) | 108 (86.4%) |
| 35 to 44 Years | 112 (97.4%) | 127 (85.2%) |
| 45 to 54 Years | 138 (100.0%) | 104 (100.0%) |
| 55 to 64 Years | 138 (95.8%) | 186 (94.4%) |
| 65 to 74 Years | 117 (93.6%) | 113 (97.4%) |
| 75 Years and over | 53 (100.0%) | 61 (92.4%) |
| Total | 931 (97.0%) | 893 (92.2%) |
Income Below Poverty Among Married-Couple Families in Clinton
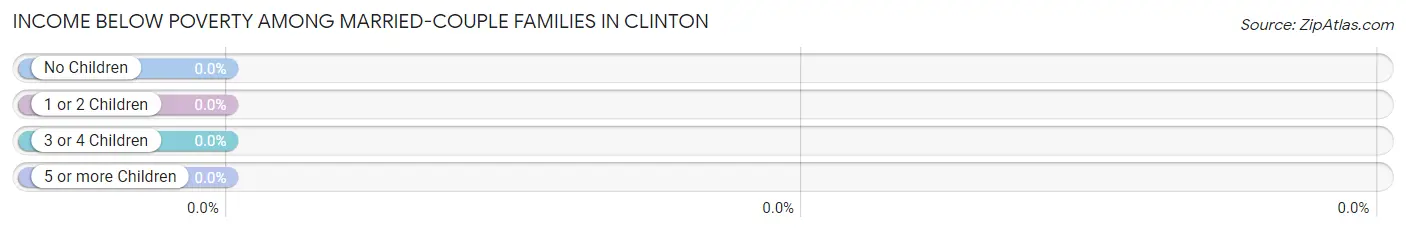
| Children | Above Poverty | Below Poverty |
| No Children | 350 (100.0%) | 0 (0.0%) |
| 1 or 2 Children | 126 (100.0%) | 0 (0.0%) |
| 3 or 4 Children | 21 (100.0%) | 0 (0.0%) |
| 5 or more Children | 0 (0.0%) | 0 (0.0%) |
| Total | 497 (100.0%) | 0 (0.0%) |
Income Below Poverty Among Single-Parent Households in Clinton
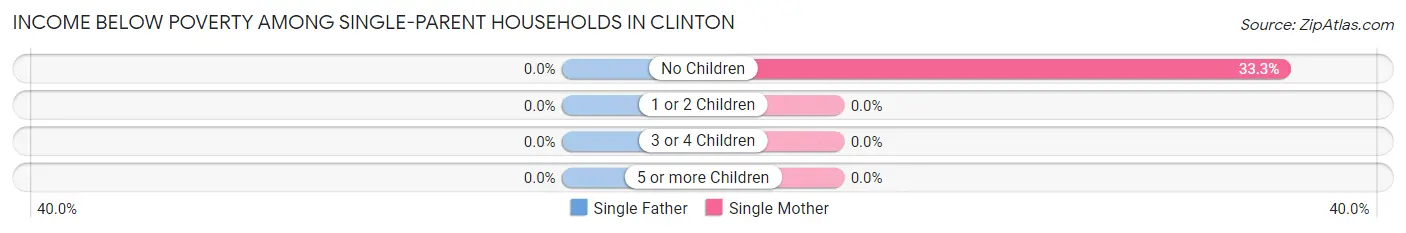
| Children | Single Father | Single Mother |
| No Children | 0 (0.0%) | 3 (33.3%) |
| 1 or 2 Children | 0 (0.0%) | 0 (0.0%) |
| 3 or 4 Children | 0 (0.0%) | 0 (0.0%) |
| 5 or more Children | 0 (0.0%) | 0 (0.0%) |
| Total | 0 (0.0%) | 3 (12.5%) |
Income Below Poverty Among Married-Couple vs Single-Parent Households in Clinton
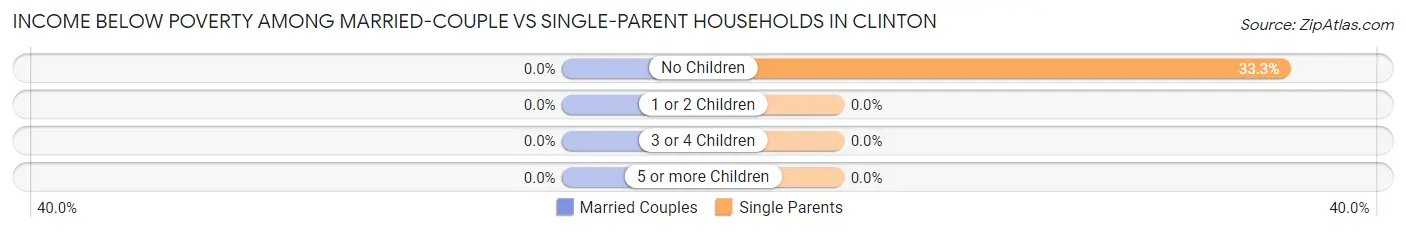
| Children | Married-Couple Families | Single-Parent Households |
| No Children | 0 (0.0%) | 3 (33.3%) |
| 1 or 2 Children | 0 (0.0%) | 0 (0.0%) |
| 3 or 4 Children | 0 (0.0%) | 0 (0.0%) |
| 5 or more Children | 0 (0.0%) | 0 (0.0%) |
| Total | 0 (0.0%) | 3 (8.3%) |
Race in Clinton
The most populous races in Clinton are White / Caucasian (1,775 | 92.1%), Hispanic or Latino (135 | 7.0%), and Two or more Races (104 | 5.4%).
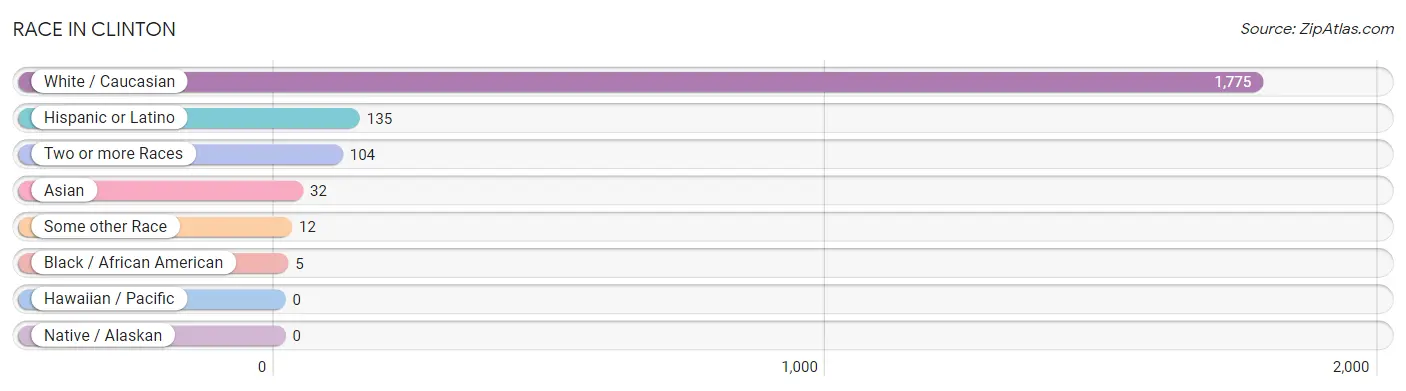
| Race | # Population | % Population |
| Asian | 32 | 1.7% |
| Black / African American | 5 | 0.3% |
| Hawaiian / Pacific | 0 | 0.0% |
| Hispanic or Latino | 135 | 7.0% |
| Native / Alaskan | 0 | 0.0% |
| White / Caucasian | 1,775 | 92.1% |
| Two or more Races | 104 | 5.4% |
| Some other Race | 12 | 0.6% |
| Total | 1,928 | 100.0% |
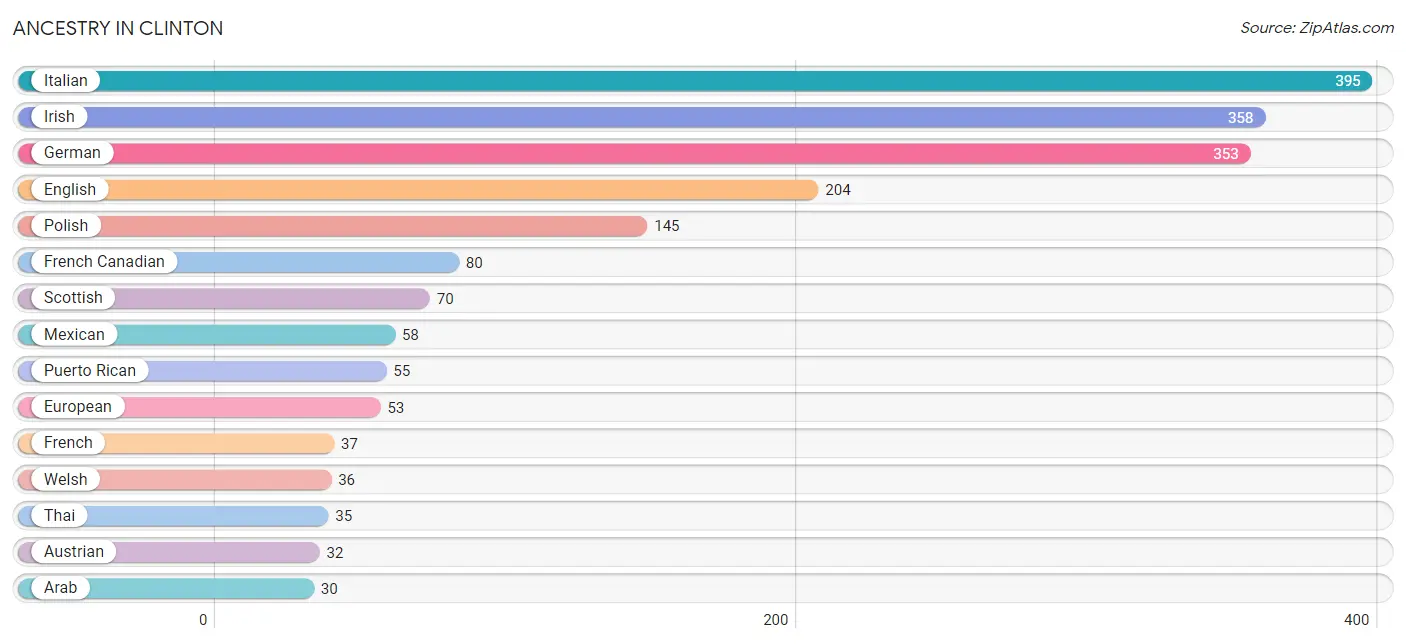
Ancestry in Clinton
The most populous ancestries reported in Clinton are Italian (395 | 20.5%), Irish (358 | 18.6%), German (353 | 18.3%), English (204 | 10.6%), and Polish (145 | 7.5%), together accounting for 75.5% of all Clinton residents.
| Ancestry | # Population | % Population |
| American | 17 | 0.9% |
| Arab | 30 | 1.6% |
| Austrian | 32 | 1.7% |
| Belgian | 6 | 0.3% |
| Bhutanese | 5 | 0.3% |
| British | 16 | 0.8% |
| Central American Indian | 3 | 0.2% |
| Cuban | 6 | 0.3% |
| Czech | 6 | 0.3% |
| Danish | 6 | 0.3% |
| Dominican | 5 | 0.3% |
| Dutch | 25 | 1.3% |
| Eastern European | 6 | 0.3% |
| English | 204 | 10.6% |
| European | 53 | 2.8% |
| French | 37 | 1.9% |
| French Canadian | 80 | 4.2% |
| German | 353 | 18.3% |
| Hungarian | 6 | 0.3% |
| Indian (Asian) | 27 | 1.4% |
| Irish | 358 | 18.6% |
| Italian | 395 | 20.5% |
| Jamaican | 24 | 1.2% |
| Lebanese | 11 | 0.6% |
| Lithuanian | 4 | 0.2% |
| Mexican | 58 | 3.0% |
| Mongolian | 2 | 0.1% |
| Northern European | 19 | 1.0% |
| Norwegian | 4 | 0.2% |
| Polish | 145 | 7.5% |
| Puerto Rican | 55 | 2.9% |
| Romanian | 10 | 0.5% |
| Scandinavian | 4 | 0.2% |
| Scotch-Irish | 14 | 0.7% |
| Scottish | 70 | 3.6% |
| Spaniard | 11 | 0.6% |
| Swedish | 4 | 0.2% |
| Swiss | 5 | 0.3% |
| Syrian | 19 | 1.0% |
| Thai | 35 | 1.8% |
| Turkish | 21 | 1.1% |
| Ukrainian | 18 | 0.9% |
| Welsh | 36 | 1.9% | View All 43 Rows |
Immigrants in Clinton
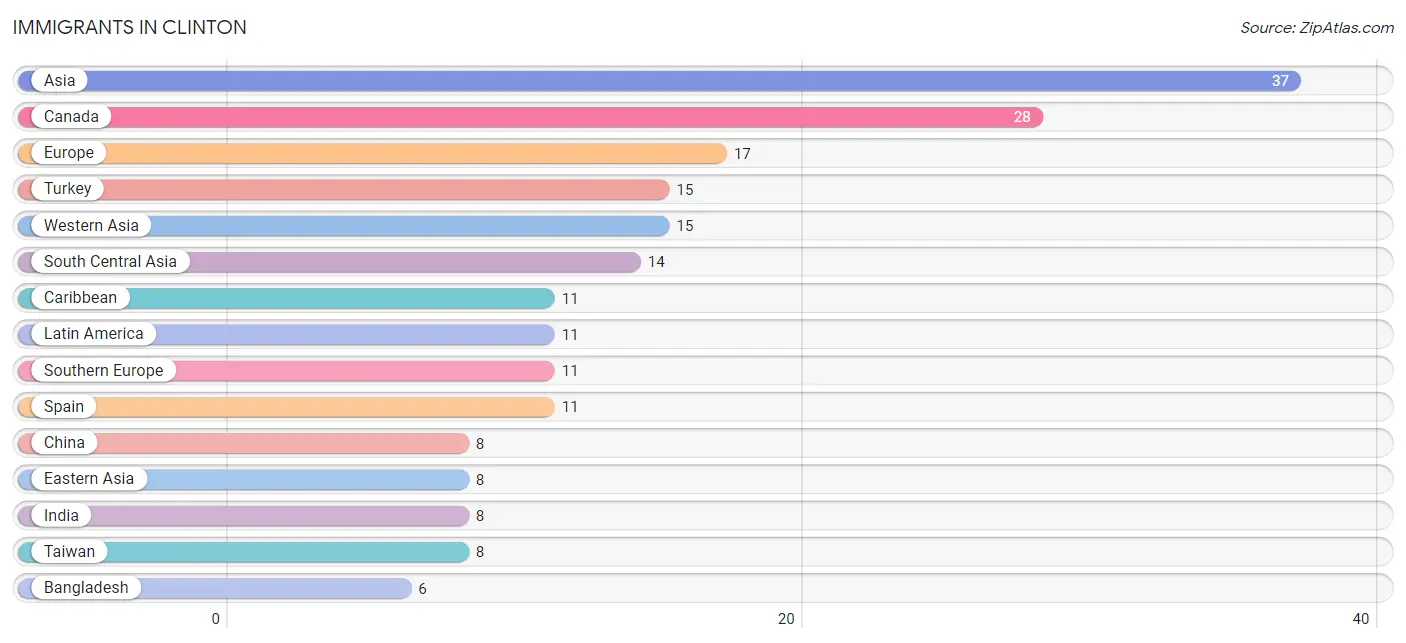
The most numerous immigrant groups reported in Clinton came from Asia (37 | 1.9%), Canada (28 | 1.5%), Europe (17 | 0.9%), Turkey (15 | 0.8%), and Western Asia (15 | 0.8%), together accounting for 5.8% of all Clinton residents.
| Immigration Origin | # Population | % Population |
| Asia | 37 | 1.9% |
| Bangladesh | 6 | 0.3% |
| Canada | 28 | 1.5% |
| Caribbean | 11 | 0.6% |
| China | 8 | 0.4% |
| Cuba | 6 | 0.3% |
| Dominican Republic | 5 | 0.3% |
| Eastern Asia | 8 | 0.4% |
| Europe | 17 | 0.9% |
| India | 8 | 0.4% |
| Latin America | 11 | 0.6% |
| Northern Europe | 6 | 0.3% |
| South Central Asia | 14 | 0.7% |
| Southern Europe | 11 | 0.6% |
| Spain | 11 | 0.6% |
| Taiwan | 8 | 0.4% |
| Turkey | 15 | 0.8% |
| Western Asia | 15 | 0.8% | View All 18 Rows |
Sex and Age in Clinton
Sex and Age in Clinton
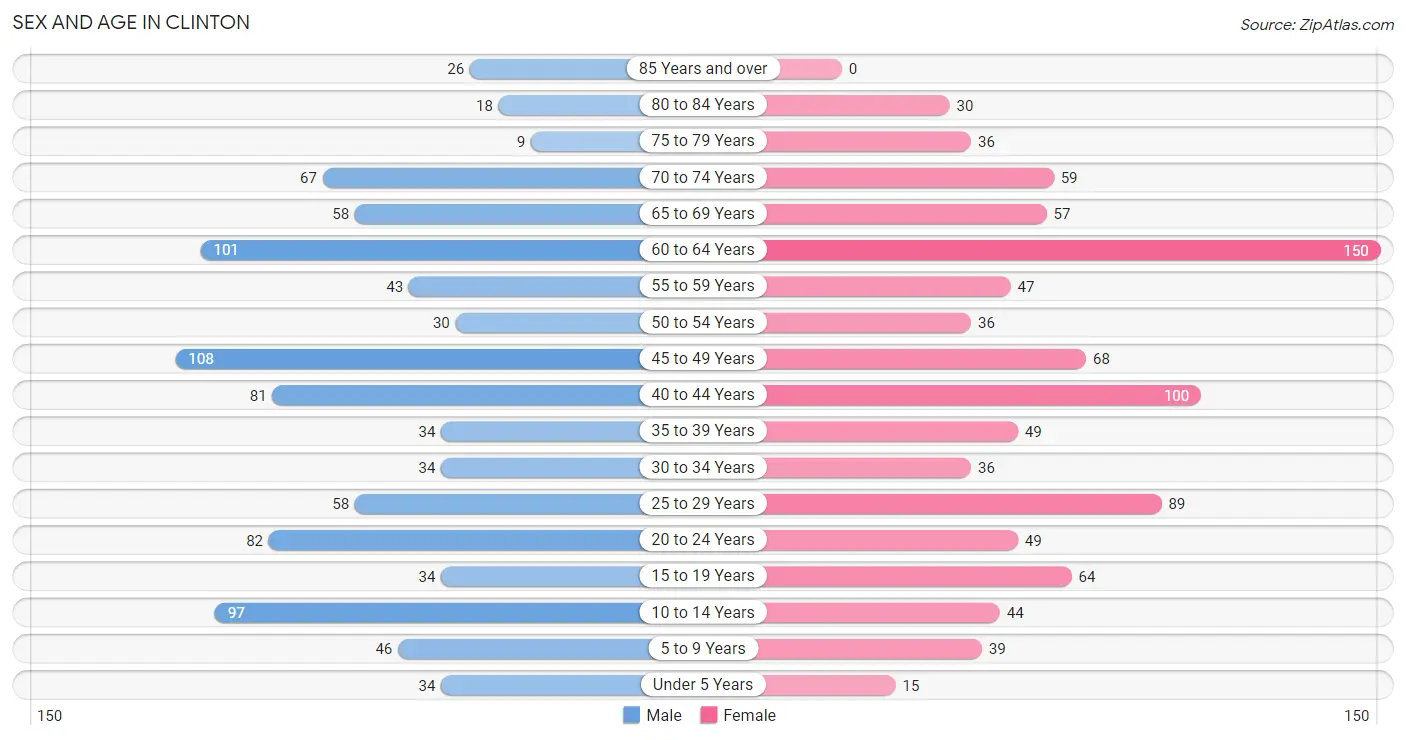
The most populous age groups in Clinton are 45 to 49 Years (108 | 11.3%) for men and 60 to 64 Years (150 | 15.5%) for women.
| Age Bracket | Male | Female |
| Under 5 Years | 34 (3.5%) | 15 (1.5%) |
| 5 to 9 Years | 46 (4.8%) | 39 (4.0%) |
| 10 to 14 Years | 97 (10.1%) | 44 (4.5%) |
| 15 to 19 Years | 34 (3.5%) | 64 (6.6%) |
| 20 to 24 Years | 82 (8.5%) | 49 (5.1%) |
| 25 to 29 Years | 58 (6.0%) | 89 (9.2%) |
| 30 to 34 Years | 34 (3.5%) | 36 (3.7%) |
| 35 to 39 Years | 34 (3.5%) | 49 (5.1%) |
| 40 to 44 Years | 81 (8.4%) | 100 (10.3%) |
| 45 to 49 Years | 108 (11.3%) | 68 (7.0%) |
| 50 to 54 Years | 30 (3.1%) | 36 (3.7%) |
| 55 to 59 Years | 43 (4.5%) | 47 (4.9%) |
| 60 to 64 Years | 101 (10.5%) | 150 (15.5%) |
| 65 to 69 Years | 58 (6.0%) | 57 (5.9%) |
| 70 to 74 Years | 67 (7.0%) | 59 (6.1%) |
| 75 to 79 Years | 9 (0.9%) | 36 (3.7%) |
| 80 to 84 Years | 18 (1.9%) | 30 (3.1%) |
| 85 Years and over | 26 (2.7%) | 0 (0.0%) |
| Total | 960 (100.0%) | 968 (100.0%) |
Families and Households in Clinton
Median Family Size in Clinton
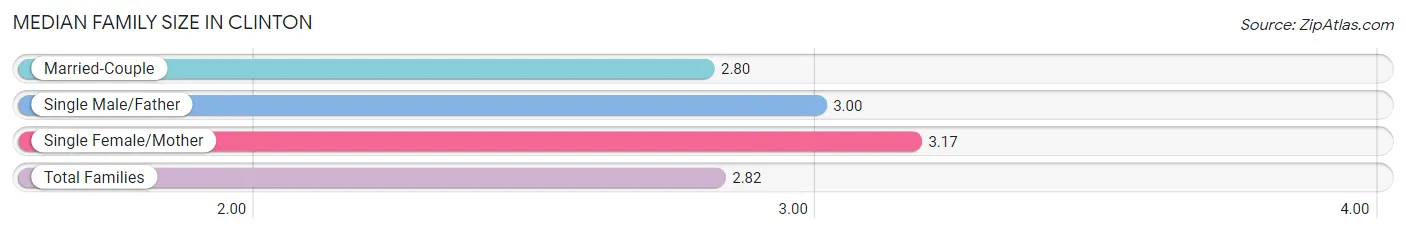
The median family size in Clinton is 2.82 persons per family, with single female/mother families (24 | 4.5%) accounting for the largest median family size of 3.17 persons per family. On the other hand, married-couple families (497 | 93.2%) represent the smallest median family size with 2.80 persons per family.
| Family Type | # Families | Family Size |
| Married-Couple | 497 (93.2%) | 2.80 |
| Single Male/Father | 12 (2.2%) | 3.00 |
| Single Female/Mother | 24 (4.5%) | 3.17 |
| Total Families | 533 (100.0%) | 2.82 |
Median Household Size in Clinton
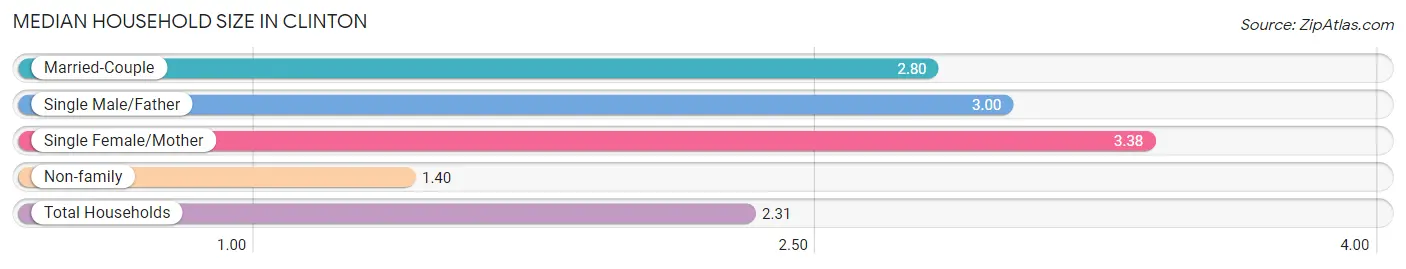
The median household size in Clinton is 2.31 persons per household, with single female/mother households (24 | 2.9%) accounting for the largest median household size of 3.38 persons per household. non-family households (298 | 35.9%) represent the smallest median household size with 1.40 persons per household.
| Household Type | # Households | Household Size |
| Married-Couple | 497 (59.8%) | 2.80 |
| Single Male/Father | 12 (1.4%) | 3.00 |
| Single Female/Mother | 24 (2.9%) | 3.38 |
| Non-family | 298 (35.9%) | 1.40 |
| Total Households | 831 (100.0%) | 2.31 |
Household Size by Marriage Status in Clinton
Out of a total of 831 households in Clinton, 533 (64.1%) are family households, while 298 (35.9%) are nonfamily households. The most numerous type of family households are 2-person households, comprising 312, and the most common type of nonfamily households are 1-person households, comprising 213.
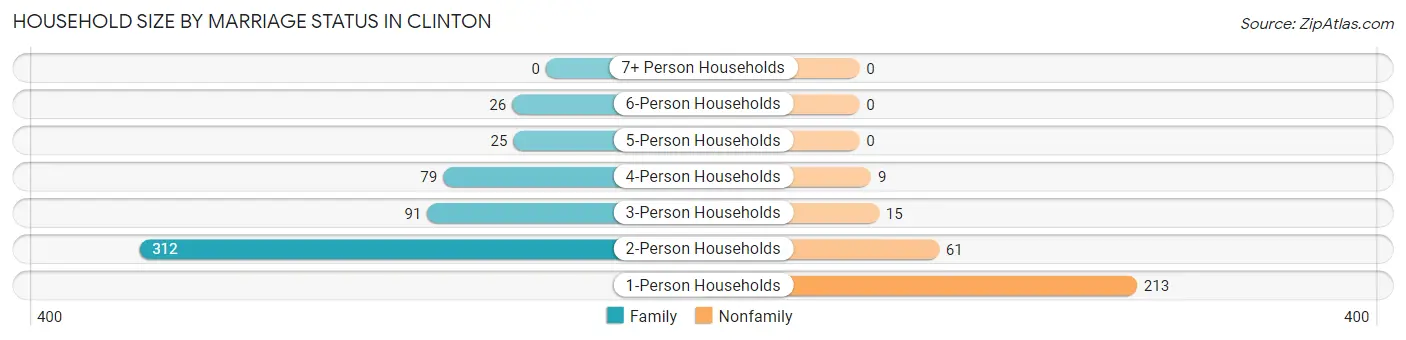
| Household Size | Family Households | Nonfamily Households |
| 1-Person Households | - | 213 (25.6%) |
| 2-Person Households | 312 (37.6%) | 61 (7.3%) |
| 3-Person Households | 91 (11.0%) | 15 (1.8%) |
| 4-Person Households | 79 (9.5%) | 9 (1.1%) |
| 5-Person Households | 25 (3.0%) | 0 (0.0%) |
| 6-Person Households | 26 (3.1%) | 0 (0.0%) |
| 7+ Person Households | 0 (0.0%) | 0 (0.0%) |
| Total | 533 (64.1%) | 298 (35.9%) |
Female Fertility in Clinton
Fertility by Age in Clinton
Average fertility rate in Clinton is 24.0 births per 1,000 women. Women in the age bracket of 20 to 34 years have the highest fertility rate with 63.0 births per 1,000 women. Women in the age bracket of 20 to 34 years acount for 100.0% of all women with births.
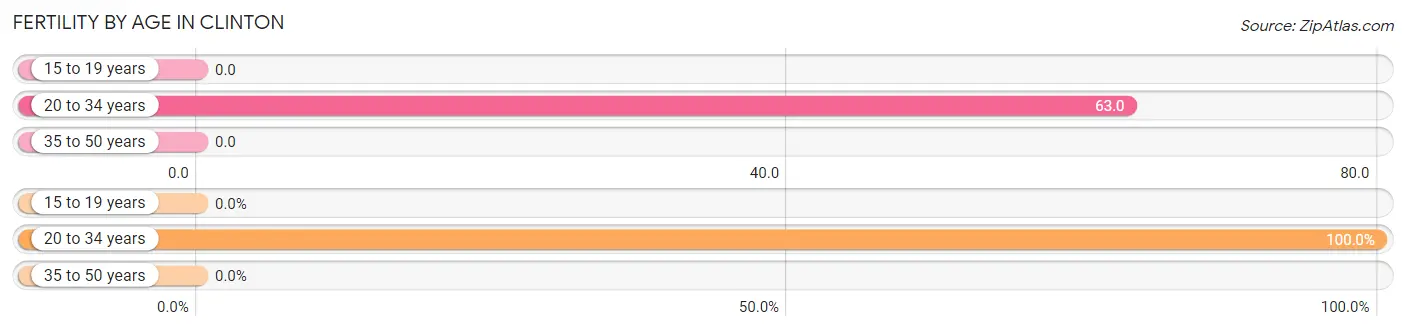
| Age Bracket | Women with Births | Births / 1,000 Women |
| 15 to 19 years | 0 (0.0%) | 0.0 |
| 20 to 34 years | 11 (100.0%) | 63.0 |
| 35 to 50 years | 0 (0.0%) | 0.0 |
| Total | 11 (100.0%) | 24.0 |
Fertility by Age by Marriage Status in Clinton
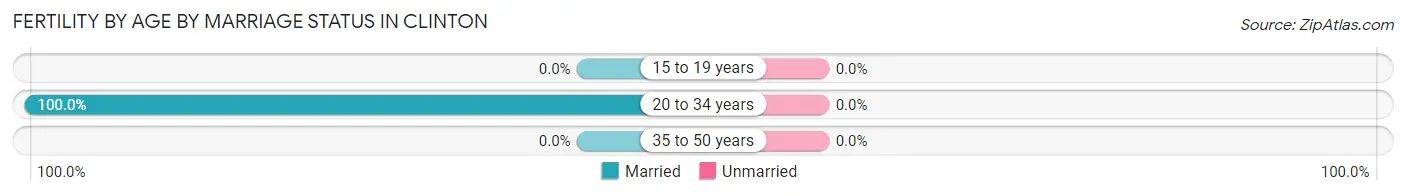
| Age Bracket | Married | Unmarried |
| 15 to 19 years | 0 (0.0%) | 0 (0.0%) |
| 20 to 34 years | 11 (100.0%) | 0 (0.0%) |
| 35 to 50 years | 0 (0.0%) | 0 (0.0%) |
| Total | 11 (100.0%) | 0 (0.0%) |
Fertility by Education in Clinton
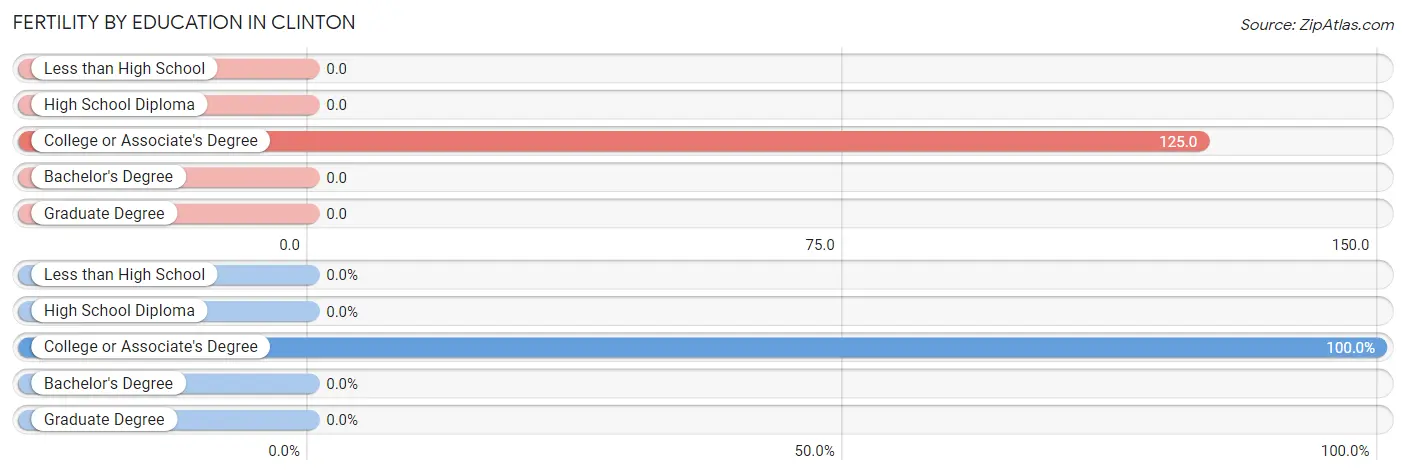
| Educational Attainment | Women with Births | Births / 1,000 Women |
| Less than High School | 0 (0.0%) | 0.0 |
| High School Diploma | 0 (0.0%) | 0.0 |
| College or Associate's Degree | 11 (100.0%) | 125.0 |
| Bachelor's Degree | 0 (0.0%) | 0.0 |
| Graduate Degree | 0 (0.0%) | 0.0 |
| Total | 11 (100.0%) | 24.0 |
Fertility by Education by Marriage Status in Clinton
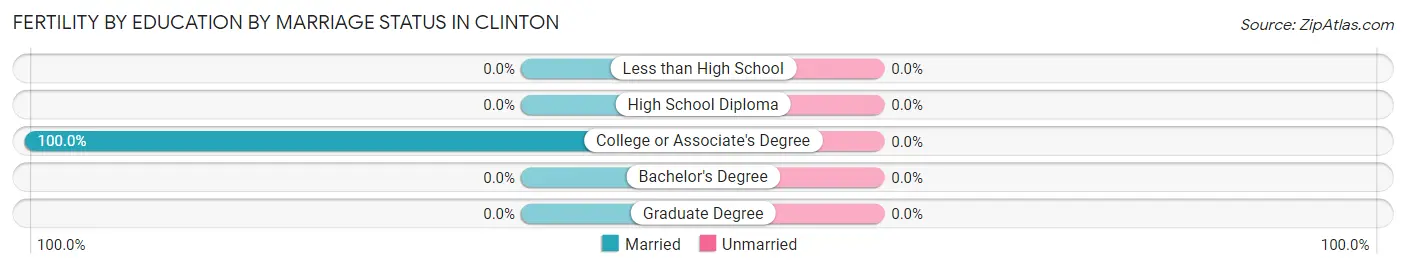
| Educational Attainment | Married | Unmarried |
| Less than High School | 0 (0.0%) | 0 (0.0%) |
| High School Diploma | 0 (0.0%) | 0 (0.0%) |
| College or Associate's Degree | 11 (100.0%) | 0 (0.0%) |
| Bachelor's Degree | 0 (0.0%) | 0 (0.0%) |
| Graduate Degree | 0 (0.0%) | 0 (0.0%) |
| Total | 11 (100.0%) | 0 (0.0%) |
Employment Characteristics in Clinton
Employment by Class of Employer in Clinton
Among the 1,047 employed individuals in Clinton, private company employees (604 | 57.7%), not-for-profit organizations (145 | 13.9%), and state government employees (89 | 8.5%) make up the most common classes of employment.
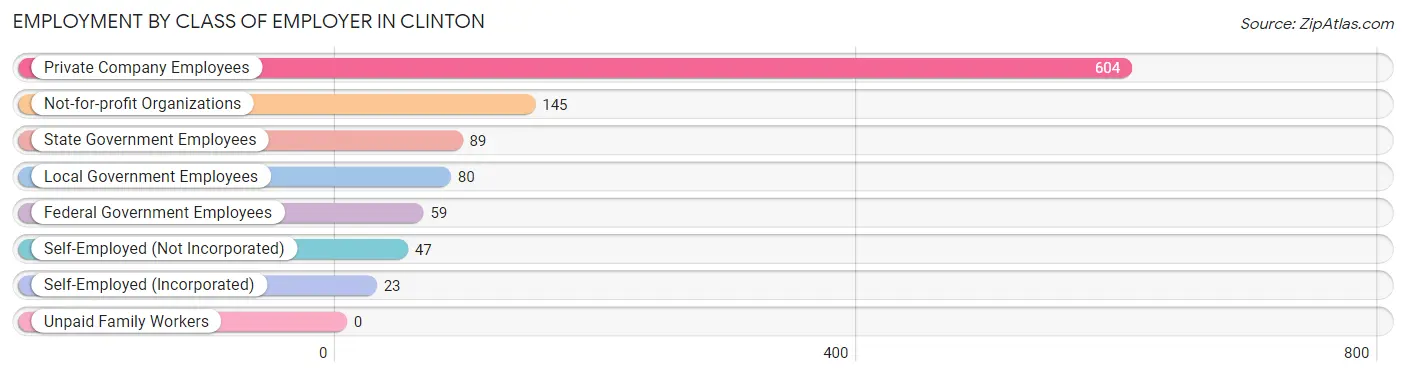
| Employer Class | # Employees | % Employees |
| Private Company Employees | 604 | 57.7% |
| Self-Employed (Incorporated) | 23 | 2.2% |
| Self-Employed (Not Incorporated) | 47 | 4.5% |
| Not-for-profit Organizations | 145 | 13.9% |
| Local Government Employees | 80 | 7.6% |
| State Government Employees | 89 | 8.5% |
| Federal Government Employees | 59 | 5.6% |
| Unpaid Family Workers | 0 | 0.0% |
| Total | 1,047 | 100.0% |
Employment Status by Age in Clinton
According to the labor force statistics for Clinton, out of the total population over 16 years of age (1,639), 66.0% or 1,082 individuals are in the labor force, with 2.4% or 26 of them unemployed. The age group with the highest labor force participation rate is 30 to 34 years, with 100.0% or 70 individuals in the labor force. Within the labor force, the 16 to 19 years age range has the highest percentage of unemployed individuals, with 27.6% or 8 of them being unemployed.
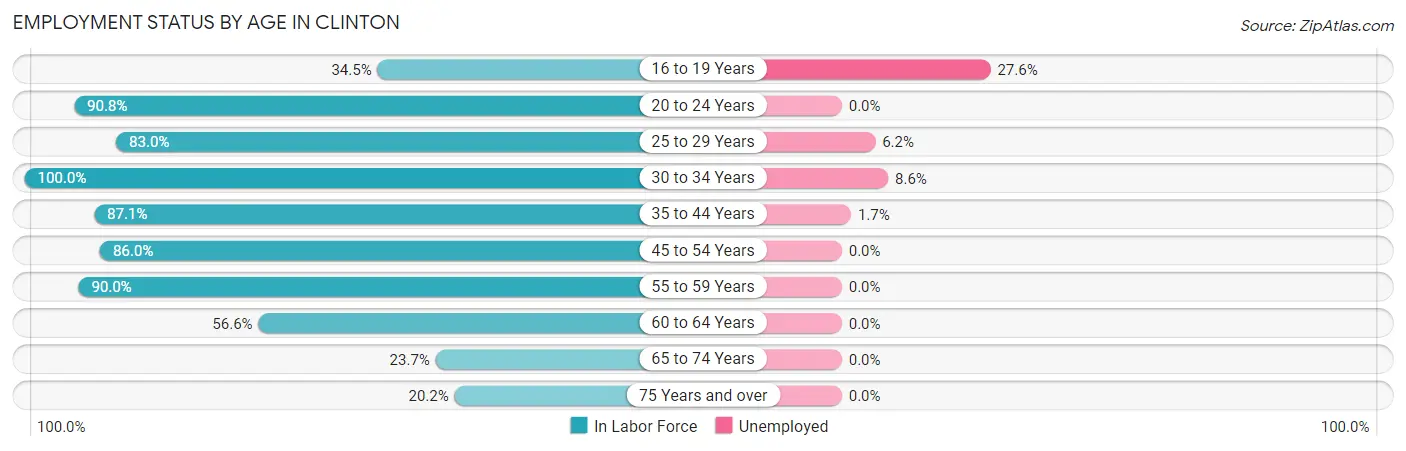
| Age Bracket | In Labor Force | Unemployed |
| 16 to 19 Years | 29 (34.5%) | 8 (27.6%) |
| 20 to 24 Years | 119 (90.8%) | 0 (0.0%) |
| 25 to 29 Years | 122 (83.0%) | 8 (6.2%) |
| 30 to 34 Years | 70 (100.0%) | 6 (8.6%) |
| 35 to 44 Years | 230 (87.1%) | 4 (1.7%) |
| 45 to 54 Years | 208 (86.0%) | 0 (0.0%) |
| 55 to 59 Years | 81 (90.0%) | 0 (0.0%) |
| 60 to 64 Years | 142 (56.6%) | 0 (0.0%) |
| 65 to 74 Years | 57 (23.7%) | 0 (0.0%) |
| 75 Years and over | 24 (20.2%) | 0 (0.0%) |
| Total | 1,082 (66.0%) | 26 (2.4%) |
Employment Status by Educational Attainment in Clinton
According to labor force statistics for Clinton, 80.2% of individuals (853) out of the total population between 25 and 64 years of age (1,064) are in the labor force, with 2.0% or 17 of them being unemployed. The group with the highest labor force participation rate are those with the educational attainment of less than high school, with 100.0% or 10 individuals in the labor force. Within the labor force, individuals with college / associate degree education have the highest percentage of unemployment, with 3.0% or 6 of them being unemployed.
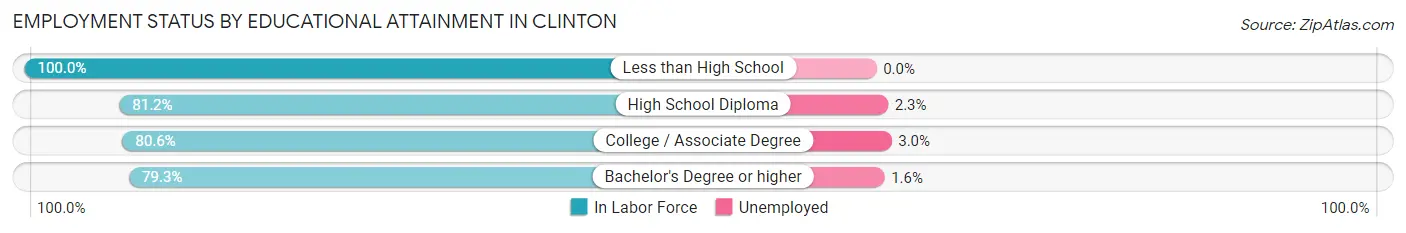
| Educational Attainment | In Labor Force | Unemployed |
| Less than High School | 10 (100.0%) | 0 (0.0%) |
| High School Diploma | 177 (81.2%) | 5 (2.3%) |
| College / Associate Degree | 199 (80.6%) | 7 (3.0%) |
| Bachelor's Degree or higher | 467 (79.3%) | 9 (1.6%) |
| Total | 853 (80.2%) | 21 (2.0%) |
Employment Occupations by Sex in Clinton
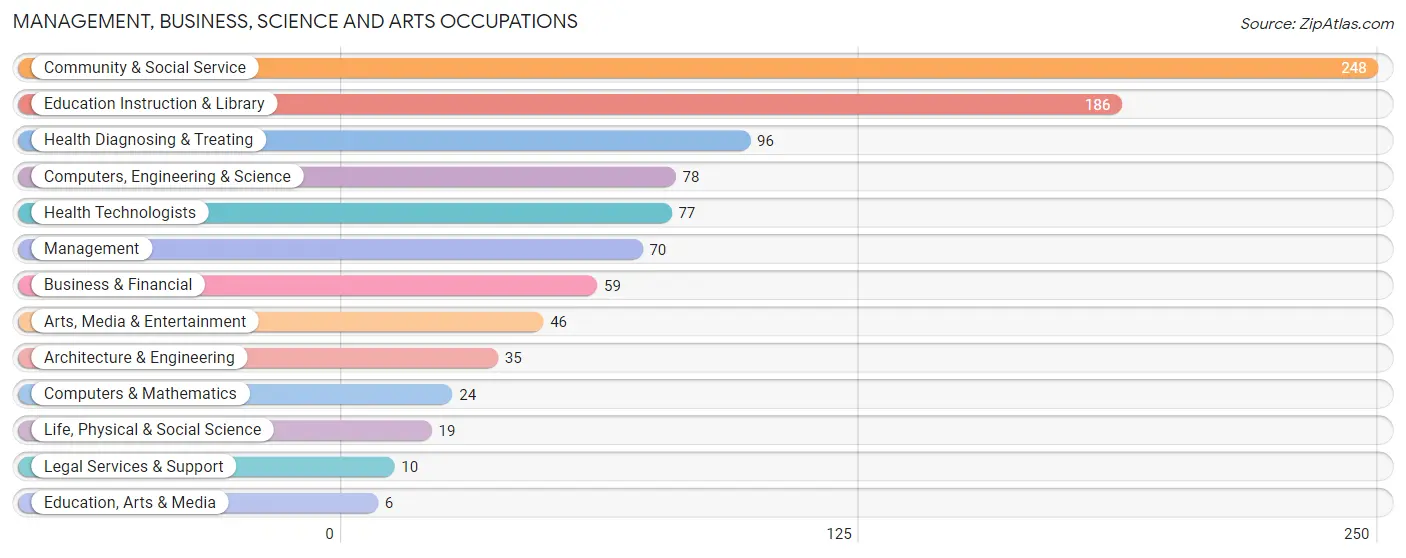
Management, Business, Science and Arts Occupations
The most common Management, Business, Science and Arts occupations in Clinton are Community & Social Service (248 | 24.3%), Education Instruction & Library (186 | 18.2%), Health Diagnosing & Treating (96 | 9.4%), Computers, Engineering & Science (78 | 7.6%), and Health Technologists (77 | 7.5%).
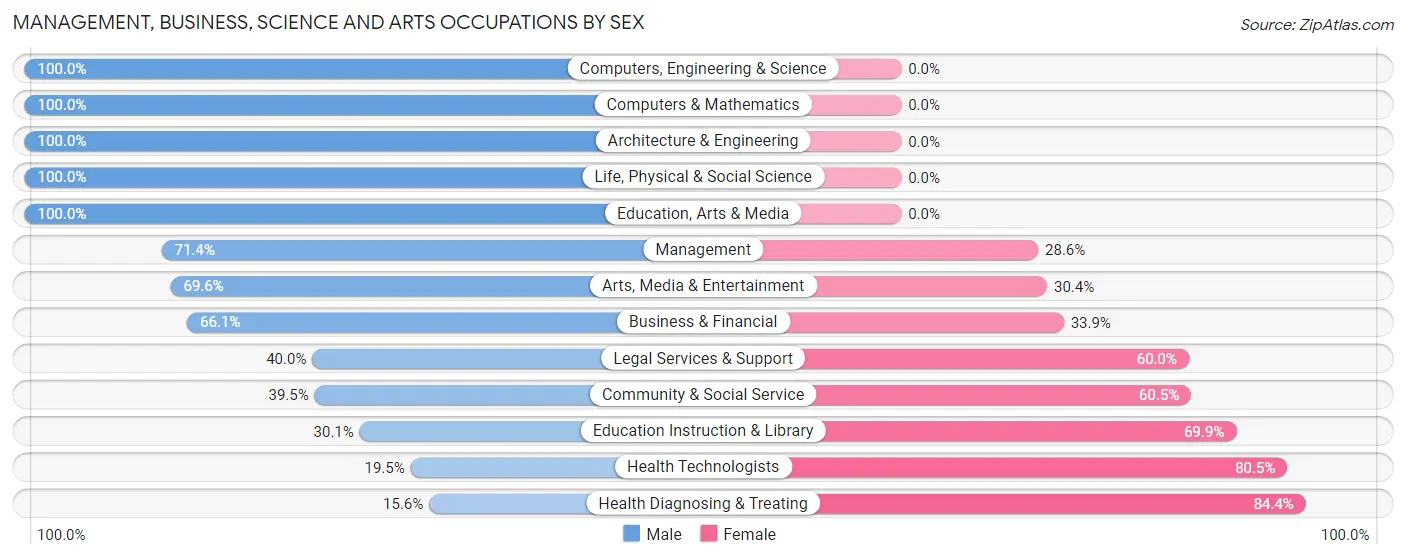
Management, Business, Science and Arts Occupations by Sex
Within the Management, Business, Science and Arts occupations in Clinton, the most male-oriented occupations are Computers, Engineering & Science (100.0%), Computers & Mathematics (100.0%), and Architecture & Engineering (100.0%), while the most female-oriented occupations are Health Diagnosing & Treating (84.4%), Health Technologists (80.5%), and Education Instruction & Library (69.9%).
| Occupation | Male | Female |
| Management | 50 (71.4%) | 20 (28.6%) |
| Business & Financial | 39 (66.1%) | 20 (33.9%) |
| Computers, Engineering & Science | 78 (100.0%) | 0 (0.0%) |
| Computers & Mathematics | 24 (100.0%) | 0 (0.0%) |
| Architecture & Engineering | 35 (100.0%) | 0 (0.0%) |
| Life, Physical & Social Science | 19 (100.0%) | 0 (0.0%) |
| Community & Social Service | 98 (39.5%) | 150 (60.5%) |
| Education, Arts & Media | 6 (100.0%) | 0 (0.0%) |
| Legal Services & Support | 4 (40.0%) | 6 (60.0%) |
| Education Instruction & Library | 56 (30.1%) | 130 (69.9%) |
| Arts, Media & Entertainment | 32 (69.6%) | 14 (30.4%) |
| Health Diagnosing & Treating | 15 (15.6%) | 81 (84.4%) |
| Health Technologists | 15 (19.5%) | 62 (80.5%) |
| Total (Category) | 280 (50.8%) | 271 (49.2%) |
| Total (Overall) | 588 (57.6%) | 433 (42.4%) |
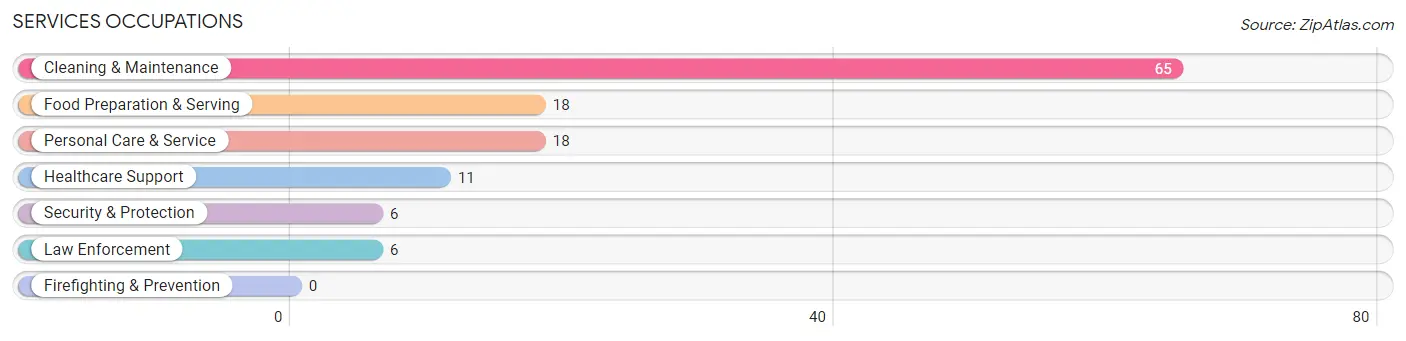
Services Occupations
The most common Services occupations in Clinton are Cleaning & Maintenance (65 | 6.4%), Food Preparation & Serving (18 | 1.8%), Personal Care & Service (18 | 1.8%), Healthcare Support (11 | 1.1%), and Security & Protection (6 | 0.6%).
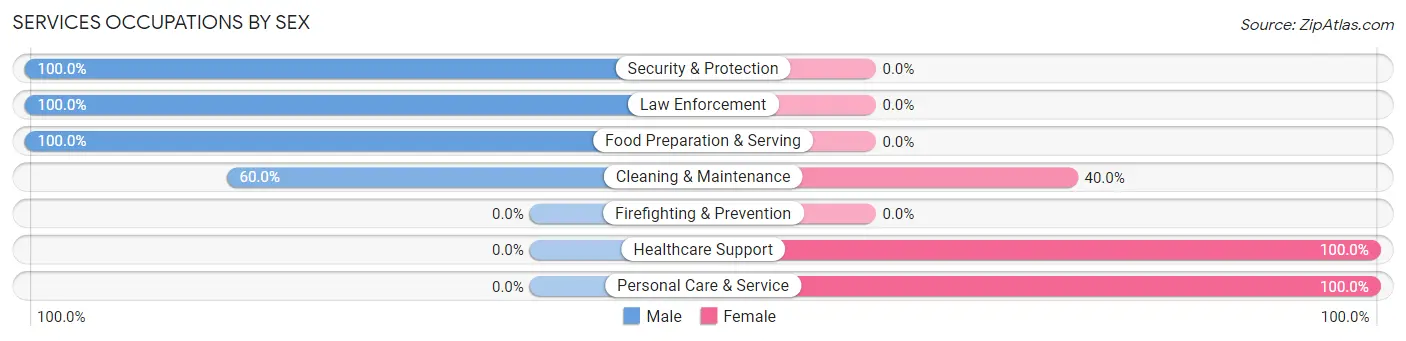
Services Occupations by Sex
Within the Services occupations in Clinton, the most male-oriented occupations are Security & Protection (100.0%), Law Enforcement (100.0%), and Food Preparation & Serving (100.0%), while the most female-oriented occupations are Healthcare Support (100.0%), Personal Care & Service (100.0%), and Cleaning & Maintenance (40.0%).
| Occupation | Male | Female |
| Healthcare Support | 0 (0.0%) | 11 (100.0%) |
| Security & Protection | 6 (100.0%) | 0 (0.0%) |
| Firefighting & Prevention | 0 (0.0%) | 0 (0.0%) |
| Law Enforcement | 6 (100.0%) | 0 (0.0%) |
| Food Preparation & Serving | 18 (100.0%) | 0 (0.0%) |
| Cleaning & Maintenance | 39 (60.0%) | 26 (40.0%) |
| Personal Care & Service | 0 (0.0%) | 18 (100.0%) |
| Total (Category) | 63 (53.4%) | 55 (46.6%) |
| Total (Overall) | 588 (57.6%) | 433 (42.4%) |
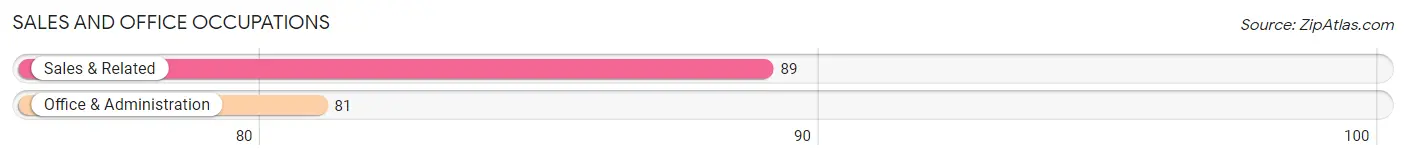
Sales and Office Occupations
The most common Sales and Office occupations in Clinton are Sales & Related (89 | 8.7%), and Office & Administration (81 | 7.9%).
Sales and Office Occupations by Sex
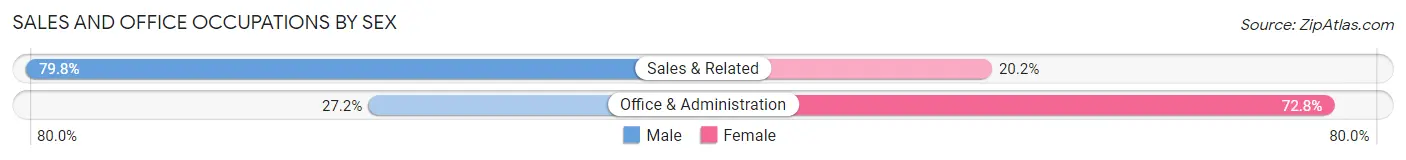
| Occupation | Male | Female |
| Sales & Related | 71 (79.8%) | 18 (20.2%) |
| Office & Administration | 22 (27.2%) | 59 (72.8%) |
| Total (Category) | 93 (54.7%) | 77 (45.3%) |
| Total (Overall) | 588 (57.6%) | 433 (42.4%) |
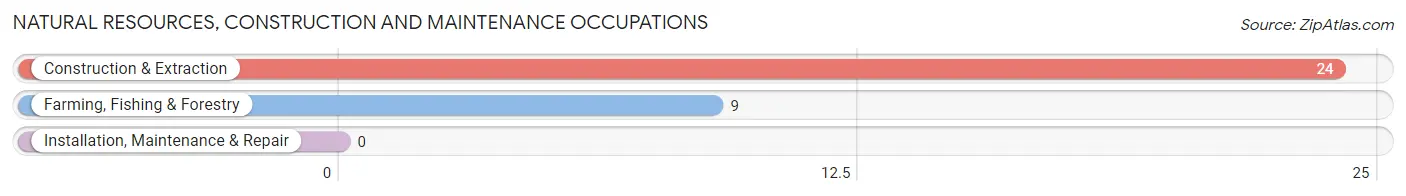
Natural Resources, Construction and Maintenance Occupations
The most common Natural Resources, Construction and Maintenance occupations in Clinton are Construction & Extraction (24 | 2.4%), and Farming, Fishing & Forestry (9 | 0.9%).
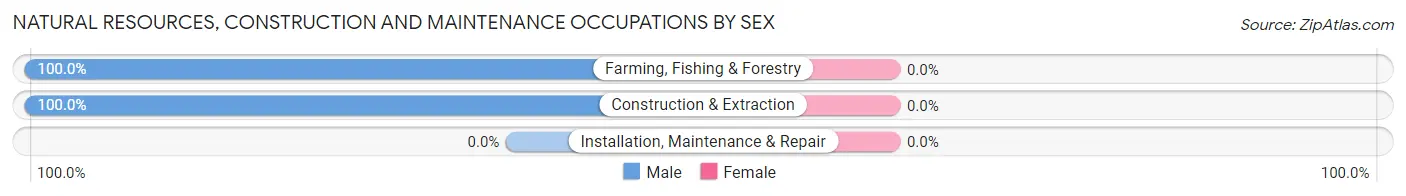
Natural Resources, Construction and Maintenance Occupations by Sex
| Occupation | Male | Female |
| Farming, Fishing & Forestry | 9 (100.0%) | 0 (0.0%) |
| Construction & Extraction | 24 (100.0%) | 0 (0.0%) |
| Installation, Maintenance & Repair | 0 (0.0%) | 0 (0.0%) |
| Total (Category) | 33 (100.0%) | 0 (0.0%) |
| Total (Overall) | 588 (57.6%) | 433 (42.4%) |
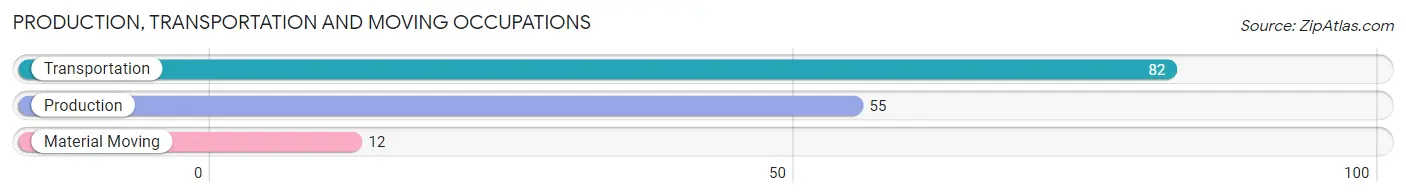
Production, Transportation and Moving Occupations
The most common Production, Transportation and Moving occupations in Clinton are Transportation (82 | 8.0%), Production (55 | 5.4%), and Material Moving (12 | 1.2%).
Production, Transportation and Moving Occupations by Sex
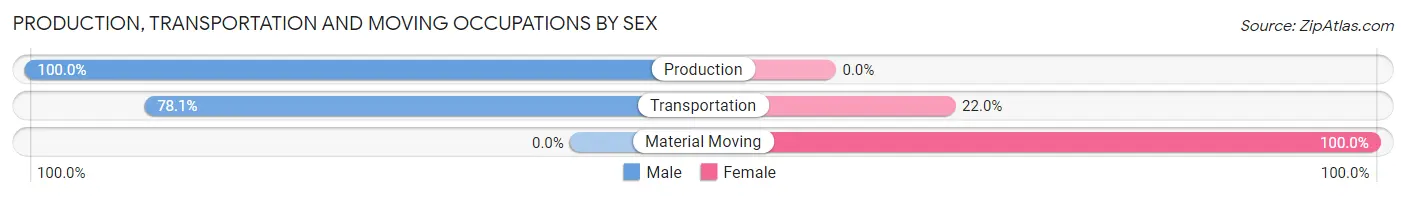
| Occupation | Male | Female |
| Production | 55 (100.0%) | 0 (0.0%) |
| Transportation | 64 (78.0%) | 18 (22.0%) |
| Material Moving | 0 (0.0%) | 12 (100.0%) |
| Total (Category) | 119 (79.9%) | 30 (20.1%) |
| Total (Overall) | 588 (57.6%) | 433 (42.4%) |
Employment Industries by Sex in Clinton
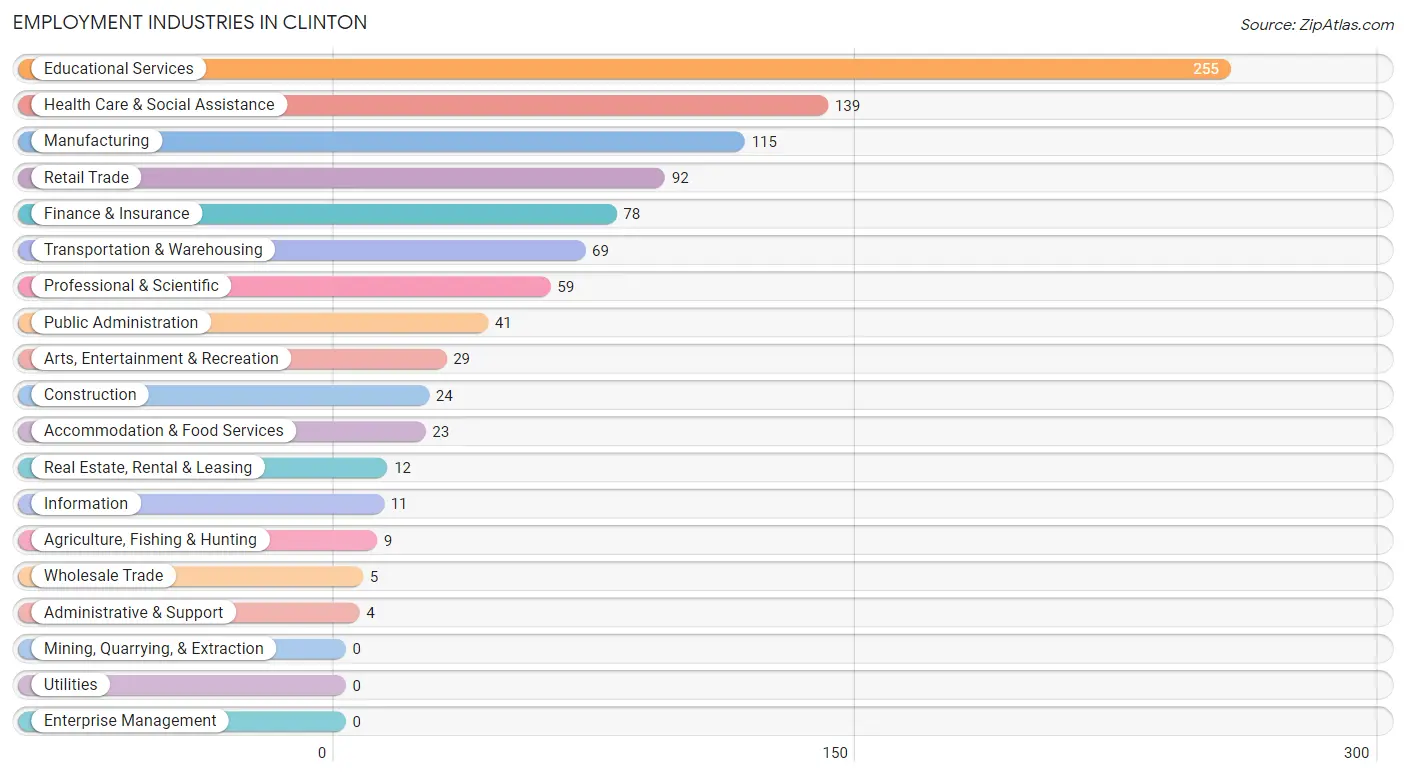
Employment Industries in Clinton
The major employment industries in Clinton include Educational Services (255 | 25.0%), Health Care & Social Assistance (139 | 13.6%), Manufacturing (115 | 11.3%), Retail Trade (92 | 9.0%), and Finance & Insurance (78 | 7.6%).
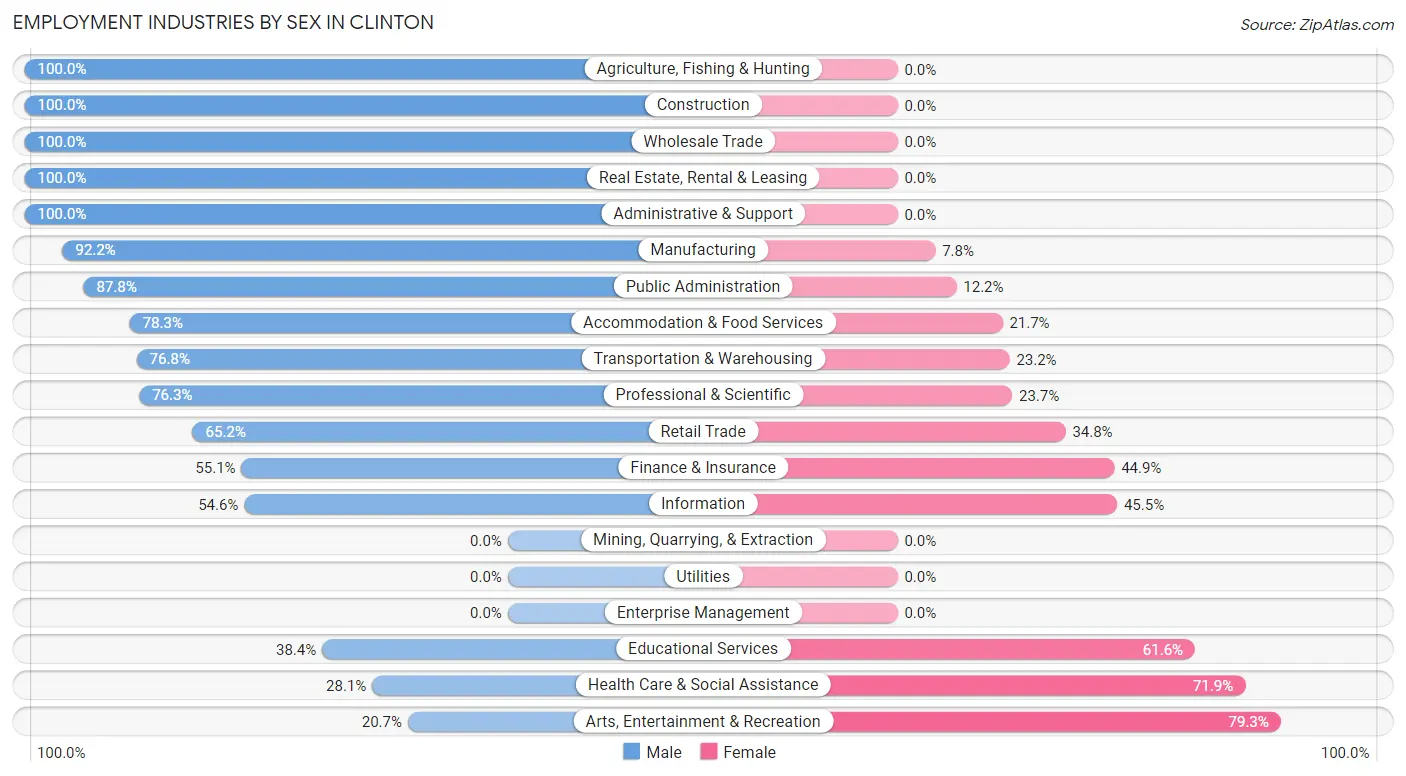
Employment Industries by Sex in Clinton
The Clinton industries that see more men than women are Agriculture, Fishing & Hunting (100.0%), Construction (100.0%), and Wholesale Trade (100.0%), whereas the industries that tend to have a higher number of women are Arts, Entertainment & Recreation (79.3%), Health Care & Social Assistance (71.9%), and Educational Services (61.6%).
| Industry | Male | Female |
| Agriculture, Fishing & Hunting | 9 (100.0%) | 0 (0.0%) |
| Mining, Quarrying, & Extraction | 0 (0.0%) | 0 (0.0%) |
| Construction | 24 (100.0%) | 0 (0.0%) |
| Manufacturing | 106 (92.2%) | 9 (7.8%) |
| Wholesale Trade | 5 (100.0%) | 0 (0.0%) |
| Retail Trade | 60 (65.2%) | 32 (34.8%) |
| Transportation & Warehousing | 53 (76.8%) | 16 (23.2%) |
| Utilities | 0 (0.0%) | 0 (0.0%) |
| Information | 6 (54.5%) | 5 (45.5%) |
| Finance & Insurance | 43 (55.1%) | 35 (44.9%) |
| Real Estate, Rental & Leasing | 12 (100.0%) | 0 (0.0%) |
| Professional & Scientific | 45 (76.3%) | 14 (23.7%) |
| Enterprise Management | 0 (0.0%) | 0 (0.0%) |
| Administrative & Support | 4 (100.0%) | 0 (0.0%) |
| Educational Services | 98 (38.4%) | 157 (61.6%) |
| Health Care & Social Assistance | 39 (28.1%) | 100 (71.9%) |
| Arts, Entertainment & Recreation | 6 (20.7%) | 23 (79.3%) |
| Accommodation & Food Services | 18 (78.3%) | 5 (21.7%) |
| Public Administration | 36 (87.8%) | 5 (12.2%) |
| Total | 588 (57.6%) | 433 (42.4%) |
Education in Clinton
School Enrollment in Clinton
The most common levels of schooling among the 391 students in Clinton are middle school (115 | 29.4%), high school (83 | 21.2%), and elementary school (79 | 20.2%).
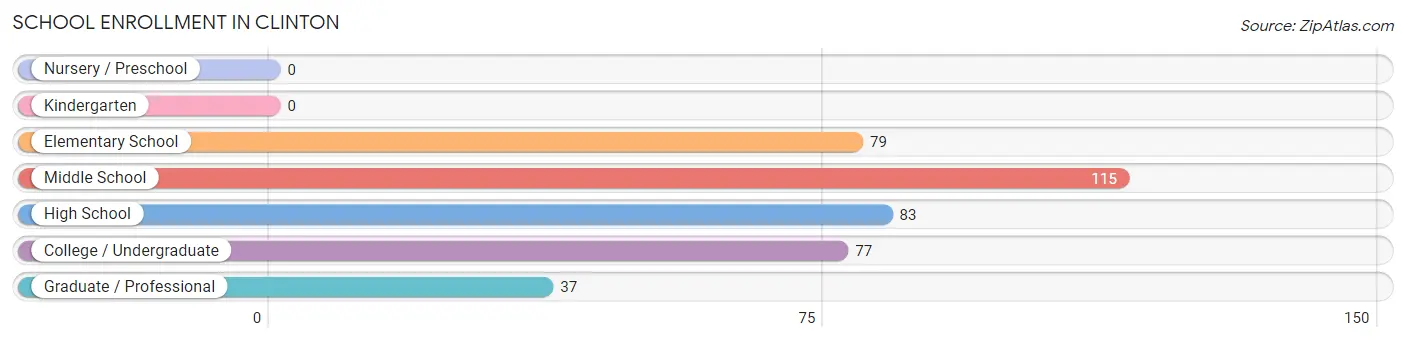
| School Level | # Students | % Students |
| Nursery / Preschool | 0 | 0.0% |
| Kindergarten | 0 | 0.0% |
| Elementary School | 79 | 20.2% |
| Middle School | 115 | 29.4% |
| High School | 83 | 21.2% |
| College / Undergraduate | 77 | 19.7% |
| Graduate / Professional | 37 | 9.5% |
| Total | 391 | 100.0% |
School Enrollment by Age by Funding Source in Clinton
Out of a total of 391 students who are enrolled in schools in Clinton, 33 (8.4%) attend a private institution, while the remaining 358 (91.6%) are enrolled in public schools. The age group of 25 to 34 year olds has the highest likelihood of being enrolled in private schools, with 17 (50.0% in the age bracket) enrolled. Conversely, the age group of 5 to 9 year old has the lowest likelihood of being enrolled in a private school, with 79 (100.0% in the age bracket) attending a public institution.
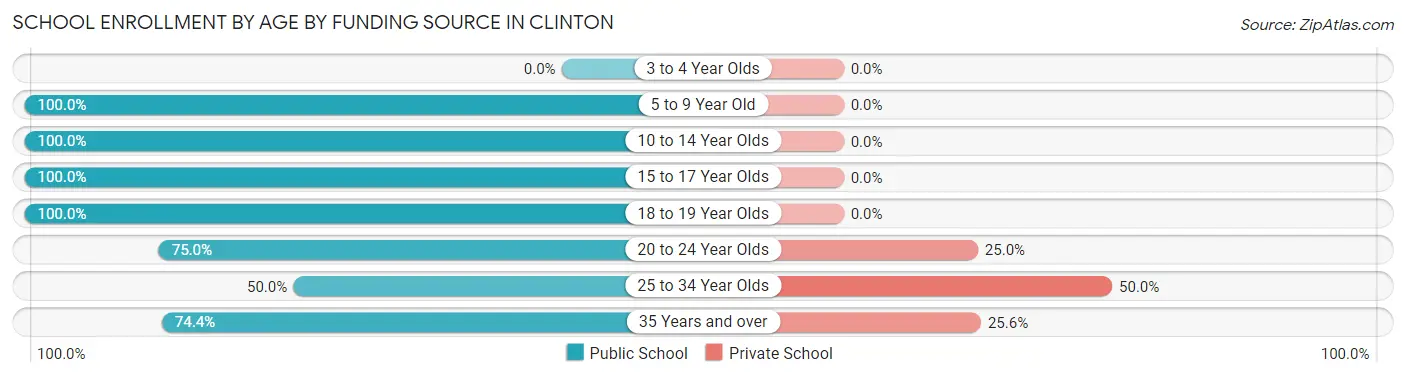
| Age Bracket | Public School | Private School |
| 3 to 4 Year Olds | 0 (0.0%) | 0 (0.0%) |
| 5 to 9 Year Old | 79 (100.0%) | 0 (0.0%) |
| 10 to 14 Year Olds | 141 (100.0%) | 0 (0.0%) |
| 15 to 17 Year Olds | 52 (100.0%) | 0 (0.0%) |
| 18 to 19 Year Olds | 22 (100.0%) | 0 (0.0%) |
| 20 to 24 Year Olds | 15 (75.0%) | 5 (25.0%) |
| 25 to 34 Year Olds | 17 (50.0%) | 17 (50.0%) |
| 35 Years and over | 32 (74.4%) | 11 (25.6%) |
| Total | 358 (91.6%) | 33 (8.4%) |
Educational Attainment by Field of Study in Clinton
Education (128 | 14.4%), psychology (112 | 12.6%), business (103 | 11.6%), science & technology (102 | 11.5%), and social sciences (89 | 10.0%) are the most common fields of study among 888 individuals in Clinton who have obtained a bachelor's degree or higher.
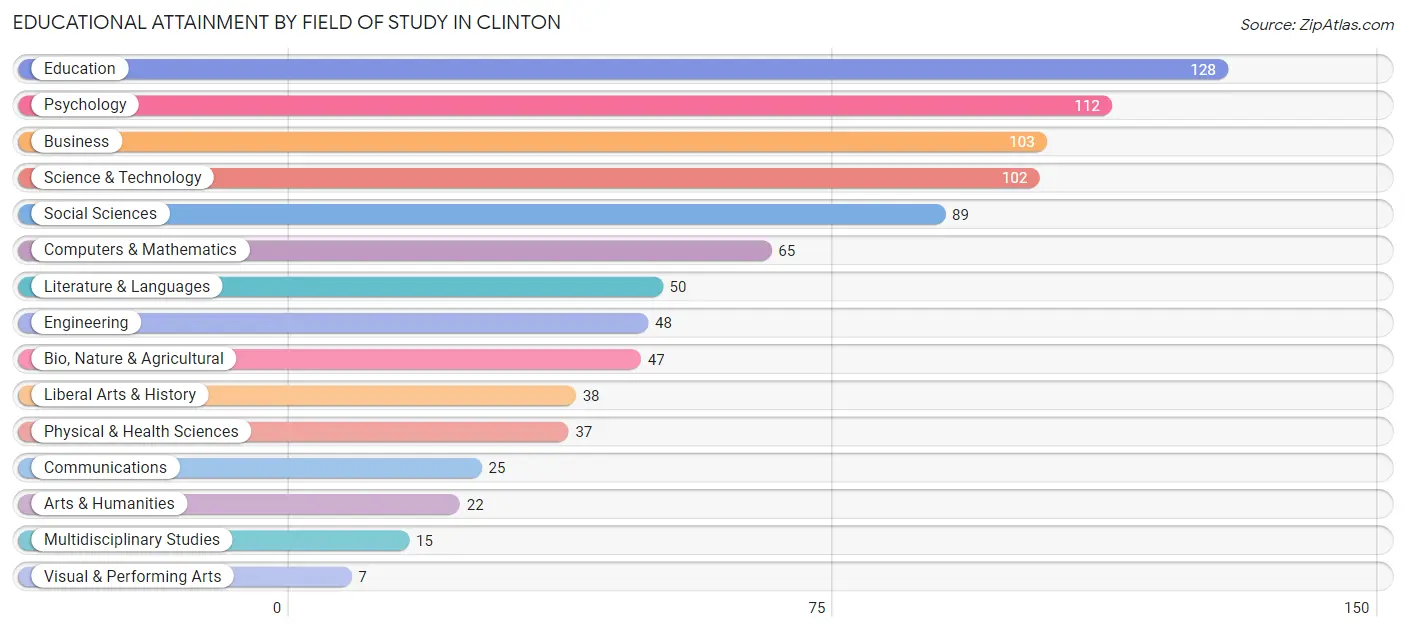
| Field of Study | # Graduates | % Graduates |
| Computers & Mathematics | 65 | 7.3% |
| Bio, Nature & Agricultural | 47 | 5.3% |
| Physical & Health Sciences | 37 | 4.2% |
| Psychology | 112 | 12.6% |
| Social Sciences | 89 | 10.0% |
| Engineering | 48 | 5.4% |
| Multidisciplinary Studies | 15 | 1.7% |
| Science & Technology | 102 | 11.5% |
| Business | 103 | 11.6% |
| Education | 128 | 14.4% |
| Literature & Languages | 50 | 5.6% |
| Liberal Arts & History | 38 | 4.3% |
| Visual & Performing Arts | 7 | 0.8% |
| Communications | 25 | 2.8% |
| Arts & Humanities | 22 | 2.5% |
| Total | 888 | 100.0% |
Transportation & Commute in Clinton
Vehicle Availability by Sex in Clinton
The most prevalent vehicle ownership categories in Clinton are males with 2 vehicles (256, accounting for 42.6%) and females with 2 vehicles (184, making up 57.4%).
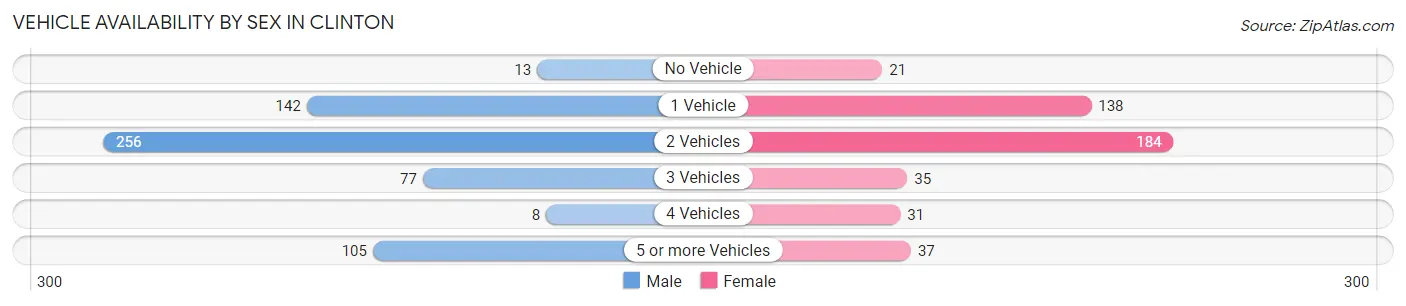
| Vehicles Available | Male | Female |
| No Vehicle | 13 (2.2%) | 21 (4.7%) |
| 1 Vehicle | 142 (23.6%) | 138 (30.9%) |
| 2 Vehicles | 256 (42.6%) | 184 (41.3%) |
| 3 Vehicles | 77 (12.8%) | 35 (7.9%) |
| 4 Vehicles | 8 (1.3%) | 31 (7.0%) |
| 5 or more Vehicles | 105 (17.5%) | 37 (8.3%) |
| Total | 601 (100.0%) | 446 (100.0%) |
Commute Time in Clinton
The most frequently occuring commute durations in Clinton are 20 to 24 minutes (231 commuters, 24.9%), 10 to 14 minutes (180 commuters, 19.4%), and 5 to 9 minutes (160 commuters, 17.2%).
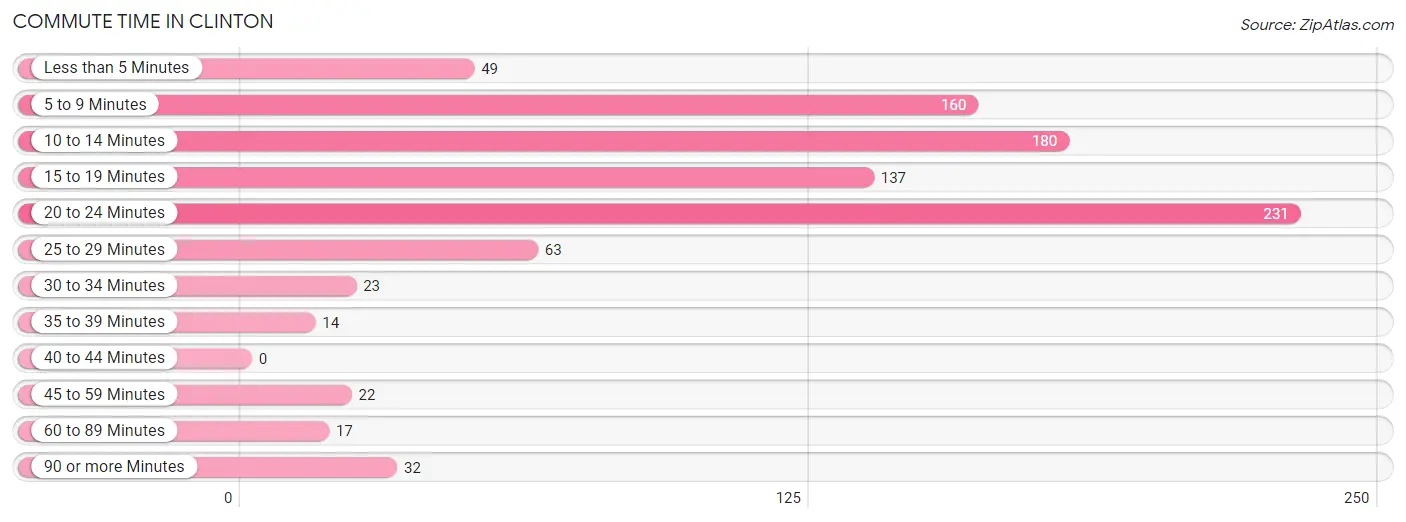
| Commute Time | # Commuters | % Commuters |
| Less than 5 Minutes | 49 | 5.3% |
| 5 to 9 Minutes | 160 | 17.2% |
| 10 to 14 Minutes | 180 | 19.4% |
| 15 to 19 Minutes | 137 | 14.8% |
| 20 to 24 Minutes | 231 | 24.9% |
| 25 to 29 Minutes | 63 | 6.8% |
| 30 to 34 Minutes | 23 | 2.5% |
| 35 to 39 Minutes | 14 | 1.5% |
| 40 to 44 Minutes | 0 | 0.0% |
| 45 to 59 Minutes | 22 | 2.4% |
| 60 to 89 Minutes | 17 | 1.8% |
| 90 or more Minutes | 32 | 3.5% |
Commute Time by Sex in Clinton
The most common commute times in Clinton are 20 to 24 minutes (174 commuters, 31.4%) for males and 10 to 14 minutes (90 commuters, 24.1%) for females.
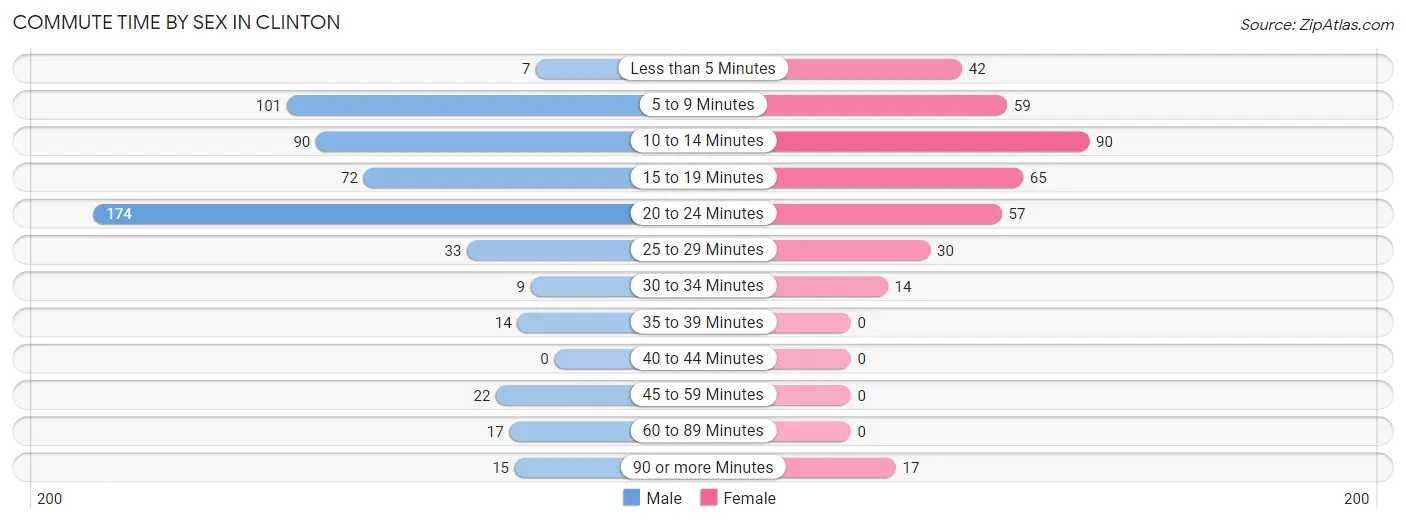
| Commute Time | Male | Female |
| Less than 5 Minutes | 7 (1.3%) | 42 (11.2%) |
| 5 to 9 Minutes | 101 (18.2%) | 59 (15.8%) |
| 10 to 14 Minutes | 90 (16.3%) | 90 (24.1%) |
| 15 to 19 Minutes | 72 (13.0%) | 65 (17.4%) |
| 20 to 24 Minutes | 174 (31.4%) | 57 (15.2%) |
| 25 to 29 Minutes | 33 (6.0%) | 30 (8.0%) |
| 30 to 34 Minutes | 9 (1.6%) | 14 (3.7%) |
| 35 to 39 Minutes | 14 (2.5%) | 0 (0.0%) |
| 40 to 44 Minutes | 0 (0.0%) | 0 (0.0%) |
| 45 to 59 Minutes | 22 (4.0%) | 0 (0.0%) |
| 60 to 89 Minutes | 17 (3.1%) | 0 (0.0%) |
| 90 or more Minutes | 15 (2.7%) | 17 (4.5%) |
Time of Departure to Work by Sex in Clinton
The most frequent times of departure to work in Clinton are 8:00 AM to 8:29 AM (107, 19.3%) for males and 7:30 AM to 7:59 AM (100, 26.7%) for females.
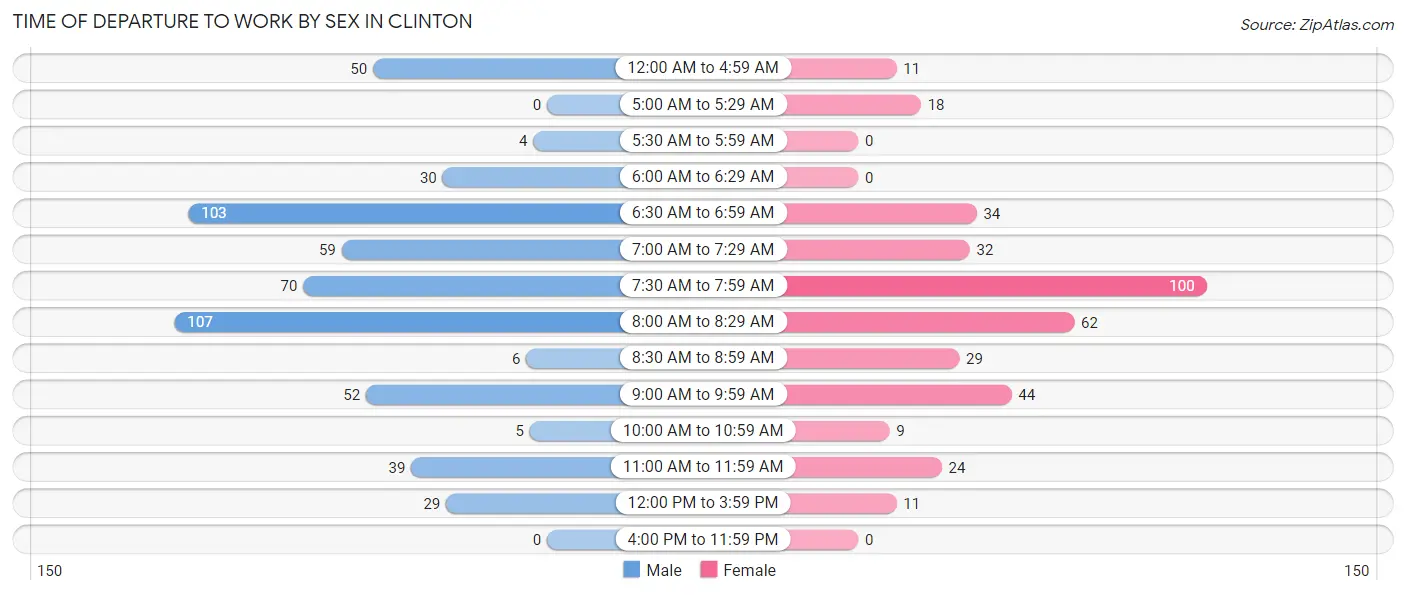
| Time of Departure | Male | Female |
| 12:00 AM to 4:59 AM | 50 (9.0%) | 11 (2.9%) |
| 5:00 AM to 5:29 AM | 0 (0.0%) | 18 (4.8%) |
| 5:30 AM to 5:59 AM | 4 (0.7%) | 0 (0.0%) |
| 6:00 AM to 6:29 AM | 30 (5.4%) | 0 (0.0%) |
| 6:30 AM to 6:59 AM | 103 (18.6%) | 34 (9.1%) |
| 7:00 AM to 7:29 AM | 59 (10.6%) | 32 (8.6%) |
| 7:30 AM to 7:59 AM | 70 (12.6%) | 100 (26.7%) |
| 8:00 AM to 8:29 AM | 107 (19.3%) | 62 (16.6%) |
| 8:30 AM to 8:59 AM | 6 (1.1%) | 29 (7.7%) |
| 9:00 AM to 9:59 AM | 52 (9.4%) | 44 (11.8%) |
| 10:00 AM to 10:59 AM | 5 (0.9%) | 9 (2.4%) |
| 11:00 AM to 11:59 AM | 39 (7.0%) | 24 (6.4%) |
| 12:00 PM to 3:59 PM | 29 (5.2%) | 11 (2.9%) |
| 4:00 PM to 11:59 PM | 0 (0.0%) | 0 (0.0%) |
| Total | 554 (100.0%) | 374 (100.0%) |
Housing Occupancy in Clinton
Occupancy by Ownership in Clinton
Of the total 831 dwellings in Clinton, owner-occupied units account for 481 (57.9%), while renter-occupied units make up 350 (42.1%).
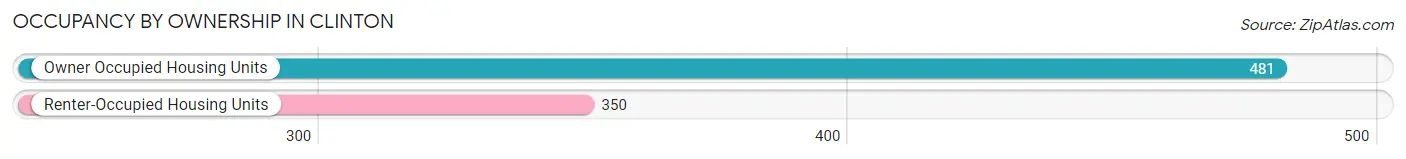
| Occupancy | # Housing Units | % Housing Units |
| Owner Occupied Housing Units | 481 | 57.9% |
| Renter-Occupied Housing Units | 350 | 42.1% |
| Total Occupied Housing Units | 831 | 100.0% |
Occupancy by Household Size in Clinton
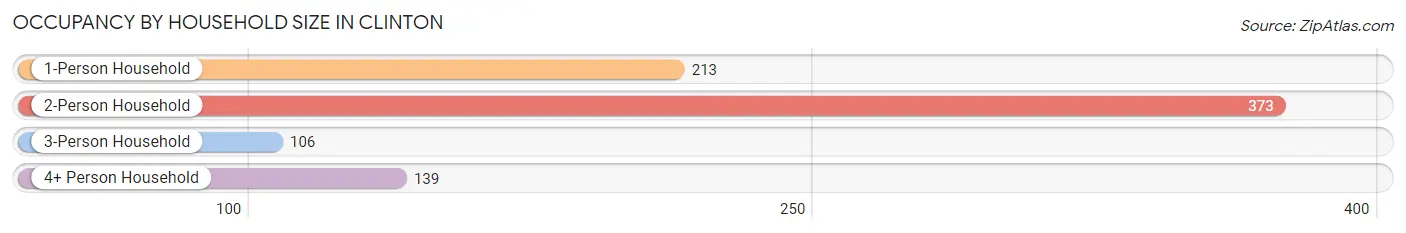
| Household Size | # Housing Units | % Housing Units |
| 1-Person Household | 213 | 25.6% |
| 2-Person Household | 373 | 44.9% |
| 3-Person Household | 106 | 12.8% |
| 4+ Person Household | 139 | 16.7% |
| Total Housing Units | 831 | 100.0% |
Occupancy by Ownership by Household Size in Clinton
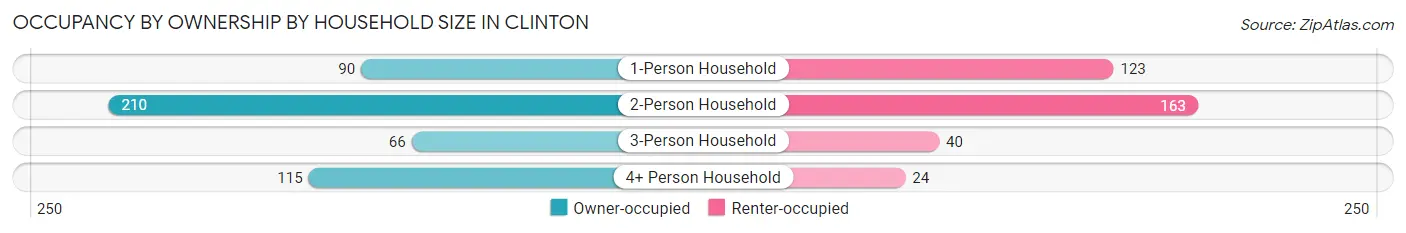
| Household Size | Owner-occupied | Renter-occupied |
| 1-Person Household | 90 (42.2%) | 123 (57.8%) |
| 2-Person Household | 210 (56.3%) | 163 (43.7%) |
| 3-Person Household | 66 (62.3%) | 40 (37.7%) |
| 4+ Person Household | 115 (82.7%) | 24 (17.3%) |
| Total Housing Units | 481 (57.9%) | 350 (42.1%) |
Occupancy by Educational Attainment in Clinton
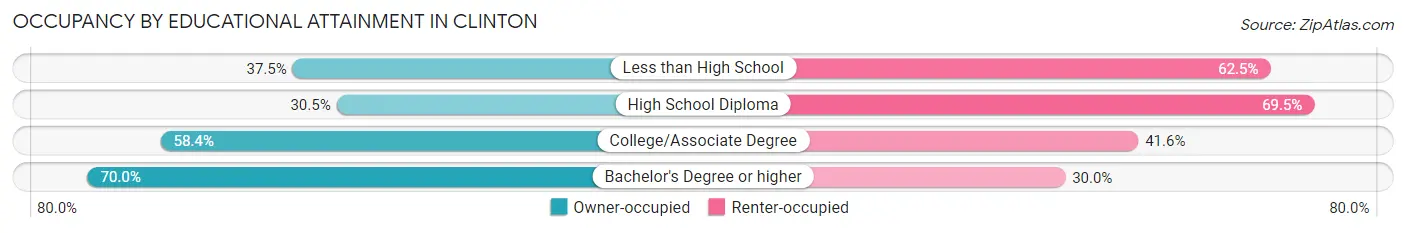
| Household Size | Owner-occupied | Renter-occupied |
| Less than High School | 6 (37.5%) | 10 (62.5%) |
| High School Diploma | 58 (30.5%) | 132 (69.5%) |
| College/Associate Degree | 104 (58.4%) | 74 (41.6%) |
| Bachelor's Degree or higher | 313 (70.0%) | 134 (30.0%) |
Occupancy by Age of Householder in Clinton
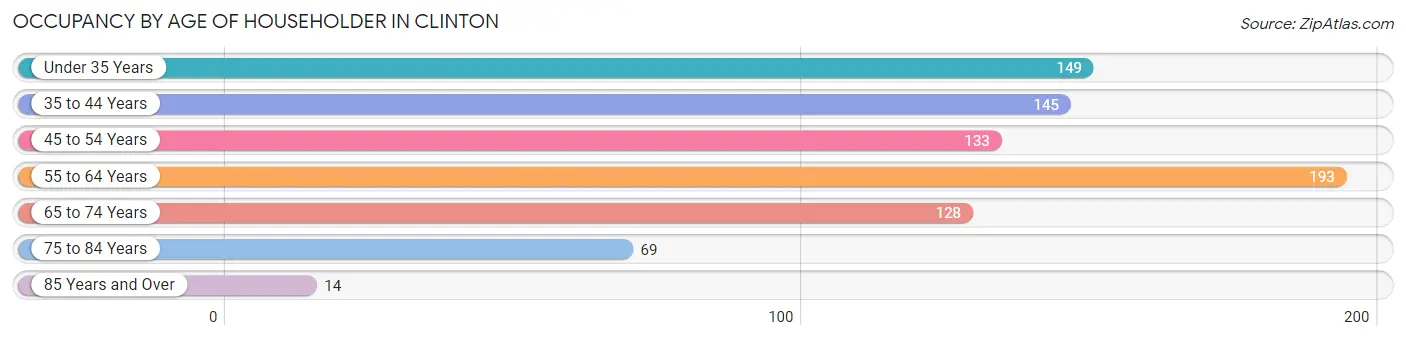
| Age Bracket | # Households | % Households |
| Under 35 Years | 149 | 17.9% |
| 35 to 44 Years | 145 | 17.4% |
| 45 to 54 Years | 133 | 16.0% |
| 55 to 64 Years | 193 | 23.2% |
| 65 to 74 Years | 128 | 15.4% |
| 75 to 84 Years | 69 | 8.3% |
| 85 Years and Over | 14 | 1.7% |
| Total | 831 | 100.0% |
Housing Finances in Clinton
Median Income by Occupancy in Clinton
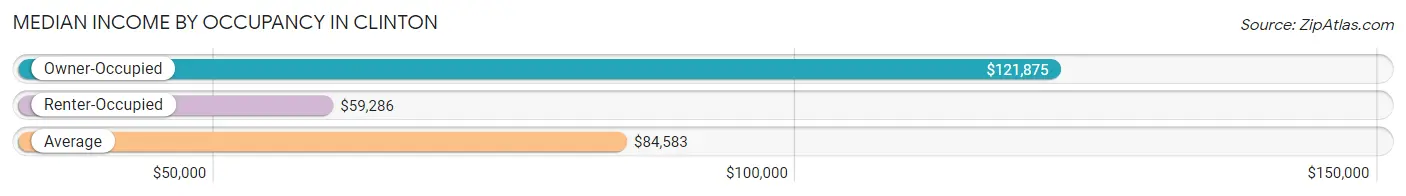
| Occupancy Type | # Households | Median Income |
| Owner-Occupied | 481 (57.9%) | $121,875 |
| Renter-Occupied | 350 (42.1%) | $59,286 |
| Average | 831 (100.0%) | $84,583 |
Occupancy by Householder Income Bracket in Clinton
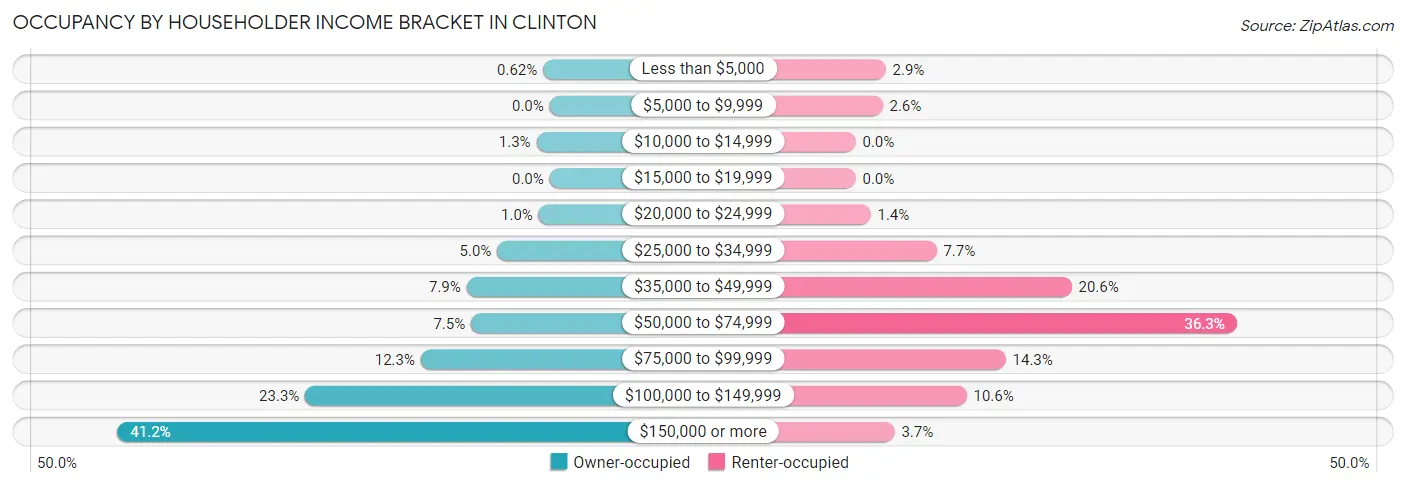
| Income Bracket | Owner-occupied | Renter-occupied |
| Less than $5,000 | 3 (0.6%) | 10 (2.9%) |
| $5,000 to $9,999 | 0 (0.0%) | 9 (2.6%) |
| $10,000 to $14,999 | 6 (1.3%) | 0 (0.0%) |
| $15,000 to $19,999 | 0 (0.0%) | 0 (0.0%) |
| $20,000 to $24,999 | 5 (1.0%) | 5 (1.4%) |
| $25,000 to $34,999 | 24 (5.0%) | 27 (7.7%) |
| $35,000 to $49,999 | 38 (7.9%) | 72 (20.6%) |
| $50,000 to $74,999 | 36 (7.5%) | 127 (36.3%) |
| $75,000 to $99,999 | 59 (12.3%) | 50 (14.3%) |
| $100,000 to $149,999 | 112 (23.3%) | 37 (10.6%) |
| $150,000 or more | 198 (41.2%) | 13 (3.7%) |
| Total | 481 (100.0%) | 350 (100.0%) |
Monthly Housing Cost Tiers in Clinton
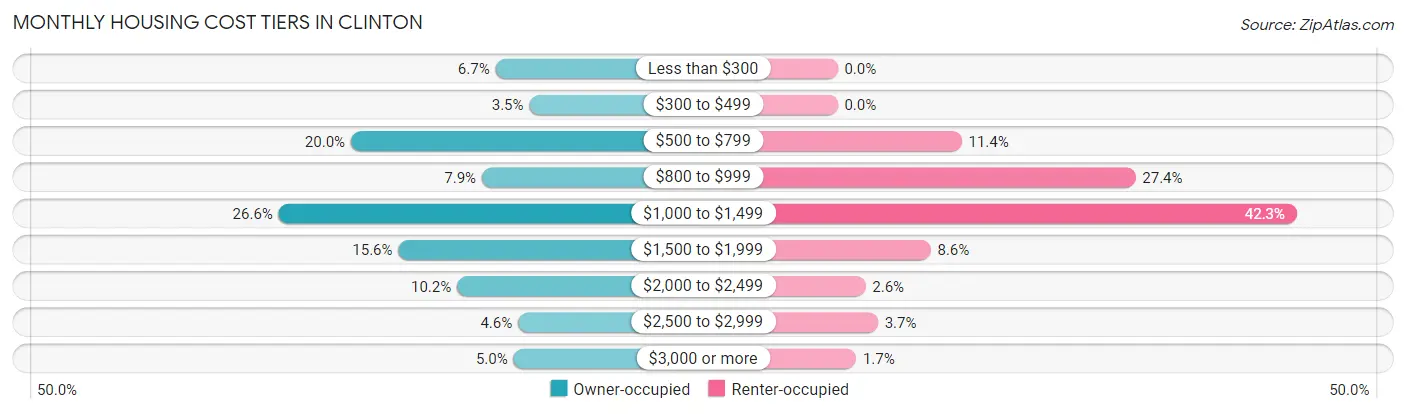
| Monthly Cost | Owner-occupied | Renter-occupied |
| Less than $300 | 32 (6.7%) | 0 (0.0%) |
| $300 to $499 | 17 (3.5%) | 0 (0.0%) |
| $500 to $799 | 96 (20.0%) | 40 (11.4%) |
| $800 to $999 | 38 (7.9%) | 96 (27.4%) |
| $1,000 to $1,499 | 128 (26.6%) | 148 (42.3%) |
| $1,500 to $1,999 | 75 (15.6%) | 30 (8.6%) |
| $2,000 to $2,499 | 49 (10.2%) | 9 (2.6%) |
| $2,500 to $2,999 | 22 (4.6%) | 13 (3.7%) |
| $3,000 or more | 24 (5.0%) | 6 (1.7%) |
| Total | 481 (100.0%) | 350 (100.0%) |
Physical Housing Characteristics in Clinton
Housing Structures in Clinton
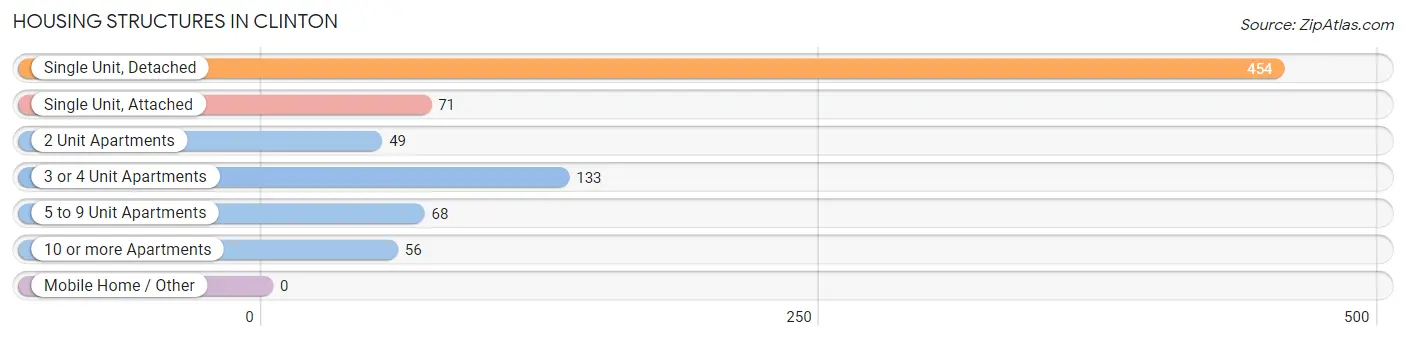
| Structure Type | # Housing Units | % Housing Units |
| Single Unit, Detached | 454 | 54.6% |
| Single Unit, Attached | 71 | 8.5% |
| 2 Unit Apartments | 49 | 5.9% |
| 3 or 4 Unit Apartments | 133 | 16.0% |
| 5 to 9 Unit Apartments | 68 | 8.2% |
| 10 or more Apartments | 56 | 6.7% |
| Mobile Home / Other | 0 | 0.0% |
| Total | 831 | 100.0% |
Housing Structures by Occupancy in Clinton
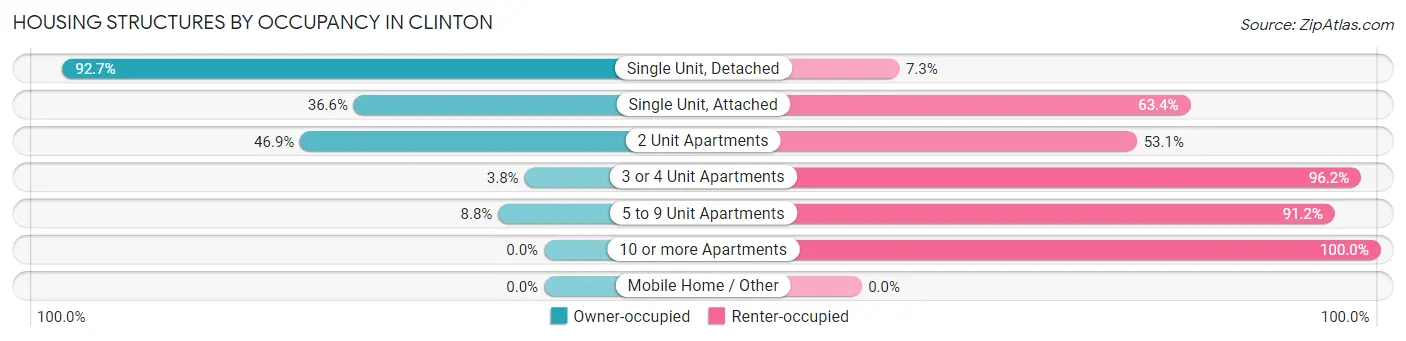
| Structure Type | Owner-occupied | Renter-occupied |
| Single Unit, Detached | 421 (92.7%) | 33 (7.3%) |
| Single Unit, Attached | 26 (36.6%) | 45 (63.4%) |
| 2 Unit Apartments | 23 (46.9%) | 26 (53.1%) |
| 3 or 4 Unit Apartments | 5 (3.8%) | 128 (96.2%) |
| 5 to 9 Unit Apartments | 6 (8.8%) | 62 (91.2%) |
| 10 or more Apartments | 0 (0.0%) | 56 (100.0%) |
| Mobile Home / Other | 0 (0.0%) | 0 (0.0%) |
| Total | 481 (57.9%) | 350 (42.1%) |
Housing Structures by Number of Rooms in Clinton
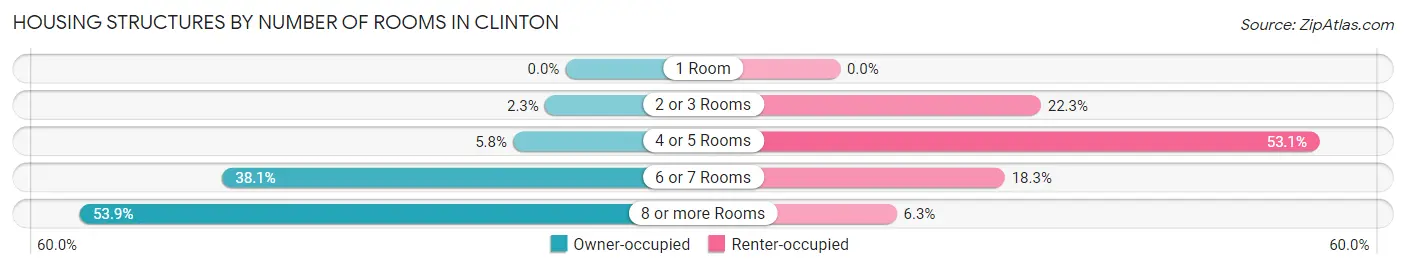
| Number of Rooms | Owner-occupied | Renter-occupied |
| 1 Room | 0 (0.0%) | 0 (0.0%) |
| 2 or 3 Rooms | 11 (2.3%) | 78 (22.3%) |
| 4 or 5 Rooms | 28 (5.8%) | 186 (53.1%) |
| 6 or 7 Rooms | 183 (38.1%) | 64 (18.3%) |
| 8 or more Rooms | 259 (53.8%) | 22 (6.3%) |
| Total | 481 (100.0%) | 350 (100.0%) |
Housing Structure by Heating Type in Clinton
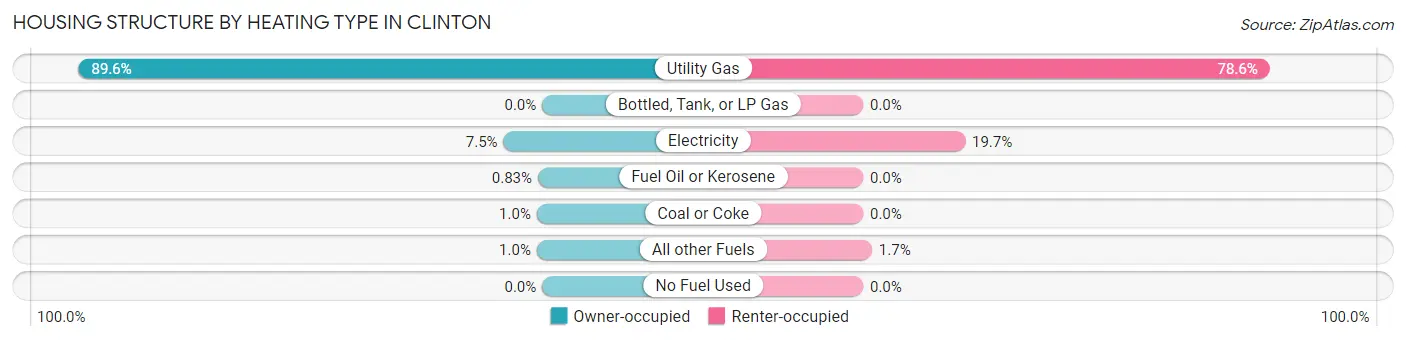
| Heating Type | Owner-occupied | Renter-occupied |
| Utility Gas | 431 (89.6%) | 275 (78.6%) |
| Bottled, Tank, or LP Gas | 0 (0.0%) | 0 (0.0%) |
| Electricity | 36 (7.5%) | 69 (19.7%) |
| Fuel Oil or Kerosene | 4 (0.8%) | 0 (0.0%) |
| Coal or Coke | 5 (1.0%) | 0 (0.0%) |
| All other Fuels | 5 (1.0%) | 6 (1.7%) |
| No Fuel Used | 0 (0.0%) | 0 (0.0%) |
| Total | 481 (100.0%) | 350 (100.0%) |
Household Vehicle Usage in Clinton
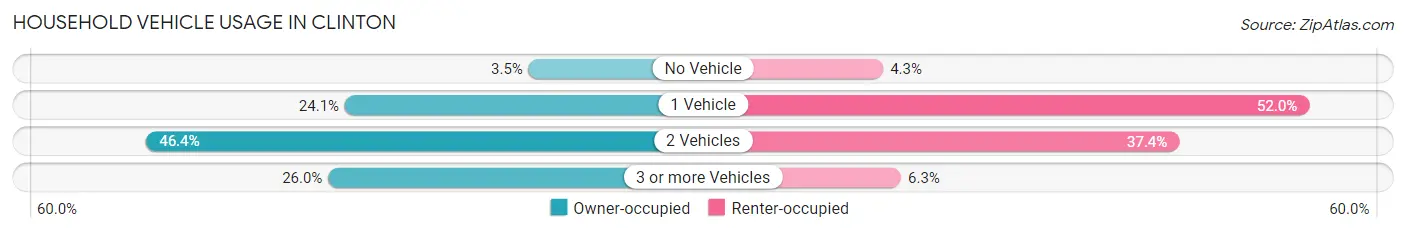
| Vehicles per Household | Owner-occupied | Renter-occupied |
| No Vehicle | 17 (3.5%) | 15 (4.3%) |
| 1 Vehicle | 116 (24.1%) | 182 (52.0%) |
| 2 Vehicles | 223 (46.4%) | 131 (37.4%) |
| 3 or more Vehicles | 125 (26.0%) | 22 (6.3%) |
| Total | 481 (100.0%) | 350 (100.0%) |
Real Estate & Mortgages in Clinton
Real Estate and Mortgage Overview in Clinton
| Characteristic | Without Mortgage | With Mortgage |
| Housing Units | 262 | 219 |
| Median Property Value | $234,400 | $251,600 |
| Median Household Income | $122,500 | $82 |
| Monthly Housing Costs | $961 | $24 |
| Real Estate Taxes | $6,804 | $24 |
Property Value by Mortgage Status in Clinton
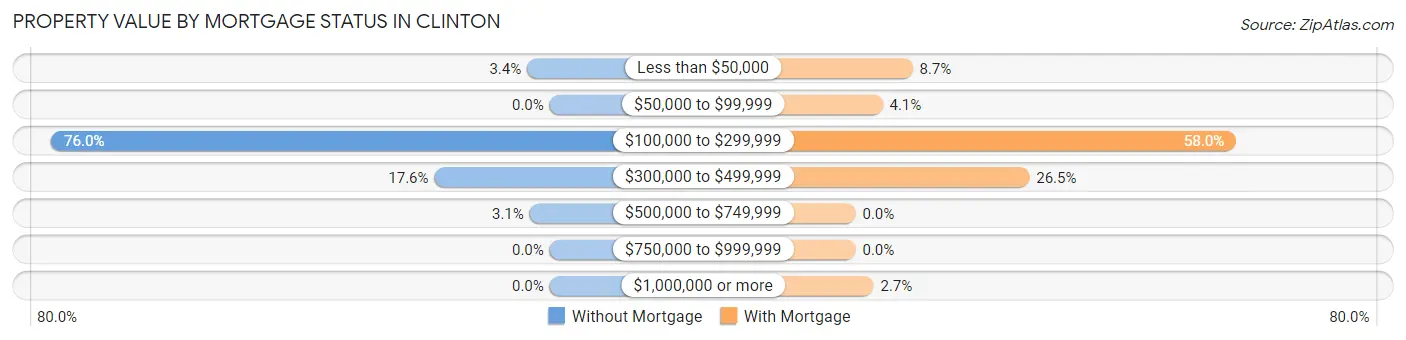
| Property Value | Without Mortgage | With Mortgage |
| Less than $50,000 | 9 (3.4%) | 19 (8.7%) |
| $50,000 to $99,999 | 0 (0.0%) | 9 (4.1%) |
| $100,000 to $299,999 | 199 (75.9%) | 127 (58.0%) |
| $300,000 to $499,999 | 46 (17.6%) | 58 (26.5%) |
| $500,000 to $749,999 | 8 (3.0%) | 0 (0.0%) |
| $750,000 to $999,999 | 0 (0.0%) | 0 (0.0%) |
| $1,000,000 or more | 0 (0.0%) | 6 (2.7%) |
| Total | 262 (100.0%) | 219 (100.0%) |
Household Income by Mortgage Status in Clinton
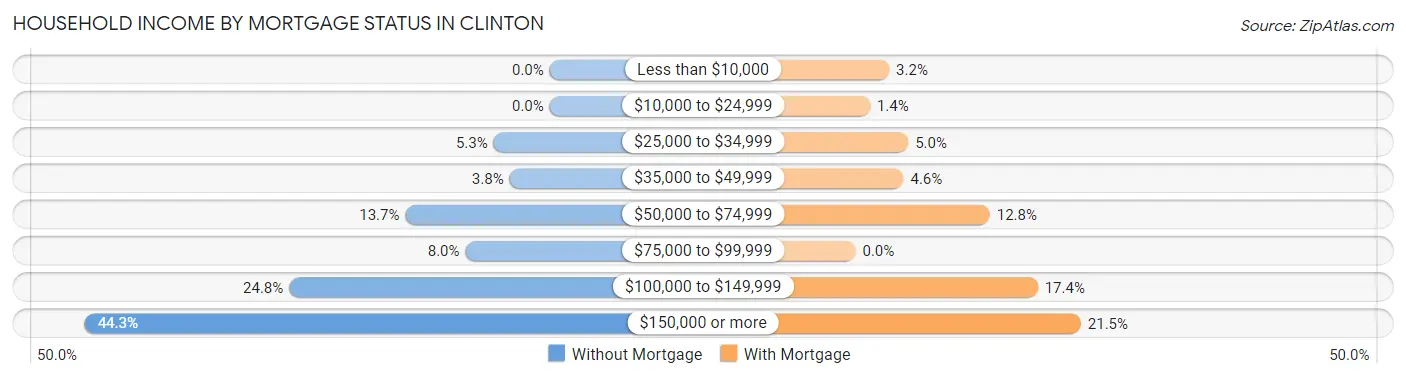
| Household Income | Without Mortgage | With Mortgage |
| Less than $10,000 | 0 (0.0%) | 7 (3.2%) |
| $10,000 to $24,999 | 0 (0.0%) | 3 (1.4%) |
| $25,000 to $34,999 | 14 (5.3%) | 11 (5.0%) |
| $35,000 to $49,999 | 10 (3.8%) | 10 (4.6%) |
| $50,000 to $74,999 | 36 (13.7%) | 28 (12.8%) |
| $75,000 to $99,999 | 21 (8.0%) | 0 (0.0%) |
| $100,000 to $149,999 | 65 (24.8%) | 38 (17.3%) |
| $150,000 or more | 116 (44.3%) | 47 (21.5%) |
| Total | 262 (100.0%) | 219 (100.0%) |
Property Value to Household Income Ratio in Clinton
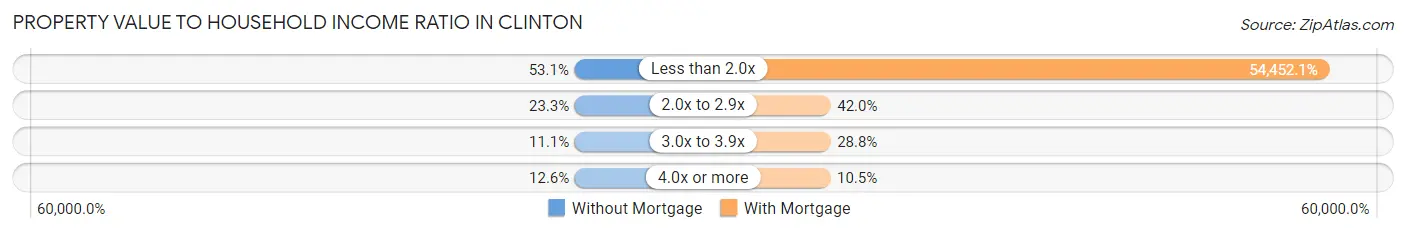
| Value-to-Income Ratio | Without Mortgage | With Mortgage |
| Less than 2.0x | 139 (53.0%) | 119,250 (54,452.0%) |
| 2.0x to 2.9x | 61 (23.3%) | 92 (42.0%) |
| 3.0x to 3.9x | 29 (11.1%) | 63 (28.8%) |
| 4.0x or more | 33 (12.6%) | 23 (10.5%) |
| Total | 262 (100.0%) | 219 (100.0%) |
Real Estate Taxes by Mortgage Status in Clinton
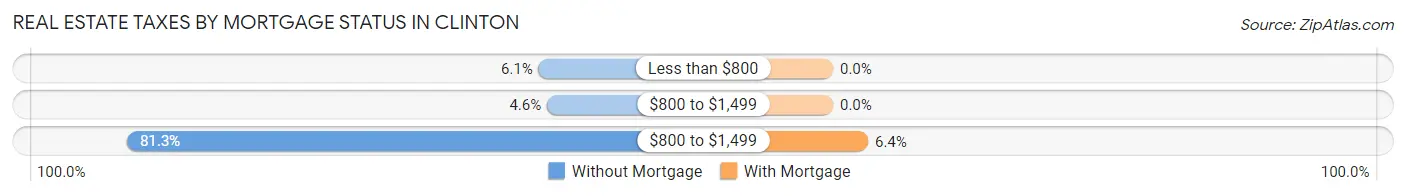
| Property Taxes | Without Mortgage | With Mortgage |
| Less than $800 | 16 (6.1%) | 0 (0.0%) |
| $800 to $1,499 | 12 (4.6%) | 0 (0.0%) |
| $800 to $1,499 | 213 (81.3%) | 14 (6.4%) |
| Total | 262 (100.0%) | 219 (100.0%) |
Health & Disability in Clinton
Health Insurance Coverage by Age in Clinton
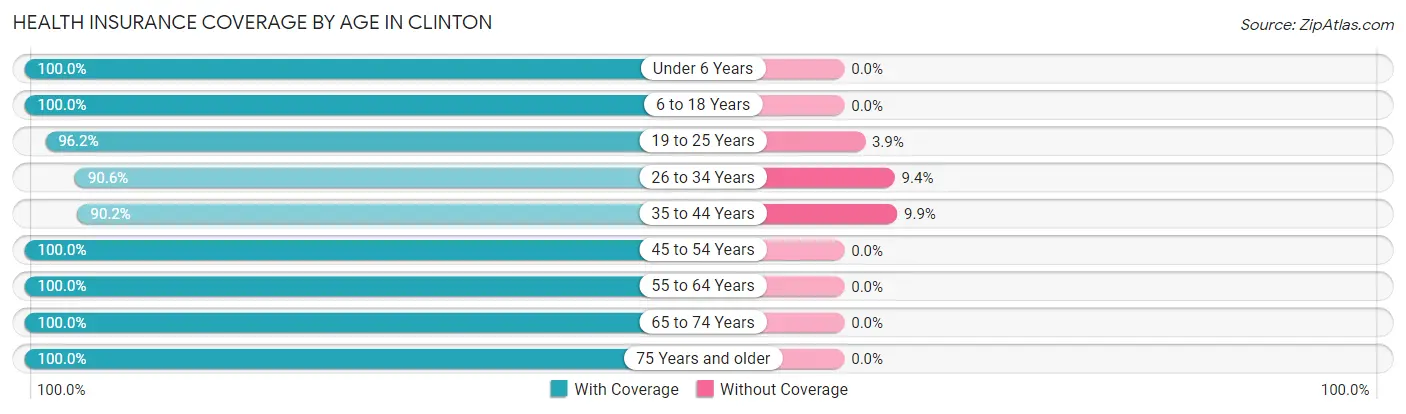
| Age Bracket | With Coverage | Without Coverage |
| Under 6 Years | 49 (100.0%) | 0 (0.0%) |
| 6 to 18 Years | 308 (100.0%) | 0 (0.0%) |
| 19 to 25 Years | 150 (96.2%) | 6 (3.8%) |
| 26 to 34 Years | 164 (90.6%) | 17 (9.4%) |
| 35 to 44 Years | 238 (90.1%) | 26 (9.9%) |
| 45 to 54 Years | 233 (100.0%) | 0 (0.0%) |
| 55 to 64 Years | 341 (100.0%) | 0 (0.0%) |
| 65 to 74 Years | 241 (100.0%) | 0 (0.0%) |
| 75 Years and older | 119 (100.0%) | 0 (0.0%) |
| Total | 1,843 (97.4%) | 49 (2.6%) |
Health Insurance Coverage by Citizenship Status in Clinton
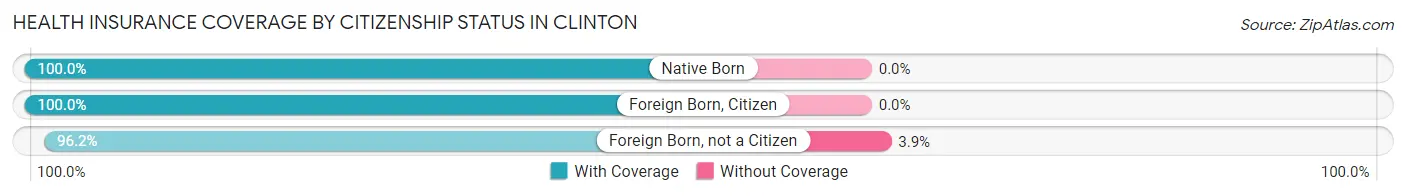
| Citizenship Status | With Coverage | Without Coverage |
| Native Born | 49 (100.0%) | 0 (0.0%) |
| Foreign Born, Citizen | 308 (100.0%) | 0 (0.0%) |
| Foreign Born, not a Citizen | 150 (96.2%) | 6 (3.8%) |
Health Insurance Coverage by Household Income in Clinton
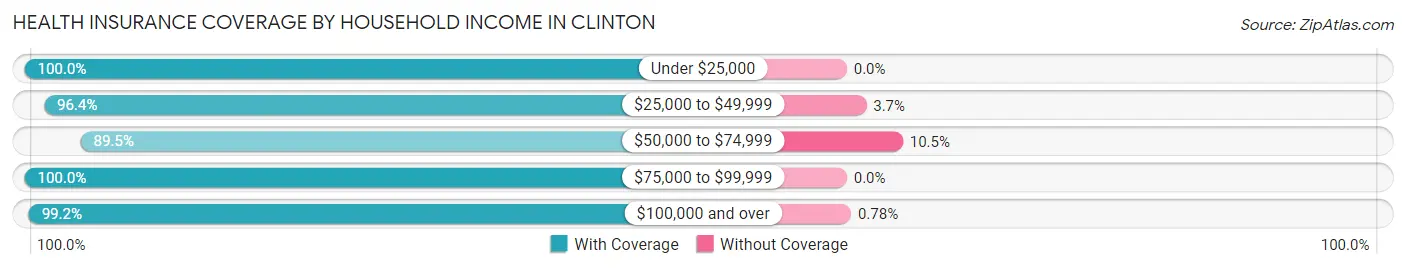
| Household Income | With Coverage | Without Coverage |
| Under $25,000 | 41 (100.0%) | 0 (0.0%) |
| $25,000 to $49,999 | 290 (96.4%) | 11 (3.6%) |
| $50,000 to $74,999 | 256 (89.5%) | 30 (10.5%) |
| $75,000 to $99,999 | 231 (100.0%) | 0 (0.0%) |
| $100,000 and over | 1,020 (99.2%) | 8 (0.8%) |
Public vs Private Health Insurance Coverage by Age in Clinton
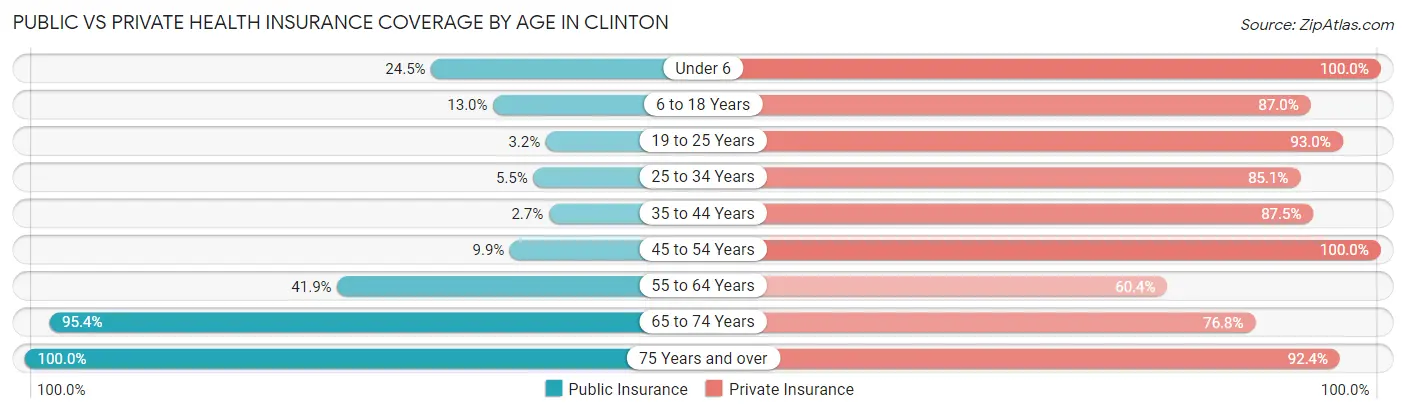
| Age Bracket | Public Insurance | Private Insurance |
| Under 6 | 12 (24.5%) | 49 (100.0%) |
| 6 to 18 Years | 40 (13.0%) | 268 (87.0%) |
| 19 to 25 Years | 5 (3.2%) | 145 (92.9%) |
| 25 to 34 Years | 10 (5.5%) | 154 (85.1%) |
| 35 to 44 Years | 7 (2.6%) | 231 (87.5%) |
| 45 to 54 Years | 23 (9.9%) | 233 (100.0%) |
| 55 to 64 Years | 143 (41.9%) | 206 (60.4%) |
| 65 to 74 Years | 230 (95.4%) | 185 (76.8%) |
| 75 Years and over | 119 (100.0%) | 110 (92.4%) |
| Total | 589 (31.1%) | 1,581 (83.6%) |
Disability Status by Sex by Age in Clinton
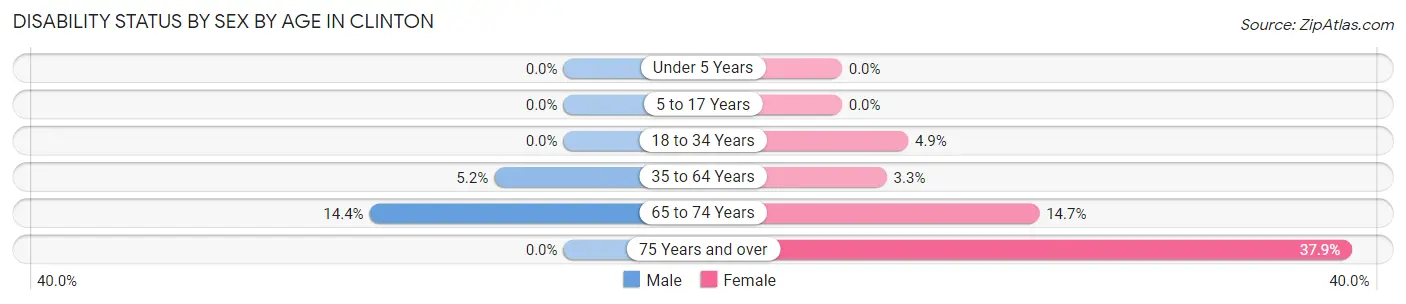
| Age Bracket | Male | Female |
| Under 5 Years | 0 (0.0%) | 0 (0.0%) |
| 5 to 17 Years | 0 (0.0%) | 0 (0.0%) |
| 18 to 34 Years | 0 (0.0%) | 9 (4.9%) |
| 35 to 64 Years | 20 (5.1%) | 15 (3.3%) |
| 65 to 74 Years | 18 (14.4%) | 17 (14.7%) |
| 75 Years and over | 0 (0.0%) | 25 (37.9%) |
Disability Class by Sex by Age in Clinton
Disability Class: Hearing Difficulty
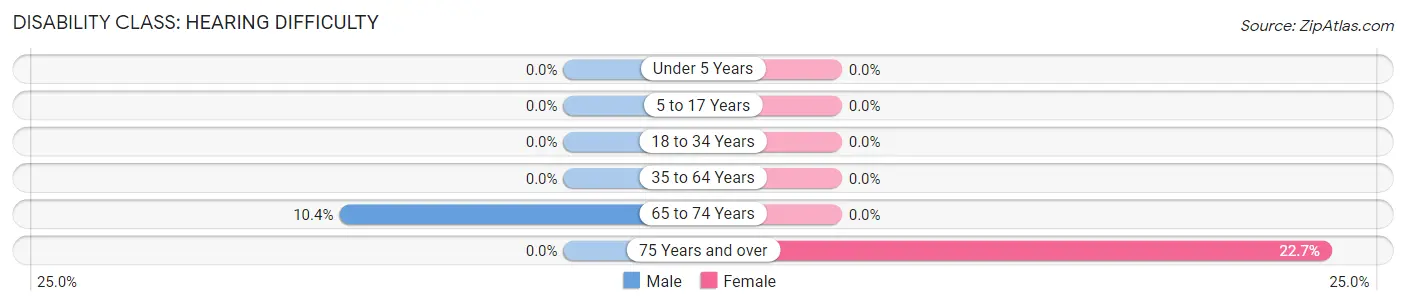
| Age Bracket | Male | Female |
| Under 5 Years | 0 (0.0%) | 0 (0.0%) |
| 5 to 17 Years | 0 (0.0%) | 0 (0.0%) |
| 18 to 34 Years | 0 (0.0%) | 0 (0.0%) |
| 35 to 64 Years | 0 (0.0%) | 0 (0.0%) |
| 65 to 74 Years | 13 (10.4%) | 0 (0.0%) |
| 75 Years and over | 0 (0.0%) | 15 (22.7%) |
Disability Class: Vision Difficulty
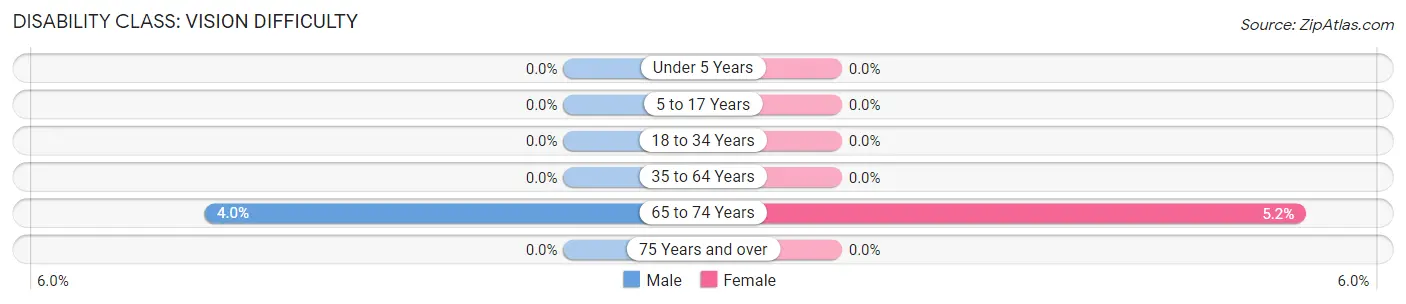
| Age Bracket | Male | Female |
| Under 5 Years | 0 (0.0%) | 0 (0.0%) |
| 5 to 17 Years | 0 (0.0%) | 0 (0.0%) |
| 18 to 34 Years | 0 (0.0%) | 0 (0.0%) |
| 35 to 64 Years | 0 (0.0%) | 0 (0.0%) |
| 65 to 74 Years | 5 (4.0%) | 6 (5.2%) |
| 75 Years and over | 0 (0.0%) | 0 (0.0%) |
Disability Class: Cognitive Difficulty
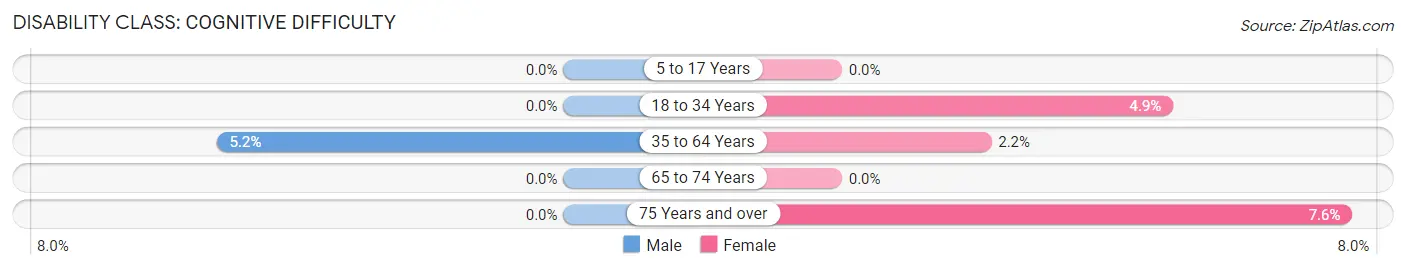
| Age Bracket | Male | Female |
| 5 to 17 Years | 0 (0.0%) | 0 (0.0%) |
| 18 to 34 Years | 0 (0.0%) | 9 (4.9%) |
| 35 to 64 Years | 20 (5.1%) | 10 (2.2%) |
| 65 to 74 Years | 0 (0.0%) | 0 (0.0%) |
| 75 Years and over | 0 (0.0%) | 5 (7.6%) |
Disability Class: Ambulatory Difficulty
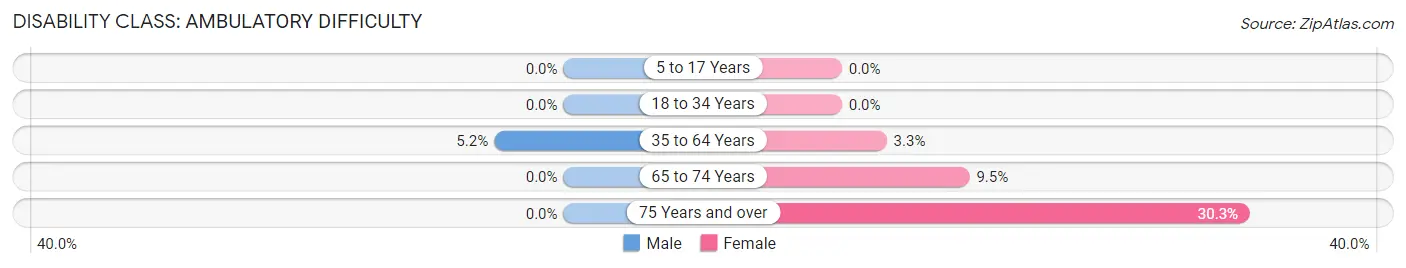
| Age Bracket | Male | Female |
| 5 to 17 Years | 0 (0.0%) | 0 (0.0%) |
| 18 to 34 Years | 0 (0.0%) | 0 (0.0%) |
| 35 to 64 Years | 20 (5.1%) | 15 (3.3%) |
| 65 to 74 Years | 0 (0.0%) | 11 (9.5%) |
| 75 Years and over | 0 (0.0%) | 20 (30.3%) |
Disability Class: Self-Care Difficulty
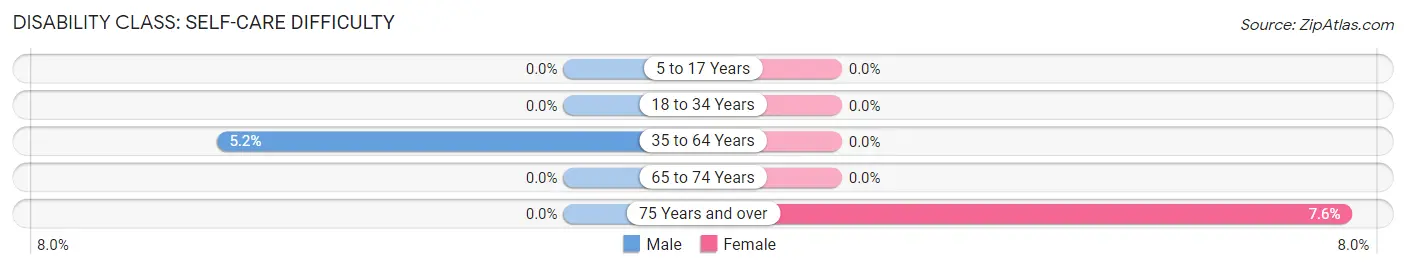
| Age Bracket | Male | Female |
| 5 to 17 Years | 0 (0.0%) | 0 (0.0%) |
| 18 to 34 Years | 0 (0.0%) | 0 (0.0%) |
| 35 to 64 Years | 20 (5.1%) | 0 (0.0%) |
| 65 to 74 Years | 0 (0.0%) | 0 (0.0%) |
| 75 Years and over | 0 (0.0%) | 5 (7.6%) |
Technology Access in Clinton
Computing Device Access in Clinton
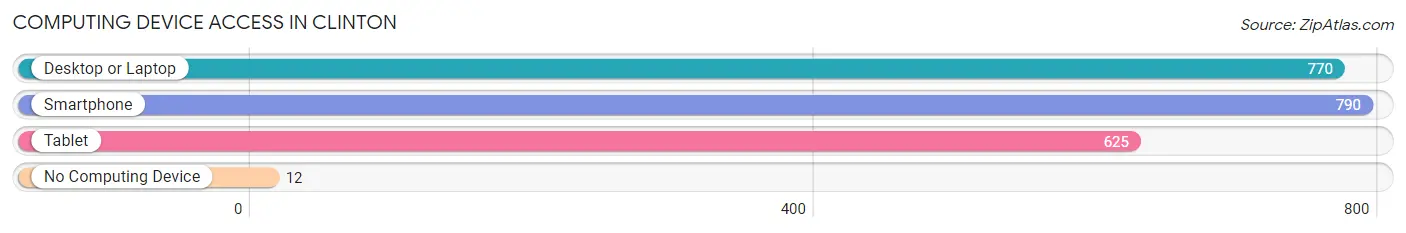
| Device Type | # Households | % Households |
| Desktop or Laptop | 770 | 92.7% |
| Smartphone | 790 | 95.1% |
| Tablet | 625 | 75.2% |
| No Computing Device | 12 | 1.4% |
| Total | 831 | 100.0% |
Internet Access in Clinton
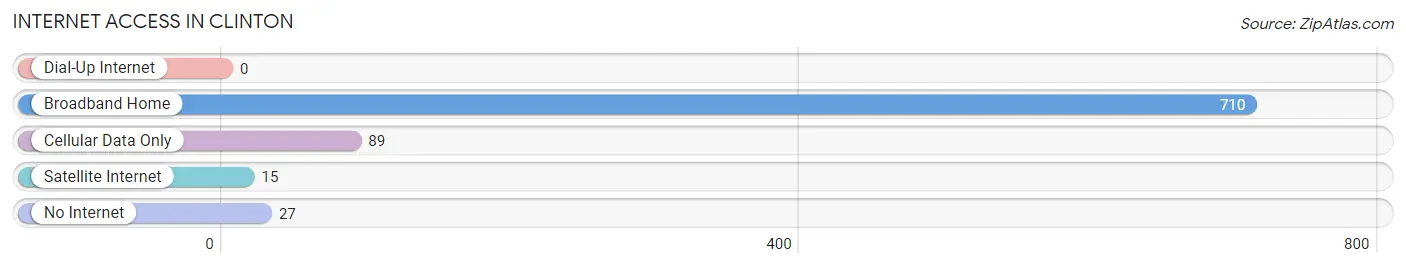
| Internet Type | # Households | % Households |
| Dial-Up Internet | 0 | 0.0% |
| Broadband Home | 710 | 85.4% |
| Cellular Data Only | 89 | 10.7% |
| Satellite Internet | 15 | 1.8% |
| No Internet | 27 | 3.3% |
| Total | 831 | 100.0% |
Clinton Summary
Clinton, New York is a small town located in Oneida County in the state of New York. It is situated on the banks of the Mohawk River and is part of the Utica-Rome Metropolitan Statistical Area. The town was founded in 1787 and was named after George Clinton, the first governor of New York.
History
The area that is now Clinton was originally inhabited by the Mohawk people, who were part of the Iroquois Confederacy. The first European settlers arrived in the area in the late 1700s and the town was officially founded in 1787. The town was named after George Clinton, the first governor of New York.
In the early 1800s, the town was a major center for the production of iron and steel. The Clinton Iron Works was established in 1802 and was one of the largest iron works in the country. The iron works was a major employer in the area and helped to fuel the local economy.
In the late 1800s, the town began to experience a decline in its industrial base. The iron works closed in 1892 and the town began to focus more on agriculture and tourism. The town was also home to a number of resorts and hotels, which attracted visitors from all over the country.
Geography
Clinton is located in Oneida County in the state of New York. It is situated on the banks of the Mohawk River and is part of the Utica-Rome Metropolitan Statistical Area. The town covers an area of 8.2 square miles and has a population of approximately 4,000 people.
The town is located in a rural area and is surrounded by rolling hills and forests. The town is home to a number of parks and recreational areas, including the Clinton Town Beach, which is located on the banks of the Mohawk River.
Economy
The economy of Clinton is largely based on agriculture and tourism. The town is home to a number of farms, which produce a variety of crops, including corn, soybeans, and hay. The town is also home to a number of wineries and breweries, which attract visitors from all over the country.
The town is also home to a number of small businesses, including restaurants, shops, and other services. The town is also home to a number of manufacturing companies, which produce a variety of products, including furniture, clothing, and electronics.
Demographics
The population of Clinton is approximately 4,000 people. The town has a diverse population, with people of various ethnic backgrounds, including African American, Hispanic, and Asian. The median household income in the town is $50,000 and the median home value is $150,000.
The town is served by the Clinton Central School District, which includes two elementary schools, one middle school, and one high school. The town is also home to a number of private schools, including the Clinton Academy and the Clinton Christian Academy.
Conclusion
Clinton, New York is a small town located in Oneida County in the state of New York. It is situated on the banks of the Mohawk River and is part of the Utica-Rome Metropolitan Statistical Area. The town was founded in 1787 and was named after George Clinton, the first governor of New York. The town has a diverse population and is home to a number of small businesses, farms, wineries, and breweries. The town is also home to a number of manufacturing companies, which produce a variety of products. The town is served by the Clinton Central School District and is home to a number of private schools.
Common Questions
What is Per Capita Income in Clinton?
Per Capita income in Clinton is $48,085.
What is the Median Family Income in Clinton?
Median Family Income in Clinton is $106,131.
What is the Median Household income in Clinton?
Median Household Income in Clinton is $84,583.
What is Income or Wage Gap in Clinton?
Income or Wage Gap in Clinton is 34.7%.
Women in Clinton earn 65.3 cents for every dollar earned by a man.
What is Inequality or Gini Index in Clinton?
Inequality or Gini Index in Clinton is 0.39.
What is the Total Population of Clinton?
Total Population of Clinton is 1,928.
What is the Total Male Population of Clinton?
Total Male Population of Clinton is 960.
What is the Total Female Population of Clinton?
Total Female Population of Clinton is 968.
What is the Ratio of Males per 100 Females in Clinton?
There are 99.17 Males per 100 Females in Clinton.
What is the Ratio of Females per 100 Males in Clinton?
There are 100.83 Females per 100 Males in Clinton.
What is the Median Population Age in Clinton?
Median Population Age in Clinton is 44.7 Years.
What is the Average Family Size in Clinton
Average Family Size in Clinton is 2.8 People.
What is the Average Household Size in Clinton
Average Household Size in Clinton is 2.3 People.
How Large is the Labor Force in Clinton?
There are 1,082 People in the Labor Forcein in Clinton.
What is the Percentage of People in the Labor Force in Clinton?
66.0% of People are in the Labor Force in Clinton.
What is the Unemployment Rate in Clinton?
Unemployment Rate in Clinton is 2.4%.